
Abstract
In order to overcome the shortcomings (such as the time–frequency localization and the nonstationary signal analysis ability) of the Fourier transform, time–frequency analysis has been carried out by wavelet packet decomposition and reconstruction according to the actual nonstationary vibration signal from a large equipment located in a large Steel Corporation in this article. The effect of wavelet decomposition on signal denoising and the selection of high-frequency weight coefficients for each layer on signal denoising were analyzed. The nonlinear prediction of the chaotic time series was made by global method, local method, weighted first-order local method, and maximum Lyapunov exponent prediction method correspondingly. It was found the multi-step prediction method is better than other prediction methods.
Introduction
The most common and mature method for signal analysis is Fourier transform. Unfortunately, the Fourier transform is a global transformation, that is, it is either completely in time domain or completely in frequency domain. The signal cannot be analyzed in time–frequency localization simultaneously, and it cannot reveal information about nonstationary signals. But there are lots of nonsteady dynamic signals in engineering vibration, such as the speed down or up process of rotating machinery, friction, equipment foundation loosening, misalignment, crack, rotating stall, oil whirl, and oil whip fault in the operation process of machinery and equipment. The vibration signals are nonstationary; this feature can explain some fault characterization.1–3 Because the statistical characteristics of nonstationary dynamic signals are related to time, the processing of nonstationary signals needs time–frequency analysis. And the whole picture and localization results of nonstationary signals in time and frequency domains should be obtained. Nonstationary signal processing method for engineering vibration generally has the following five types:4–6 piecewise Fourier transform, rotational speed tracking analysis with Hanning window, short-time Fourier transform, Wigner–Ville distribution, wavelet analysis, and Hilbert–Huang transform.
As the vibration of the rolling mill is a very complex problem, it is usually difficult to find the vibration source and the vibration law. Until now, there is no perfect understanding of its vibration mechanism or a satisfactory theoretical system. In production, the vibration is often controlled by experience and test. In the thin slab continuous casting and rolling line of a steel company in China, the vibration of F2, F3, and F4 mills appears in varying degrees, especially in the F3 mill. Due to the severe vibration of the rolling mill, fatigue damage of equipment components has occurred, such as unstable roll transmission or even work roll neck fracture, electrical component damage, F3 top programmable controller damage, F3 main reducer high-speed gear shaft tooth surface peeling, strip steel, and roll surface vibration, which has brought great harm to production. The project team has carried out a large-scale finishing mill. Based on the comprehensive test and theoretical research, this article aims to explore the shape of roller vibration from the signal point of view and then the vibration source.
Wavelet packet decomposition and reconstruction
Given a basic function

where a is the scale factor, b is the translation factor, and
where a, b, and t are continuous variables, and then equation (2) is also called continuous wavelet transform.
Taking

When
The reconstruction function of
Currently, Haar wavelet, Mexican hat wavelet, Morlet wavelet, Daubechies wavelet, and spline wavelet are widely used. Based on practical experience, the Morlet wavelet is widely used in signal representation and classification, and image recognition feature extraction; the Haar wavelet is widely used in image processing and digital watermarking; the Mexican hat wavelet is used for system identification; the spline wavelet is used for material flaw detection; and the Shannon orthogonal basis is used for difference equation solution. Therefore, the Morlet wavelet is used here. Wavelet decomposition only implements decomposition for the low-frequency space step-by-step, and the high-frequency space Wj is no longer decomposed. Comparing
The function
In view of the strong vibration phenomenon of the rolling mill during the rolling of the thin strip, a comprehensive test was carried out on the spot, mainly collecting the vibration acceleration signals of the rollers in the transverse and vertical directions. The sampling frequency of all the measured signals is 512 Hz, which will not be commented on later in this article. Figure 1 is the details signal and power spectrum diagram of the five-layer db3 decomposition of an equipment measured vibration waveform. Figure 2 is the approximation signal. Figure 3 is the time domain waveform and its power spectrum after reconstruction. The amplitude or spectral values in Figure 3 are the regular normalization result. From the details signal in Figure 1 and approximation signal in Figure 2, every 450 sampling points (time interval is about 0.8 s) produces an impact with increasing amplitude. While the details signal d3 (64–32 Hz) showed the gradual process of the signal, the details signal d5 (16–8 Hz) displays the general features of the signal. From the reconstructed signal in Figure 3 and the measured signal, the two are almost identical. So, the wavelet decomposition method is credible.
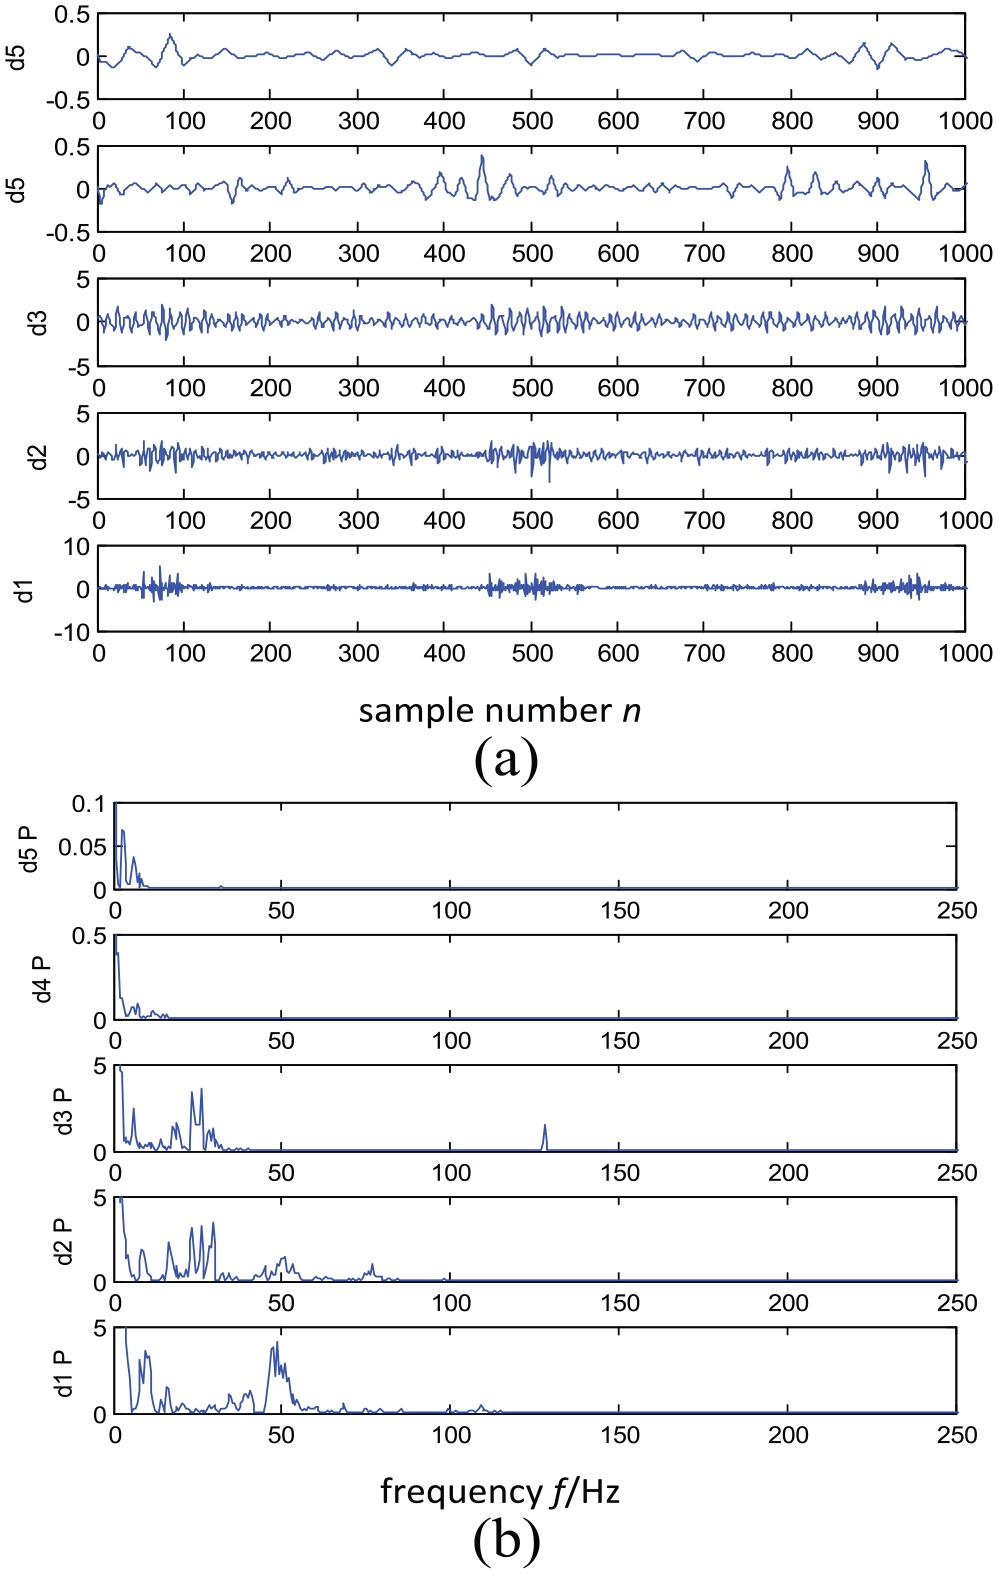
Five-layer db3 decomposition of the details signal and its frequency envelope spectrum of an equipment vibration signal.
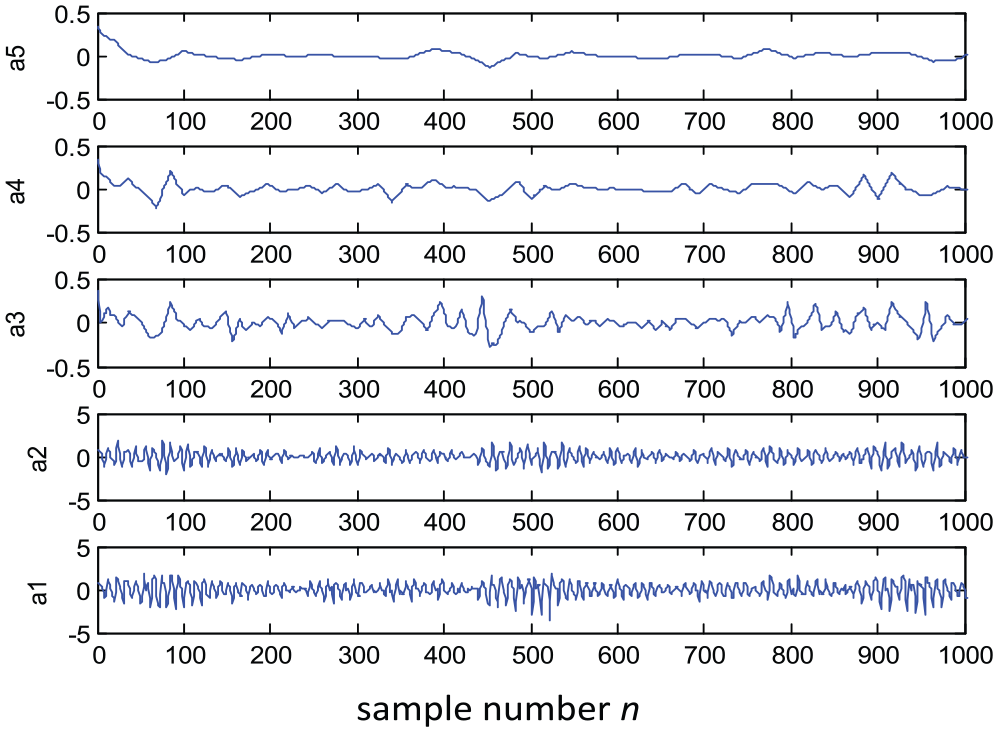
Five-layer db3 decomposition of the vibration signal.

Time domain and power spectrum of the vibration signal after reconstruction.
But it is important to realize that due to the influence of background signal and noise signal, we cannot diagnose rubbing fault directly using wavelet transform processing. And because the rubbing fault signal and the random noise have the broadband frequency domain, we do not know the energy concentrated frequency range of rubbing avoidance signal. So by using the traditional filtering method, we cannot eliminate the noise signal and retain the fault information. But we can use the singular value decomposition method by attractor track matrix of time series reconstruction for eliminating the background signal and extracting the residual signal (noise and rubbing fault signal) and strengthening the fault signal and wavelet transforming the residual signal. The default threshold and given soft threshold denoising methods are used to filter the signal background noise, respectively, and it is found that the given soft threshold denoising method is better.
Nonlinear time series prediction
Prediction is an estimation of a thing or event behavior features or trend; the prediction of time series is defined by its future value and the number of properties according to the past and present value of the time series. Then we can carry out the analysis, prediction, and control of system behavior. Time series prediction of dynamic system can be divided into two stages: the first is to find the initial reference state data using the known data information, identification and optimization of various parameters in the prediction model, and the optimal approximation of the dynamic system evolution, and this process is called model learning stage. The second is to input the analyzed data into prediction model and obtain the prediction value of dynamic systems’ future evolution results, and this process is called data prediction stage. The existing time series prediction methods, according to the initial reference state data prediction model, can be divided into two categories: one is to find the initial reference state from the one-dimensional time series directly, and the other is to reconstruct the phase space of one-dimensional time series and select the initial reference state from phase space prediction model. At present, the main methods used to predict chaotic time series are the global domain method, local method, adding-weight one-rank local-region method, and maximum Lyapunov exponent prediction method.10–14
Local prediction method based on phase space reconstruction
According to phase space attractors, the phase space reconstruction prediction method can be divided into global method and local method. The computation of the global prediction method is complicated, and the prediction accuracy will decline rapidly when choosing high embedding dimension, so the local method is used in this article. And the calculation principle is as follows. Suppose
Compared with the global prediction method, the local method is applicable in most cases. The local prediction method has a very obvious physical interpretation, that is, the evolution law of the adjacent points is consistent in the predictable time step range, so we can describe the center point evolution according to the evolution of neighboring points. According to the different fitting methods of
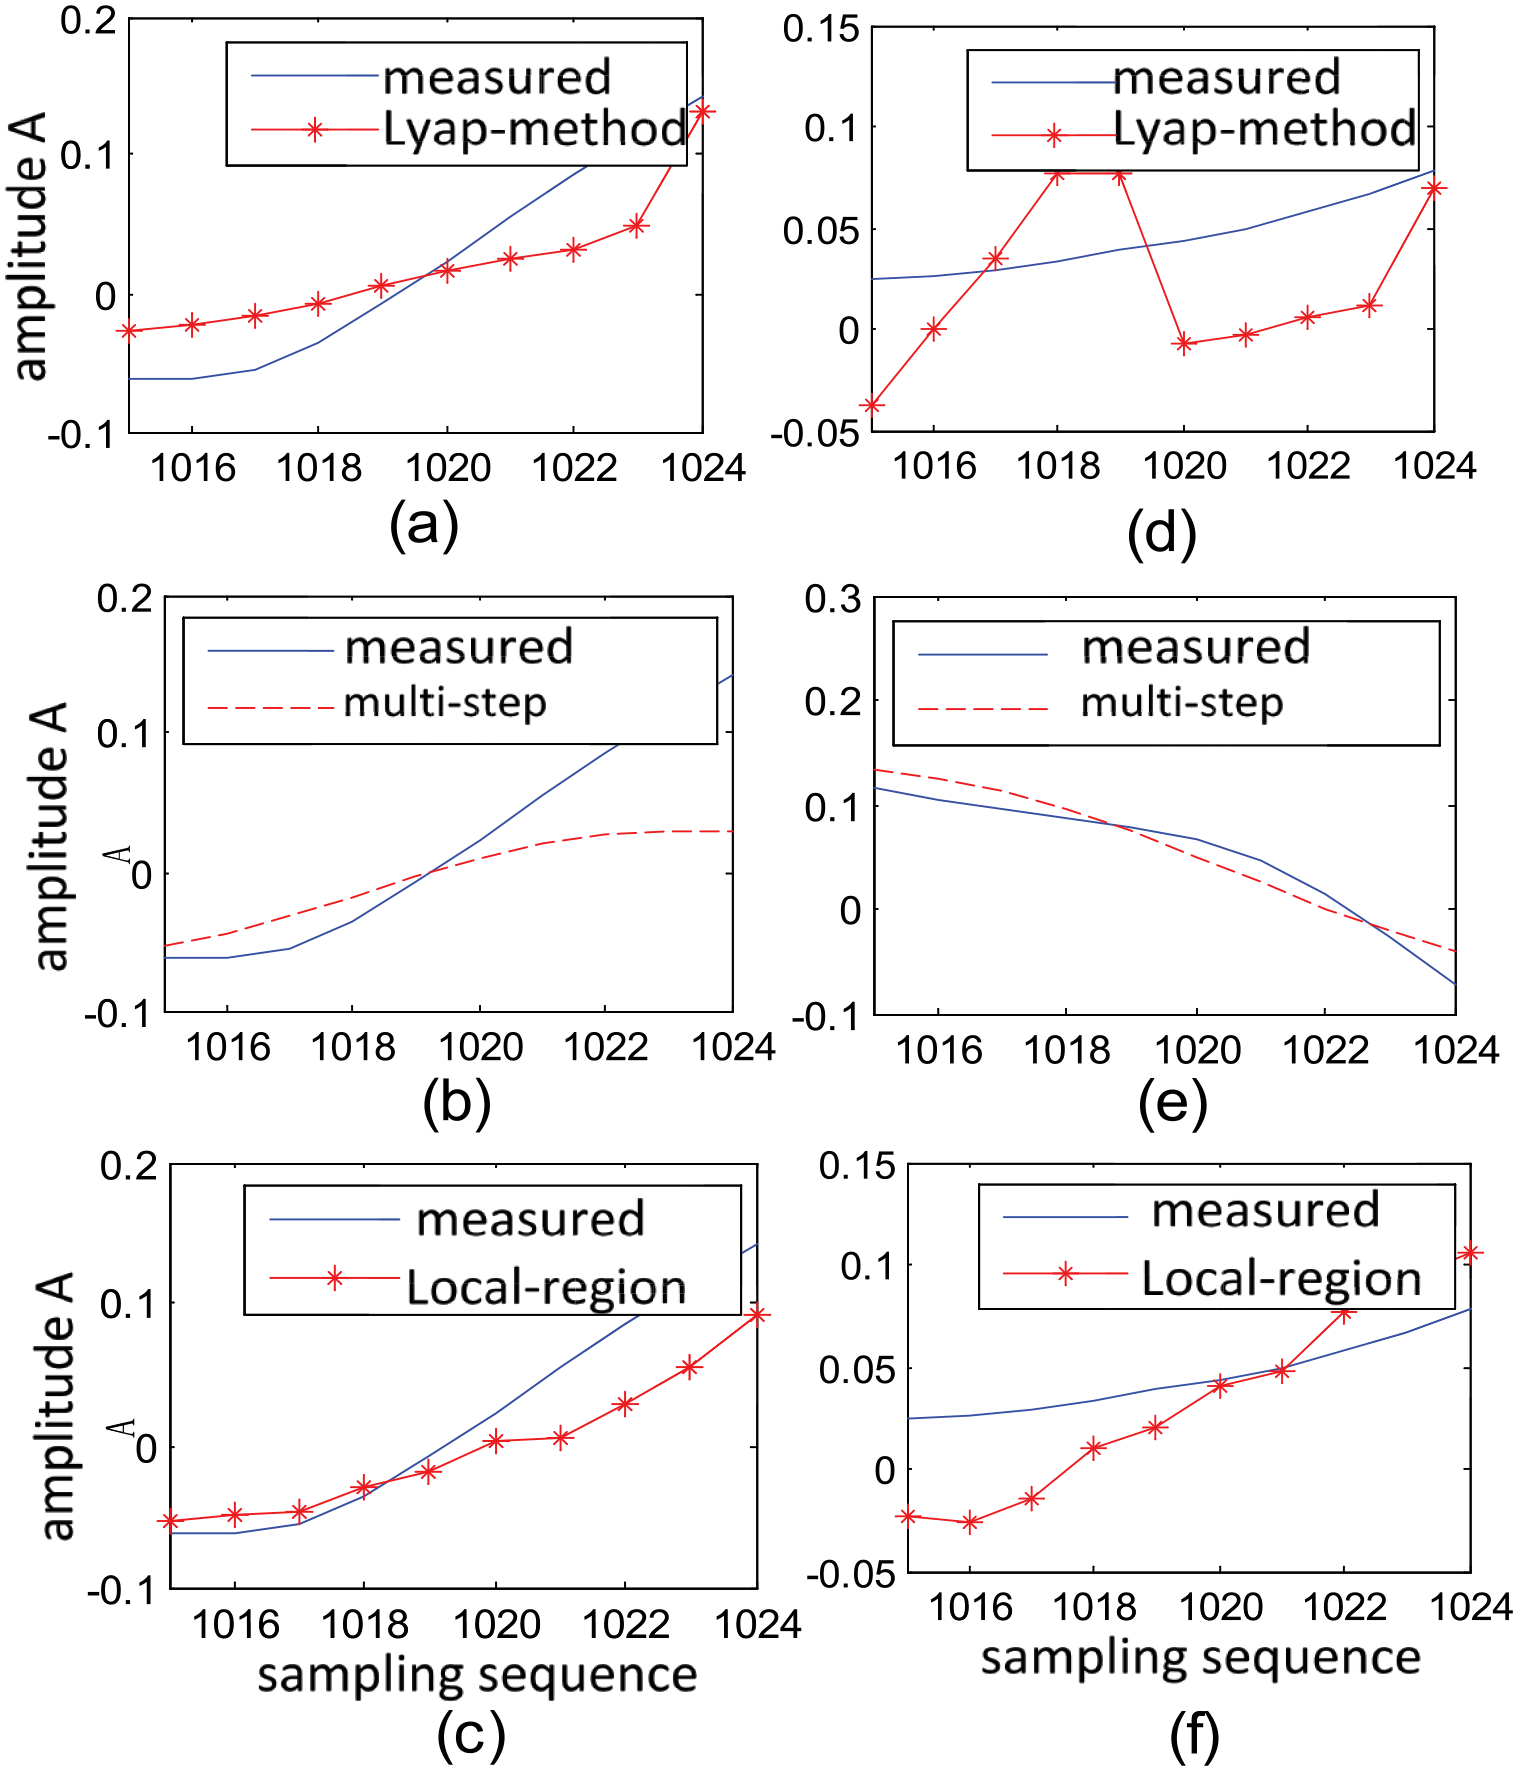
Prediction of strong vibration signal: (a)–(c) horizontal vibration and (d)–(f) vertical vibration.
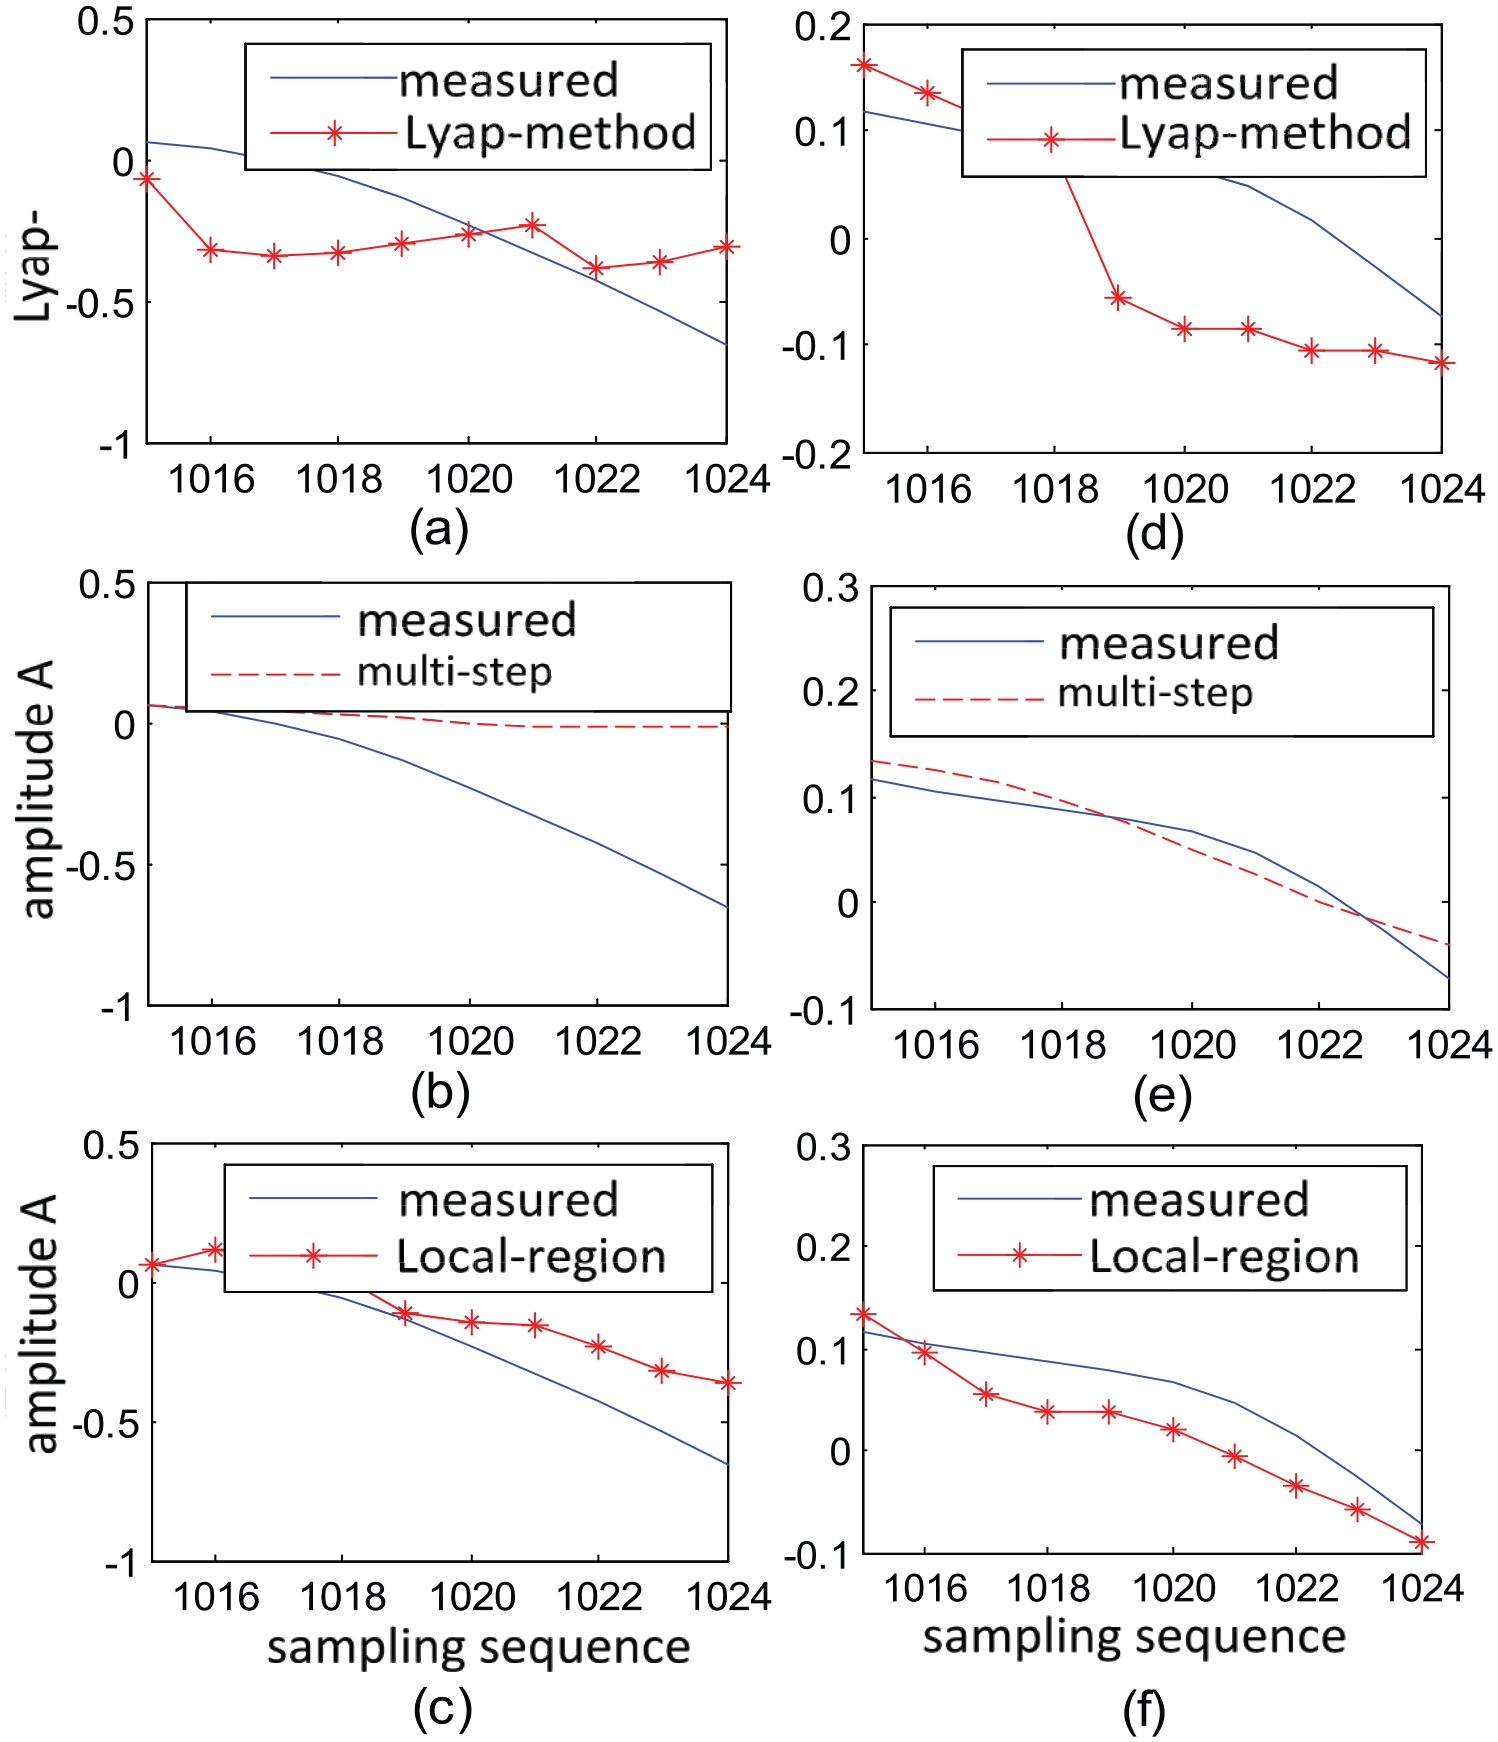
Prediction of slight vibration signal: (a)–(c) horizontal vibration and (d)–(f) vertical vibration.
Prediction method based on maximum Lyapunov exponent
According to the measured vibration signal of rolling mill, it has been determined that it has nonstationary characteristics. In order to develop the rolling mill vibration prediction system in industrial production, it is necessary to study the advantages and disadvantages of various time series methods in rolling mill vibration prediction and make a comparative analysis.
The basic characteristic of chaotic motion is that the motion is very sensitive to initial condition, and the orbits produced by two very close initial values are separated by exponential form. Lyapunov index is a quantitative description of the characteristics of this phenomenon, and it is a very good prediction parameter for the nonlinear system. 15
The basic idea of the maximum Lyapunov exponent prediction method is as follows: suppose

where
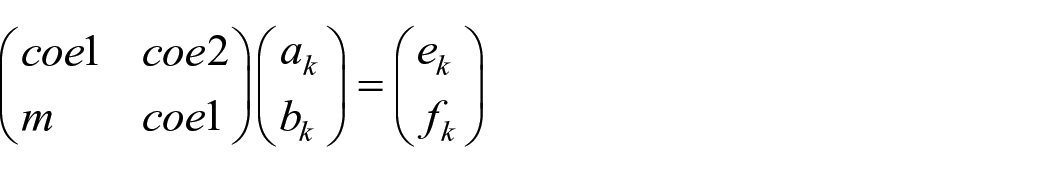
One-step prediction model of weighted first-order local method
For time series

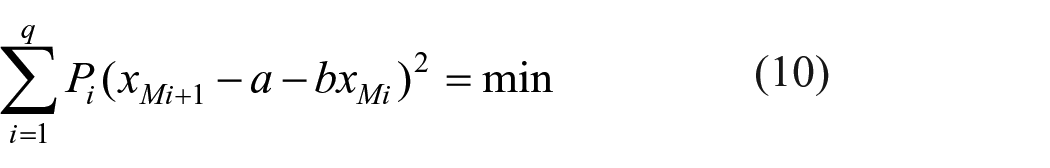
The first-order local linear fitting is as follows

where a and b are the real fitting coefficients;
If the embedding dimension is
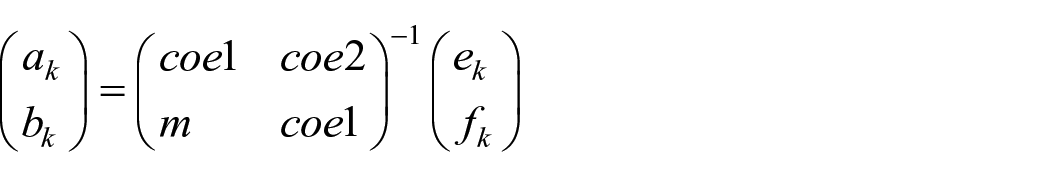
The coefficients a and b can be obtained after solving the equations, and by substituting a and b into one-step prediction formula

where the former (m–1) elements in
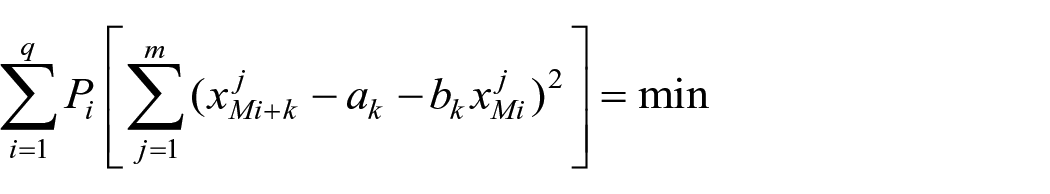
For multi-step prediction, we can use the new information to add the original time sequence and repeat the steps. But the calculation is tremendous, and there is an error accumulation effect. Therefore, the weighted first-order local method of the multi-step prediction model can be used; the essence of this model is that the (m + 1) phase points are mostly similar to the reference point found in the reconstructed phase space. And we can carry out one-step prediction according to the evolution step of these (m + 1) phase points. For the chaotic time series, the evolution law over time of a pair of nearest neighbors in the phase space follows an exponential law as
Suppose the reference vector set of the center point is

According to the weighted least square method
The above formula is regarded as the two-variable function of the unknown
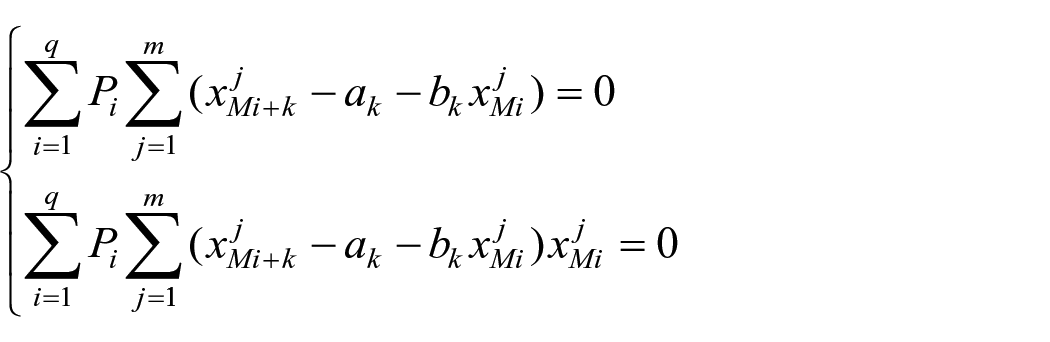
Simplify them as follows
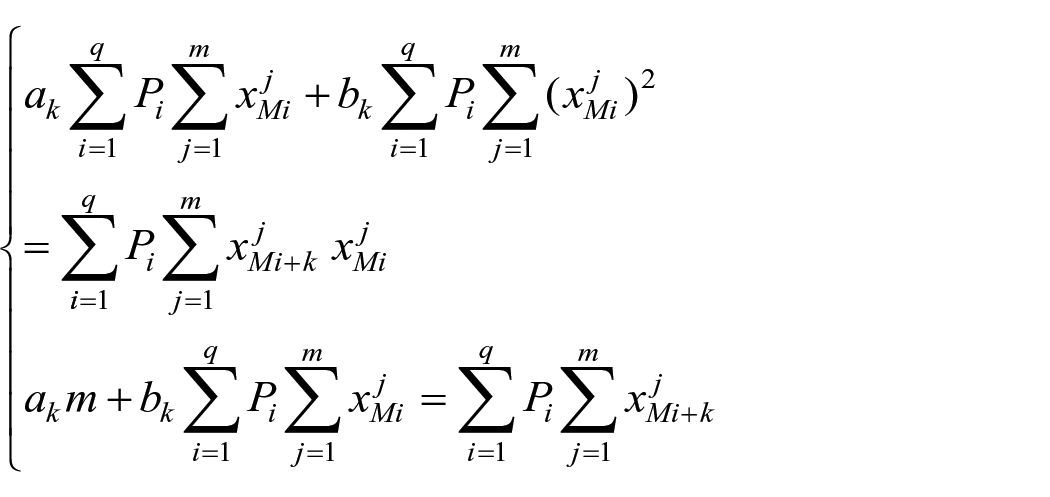
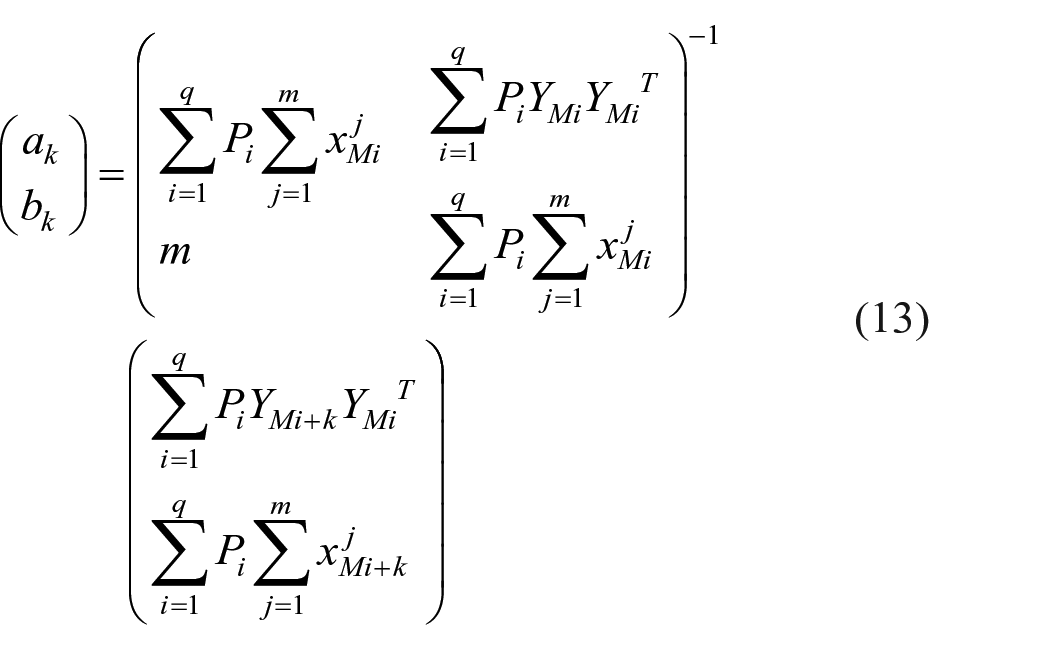
Write it in matrix form as follows
where
Then
In programming calculation, the item
According to

where the mth element
Chaos prediction algorithm
When the equipment is running, for every time

In addition, simplify it as
2. Build the phase space. For the attractor characterized by the time series
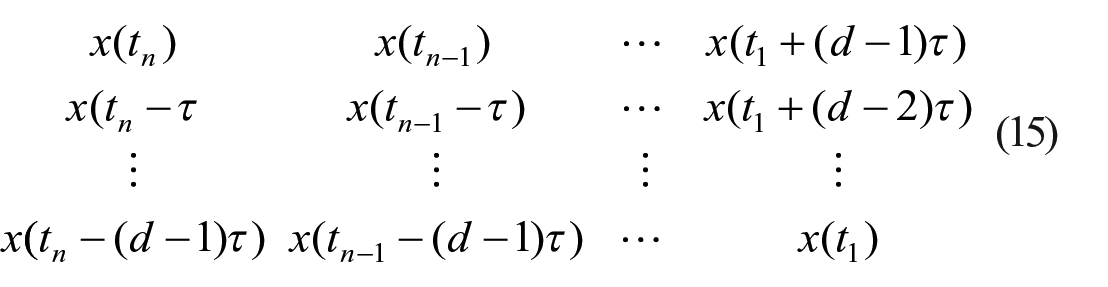
So,
3. Calculate the fractal dimension, Lyapunov exponent, and Kolmogorov entropy of the phase space and determine whether the system is chaotic. We can use chaotic prediction if it is chaotic. If not, we can use another method.
4. The maximum predictable time scale T is calculated.
5. In the phase space, the Euclidean distance between each point and the center point
6. According to the phase space reconstruction theory, there are
And
In this article, the prediction results of the strong vibration signal and the slight vibration signal are shown in Figures 4(b), (e) and 5(b), (e).
As seen from Figures 4 and 5, by comparing the deviation between the predicted value and the measured value, it can be seen that one-time multi-step prediction method is better than the other two methods.
Conclusion
In order to overcome the shortcomings of the Fourier transform (which cannot analyze the time–frequency localization and nonstationary signal), in this article, according to the actual nonstationary vibration signal of a large equipment located in a large Steel Corporation, the research group used wavelet packet decomposition and reconstruction, time–frequency analysis, and the application of wavelet decomposition in signal denoising. The effect of the high-frequency weight coefficient selection of each layer on signal denoising was analyzed. The chaotic time series nonlinear prediction was carried out using the global method, local method, weighted first-order local method, and maximum Lyapunov exponent prediction method, and it was found that the multi-step prediction method is better than other prediction methods.
Footnotes
Declaration of conflicting interests
The author(s) declared no potential conflicts of interest with respect to the research, authorship, and/or publication of this article.
Funding
The author(s) disclosed receipt of the following financial support for the research, authorship, and/or publication of this article: This research was supported by Key Scientific and Technological project of Henan Province (No. 172102210022, No.182102210086), Natural Science Foundation of Henan Province of China (No.182300410265), and National Undergraduate Training Program for Innovation and Entrepreneurship (No. 201810460069).