In this study, A-weighted noise levels were recorded for the entire day (24 h) at each site along the major urban roads of Kurukshetra city in India. The traffic flow (volume and composition) was also recorded simultaneously. Thereafter, the relevant noise and traffic descriptors were computed to assess the traffic noise pollution. The equivalent 2-hourly traffic noise levels, , exhibited a somewhat cyclic pattern having noise crests and troughs over the 24 h in the case of all the four studied urban roads, thus identifying the peak and lean noise hours. The equivalent day time noise levels () and night time noise levels () were in the range of 68.06 – 80.73 dB(A) and 44.12 – 70.91 dB(A) respectively, exceeding the permissible levels as per Indian standards and WHO guidelines at all sites, except at two sites. The day-night average noise levels with 24-h’ base time, , was above WHO limits of 70 dB(A) barring five sites. The proposed relationship between and passenger car unit (PCU) per hour has the potential application in estimating noise levels from traffic flow data with a high coefficient of determination of 0.8774. The noise climate () and traffic noise index () varied from 21.62 to 46.01 dB(A) and 116.16 – 187.53 respectively.
Exposure to excessive noise levels not only causes annoyance but also increases the risk for ischemic heart disease (IHD) and hypertension, sleep disturbance, headache, vertigo, bowel movements, hearing impairment, speech impediment, tinnitus, cognitive impairment, mental health problems and birth outcomes.1–3 Noise pollution due to swelling road traffic in urban areas globally, particularly in fast urbanizing developing countries, is one of the most serious environmental issues affecting the health and quality of the urban population.4–6 According to an estimate, about one million healthy life years were lost in Western Europe from traffic-related noise.7 India, a vigorously urbanizing country having the third-largest road network in the world and 326.3 million vehicles in 2022, is witnessing a more than 7% rate increase in the number of vehicles on roads per annum.8,9 Thus, rapid urbanization coupled with motorization, poses a critical cause of noise pollution and traffic congestion along with related socio-economic-environmental issues in developing cities; and, therefore, requires traffic noise assessment studies of major urban roads in cities.
Several traffic noise assessment studies of urban areas in different countries have been reported wherein the noise level indices or descriptors have been compared to their respective national or World Health Organization (WHO) permissible levels or standards such as Bangladesh,10 Brazil,11 Canada,12 Ghana,13 Greece,14 India,8,15–18 Jordan,19 Nepal,20 Nigeria,21 Pakistan,22 Serbia,23 USA.24 While a majority of such studies had measured fragmented traffic noise levels for ‘two’ or ‘one and a half’ hours during morning, afternoon and evening and/or night only,16,19,21,25 along with traffic flow measurements,17,22 or without the traffic flow measurements.19,25 However, very few studies measured and assessed traffic noise levels for the entire day, that is 24 h,14,23,26 and simultaneous traffic flow measurements.23 Further, some of the studies have proposed a traffic noise prediction model using multiple linear regression analysis by considering noise and traffic flow data along with road parameters.17
Traffic noise studies are strongly time and traffic flow dependent and to account for this feature, 24-h noise measurements are essential to represent the entire day. To overcome this research gap, the present study is being carried out for the entire day at each of the selected sites along the four major roads of Kurukshetra city (India) and simultaneous estimation of traffic flow (volume and composition). Consequently, this study set out to achieve the following objectives:
⁃ Evaluate the noise indices/descriptors during the 24-h day period at key locations along the major roads in the city of Kurukshetra.
⁃ Simultaneous evaluation of the traffic flow descriptors.
⁃ Compare the measured noise levels to the Indian standards and World Health Organization guidelines, along with reported studies.
⁃ Investigate significant variations in noise descriptors throughout the day.
⁃ Proposed traffic noise () prediction model from the standard traffic flow parameter (PCU per hour) based on Indian Roads Congress guidelines.
To achieve the above objectives, the noise indices/descriptors namely, , , , , , , , , , , and are used in the present study, along with traffic flow per hour and Passenger Car Unit (PCU) per hour.
Materials and methods
Study area
Kurukshetra is a historical city in the Haryana state in the northern region of India. It is located at around 30°N and 77°E at an elevation of around 235 m above mean sea level, and spread over an area of 48 km2. It is well connected to other parts of the state and country through railway and highways. The National Highway 44 (NH44) passes along the eastern side of the city, and State Highway 6 (SH6) passes through the central part of the city running in east-west direction and meeting the NH44 at the eastern side of the city.
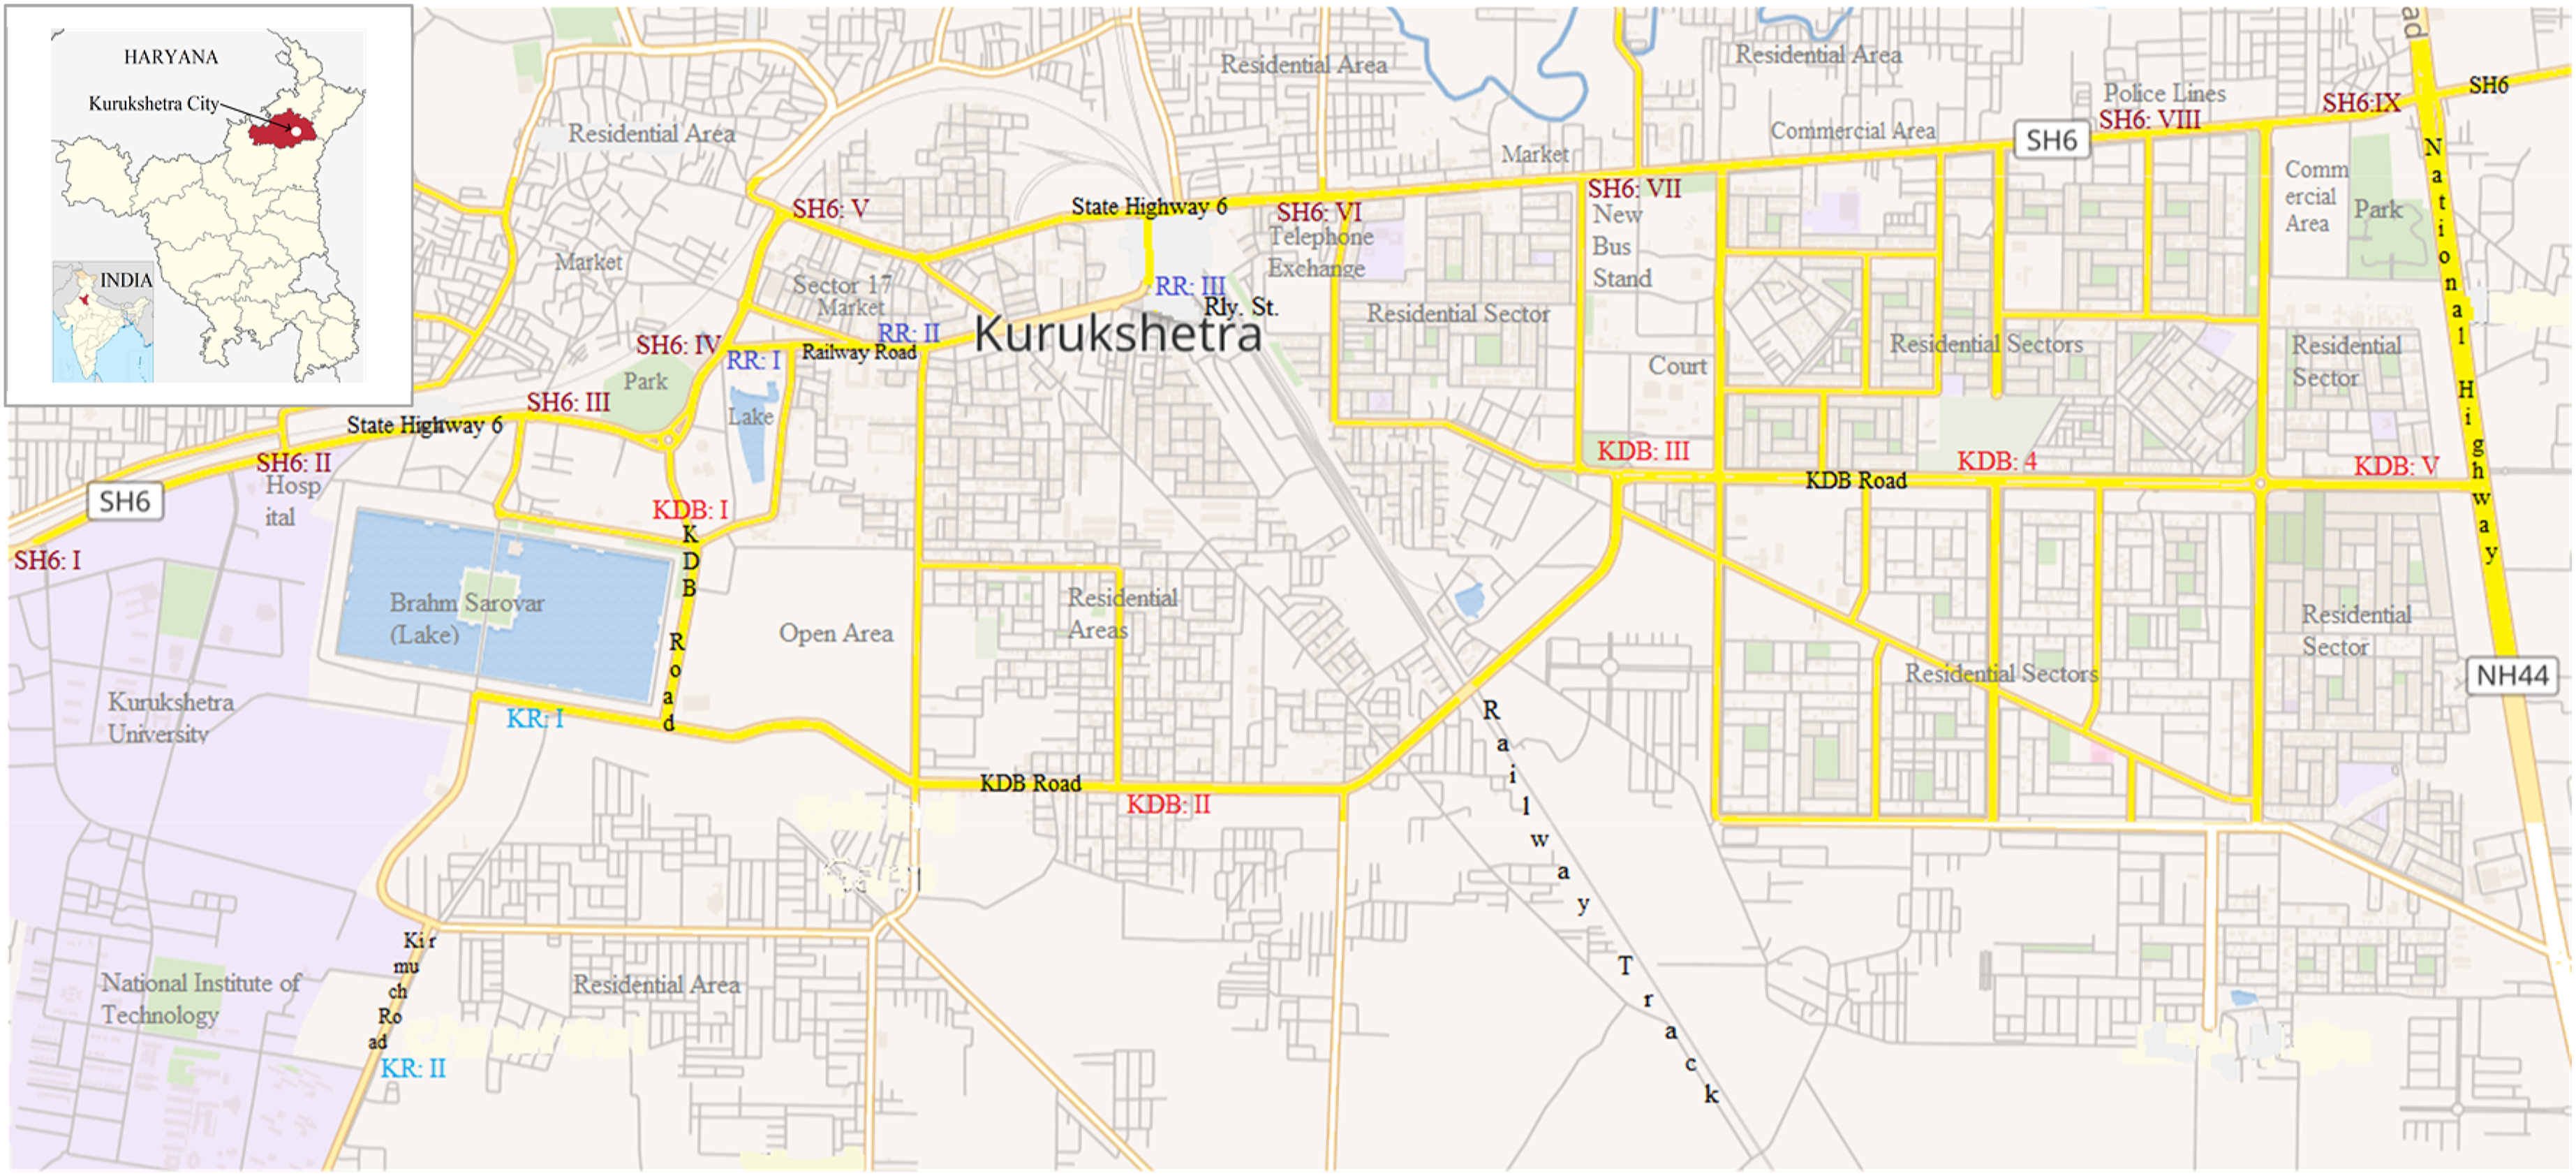
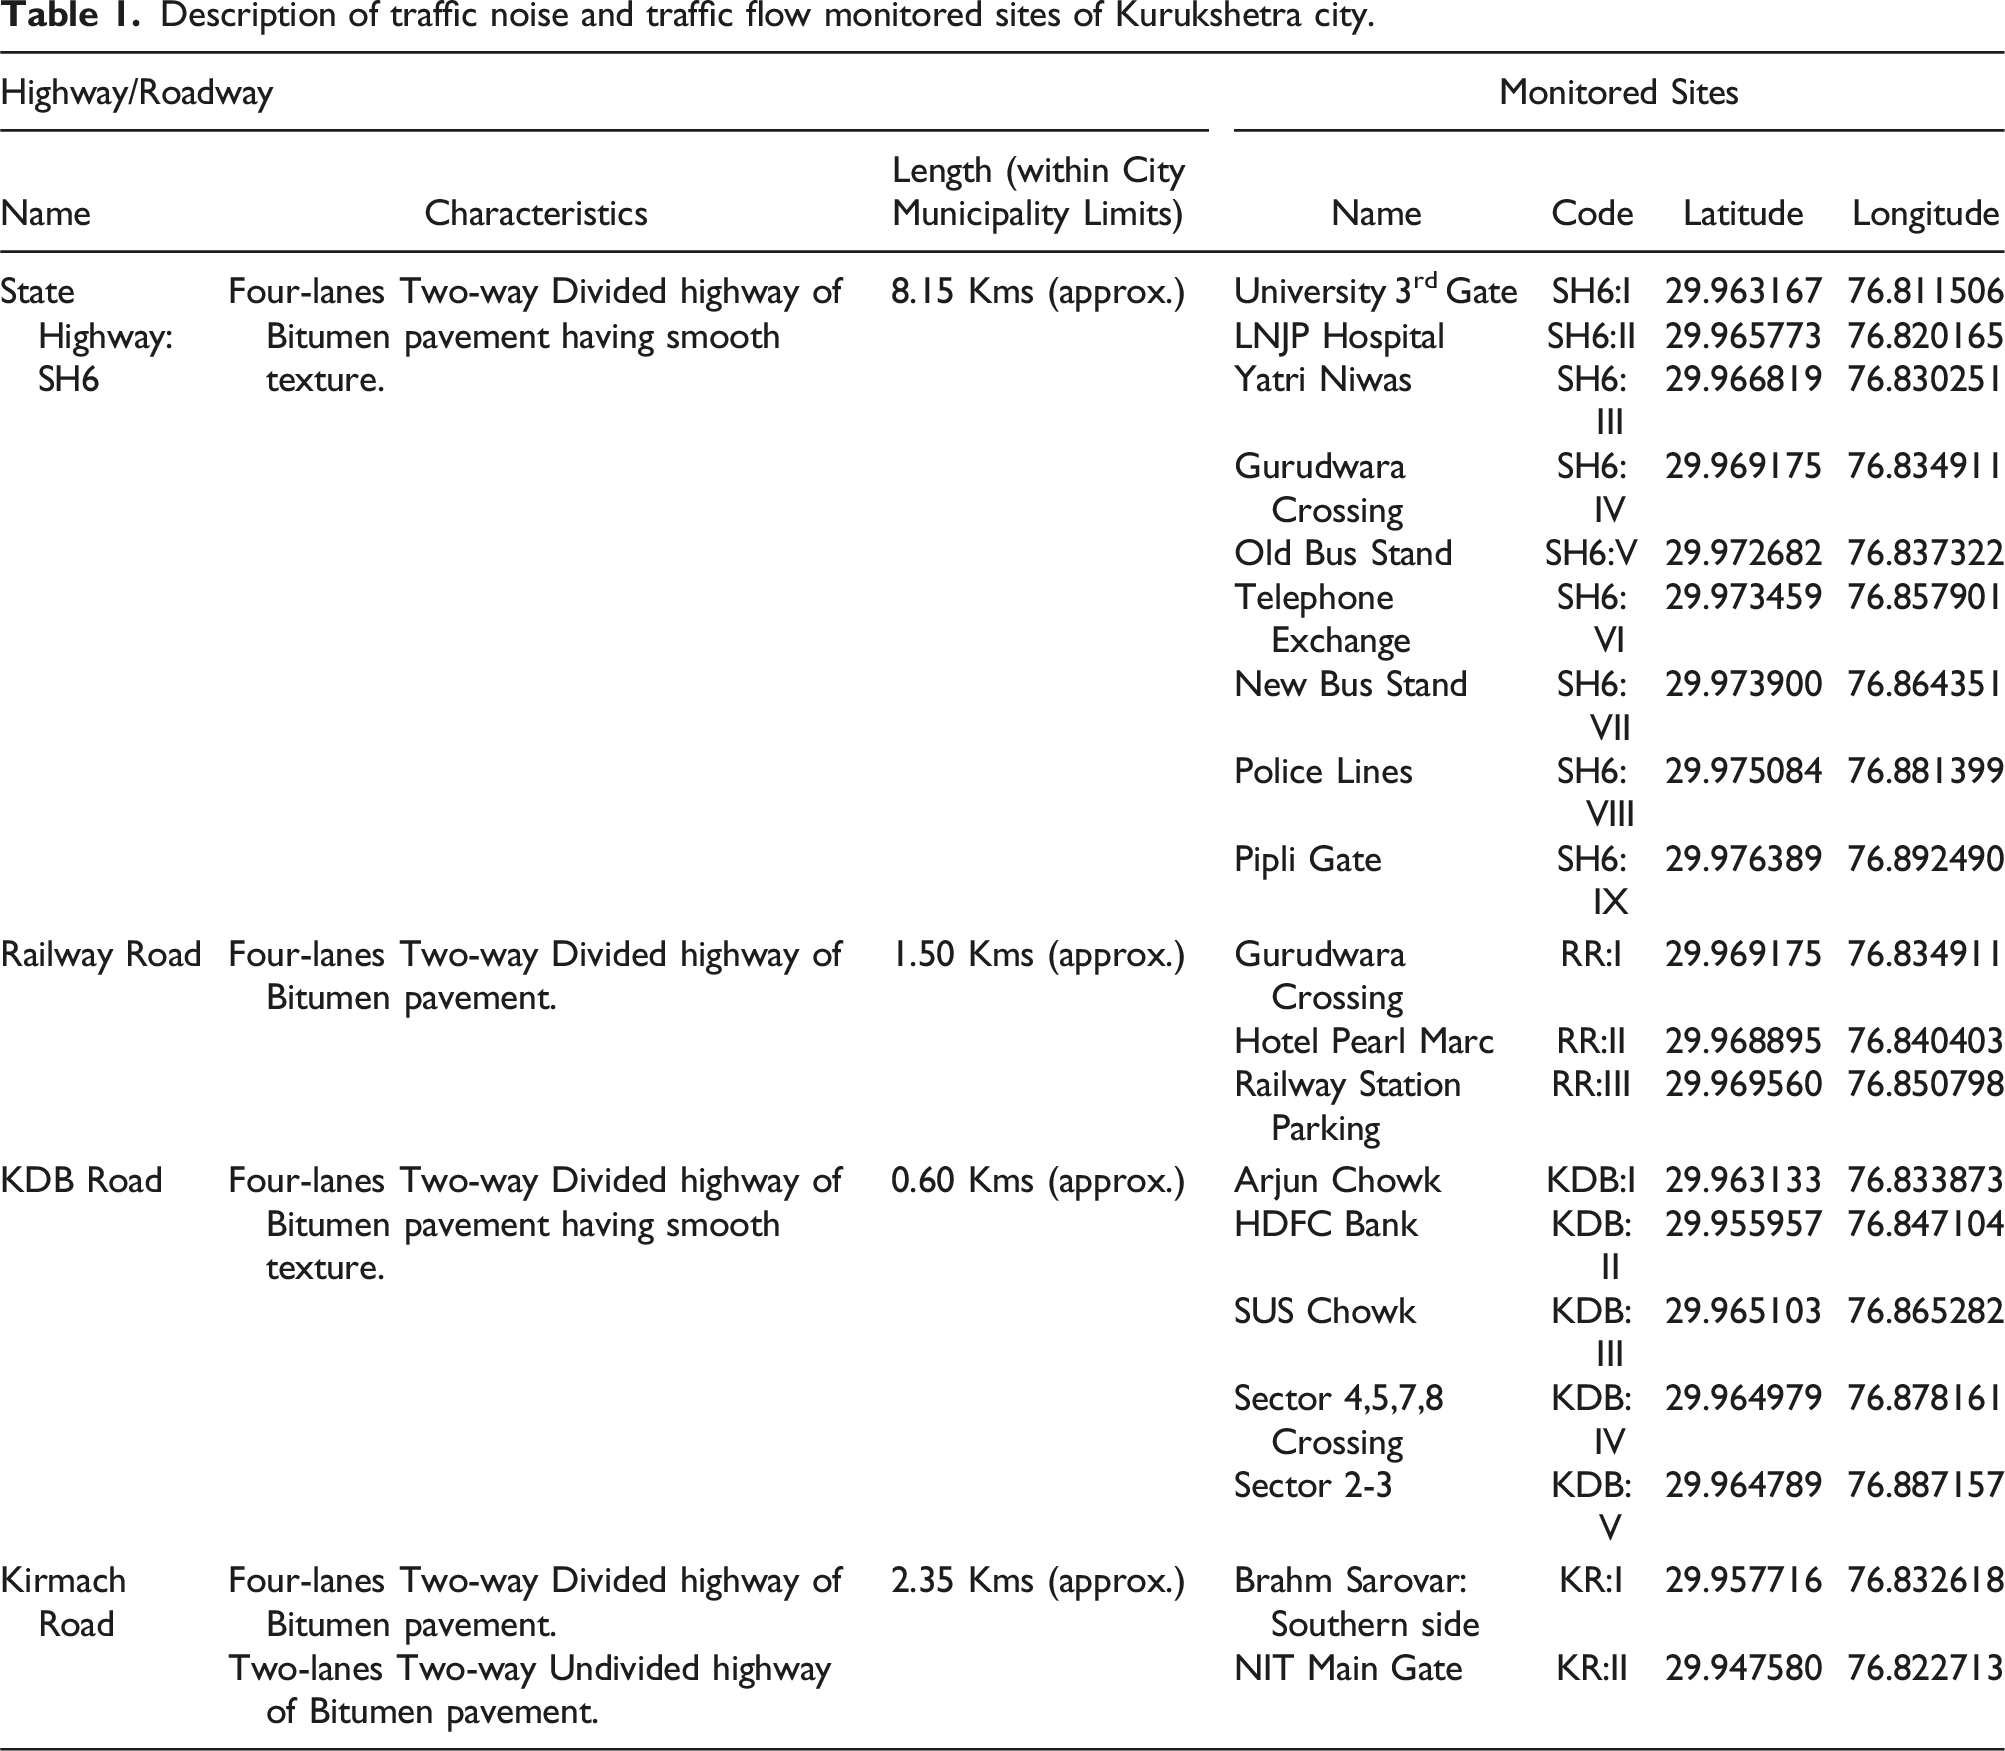
Like most of the urban centers in developing countries, Kurukshetra city is also witnessing traffic congestion and in turn noise pollution. The traffic noise assessment study, including traffic flow, was conducted at 18 sites located along the four major urban roadways of the city, namely State Highway 6 (SH6), Railway Road (RR), KDB Road (KDB) and Kirmach Road (KR) as shown in Figure 1. The description of the studied urban roads and noise monitored sites along with site codes is presented in Table 1. The roads have smooth textured bitumen pavement at all the monitored locations. The sites SH6:IV and RR:I represent a single monitored site at Gurudwara Crossing – a merging/splitting point of RR with/from SH6.
Layout plan of Kurukshetra city showing location of traffic noise and traffic flow monitored sites.
Description of traffic noise and traffic flow monitored sites of Kurukshetra city.
Highway/Roadway
Monitored Sites
Name
Characteristics
Length (within City Municipality Limits)
Name
Code
Latitude
Longitude
State Highway: SH6
Four-lanes Two-way Divided highway of Bitumen pavement having smooth texture.
8.15 Kms (approx.)
University 3rd Gate
SH6:I
29.963167
76.811506
LNJP Hospital
SH6:II
29.965773
76.820165
Yatri Niwas
SH6:III
29.966819
76.830251
Gurudwara Crossing
SH6:IV
29.969175
76.834911
Old Bus Stand
SH6:V
29.972682
76.837322
Telephone Exchange
SH6:VI
29.973459
76.857901
New Bus Stand
SH6:VII
29.973900
76.864351
Police Lines
SH6:VIII
29.975084
76.881399
Pipli Gate
SH6:IX
29.976389
76.892490
Railway Road
Four-lanes Two-way Divided highway of Bitumen pavement.
1.50 Kms (approx.)
Gurudwara Crossing
RR:I
29.969175
76.834911
Hotel Pearl Marc
RR:II
29.968895
76.840403
Railway Station Parking
RR:III
29.969560
76.850798
KDB Road
Four-lanes Two-way Divided highway of Bitumen pavement having smooth texture.
0.60 Kms (approx.)
Arjun Chowk
KDB:I
29.963133
76.833873
HDFC Bank
KDB:II
29.955957
76.847104
SUS Chowk
KDB:III
29.965103
76.865282
Sector 4,5,7,8 Crossing
KDB:IV
29.964979
76.878161
Sector 2-3
KDB:V
29.964789
76.887157
Kirmach Road
Four-lanes Two-way Divided highway of Bitumen pavement.
2.35 Kms (approx.)
Brahm Sarovar: Southern side
KR:I
29.957716
76.832618
Two-lanes Two-way Undivided highway of Bitumen pavement.
NIT Main Gate
KR:II
29.947580
76.822713
Materials
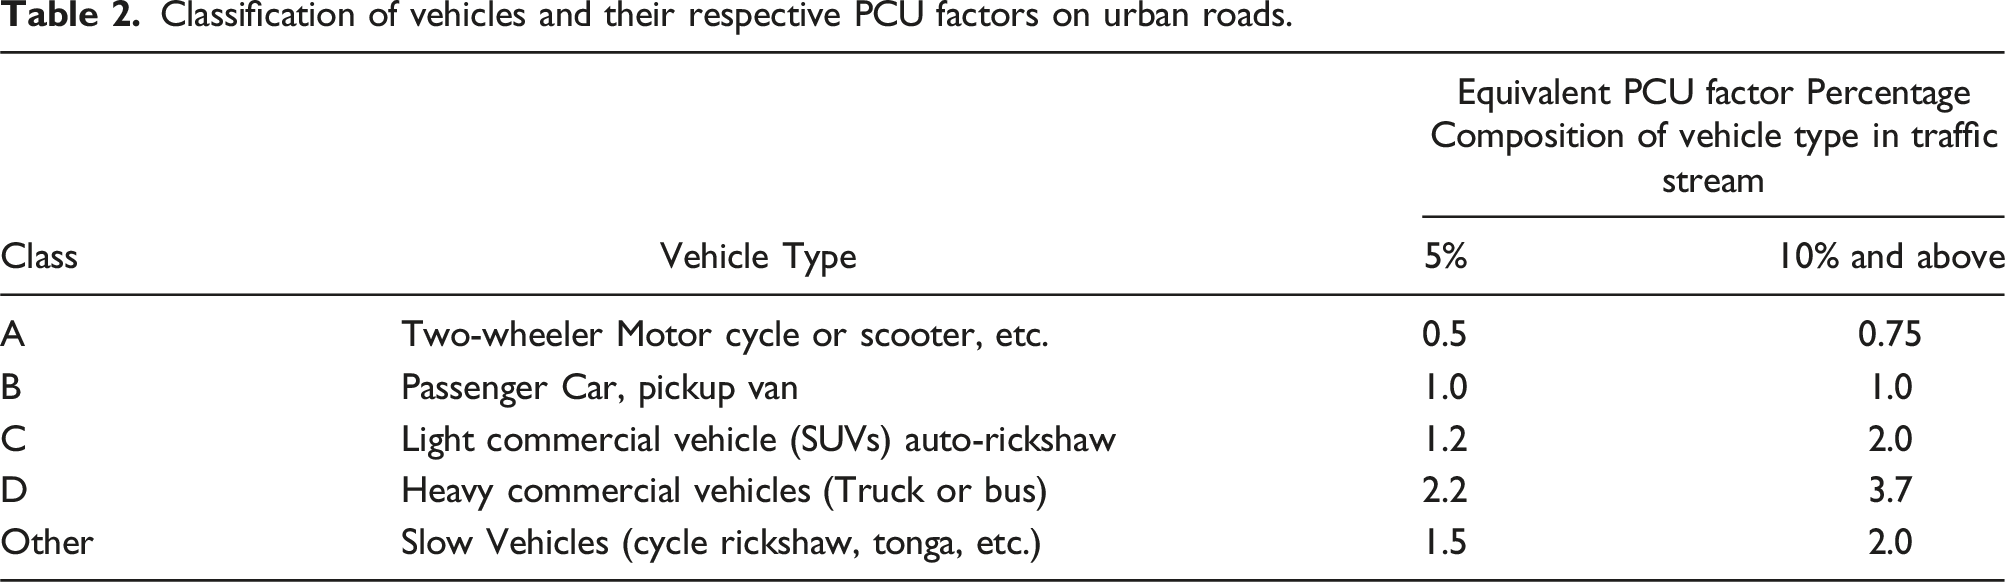
This study is based on measurements of ambient noise levels of urban roads at different sites using a Class-1 Casella CEL-620B1 sound level meter (SLM) ranging between 0 and 140.2 dB(A) using “A” frequency weighting and “Fast” time mode. Further, Casella CEL-120/1 Class-1 acoustic calibrator was used for calibrating the SLM at 94 dB(A) before and after the day’s work following the instrument’s handbook. Traffic flow data, volume and composition, was obtained simultaneously with the noise measurement by using a video camera mounted on a tripod. The vehicle counts and composition was done manually based on Indian Roads Congress guidelines given in IRC:106-1990,27 as shown in Table 2.
Classification of vehicles and their respective PCU factors on urban roads.
Class
Vehicle Type
Equivalent PCU factor Percentage Composition of vehicle type in traffic stream
5%
10% and above
A
Two-wheeler Motor cycle or scooter, etc.
0.5
0.75
B
Passenger Car, pickup van
1.0
1.0
C
Light commercial vehicle (SUVs) auto-rickshaw
1.2
2.0
D
Heavy commercial vehicles (Truck or bus)
2.2
3.7
Other
Slow Vehicles (cycle rickshaw, tonga, etc.)
1.5
2.0
Methodology
The study was carried out from August 2023 to January 2024. All measurements were taken on-site and during suitable meteorological conditions, that is no rainfall and no high winds to minimize possible background noise error and ensure normal traffic flow. Further, unprecedented days having festivals, fairs, etc. activities were also avoided.
For noise monitoring, the instrument was set at the designated site with a measuring height of 1.2 – 1.6 m above the existing road-level and along the main road about 20 cm away from the sidewalks or outer driving lane with a microphone pointed towards the road so as to avoid the interference from non-traffic noise.28 Further, the selected sites were such that the sound influence is more, that is without any obstructions and reflective surfaces/objects in the surrounding medium.29,30 A-weighted instantaneous sound pressure levels () were recorded at intervals of 30 s for 10 min continuously during 2 h periods for 24 h, providing 240 readings per monitored site. Thus, providing a total of 4320 noise level readings. The Indian standards for noise classify/divide the 24 h of the day as day time: 06 – 22 h or 06 am – 10 pm; night time: 22 – 06 h or 10 pm – 06 am31 without specifying the evening time as in WHO and European standards. In the present study, the 24 h of the day are divided/classified into four periods – morning time (06 – 12 h), afternoon time (12 – 18 h), evening time (18 – 22 h) that will be validated in the analysis, and night time (22 – 06 h), keeping in view the Indian standards and other similar studies of Indian cities17,18 and objectives of the study. From the field measurements, the noise indices/descriptors namely, , , , , , , , , , , and were computed for proper assessment and analysis of results. The noise indices are defined as29,30: Equivalent sound pressure level for 2-h time measurements, expressed in dB(A);: Equivalent sound pressure level for morning time measurements, expressed in dB(A);: Equivalent sound pressure level for afternoon time measurements, expressed in dB(A);: Equivalent sound pressure level for evening time measurements, expressed in dB(A);: Equivalent sound pressure level for night time measurements, expressed in dB(A);: Equivalent sound pressure level for day time measurements, expressed in dB(A);: A based day-night average sound level during a 24-h day with a 10 dB(A) night time penalty to account for the increased sensitivity to noise during night time, expressed in dB(A);: The noise level exceeded 10% of the time of the measurement duration (represents the upper limit of fluctuating road traffic noise levels), expressed in dB(A);: The noise level exceeded 50% of the measurement duration (represents the median or statistical mid-point of the fluctuating noise levels, expressed in dB(A);: The noise level exceeded 90% of the time of the measurement duration (indicates the background noise level without the source in question), expressed in dB(A);: Noise climate (represents the range over which the noise level is changing), expressed in dB(A);: Traffic noise index (represents the annoyance responses to road traffic noise), expressed as number being an arbitrary constant.
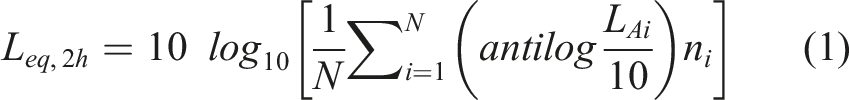
The values are computed using the following Equation:13,21
where is the sound pressure level reading in dB(A), (=20) is the total number of readings in the reference time interval. Thereafter, the A-weighted equivalent sound pressure levels () for respective time periods, that is , , , and are computed by substituting the computed values in place of in equation (1).13,21 The other noised descriptors (, and ) are computed using the following equations:13,21
For traffic monitoring, the video camera was set near the designated site with a measuring height of 1.2 – 1.6 m above the existing road-level and along the main road focused towards the traffic such that there is no obstruction to its line of sight. The most common traffic flow descriptors – Traffic flow per hour and Passenger Car Unit per hour (PCU per hour) are used for traffic flow analysis and relationship with day-night average sound level ().
Results and discussion
The status of noise levels in terms of various noise indices at all the monitored sites along the major urban roads of Kurukshetra city was assessed along with traffic flow and vehicle composition status using descriptive and analytical statistics. The results and findings of the present study have also been compared with previous urban areas’ studies in terms of relevant and appropriate noise and traffic descriptors during discussion.
Traffic flow and vehicle composition
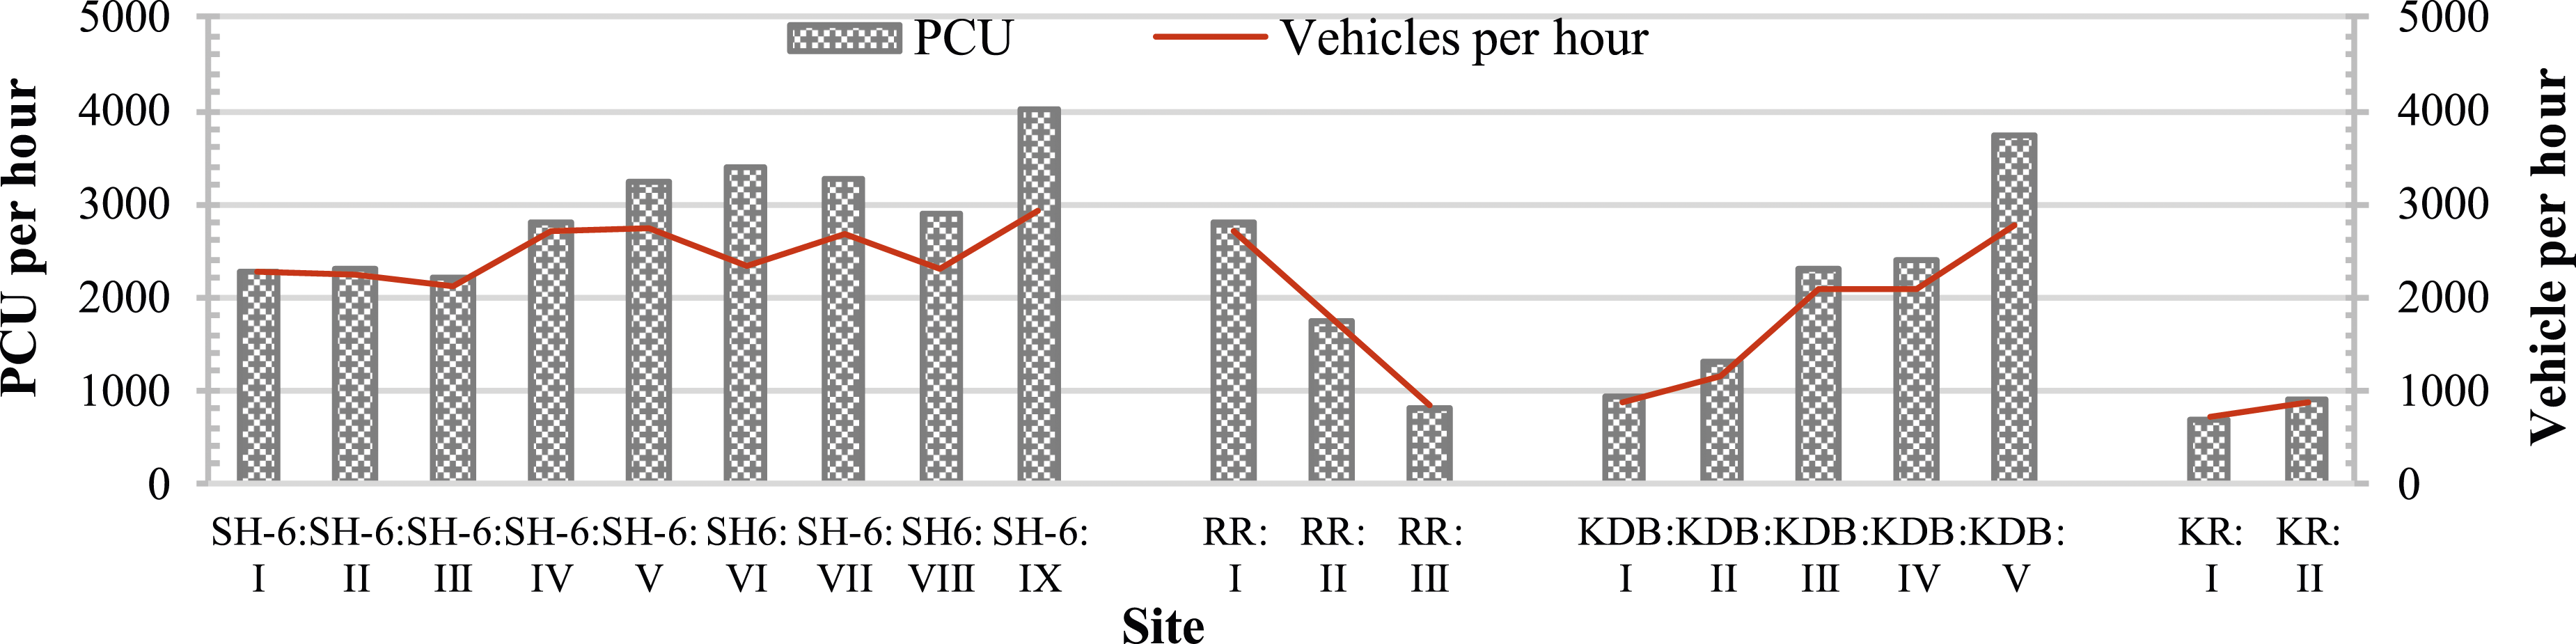
The traffic flow, in terms of vehicles per hour or PCU per hour, and vehicle composition are the key drivers of noise levels that have a significant role in traffic noise pollution in urban areas. The traffic flow per hour at all the sites is being presented in Figure 2 in terms of both the parameters, that is PCU per hour and Vehicles per hour. Outwardly, the traffic flow was highest on State Highway 6 (SH6) due to city traffic augmented by inter-city and inter-state traffic on SH6 followed by KDB Road, Railway Road (RR) and Kirmach Road (RR). The highest traffic flow was observed at site SH6:IX (PCU per hour = 4024.30; Vehicles per hour = 2932) near the junction of SH6 and NH44 (National Highway 44) closely followed by site KDB:V (PCU per hour = 3745.35; Vehicles per hour = 2756) near the junction of KDB Road and NH44 possibly due to the proximity of both the sites to NH44 having high traffic flow. The lower traffic flow was observed at sites KR:I (PCU per hour = 679.6; Vehicles per hour = 723), KR:II (PCU per hour = 898.95; Vehicles per hour = 860) and RR:III (PCU per hour = 822.45; Vehicles per hour = 829) which is the terminal point of Railway Road.
Traffic flow at monitored sites along the major urban roads of Kurukshetra city.
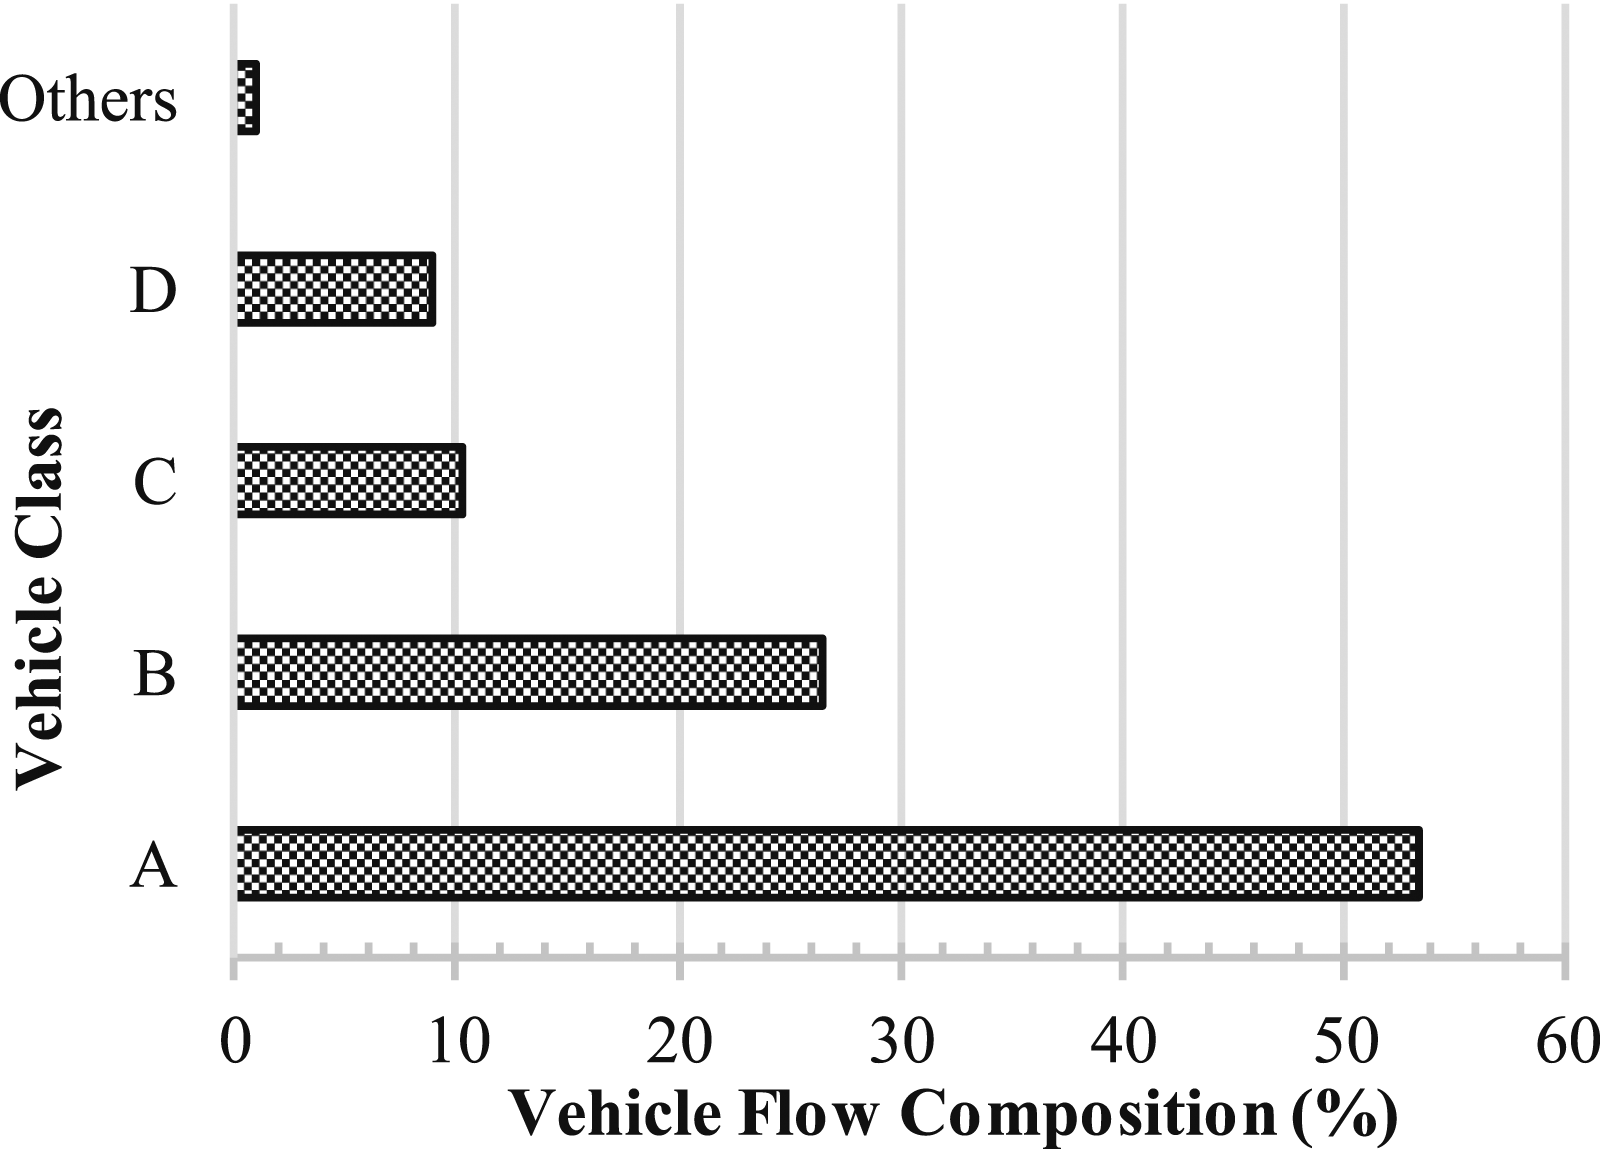
The composition of vehicles is being dominated by Class A (53.48%) vehicles followed by Class B (26.46%), as shown in Figure 3, which indicate that the city’s traffic is primarily comprised of two-wheelers, and that light- and heavy- commercial vehicles such as SUVs, auto-rickshaw, trucks, buses, etc. are relatively less (10.26% and 8.85% respectively) at all the monitored sites. These outcomes of the study are consistent with similar reported studies of other cities, such as Kathmandu,20 Vijayawada,5 Aurangabad,32 Agartala,33 which have reported dominance of Class A vehicles in the high traffic volumes of urban areas.
Composition of vehicles in traffic flow at monitored sites along the major urban roads of Kurukshetra city.
Assessment of traffic noise indices
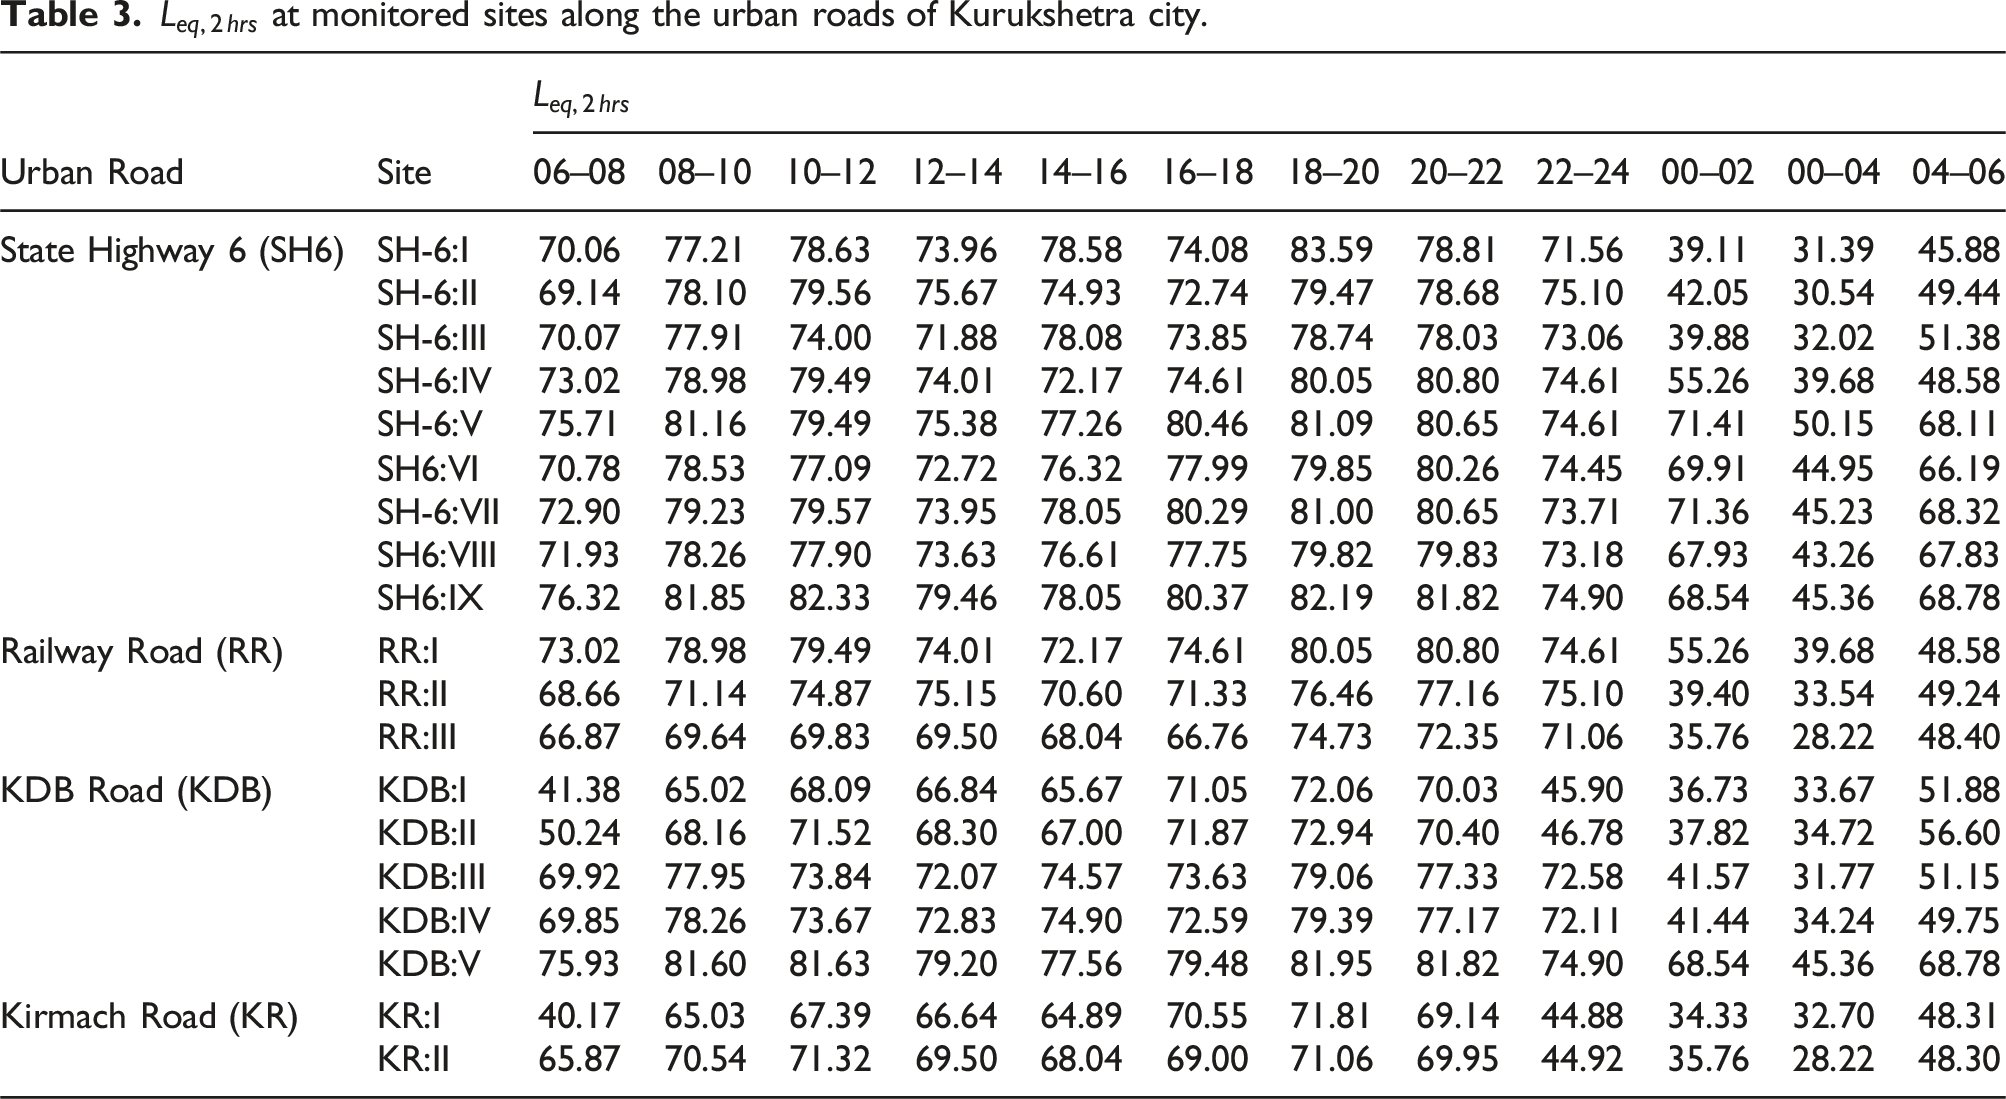
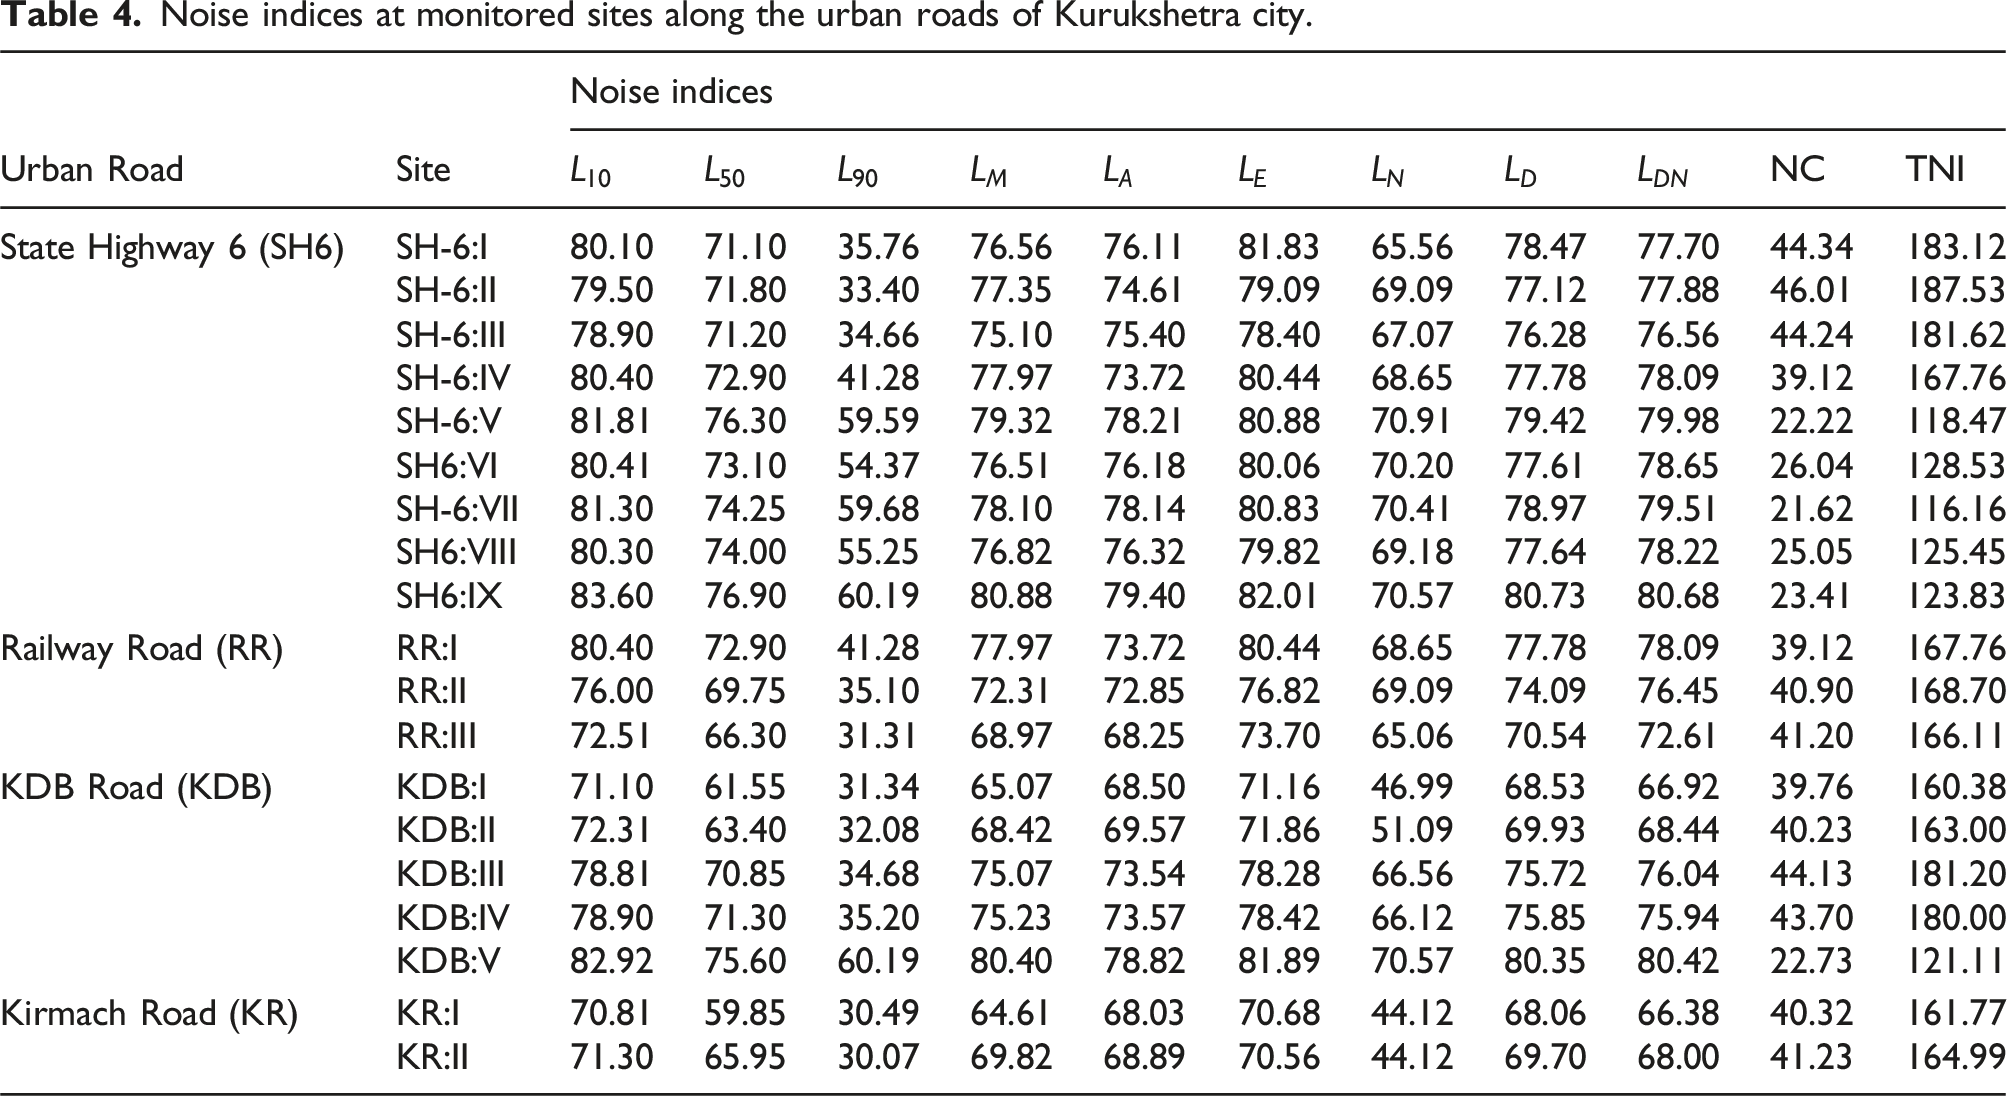
The noise level status of the four main roads at the monitored sites is presented in Table 3 and Table 4 in terms of various traffic noise indices.
at monitored sites along the urban roads of Kurukshetra city.
Urban Road
Site
06–08
08–10
10–12
12–14
14–16
16–18
18–20
20–22
22–24
00–02
00–04
04–06
State Highway 6 (SH6)
SH-6:I
70.06
77.21
78.63
73.96
78.58
74.08
83.59
78.81
71.56
39.11
31.39
45.88
SH-6:II
69.14
78.10
79.56
75.67
74.93
72.74
79.47
78.68
75.10
42.05
30.54
49.44
SH-6:III
70.07
77.91
74.00
71.88
78.08
73.85
78.74
78.03
73.06
39.88
32.02
51.38
SH-6:IV
73.02
78.98
79.49
74.01
72.17
74.61
80.05
80.80
74.61
55.26
39.68
48.58
SH-6:V
75.71
81.16
79.49
75.38
77.26
80.46
81.09
80.65
74.61
71.41
50.15
68.11
SH6:VI
70.78
78.53
77.09
72.72
76.32
77.99
79.85
80.26
74.45
69.91
44.95
66.19
SH-6:VII
72.90
79.23
79.57
73.95
78.05
80.29
81.00
80.65
73.71
71.36
45.23
68.32
SH6:VIII
71.93
78.26
77.90
73.63
76.61
77.75
79.82
79.83
73.18
67.93
43.26
67.83
SH6:IX
76.32
81.85
82.33
79.46
78.05
80.37
82.19
81.82
74.90
68.54
45.36
68.78
Railway Road (RR)
RR:I
73.02
78.98
79.49
74.01
72.17
74.61
80.05
80.80
74.61
55.26
39.68
48.58
RR:II
68.66
71.14
74.87
75.15
70.60
71.33
76.46
77.16
75.10
39.40
33.54
49.24
RR:III
66.87
69.64
69.83
69.50
68.04
66.76
74.73
72.35
71.06
35.76
28.22
48.40
KDB Road (KDB)
KDB:I
41.38
65.02
68.09
66.84
65.67
71.05
72.06
70.03
45.90
36.73
33.67
51.88
KDB:II
50.24
68.16
71.52
68.30
67.00
71.87
72.94
70.40
46.78
37.82
34.72
56.60
KDB:III
69.92
77.95
73.84
72.07
74.57
73.63
79.06
77.33
72.58
41.57
31.77
51.15
KDB:IV
69.85
78.26
73.67
72.83
74.90
72.59
79.39
77.17
72.11
41.44
34.24
49.75
KDB:V
75.93
81.60
81.63
79.20
77.56
79.48
81.95
81.82
74.90
68.54
45.36
68.78
Kirmach Road (KR)
KR:I
40.17
65.03
67.39
66.64
64.89
70.55
71.81
69.14
44.88
34.33
32.70
48.31
KR:II
65.87
70.54
71.32
69.50
68.04
69.00
71.06
69.95
44.92
35.76
28.22
48.30
Noise indices at monitored sites along the urban roads of Kurukshetra city.
Urban Road
Site
Noise indices
NC
TNI
State Highway 6 (SH6)
SH-6:I
80.10
71.10
35.76
76.56
76.11
81.83
65.56
78.47
77.70
44.34
183.12
SH-6:II
79.50
71.80
33.40
77.35
74.61
79.09
69.09
77.12
77.88
46.01
187.53
SH-6:III
78.90
71.20
34.66
75.10
75.40
78.40
67.07
76.28
76.56
44.24
181.62
SH-6:IV
80.40
72.90
41.28
77.97
73.72
80.44
68.65
77.78
78.09
39.12
167.76
SH-6:V
81.81
76.30
59.59
79.32
78.21
80.88
70.91
79.42
79.98
22.22
118.47
SH6:VI
80.41
73.10
54.37
76.51
76.18
80.06
70.20
77.61
78.65
26.04
128.53
SH-6:VII
81.30
74.25
59.68
78.10
78.14
80.83
70.41
78.97
79.51
21.62
116.16
SH6:VIII
80.30
74.00
55.25
76.82
76.32
79.82
69.18
77.64
78.22
25.05
125.45
SH6:IX
83.60
76.90
60.19
80.88
79.40
82.01
70.57
80.73
80.68
23.41
123.83
Railway Road (RR)
RR:I
80.40
72.90
41.28
77.97
73.72
80.44
68.65
77.78
78.09
39.12
167.76
RR:II
76.00
69.75
35.10
72.31
72.85
76.82
69.09
74.09
76.45
40.90
168.70
RR:III
72.51
66.30
31.31
68.97
68.25
73.70
65.06
70.54
72.61
41.20
166.11
KDB Road (KDB)
KDB:I
71.10
61.55
31.34
65.07
68.50
71.16
46.99
68.53
66.92
39.76
160.38
KDB:II
72.31
63.40
32.08
68.42
69.57
71.86
51.09
69.93
68.44
40.23
163.00
KDB:III
78.81
70.85
34.68
75.07
73.54
78.28
66.56
75.72
76.04
44.13
181.20
KDB:IV
78.90
71.30
35.20
75.23
73.57
78.42
66.12
75.85
75.94
43.70
180.00
KDB:V
82.92
75.60
60.19
80.40
78.82
81.89
70.57
80.35
80.42
22.73
121.11
Kirmach Road (KR)
KR:I
70.81
59.85
30.49
64.61
68.03
70.68
44.12
68.06
66.38
40.32
161.77
KR:II
71.30
65.95
30.07
69.82
68.89
70.56
44.12
69.70
68.00
41.23
164.99
Variation of equivalent continuous sound pressure level during 24 h
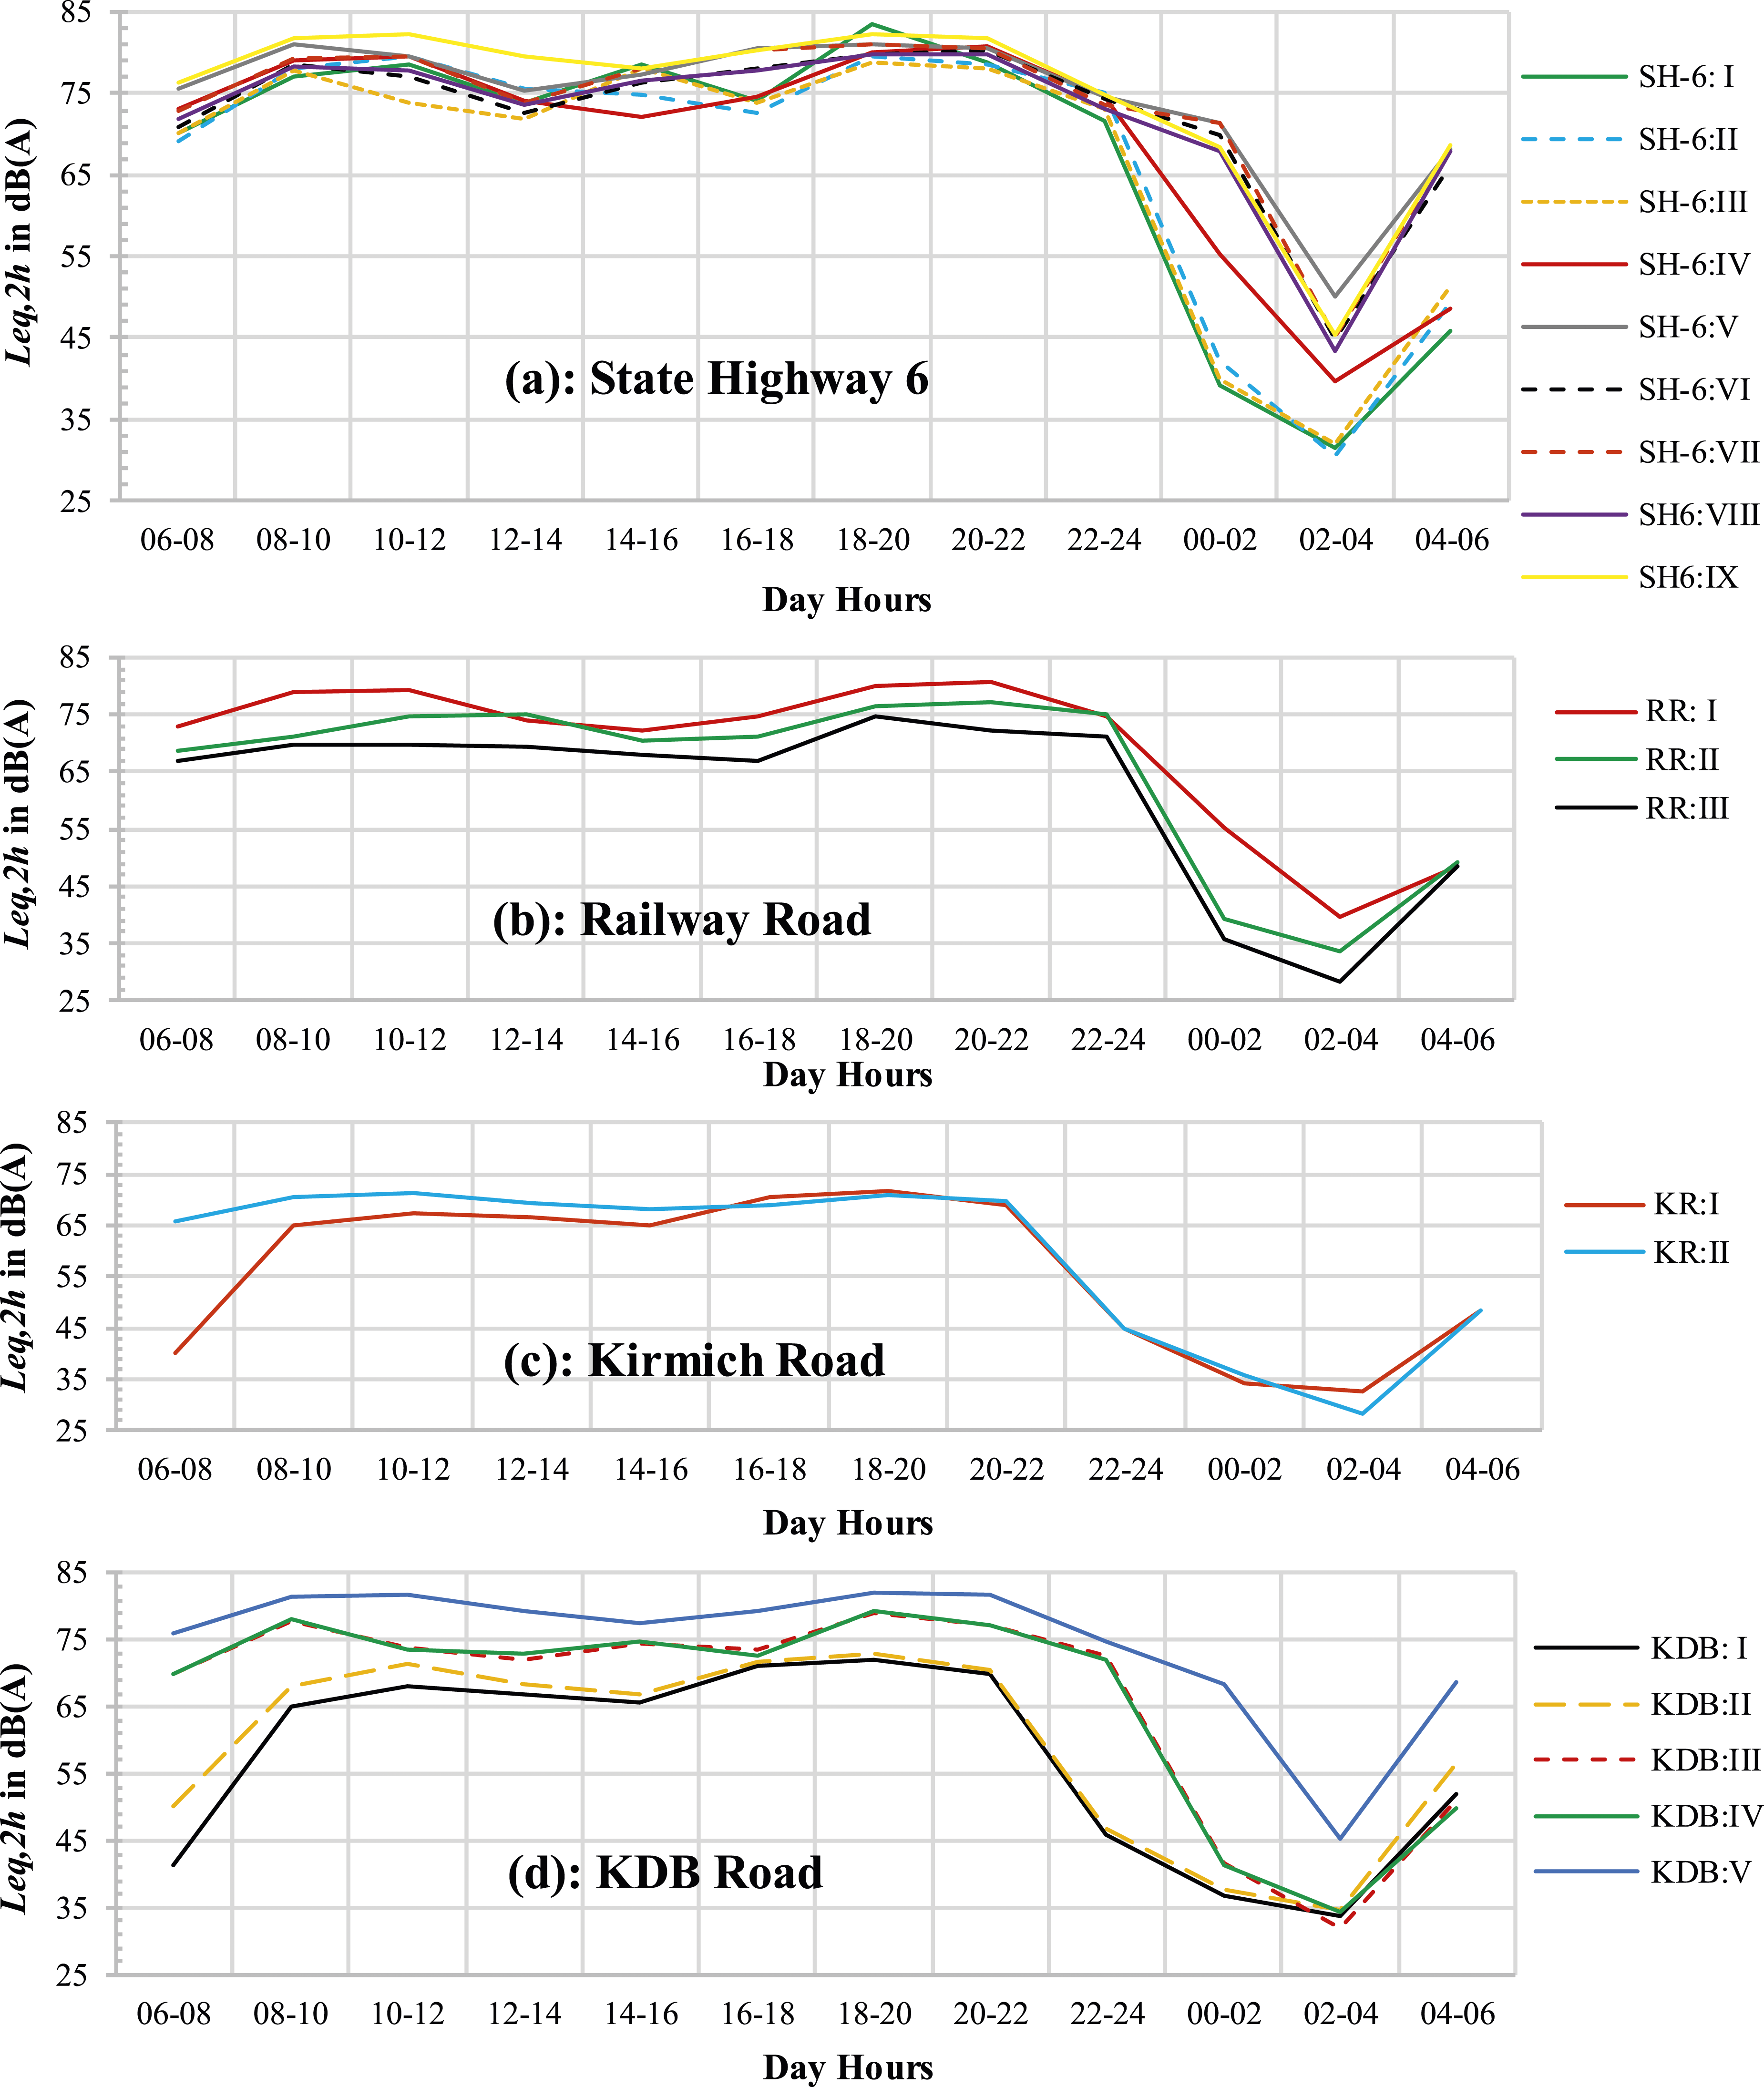
The levels over the 24 h on the monitored sites have been plotted for the four urban roads in Figure 4. The variation of reflects a somewhat cyclic pattern having crests and troughs over the 24 h in the case of all four studied urban roads. The variation revealed the occurrence of two prominent noise level crests – one during 08–10 h (morning time) and a second, broader crest, around 18–20 h (evening time); and a prominent deep noise level trough during 02–04 h (late night) spreading over the adjoining periods and a broader shallow trough during 12–16 h (afternoon time) in case of all the studied urban roads, except the noise level crest during 14–16 h (afternoon) on SH6 (Figure 4(a)) possibly as a result of increased traffic flow from academic institutes that closes during this period and situated on or around SH6. Similar findings having cyclic patterns of noise levels during the day have been reported by other traffic noise studies of urban roads.14,23,26
variation on monitored sites along the four major roads of Kurukshetra city.
The prominent noise level crest during 08–10 h was in the range of 77.21 – 81.85 dB(A), 69.64 – 78.97 dB(A), 65.03 – 70.54 dB(A) and 65.02 – 81.60 dB(A) on SH6, RR, KR and KDB roads respectively (Figure 4), indicating SH6 being noisiest during morning peak hours. The same pattern was reflected by the major crest during 18-20 h wherein the values were in the range of 78.74 – 83.59 dB(A), 74.73 – 80.05 dB(A), 71.06 – 71.81 dB(A) and 72.06 – 81.95 dB(A) on SH6, RR, KR and KDB roads respectively. The prominent trough during 02–04 h has values in the range of 30.54 – 50.15 dB(A), 28.22 – 39.68 dB(A), 28.22 – 32.70 dB(A) and 31.77 – 45.36 dB(A) on SH6, RR, KR and KDB roads respectively, indicating KR road being quietest during night hours.
From the formation of noise level peak around 18 – 22 h (Figure 4), it can be inference that the evening time needs to be considered from 18 to 22 h (06 pm to 10 pm) for an urban traffic environment in Indian cities by keeping the night-time (22 – 06 h, that is 10 pm – 06 am) as per Indian standards. In fact, the latest all-day traffic noise studies of Indian cities have also considered evening time from 18 to 22 h18 as is being adopted in this study.
Noise indices descripting morning, afternoon, evening and night noise levels
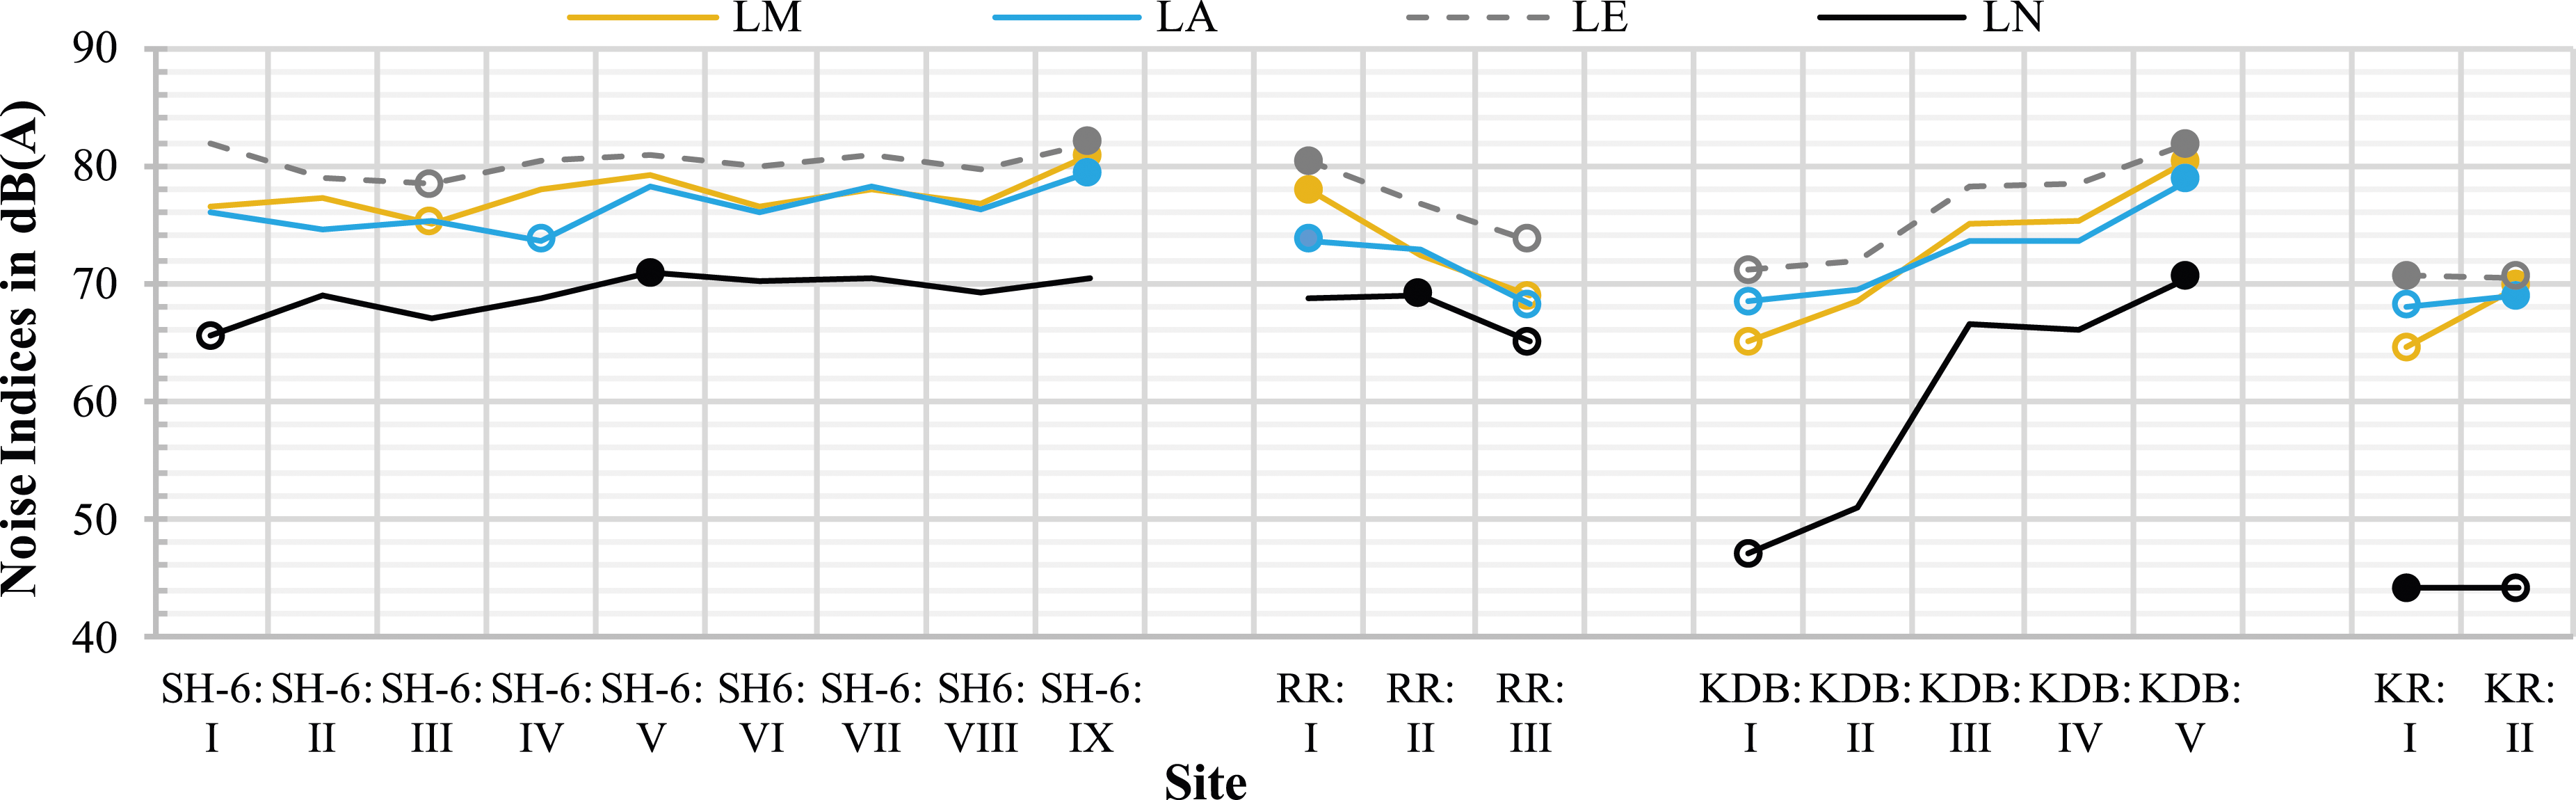
After analyzing the variation, the intra- and inter-road variation of , , and is studied by plotting these noise indices for all sites on the four urban roads of the city (Figure 5). The highest and lowest values of noise indices of respective urban roads have been highlighted by filled and hollow circular markers respectively in Figure 5. The values for SH6, RR, KDB and KR roads varies in the range of 75.10 – 80.88 dB(A) [SD = 1.71], 68.97 – 77.97 dB(A) [SD = 4.55], 65.07 – 80.40 dB(A) [SD = 6.08] and 64.61 – 69.82 dB(A) [SD = 3.68] respectively. The values for SH6, RR, KDB and KR roads varies in the range of 73.72 – 79.40 dB(A) [SD = 1.83], 68.25 – 73.72 dB(A) [SD = 2.94], 68.50 – 78.82 dB(A) [SD = 4.07] and 68.03 – 68.89 dB(A) [SD = 0.61] respectively. The values for SH6, RR, KDB and KR roads varies in the range of 78.40 – 82.01 dB(A) [SD = 1.18], 73.70 – 80.44 dB(A) [SD = 3.37], 71.16 – 81.89 dB(A) [SD = 4.63] and 70.56 – 70.68 dB(A) [SD = 0.09] respectively. The values for SH6, RR, KDB and KR roads varies in the range of 65.56 – 70.91 dB(A) [SD = 1.78], 65.06 – 69.09 dB(A) [SD = 2.21], 46.99 – 70.57 dB(A) [SD = 10.49] and 44.12 – 44.12 dB(A) [SD = 0.00] respectively.
Variation of noise indices , , and on the four urban roads of the city.
The inter-road analysis revealed that the noise indices , , and are observed to be generally highest for monitoring sites on SH6 followed by RR and KDB, and lowest on KR road (Figure 5) due to traffic flow on respective roads (Figure 2). It is also evident from Figure 5 that noise levels are highest during the evening (18 – 22 h) and have the lowest noise levels during night hours (22 – 06 h) on all the urban roads at all the monitored sites. The and values are observed to be closer at majority of the sites. Further, they exhibit overlapping patterns though > at the majority (13) of the sites. The results are consistent with analysis (Figure 4) discussed in the preceding section.
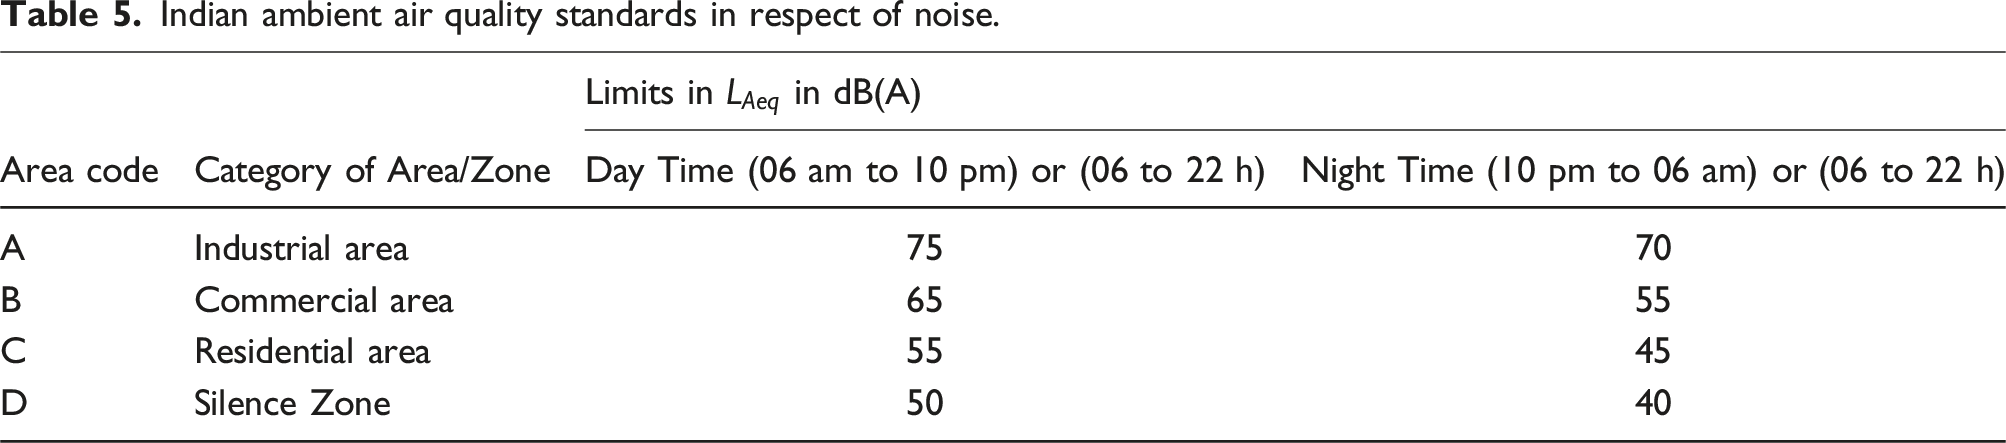
Analysis of noise indices with respect to standards
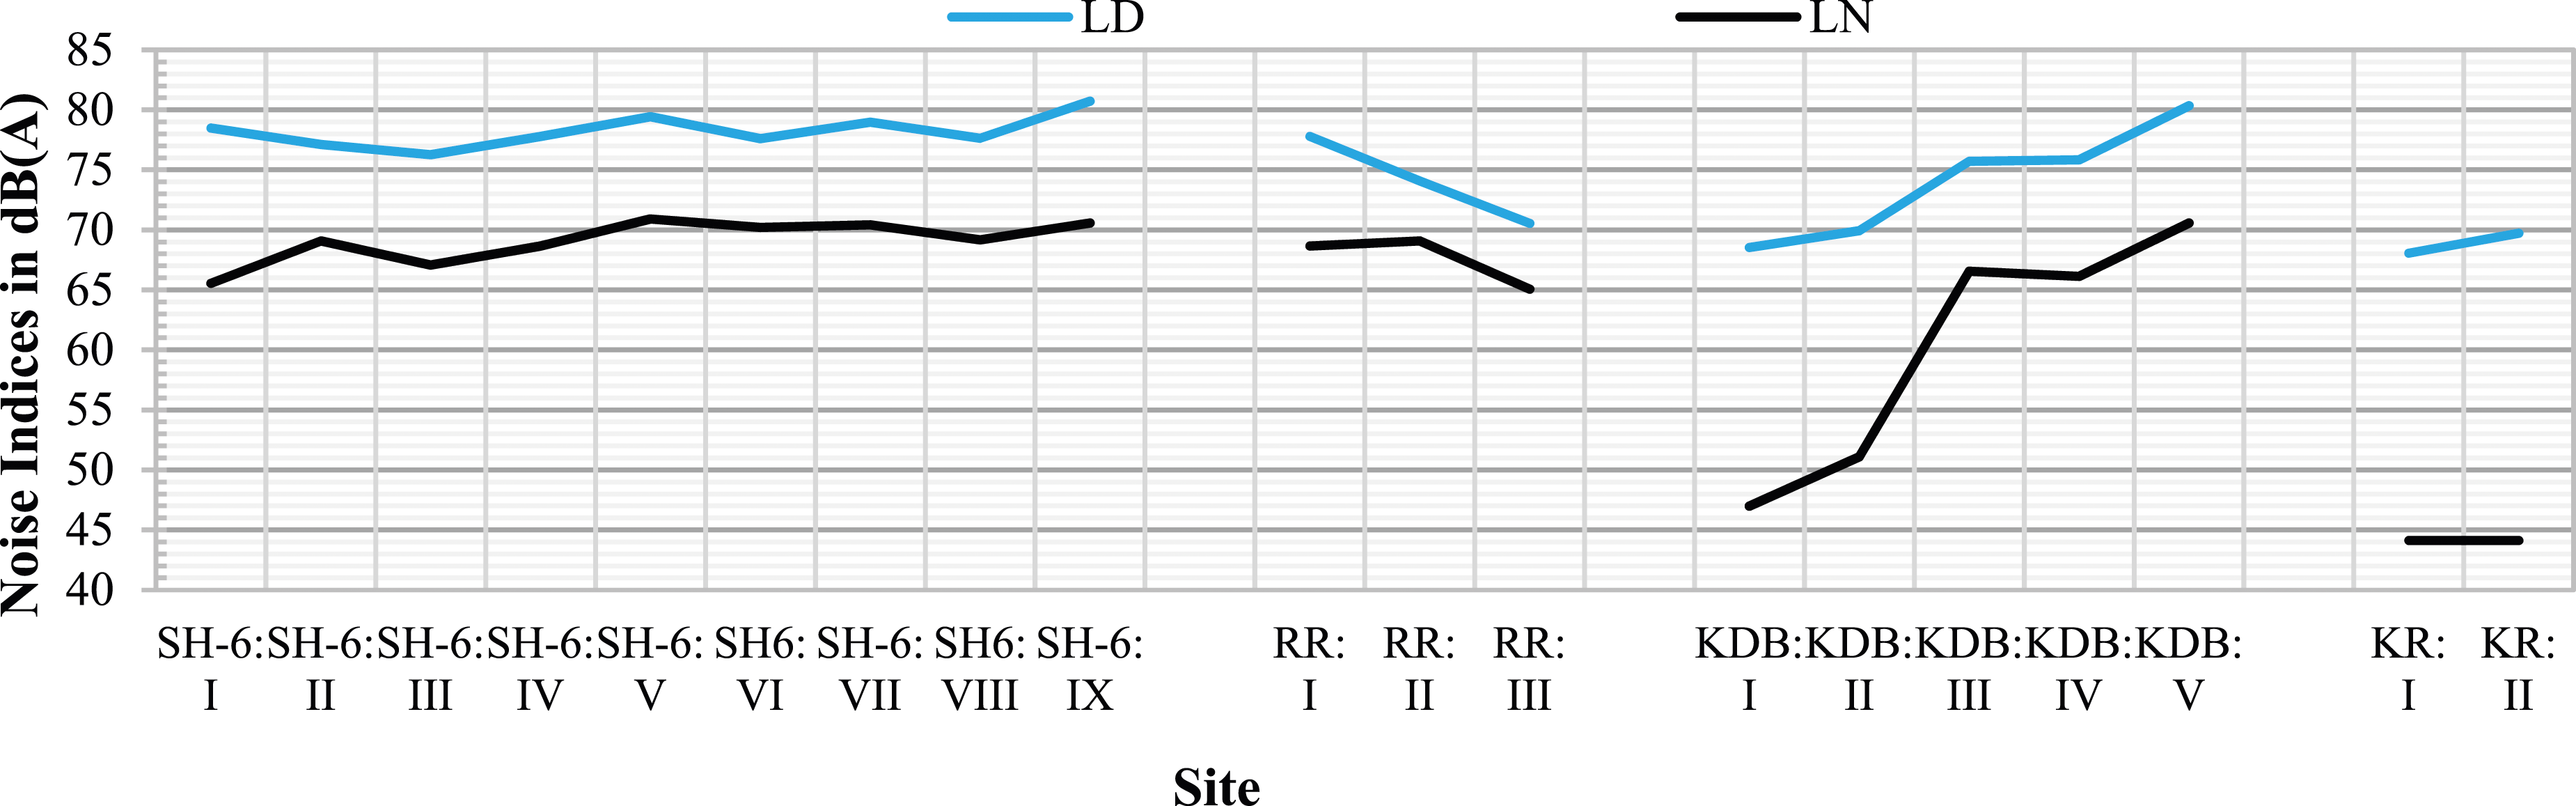
The noise indices for day-time and night-time, namely and are computed as per equation (1) and graphically presented in Figure 6 for all monitored sites on the four major urban roads of Kurukshetra city, and compared with Indian ambient air quality standards in respect of noise, reproduced in Table 5.31 The equivalent continuous sound pressure level for day time: 06 – 22 h () for sites on SH6 ranges between 76.28 and 80.73 dB(A), for RR sites between 70.54 and 77.78 dB(A), for KDB sites between 68.53 and 80.35 dB(A) and for KR sites between 68.06 and 69.70 dB(A), and thus exceeding the prescribed limits by Indian standards. The values at all the sites have also exceeded the WHO guidelines of 53 dB(A) to avoid the adverse health effects due to traffic noise levels.2 The values ( night time: 22 – 06 h) for sites on SH6 range between 65.56 and 70.91 dB(A), for RR sites between 65.06 and 69.09 dB(A), for KDB sites between 46.99 and 70.57 dB(A) and for KR sites around 44.12 dB(A), and thus exceeding the prescribed limits by Indian standards. The values at all the sites have also exceeded the WHO and UN guidelines on health and environment of 45 dB(A) for road traffic noise,2 except for the sites on KR road. Hence, immediate noise mitigation interventions are being required ranging from source and path reduction to behavioural change as outlined by WHO and UN guidelines.34
Variation of noise indices and on the four urban roads of the city.
Indian ambient air quality standards in respect of noise.
Area code
Category of Area/Zone
Limits in in dB(A)
Day Time (06 am to 10 pm) or (06 to 22 h)
Night Time (10 pm to 06 am) or (06 to 22 h)
A
Industrial area
75
70
B
Commercial area
65
55
C
Residential area
55
45
D
Silence Zone
50
40
Relationship between and traffic flow
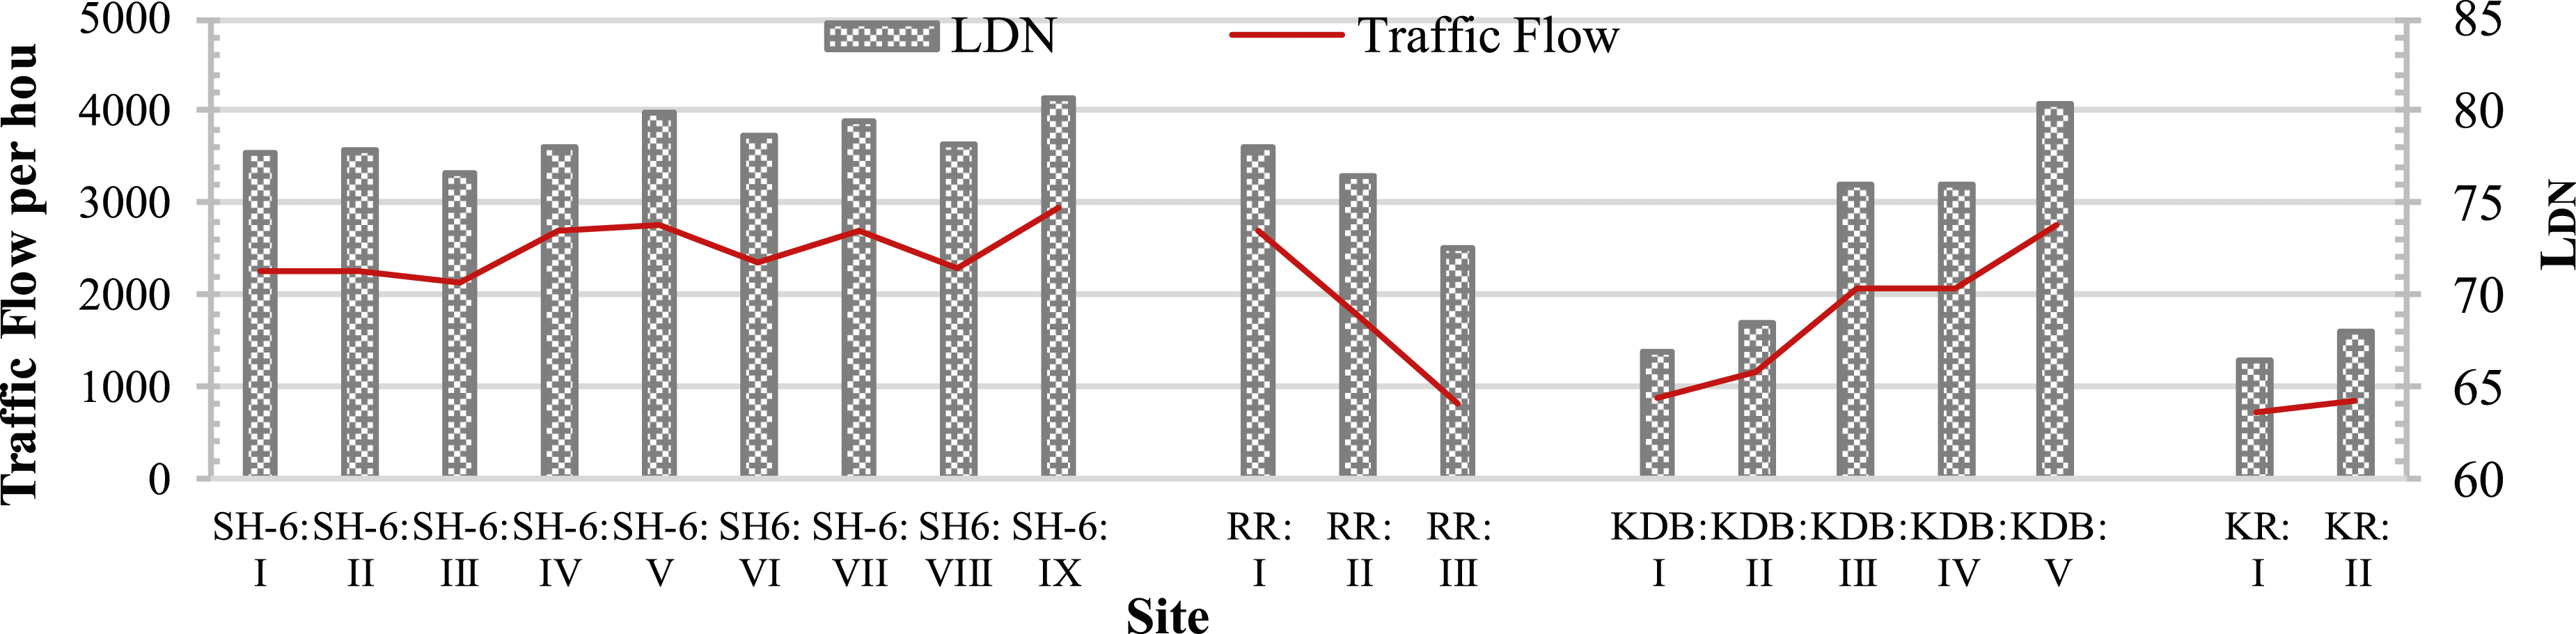
The average sound pressure level over all day and night times (that is, over 24 h), was computed for all sites and analyzed its interdependence on traffic flow, as shown in Figure 7. The values range between 66.38 and 80.68 dB(A) with an average value of 75.61 dB(A) for all sites. As per WHO guidelines, more than 70 dB(A) with a 24-h’ time base in traffic areas can cause hearing impairment.35,36 Thus, values greater than 70 dB(A) at all sites on SH6 [76.56 – 80.68 dB(A)] and RR [72.61 – 78.09 dB(A)], and three sites of KDB road (eastern portion passing through residential areas) poses a critical health effect of hearing impairment to exposed persons.
Variation of and traffic flow per hour on the four urban roads of the city.
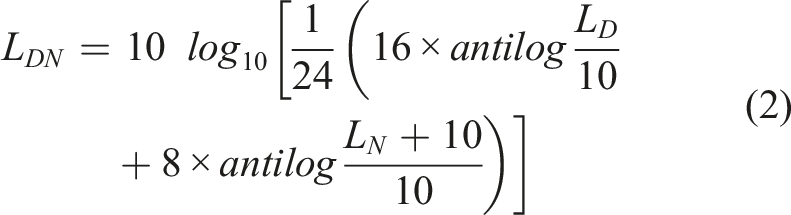
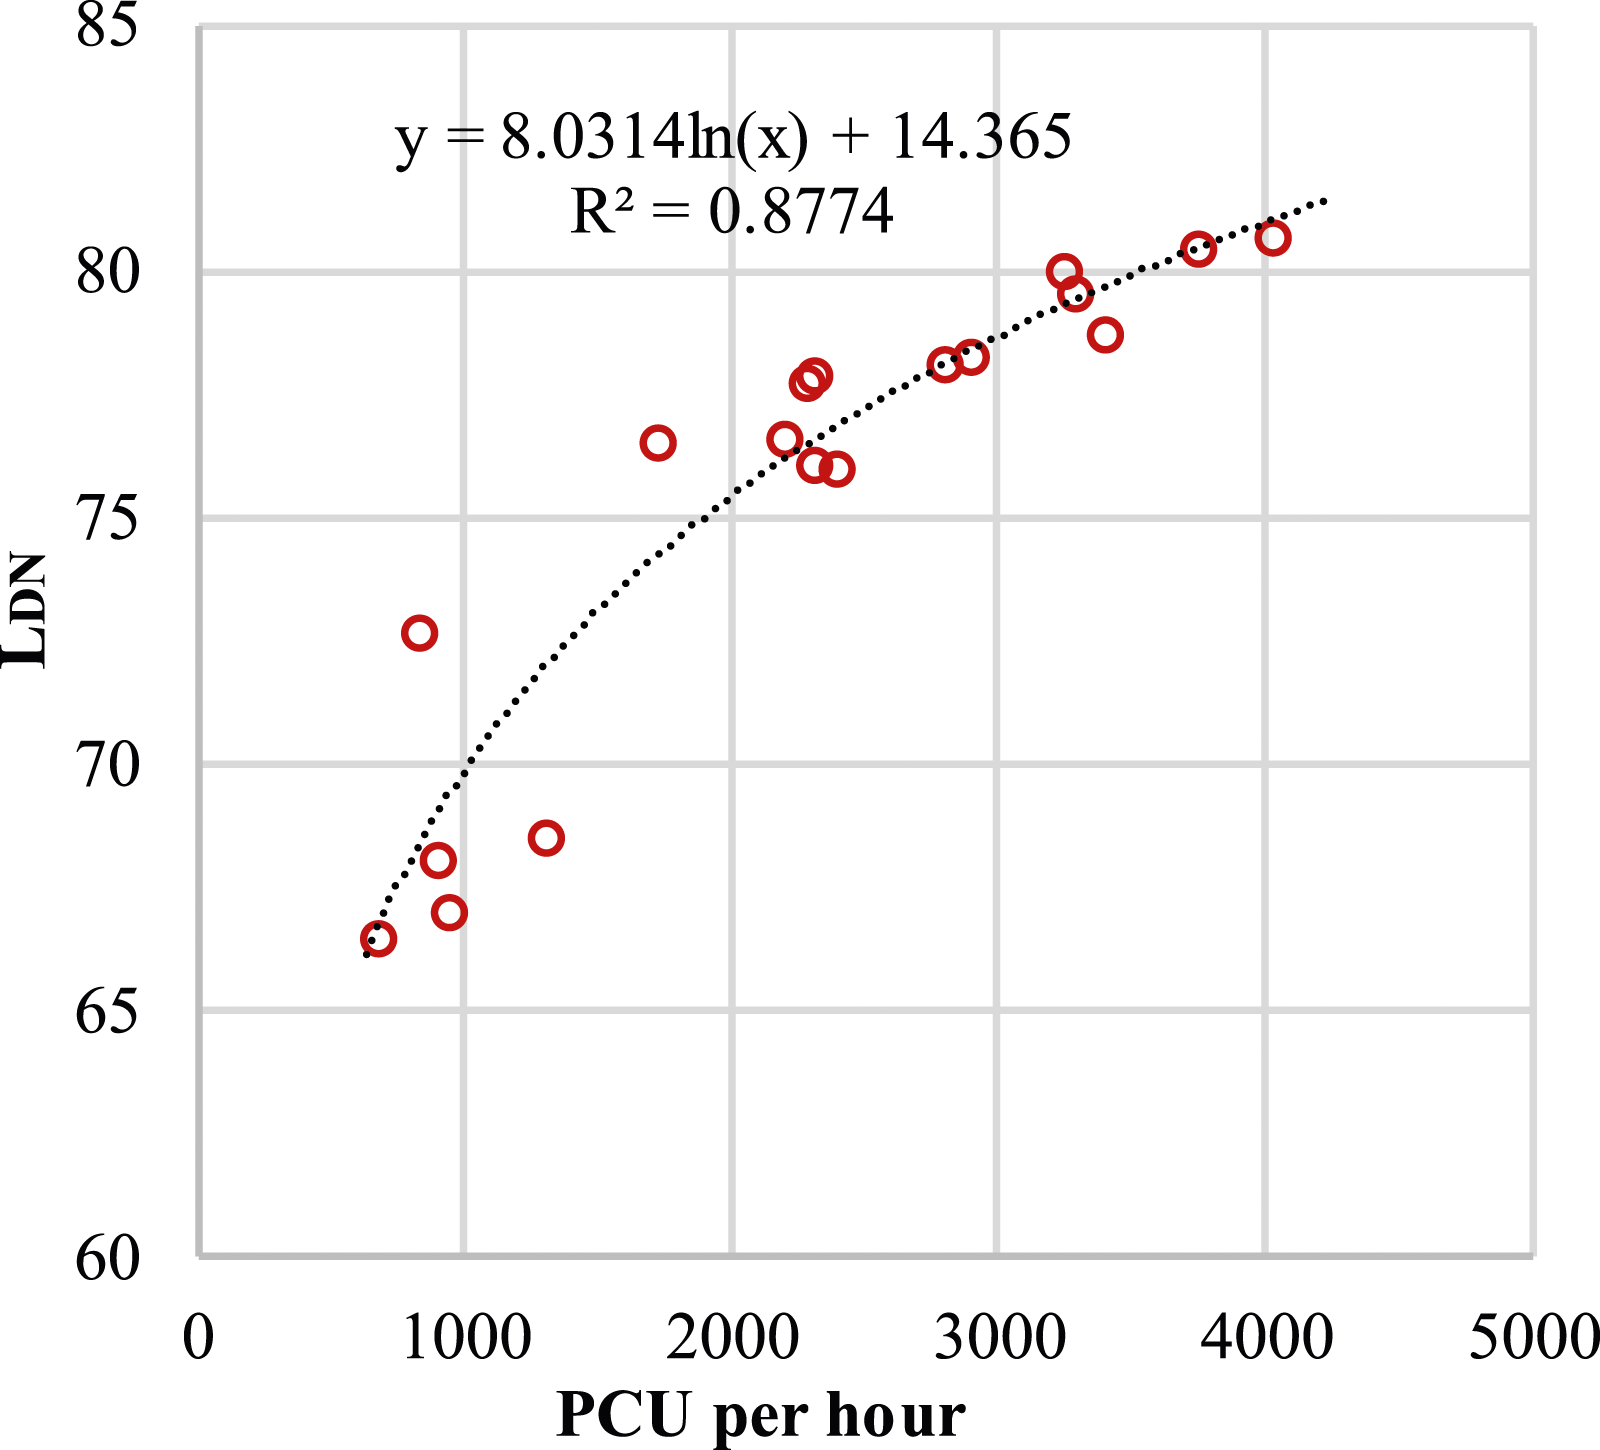
Figure 7 also reveals that traffic volume is a significant factor affecting the noise levels as is varying with traffic flow (PCU per hour). A similar finding has been reported for the Amman city of Jordan by Obaidat,19 which points towards a strong correlation between noise levels and traffic flow. Models for traffic noise predictions based on traffic flow have been reported in earlier studies but have shown unworkability for Indian cities.17 For an Indian city, Sahu et al.17 proposed three equations to predict for low-noise, medium-noise and high-noise zones respectively based on traffic flow by using multiple regression having two traffic flow variables, namely numbers and types of vehicles (heavy, light and 2-wheelers) with a high coefficient of correlation (R = 0.80 to 0.86) and coefficient of determination ( = 0.7147). In the present study, the traffic noise () prediction has been attempted from the single variable ‘PCU per hour’, which is a standard traffic flow parameter wherein the composition of vehicles has been based on Indian Roads Congress guidelines27 reproduced in Table 2. The resulting mathematical model provided a logarithmic relationship between the two parameters (Figure 8) with a high coefficient of determination ( = 0.8774) as under:
Relationship between and (PCU) per hour.
The above relationship (equation (5)) has the potential application in estimating equivalent noise levels based on day-night average sound level during a 24-h day () from traffic flow data in terms of single standard traffic flow parameter with standard vehicle composition as per IRC classification.
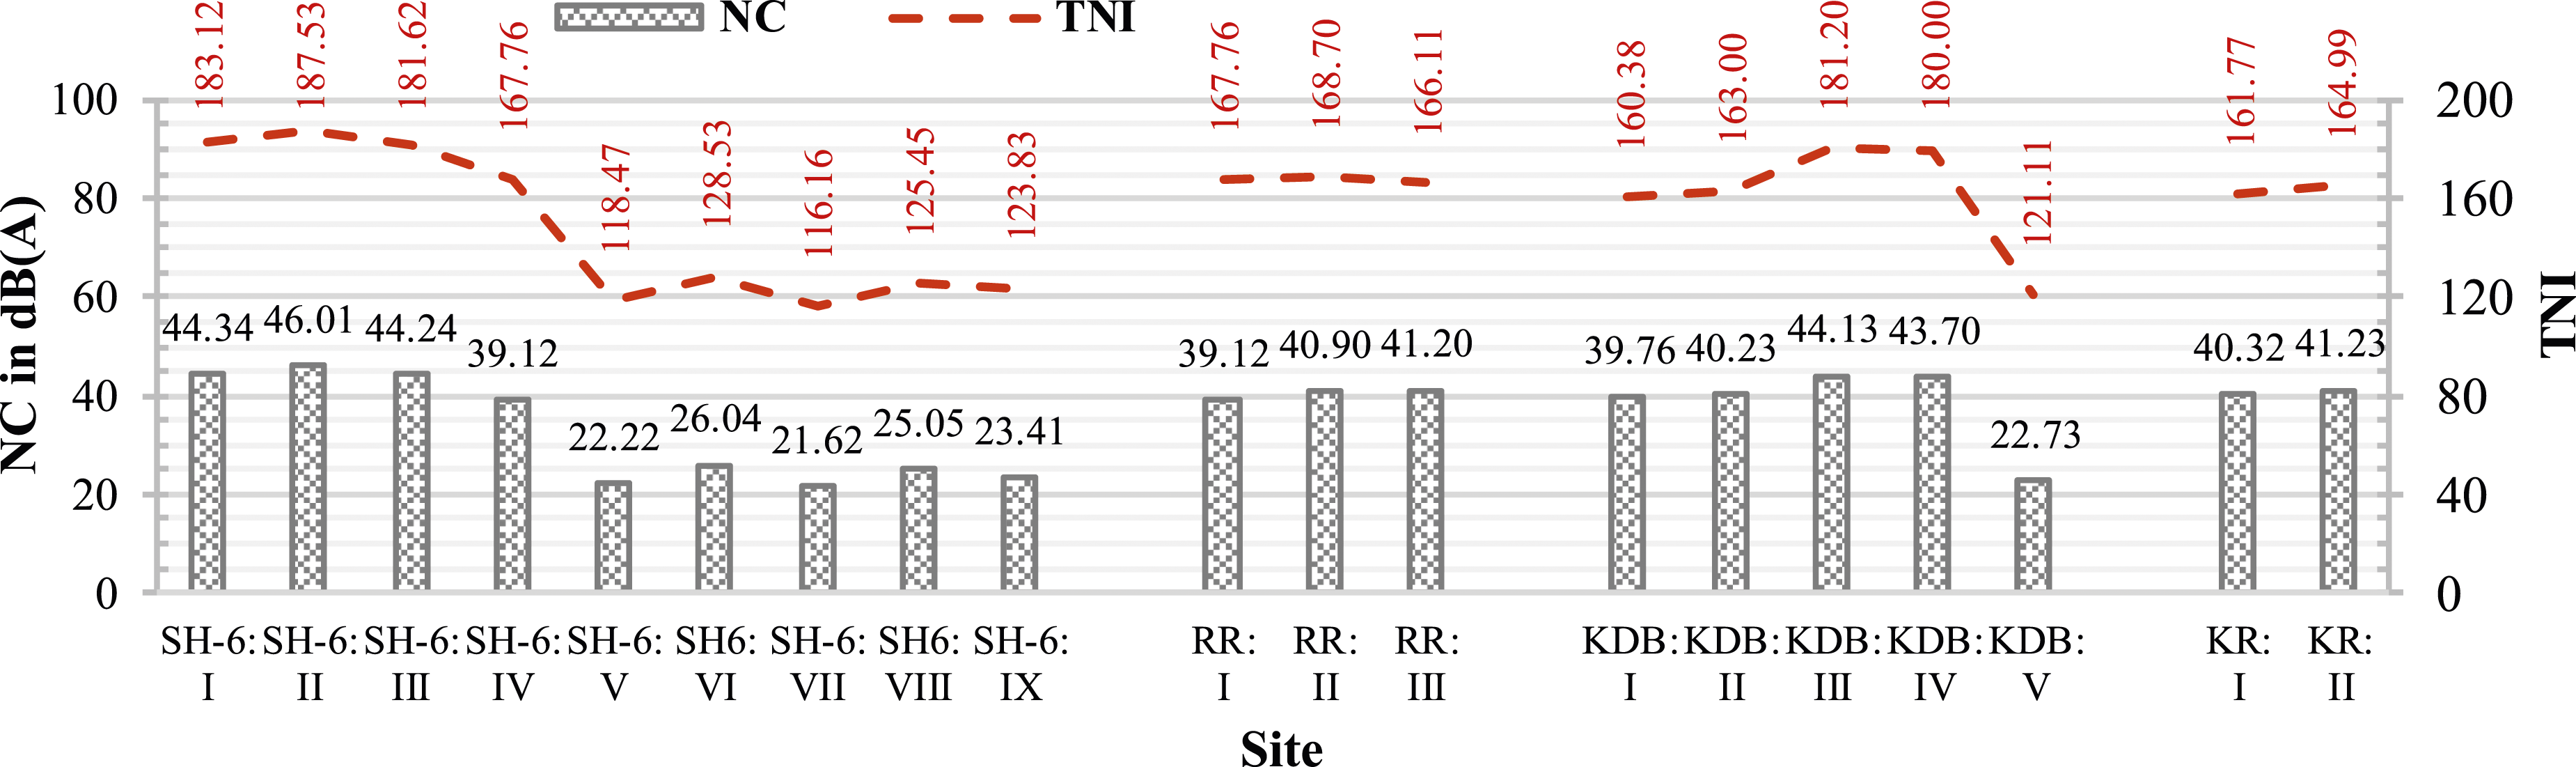
Noise climate and total noise index
The noise climate () and the traffic noise index () are often used in characterizing traffic noise. The noise climate is used to determine the range over which the noise level, in dB(A), is changing; whereas, traffic noise index measure annoyance responses to traffic or motor-vehicle noise that determines the degree of change in the traffic flow in an area. is an arbitrary constant and so does not have units of dB(A). The variation of and along all the studied urban roads exhibited similar profile. The is higher, in the range of 39.12 – 46.01 dB(A), at 13 sites – 04 of SH6, all 03 sites of RR, 04 of KDB and both sites of KR road; while for other 06 sites it is in the range of 21.62 – 26.04 dB(A). The was also observed to be higher (160.38 – 187.53) at the same 13 sites where is higher; while for the other 06 sites, it is in the range of 116.16–128.53. However, at all the sites, the exceeded the permissible limits of 74 representing a reasonable standard of amenity in present-day urban conditions.37
The results also revealed that both and are relatively quite higher on the western part of SH6 (SH6:I to IV sites) and all the RR sites in comparison to the eastern part of SH6 (SH6:V to IX sites) (Figure 9). This is due to the merging/de-merging of traffic from both roads at Gurudwara Crossing (SH6:IV or RR:I). The higher can be attributed to traffic congestion and lack of traffic management.
Variation of and on the four urban roads of the city.
Conclusion
Based on the findings of the present field study at 18 sites along the four major urban roads in Kurukshetra city, the following conclusions have been drawn:
⁃ The traffic composition was dominated by Class A vehicles, that is two-wheeler motorcycles, scooters, etc.
⁃ The variation of reflected a cyclic pattern having crests and troughs over the 24 h having two prominent noise level crests – one during 08–10 h (morning time) and the other around 18–20 h (evening time); and a prominent deep noise level trough during 02–04 h (late night) spreading over the adjoining periods.
⁃ The key noise descriptors such as , , , , , and exceeded the permissible limits at all sites, with very few exceptions, as per Indian and/or WHO guidelines.
⁃ Day-night average noise levels () exhibited a positive relationship with PCU per hour with a high value of = 0.8774.
⁃ The increased motorized vehicles and passing of State Highway 6 through the city are the major reasons for higher noise levels.
⁃ There is an urgent need for traffic and acoustic management in the city to ensure the health and safety of people.
⁃ The provision by-pass expressway outside the municipal limits of the city in place of the existing stretch of State Highway 6 in the city is suggested at the earliest.
Traffic noise pollution in urban areas has become a serious issue globally, particularly in rapidly urbanizing and motorizing developing countries like India. Thus, necessitates urban traffic noise and traffic flow studies for urban acoustic planning and traffic management.
Footnotes
Declaration of conflicting interests
The author(s) declared no potential conflicts of interest with respect to the research, authorship, and/or publication of this article.
Funding
The author(s) received no financial support for the research, authorship, and/or publication of this article.
KallankandySDeswalS. A comprehensive review of noise measurement, standards, assessment, geospatial mapping and public health. Ecol Quest2023; 34(3): 1–26. DOI: 10.12775/EQ.2023.035.
4.
PhanHYTYanoTSatoT, et al.Characteristics of road traffic noise in hanoi and Ho Chi Minh city, Vietnam. Appl Acoust2010; 71(5): 479–485. DOI: 10.1016/j.apacoust.2009.11.008.
DasPTalukdarSZiaulSK, et al.Noise mapping and assessing vulnerability in meso level urban environment of eastern India. Sustain Cities Soc2019; 46: 101416. DOI: 10.1016/j.scs.2019.01.001.
7.
World Health Organization. Burden of disease from environmental noise: quantification of healthy life years lost in Europe. Copenhagen, Denmark: World Health Organization Regional Office for Europe, 2011. https://apps.who.int/iris/handle/10665/326424
CalixtoADinizFBZanninPHT. The statistical modeling of road traffic noise in an urban setting. Cities2003; 20(1): 23–29. DOI: 10.1016/S0264-2751(02)00093-8.
12.
CarrierMApparicioPSéguinAM. Road traffic noise in Montreal and environmental equity: what is the situation for the most vulnerable population groups?J Transp Geogr2016; 51: 1–8. DOI: 10.1016/j.jtrangeo.2015.10.020.
BanerjeeDChakrabortySKBhattacharyyaS, et al.Evaluation and analysis of road traffic noise in Asansol: an industrial town of eastern India. Int J Environ Res Public Health2008; 5: 165–171. DOI: 10.3390/ijerph5030165.
SahuAKPradhanPKNayakSK, et al.Evaluation and modeling of traffic noise in Berhampur city, India. Fluct Noise Lett2020a; 19(04): 2050044. DOI: 10.1142/S0219477520500443.
18.
SahuAKPradhanMMohantyCR, et al.Assessment of traffic noise pollution in Burla town, India; an inclusive annoyance study. Sound Vib2020b; 54(1): 27–42. DOI: 10.32604/sv.2020.08586.
19.
ObaidatMT. Spatial mapping of traffic noise levels in urban areas. J Transp Res Forum2011; 47: 1711. DOI: 10.5399/osu/jtrf.47.2.1711.
OyedepoOSSaaduAA. A comparative study of noise pollution levels in some selected areas in Ilorin Metropolis, Nigeria. Environ Monit Assess2009; 158: 155–167. DOI: 10.1007/s10661-008-0570-5.
22.
FarooqiZURSabirMLatifJ, et al.Assessment of noise pollution and its effects on human health in industrial hub of Pakistan. Environ Sci Pollut Res Int2020; 27: 2819–2828. DOI: 10.1007/s11356-019-07105-7.
23.
DjercanBBubalo-ZivkovicMLukicT, et al.Road traffic noise exposure in the city of Novi Sad: trend analysis and possible solutions. Pol J Environ Stud2015; 24(3): 977–986. DOI: 10.15244/pjoes/31226.
24.
LeeEYJerrettMRossZ, et al.Assessment of traffic-related noise in three cities in the United States. Environ Res2014; 132: 182–189. DOI: 10.1016/j.envres.2014.03.005.
25.
Abdur-RoufKShaabanK. Measuring, mapping, and evaluating daytime traffic noise levels at urban road intersections in Doha, Qatar. Future Transp2022; 2: 625–643. DOI: 10.3390/futuretransp2030034.
26.
PandyaGH. Urban noise-a need for acoustic planning. Environ Monit Assess2001; 67: 379–388. DOI: 10.1023/A:1006326705915.
HanXHuangXLiangH, et al.Analysis of the relationships between environmental noise and urban morphology. Environ Pollut2018; 233: 755–763. DOI: 10.1016/j.envpol.2017.10.126.
PaviottiMVogiatzisK. On the outdoor annoyance from scooter and motorbike noise in the urban environment. Sci Total Environ2012; 430: 223–230. DOI: 10.1016/j.scitotenv.2012.05.010.
31.
SinghCDeswalS. Status and noise reduction analysis of robotics lab in an academic institute by using acoustic materials. Noise Vib Worldw2023; 54(9): 469–476. DOI: 10.1177/095745652311930.
32.
BhosaleBJLateANalawadePM, et al.Studies on assessment of traffic noise level in Aurangabad city, India. Noise Health2010; 12(48): 195–198. DOI: 10.4103/1463-1741.64971.
33.
PalDBhattacharyaD. Effect of road traffic noise pollution on human work efficiency in government offices, private organizations, and commercial business centres in Agartala city using fuzzy expert system: a case study. Adv Fuzzy Syst2012; 2012: 1–9. DOI: 10.1155/2012/828593.
KallankandySDeswalS. Assessment of noise pollution levels in an academic area of an engineering institute in India. J Eng Manag Inf Technol2024; 2(3): 147–160. https://jemit.aspur.rs/archive/v2/n3/6.pdf