
Abstract
Simultaneous measurements of main arterial roads inside the urban perimeter of Kurukshetra City (Haryana, India) regarding noise levels, traffic flow, and vehicle composition were taken and then used to develop some Traffic Noise Models (TNMs) to predict equivalent noise levels (
Introduction
Excessive noise can be annoying and increase the risk of various health problems, such as ischemic heart disease (IHD), hypertension, sleep disturbance, headache, vertigo, bowel disturbances, hearing impairment, speech impediments, tinnitus, cognitive impairment, mental health problems, and adverse birth outcomes.1–3 Increasing road traffic in urban areas globally has become a serious noise pollution issue affecting the health and quality of life of urban residents.4–6 According to an estimate, about one million healthy years of life are being lost annually to ill health, disability or early death in Western European countries due to traffic noise.
7
This necessitates periodic evaluation and 24-h monitoring of urban traffic noise. However, the measurement surveys are time and cost-intensive, and can only be performed on existing roads. In such a scenario, the development of a Traffic Noise Model (TNM) for the prediction of noise levels for urban areas has become necessary for the traffic management on the existing arterial road network of the city as well as in the designing of new road infrastructure so that the wellbeing of the residents be maintained. A well-developed model not only minimizes the measurement surveys but it can also be used in varying traffic conditions by just tuning or calibrating the model.
8
Several TNMs have been developed and reported from all over the world representing and accounting for the peculiarities of the area, such as traffic volume, vehicle typologies, carriageway width, features of urban roads, queue length, the distance between the carriage and receivers, human behaviour, traffic regulations, honking, weather features, etc.
9
However, all the TNMs have usually taken into account traffic flow, with or without vehicle typologies, for predicting noise levels in terms of equivalent noise levels (

India is a fast urbanizing country, with the third largest road network globally, had 326.3 million vehicles on its roads in 2022, increasing by over 7% annually.21,22 As a consequence, traffic noise has significantly increased in Indian cities in the past decade. An increase of 5-6 db(A) from 2012 to 2019 has been reported in Nagpur City (India). 20 This motivates the authors to develop TNMs in the context of a mid-sized developing city in India and also to employ advanced machine-learning models for the development of TNMs. Thus, the objectives of this study are: (i) to develop a mathematical TNM and investigate its adequacy to predict equivalent noise levels due to urban traffic flow through, taking as a case study of four urban arterial roads of a medium-sized city in India, (ii) to compare the developed mathematical model to four other well-known and widely used TNMs to verify its applicability to the Indian conditions, (iii) to use three machine-learning based TNMs (namely M5 model tree, random forest and support vector machines), and (iv) to explore the versatility of developed mathematical TNM in predicting standard noise descriptors used in national and international standards. The novelty of the present study is that the traffic flow with simultaneous traffic noise data used in the development and validation of TNMs represents the whole day (24 hours), and the vehicle typology/class has been as per the Indian Road Congress (IRC) guidelines. 23
Materials and methods
Kurukshetra – a mid-sized city spread over an area of about 48 km2 with an estimated population of about 0.113 million has been selected for the present work. The data set of a recently conducted traffic assessment study of four arterial roads of Kurukshetra City from August 2023 to January 2024 24 has been used in this work. The contents related to the study area, materials and computations summarized below.
Study area
Kurukshetra is a historical and holy city in the state of Haryana (India) located in the Indo-Gangetic plains with a flat terrain at an elevation of around 250 m above mean sea level. Its climate falls under the ‘Cwa’ category as per the Koppen-Geiger classification.
25
The city is well connected to other parts of the state and country through railway and roadway networks. National Highway-44 (NH44) passes along the eastern periphery of the city, and State Highway-6 (SH6) passes right through the heart of the city and crosses the NH44 at the eastern side of the city. Due to SH6, vehicular traffic through the city is very high due to inter-city and inter-state road traffic augmenting the city traffic. The city has experienced substantial population, economic and infrastructural growth in the last few years, which is adversely impacting the vehicular traffic emissions leading to increased traffic flow, traffic congestion, and non-uniform and heterogeneous traffic flow patterns. The vehicle typology includes bicycles, cycle-rickshaws, E-rickshaws, motorized 2-wheelers, motorized 3-wheelers (auto-rickshaws), cars, vans, jeeps, buses, trucks, tractor-trailers, horse-driven carts (tonga), etc. Monitoring locations with varying traffic flow properties are selected for the data collection on the four arterial roads of the City, namely State Highway-6 (SH6), Railway Road (RR), KDB Road (KDB) and Brahmsarovar-NIT Road (BN) having nine, three, five and two monitoring locations respectively as shown in Figure 1. All the arterial roads have flexible pavement with smooth texture at all the monitored locations, and are 4-lanes 2-way divided roads having road width or distance of observation point to center of the road/carriageway ( Layout of studied arterial roads of Kurukshetra City depicting monitored locations.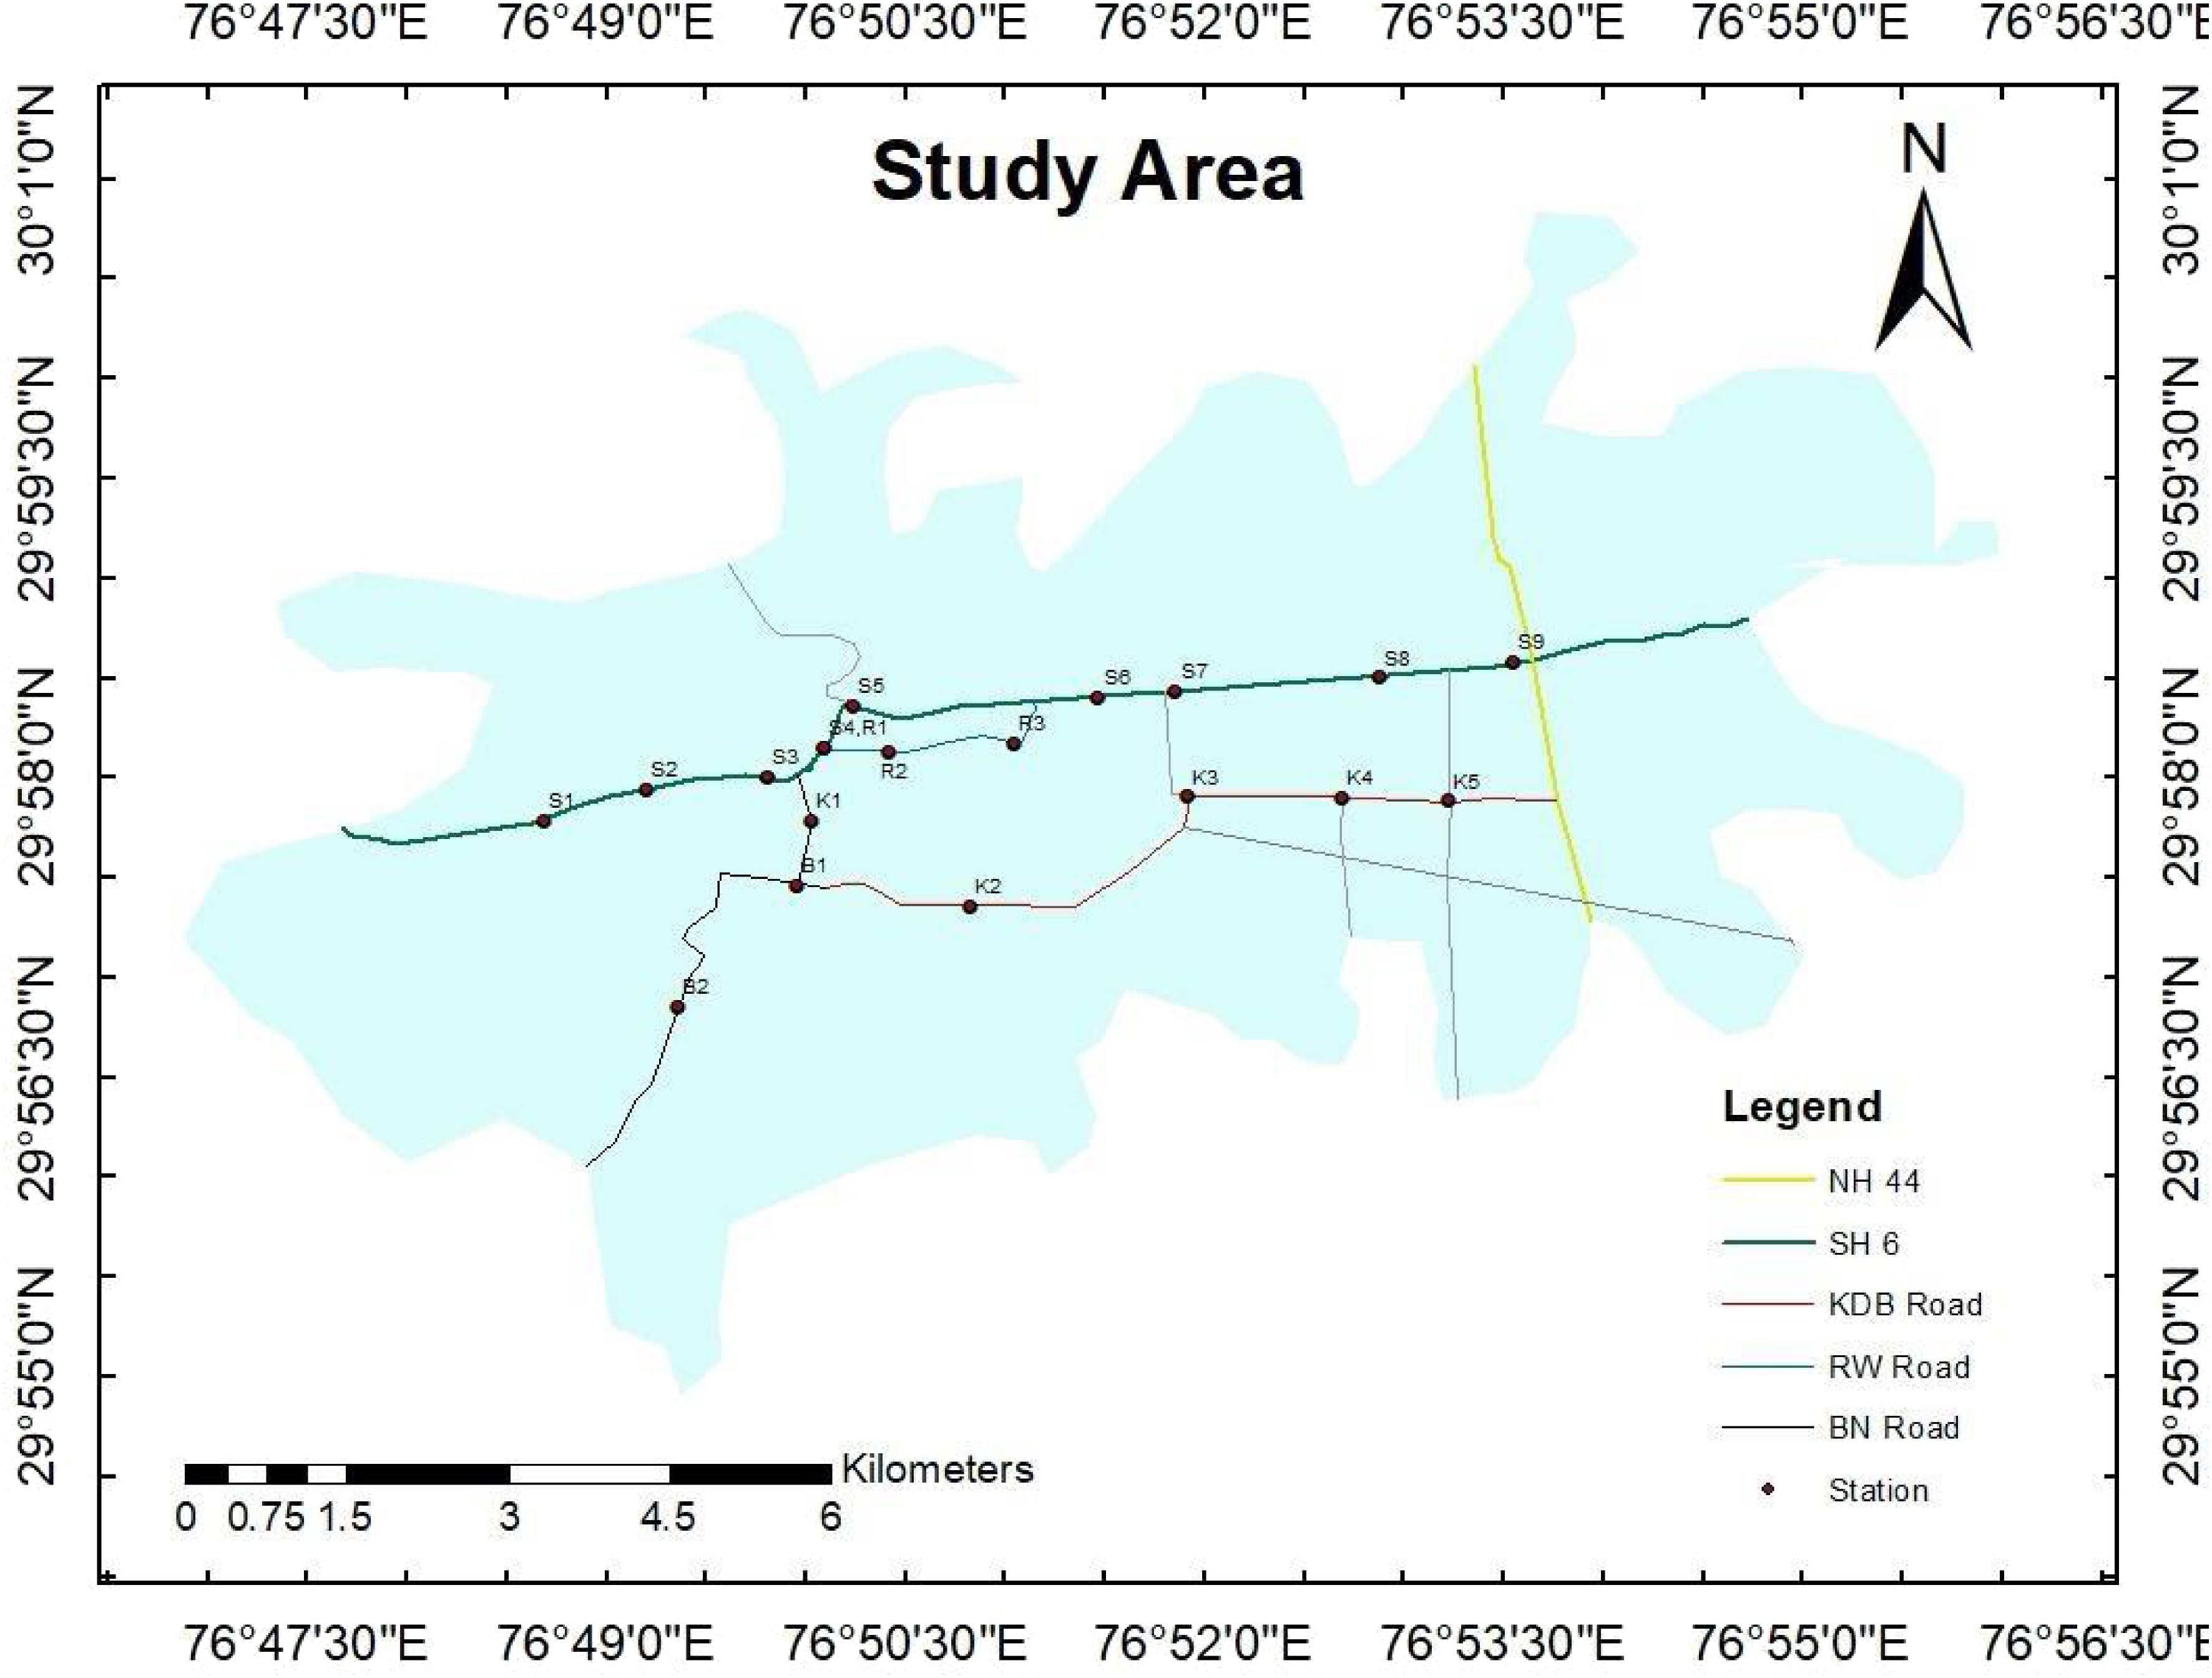
Data collection and organization
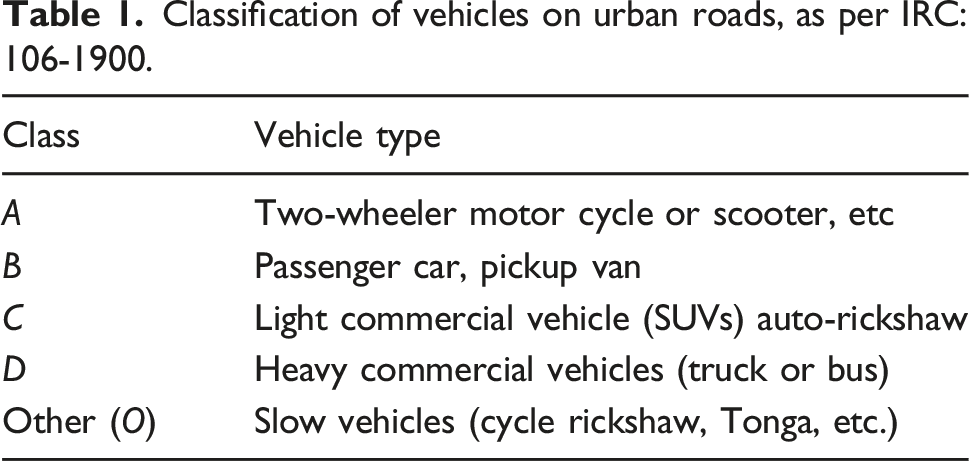
Classification of vehicles on urban roads, as per IRC:106-1900.
Selection of input variables
For model development, the data set is divided randomly to include around 70% for training (i.e. 168 samples) whereas the rest (i.e. 60) is for testing the developed models. The test data comprised of monitored noise levels (
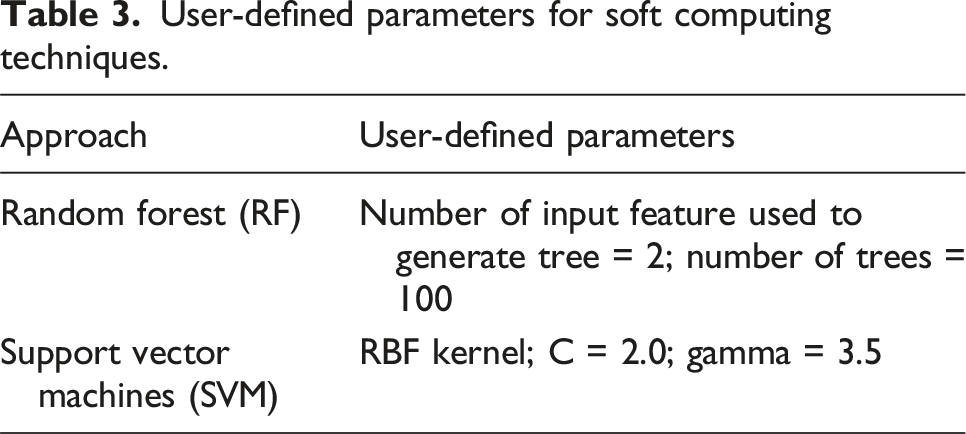
Three machine-learning algorithms namely M5 model tree, random forest (RF) and support vector machines (SVM) were used to predict the noise levels. In the case of machine-learning models, optimal values of user-defined parameters are obtained by trial and error method. The performance of the model is evaluated for each iteration based on statistical parameters, namely correlation coefficient (
Results and discussion
This section primarily focuses on – variation of equivalent noise levels (
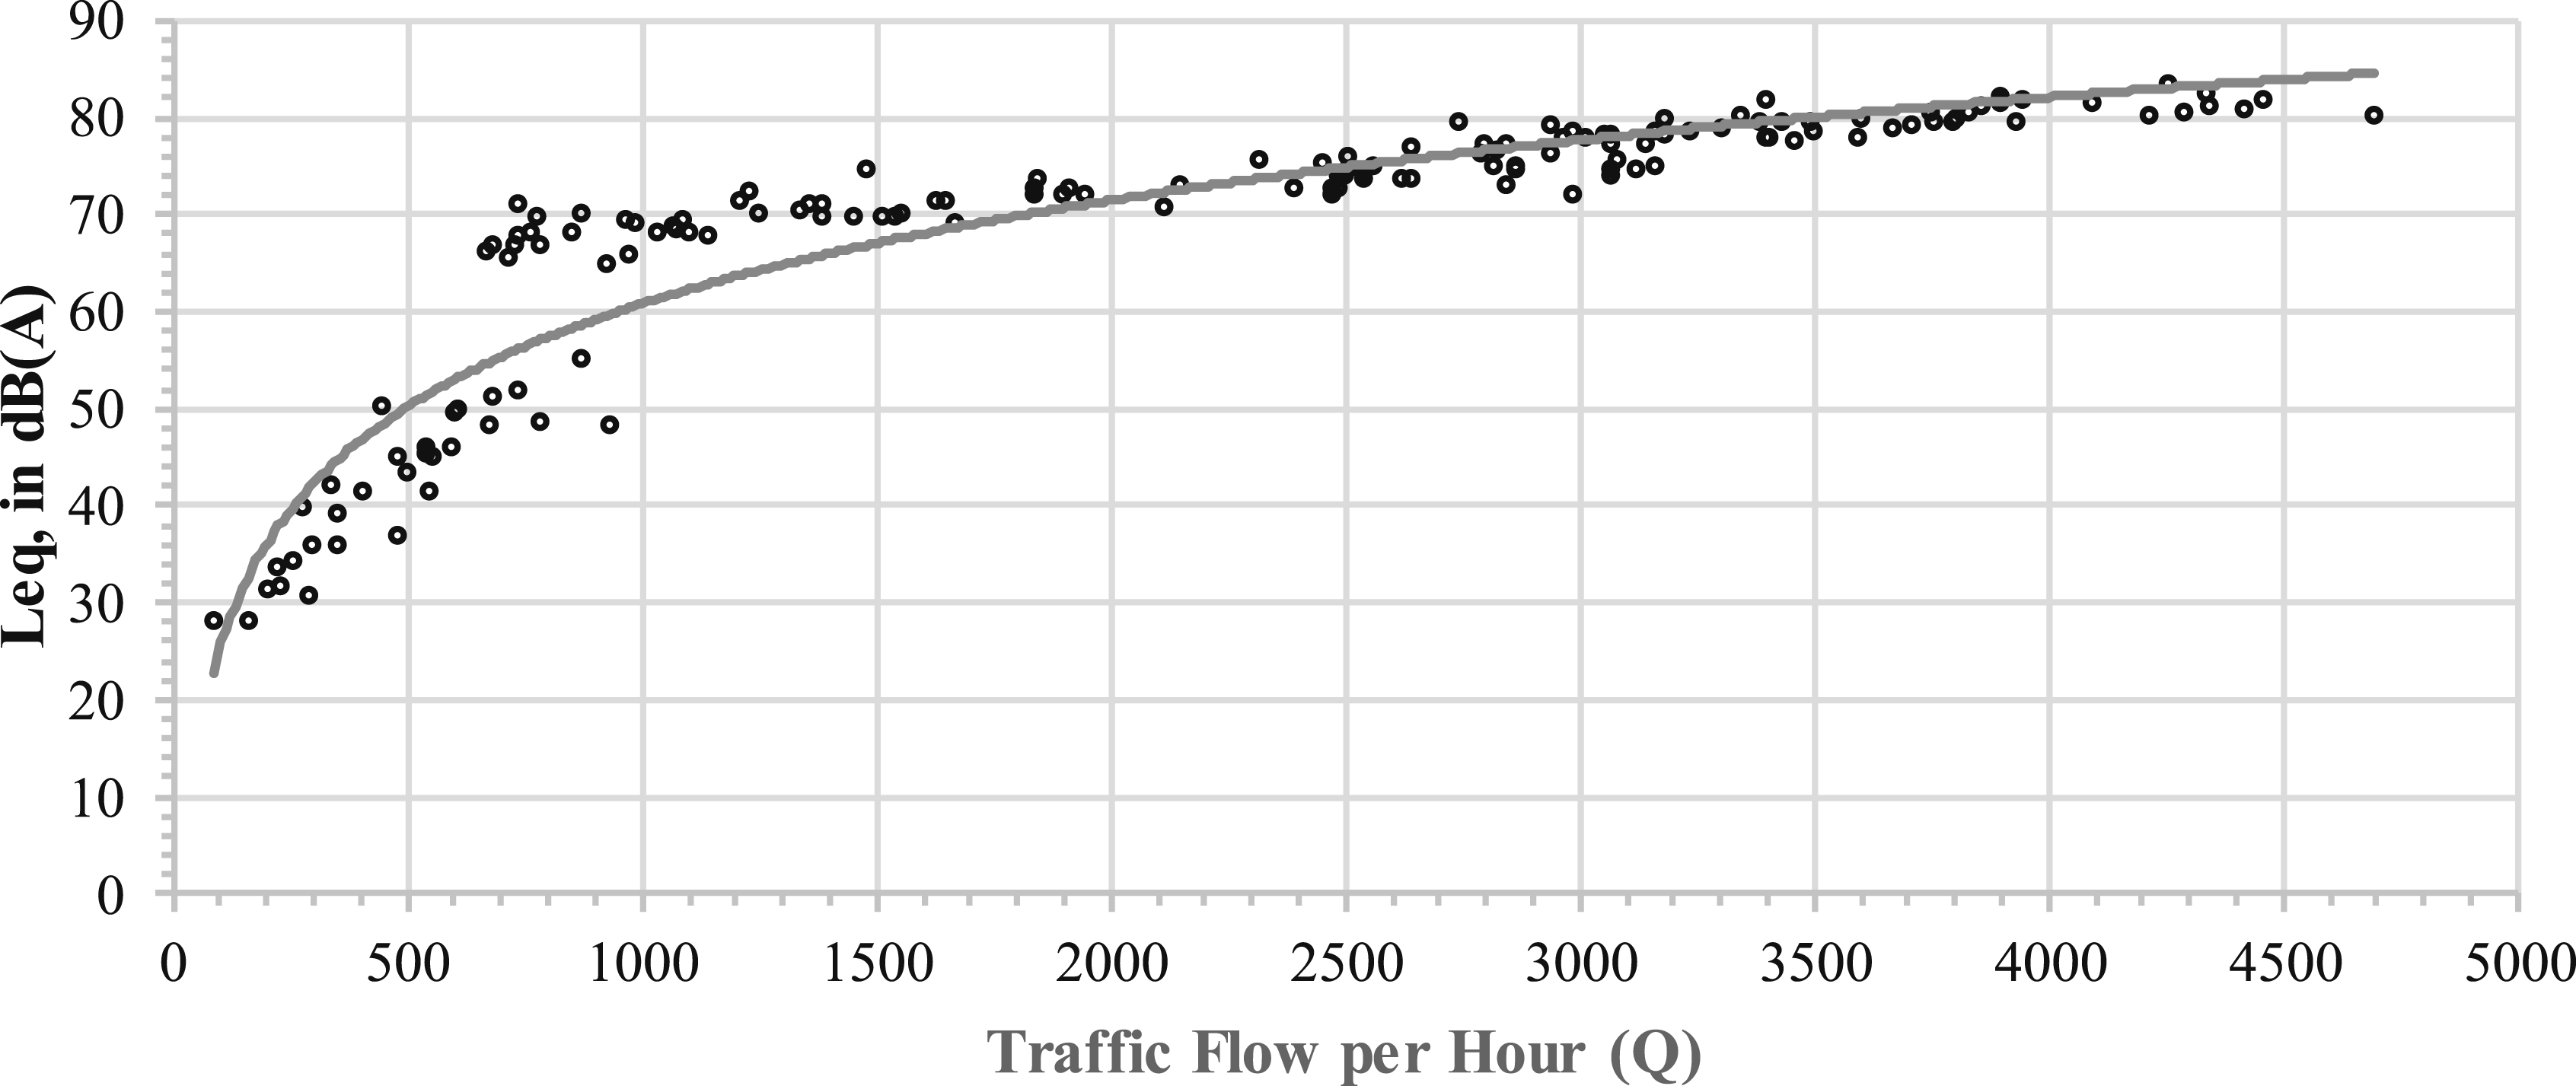
Variation of noise levels with traffic flow
The measured Equivalent noise levels (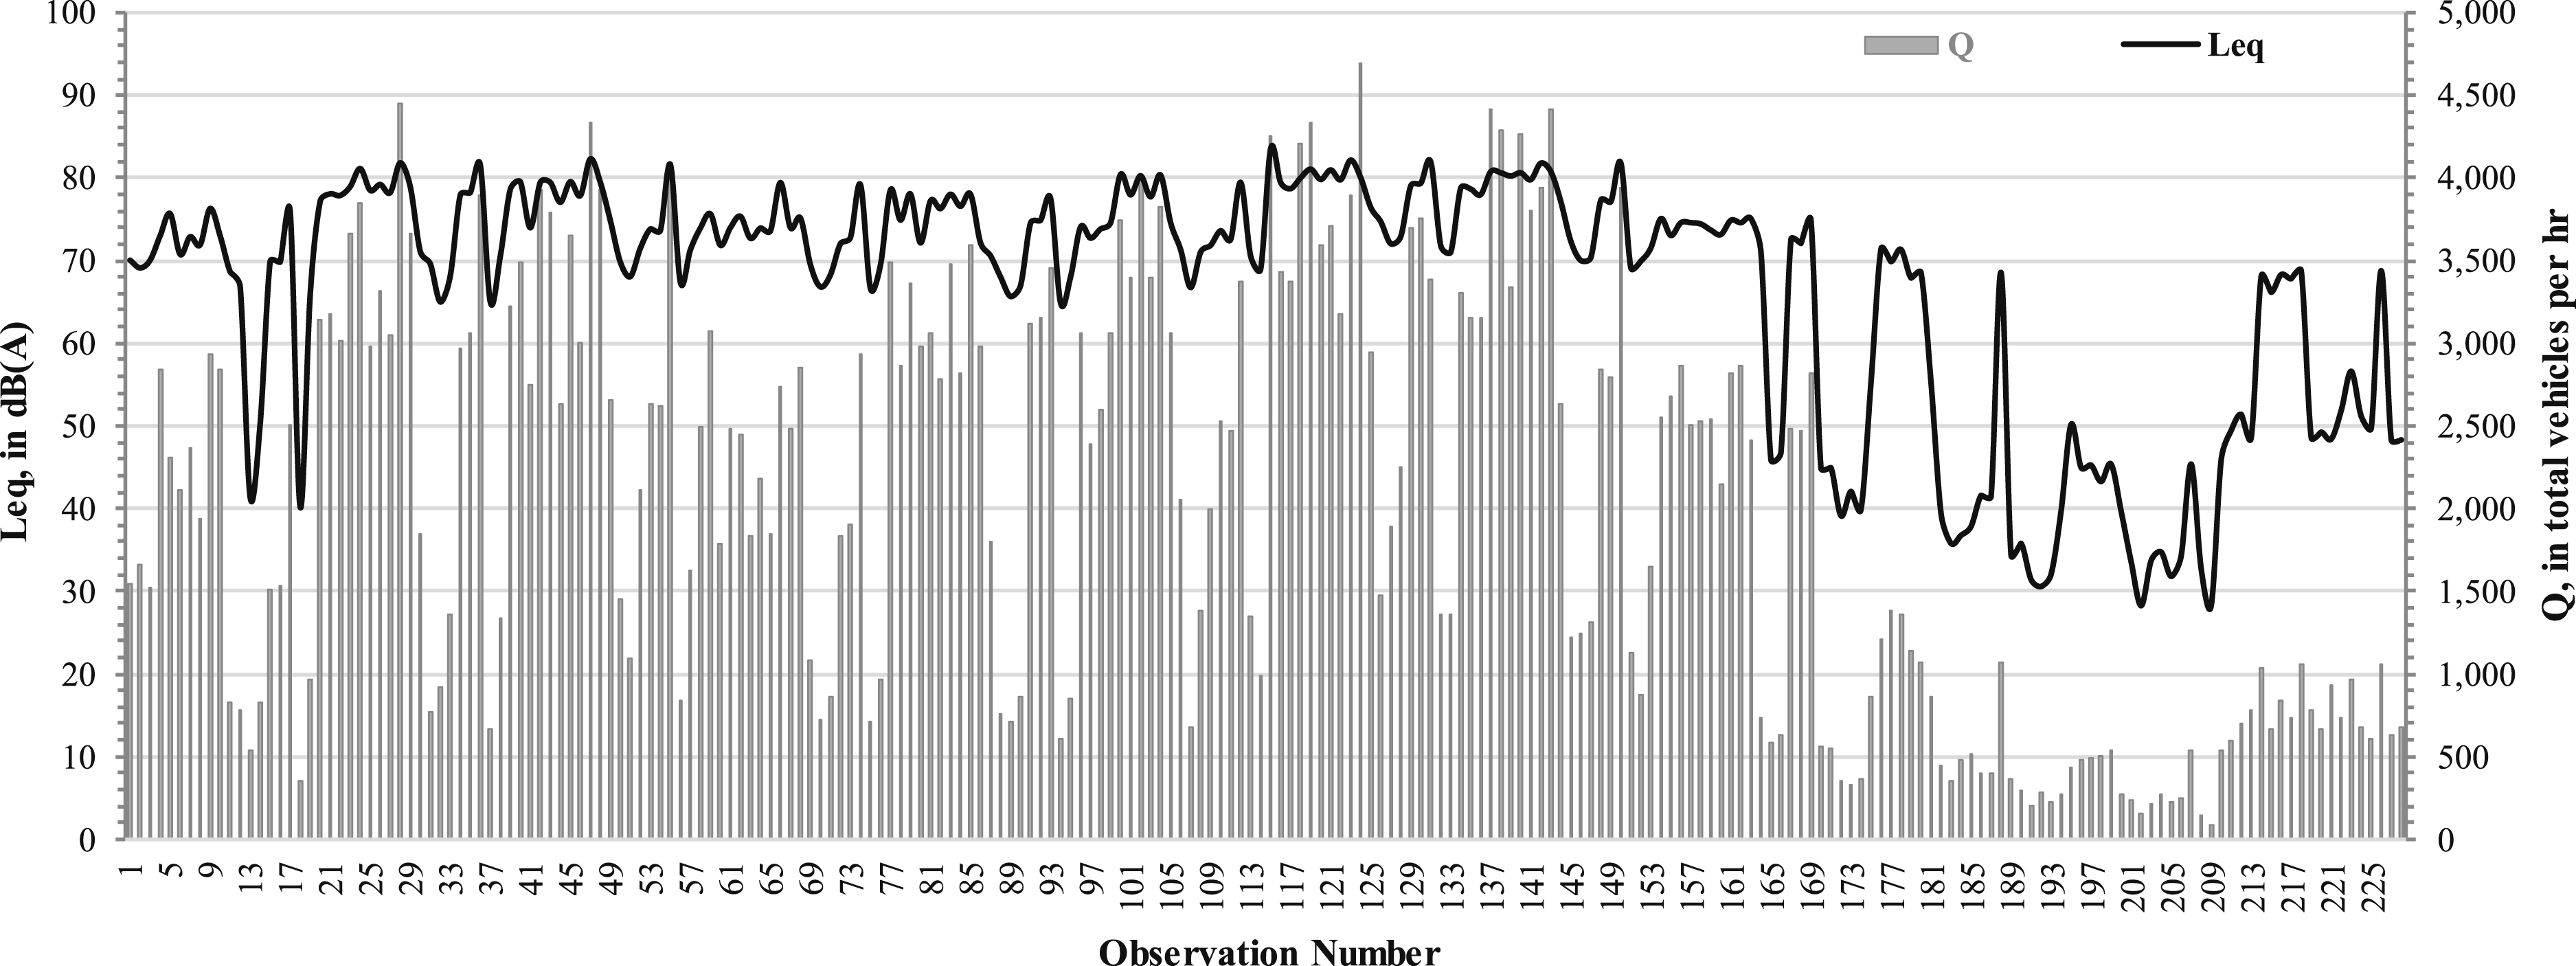
Development mathematical TNM
Hourly Graphical representation of developed mathematical TNM (2) using training data set.
The TNM (2) is then tested on the test data set and measured Testing of developed mathematical TNM (2) on test data set.
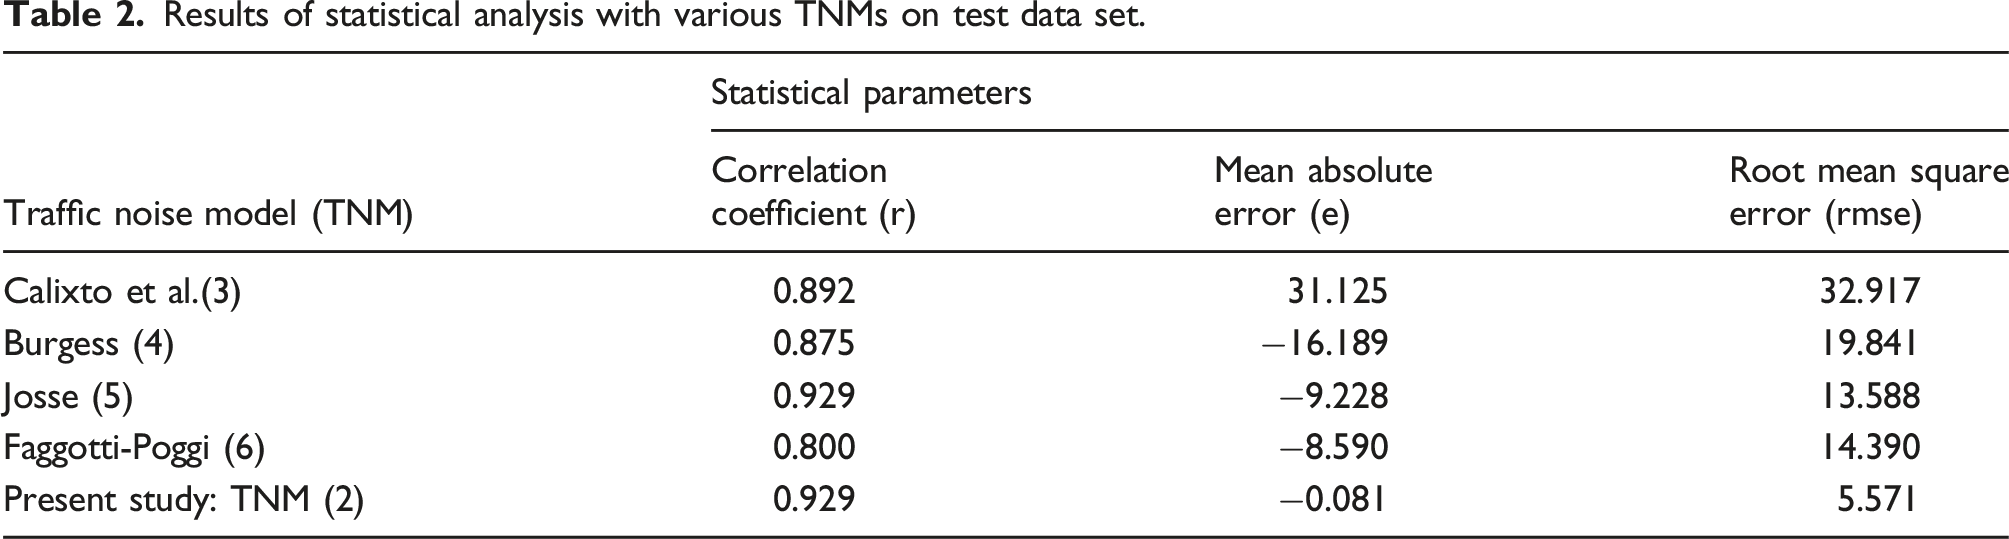
Comparison with other models
The reported mathematical TNMs have also adopted
Calixto et al. model
26
:
Burgess model
11
:
Josse model
12
:
Fagotti-Poggi model
27
:
Results of statistical analysis with various TNMs on test data set.
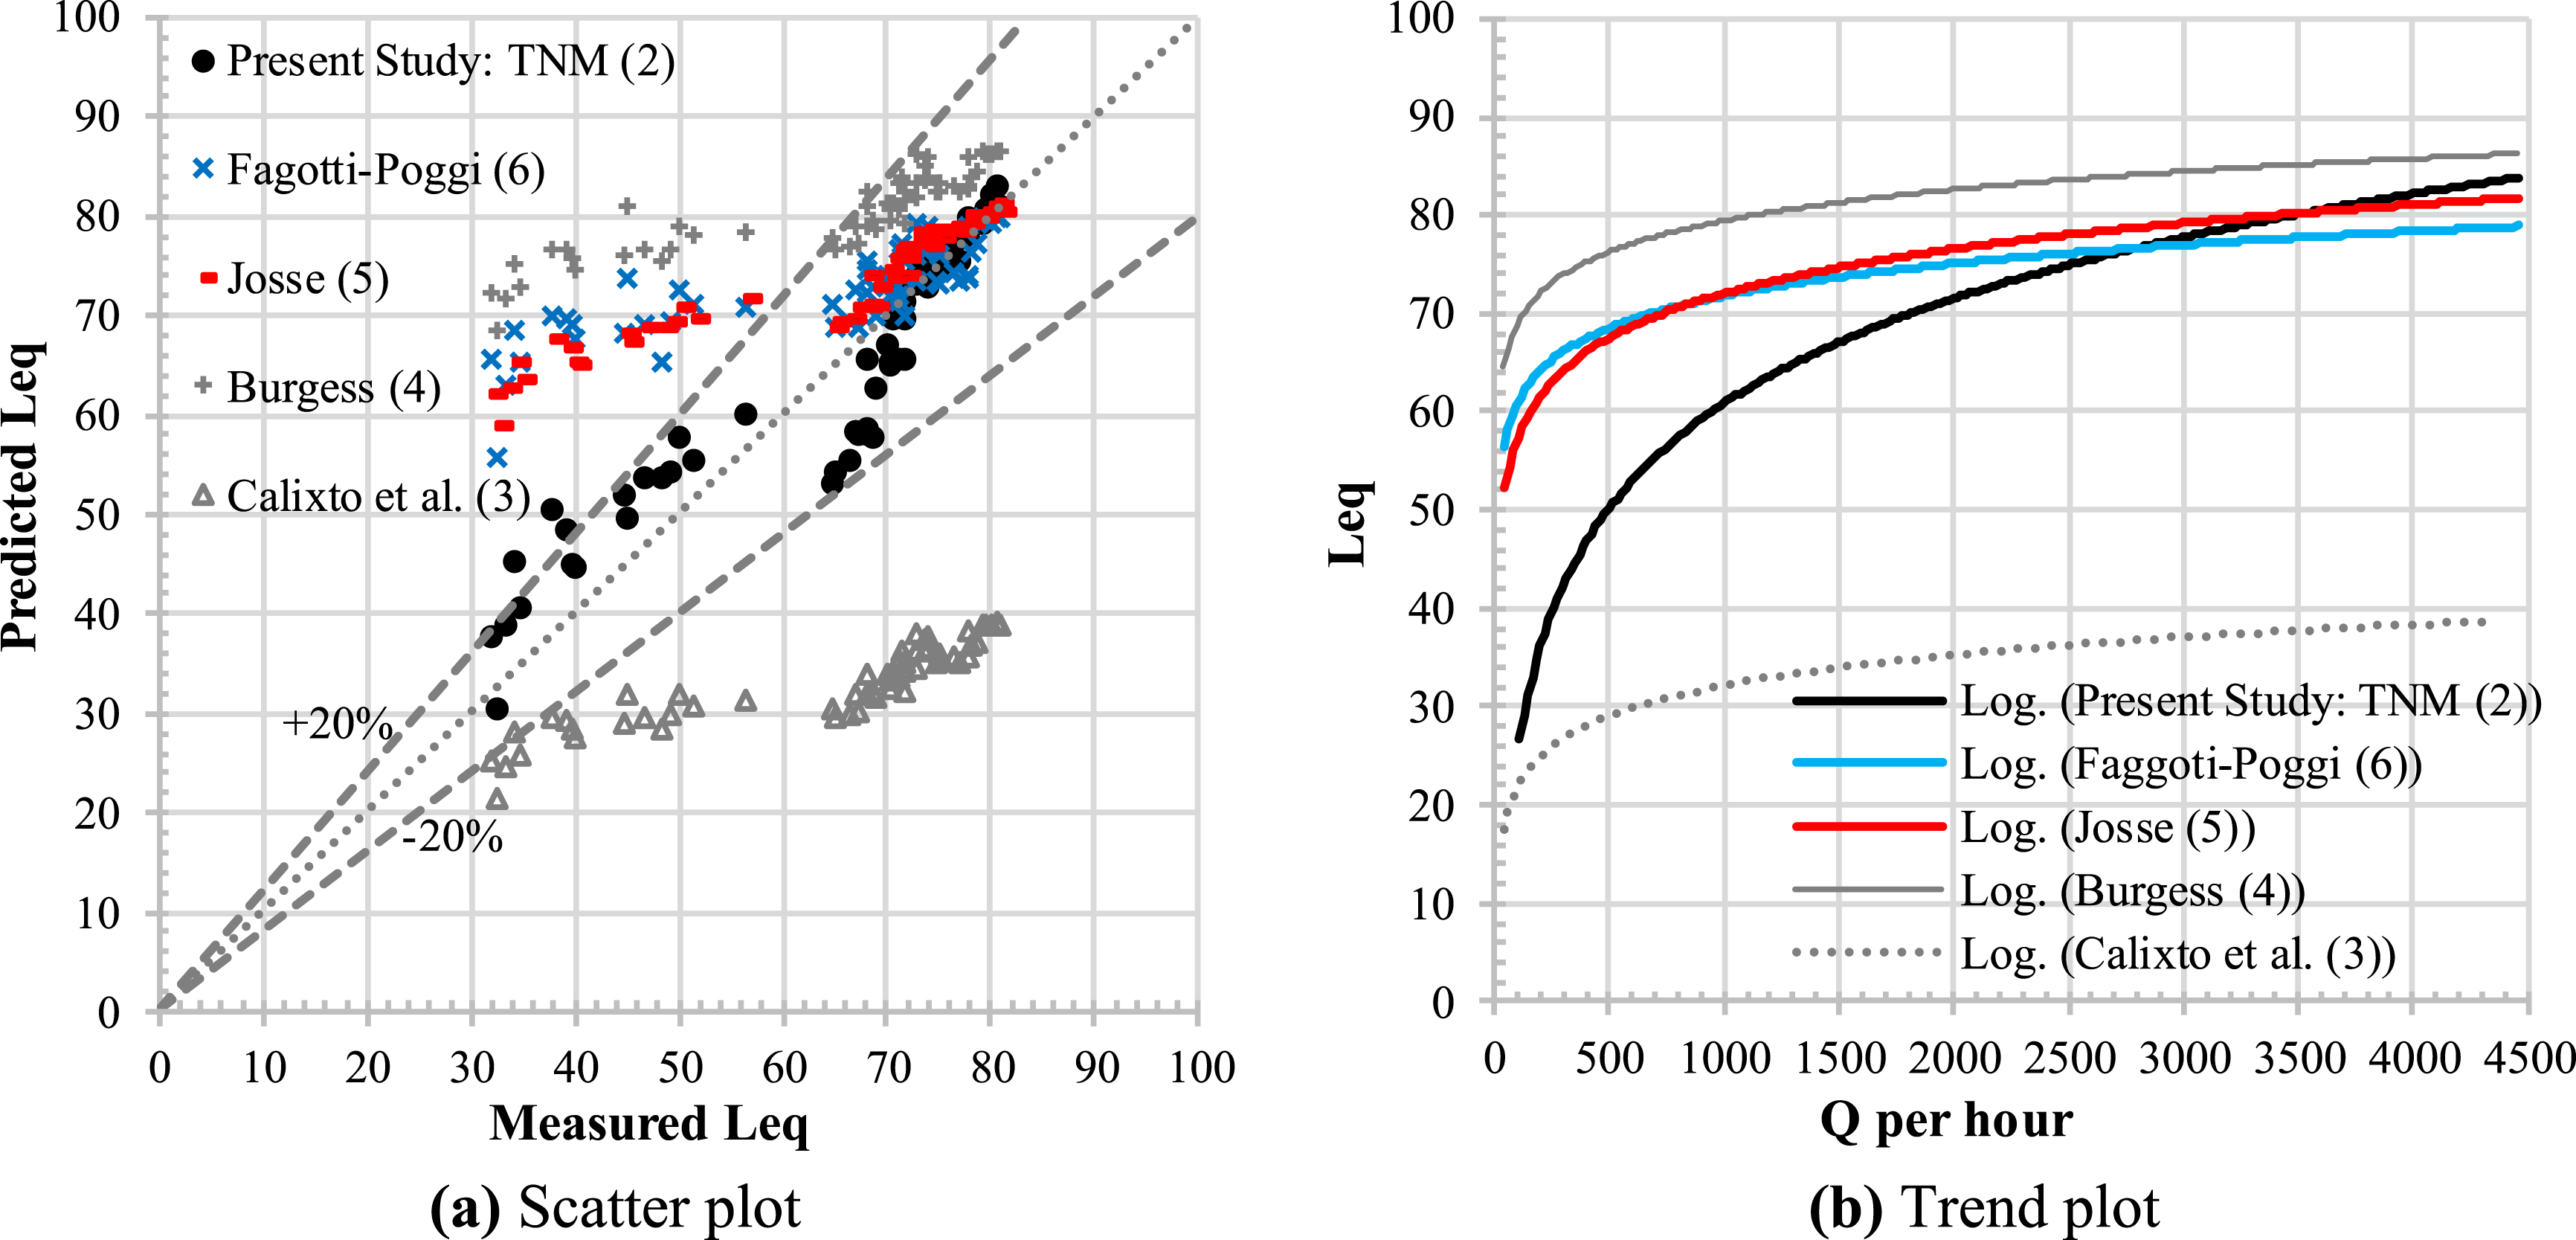
Scatter and trend plots of mathematical TNMs on test data set.
Machine-learning based TNMs
User-defined parameters for soft computing techniques.
Results of statistical analysis of machine-learning based TNMs on test data set.
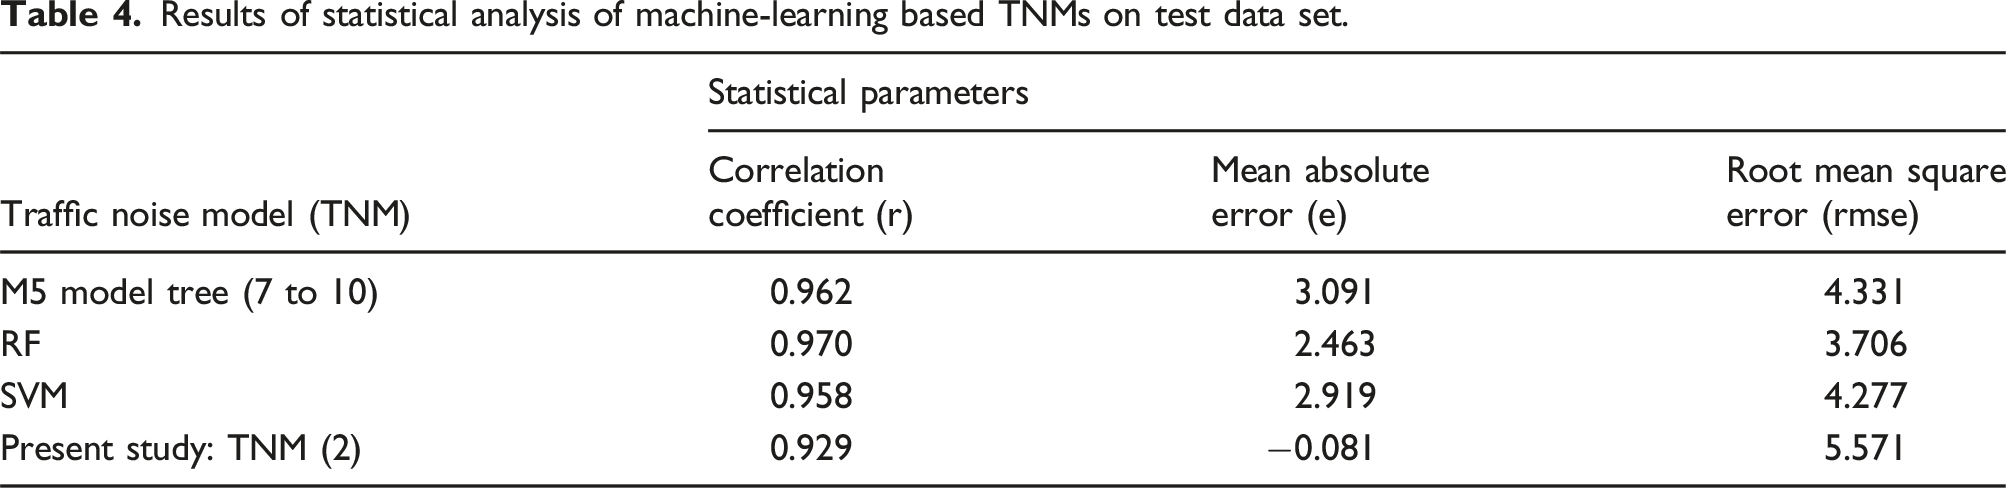
All the three machine-learning TNMs have performed well on the test data set with comparable statistical results in comparison with mathematical TNM (2). The scatter plot (Figure 6) shows majority of predicted values within ±20% for all the three machine-learning models. Thus, exhibiting the potential application of all the three machine-learning techniques in the development of TNMs. Scatter plot of machine-learning based TNMs on test data set.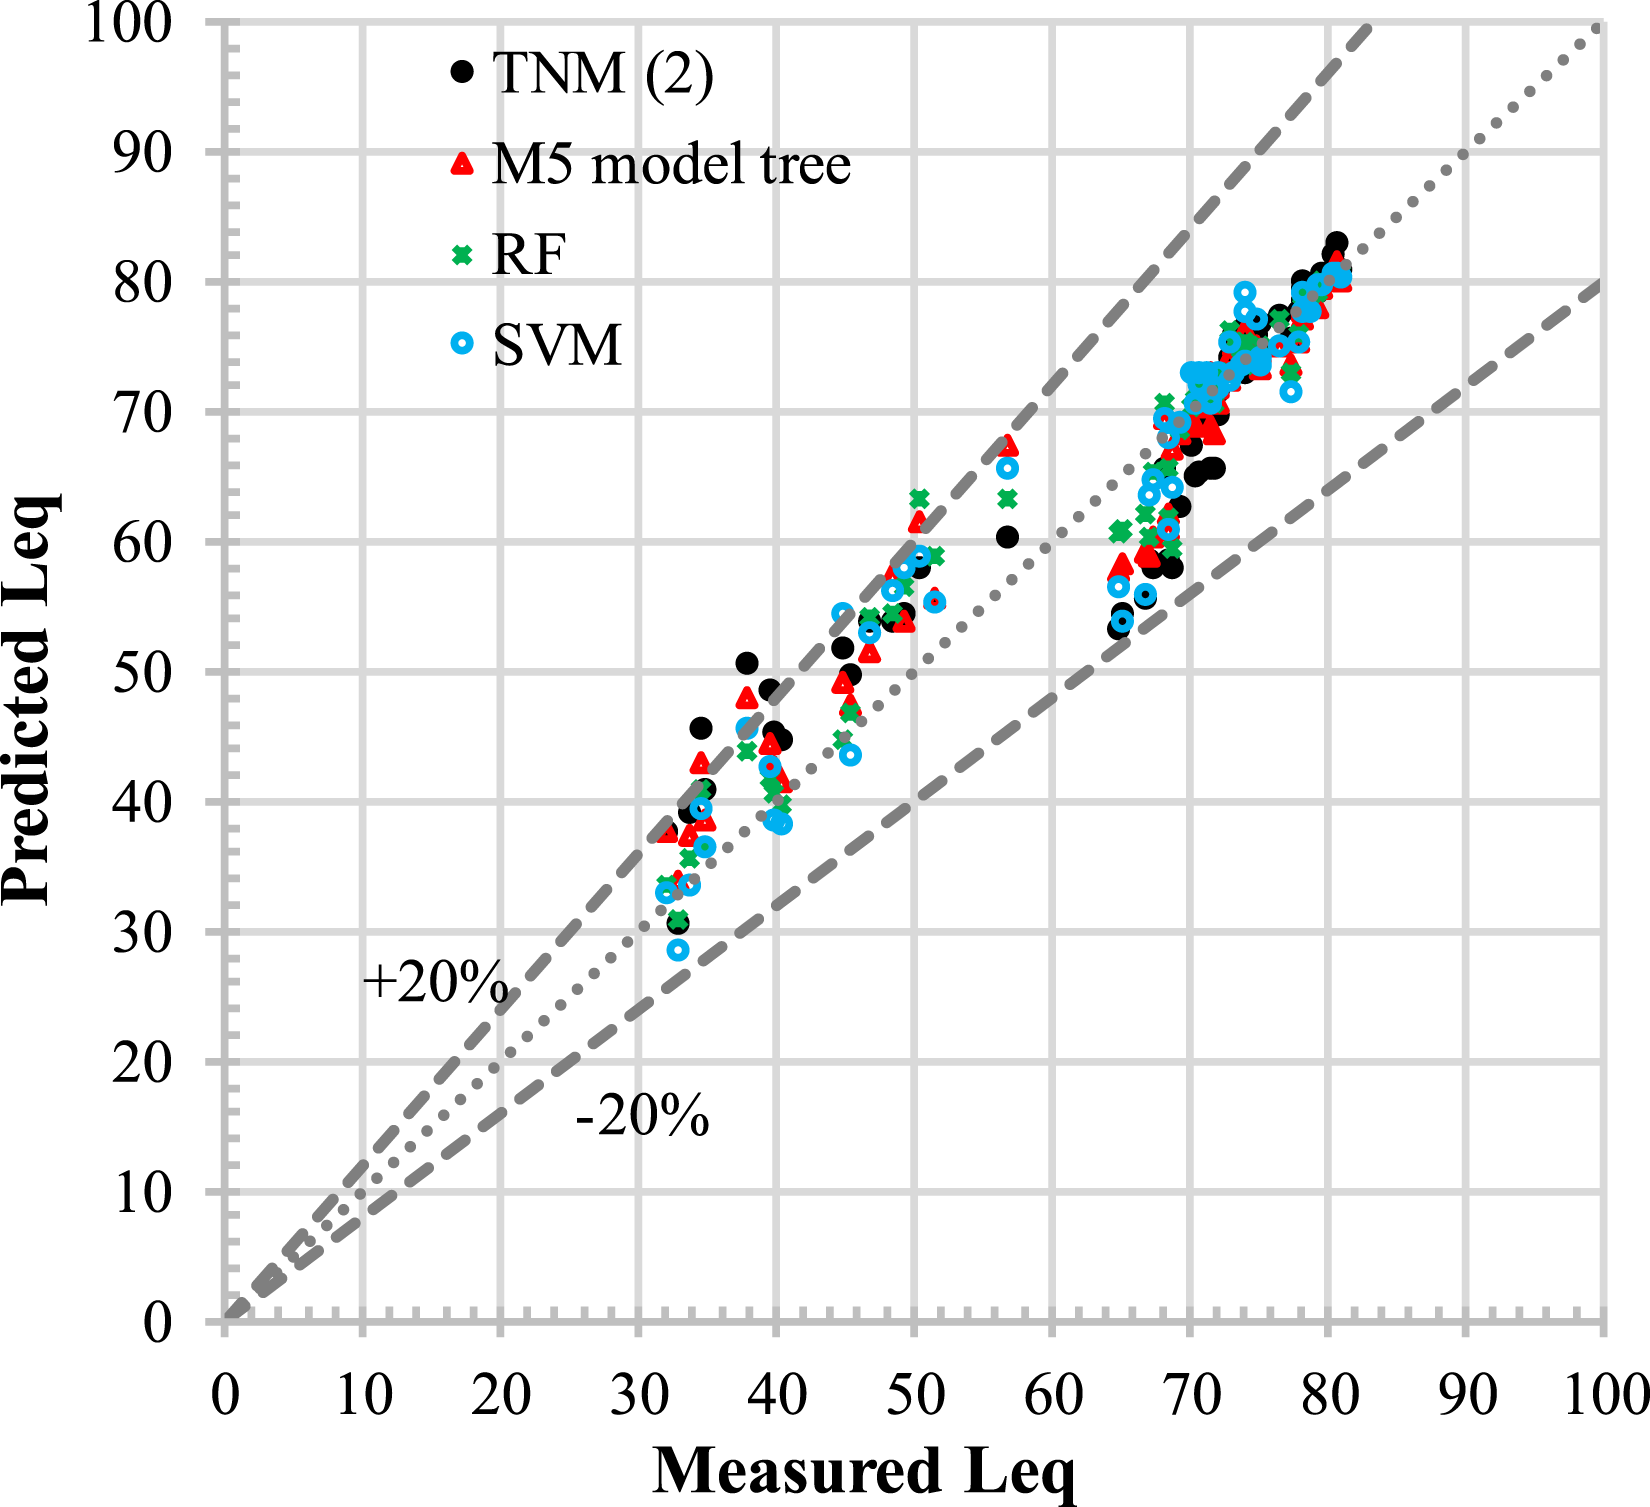
The M5 model tree provides a set of four linear models – LM1, LM2, LM3 and LM4 as under:
LM1: When 
LM2: When 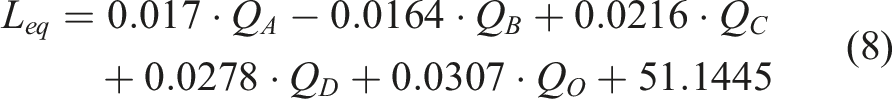
LM3: When 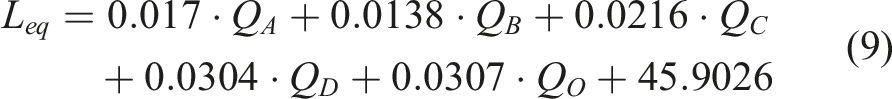
LM4: When 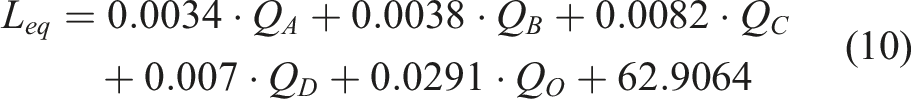
A closer look at the four multilinear relationships generated by M5 model tree (equations (7)–(10)) reveals that
Versatility of mathematical TNM in predicting standard noise descriptors

Result of statistical analysis of developed mathematical TNM in predicting

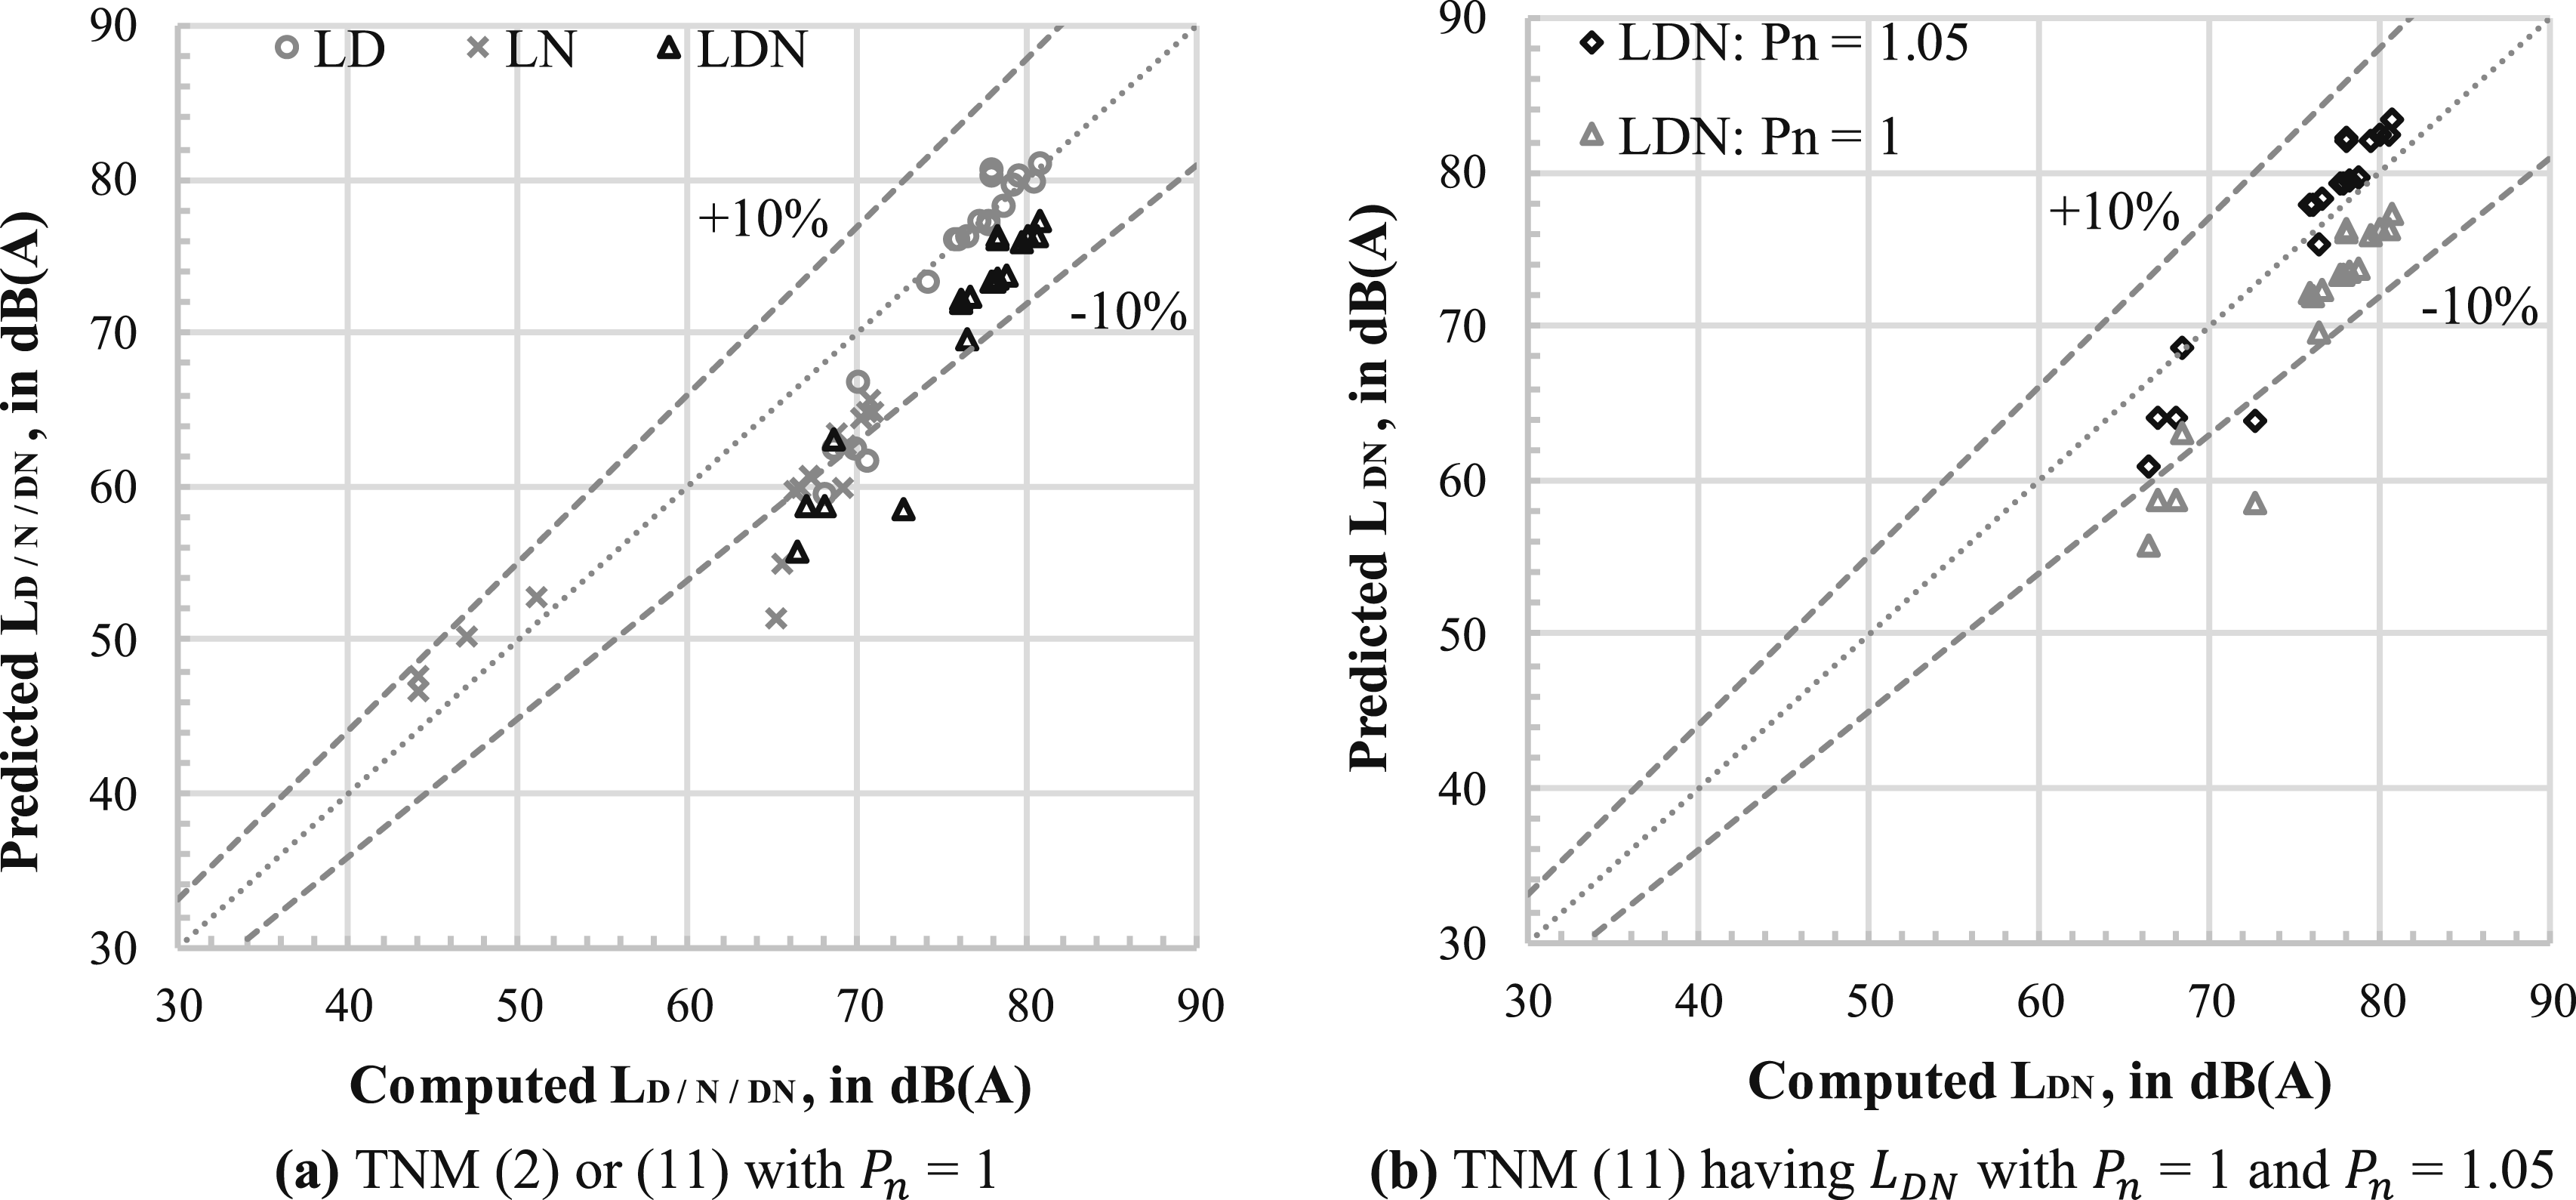
Computed verses predicted noise descriptors.
Conclusion
Noise pollution is a significant external impact of the urban road transport system. In the majority of TNMs, equivalent noise levels are presumed to be contingent on the logarithm of traffic flows. However, evaluating the model’s constants or coefficients for the specific context is imperative to substantiate this hypothesis.
The developed mathematical TNM (11) can be effectively used to predict the equivalent noise levels for any time-durations, including the standard noise descriptors (
Footnotes
Declaration of conflicting interests
The author(s) declared no potential conflicts of interest with respect to the research, authorship, and/or publication of this article.
Funding
The author(s) received no financial support for the research, authorship, and/or publication of this article.