




Abstract
To exactly identify and locate a rub-impact fault, the paper starts with the perspective of dual composition and proposes a method based on the combination of successive variational mode decomposition (SVMD) and intrinsic time scale decomposition (ITD). Firstly, signals are decomposed through SVMD and corresponding mode component signals can be obtained; concerning that most noises are distributed in high frequency, a component signal of highest frequency is removed and signals are reconstructed based on residual components. Secondly, the reconstructed signal is decomposed again through ITD and proper rotation components can be obtained, and a component signal of highest frequency is removed again. Thirdly, the running state of equipment and rub-impact positions are represented by Gini coefficient of residual component signals and feature vectors are constructed. Finally, clustering analysis is given to the feature vectors by t-SNE and k-nearest neighbor (KNN) is applied for identifying a rotor-stator rubbing failure and affected positions. The proposed method is compared with classical schemes based on the same data to verify its effectiveness. The result indicates that the proposed SVMD-ITD method has better fault identification performance. In two independent experiments, the mean identification accuracy of 10 successive random tests is above 98%.
Introduction
Large-sized rotating machinery has been playing a critical role in aviation, electricity and energy, etc. To improve the efficiency of equipment, it is required to reduce the clearance of rotor and stator, which will significantly add to the risks of rub-impact fault. Therefore, exactly judge a rotor-stator rub-impact fault and effectively identify an affected position is an important guarantee to ensure safe and stable operation of equipment, improve production efficiency and lower down maintenance cost. To exactly identify a rub-impact fault, a great many studies have been conducted by scholars. Among them, the extraction of fault features of component signals and mode identification algorithms for rub-impact fault identification and location based on various time-domain and frequency domain decomposition methods is a kind of classical study. Classical signal decomposition algorithms include wavelet transform (WT), variational mode decomposition (VMD) and intrinsic time-scale decomposition (ITD), etc. Time domain features of vibration signal were extracted by wavelet transform and parameters of support vector machine were optimized by genetic algorithm to identify the positions of rub-impact fault in refrigerator. 1 Yu, 2 et al., decomposed acceleration signals through wavelet packet decomposition, which were detected from casing, treated normalized energy as feature parameter and successfully identified and located a rub-impact fault. Yang 3 et al., effectively identified the working state of rotor and rub-impact fault based on improved ITD and correlation dimension. VMD determines the frequency center and bandwidth through optimal solution and can decompose signals into a series of intrinsic mode function (IMF). However, the performance of VMD is dependent to the exact determination of mode number and penalty factor. To solve this problem, Mojtaba Nazari, et al., 4 proposed successive variation mode decomposition (SVMD). This method achieves signal decomposition through successive modal extraction without the necessity to determine the number of modes and shows stronger robustness toward the original value of central frequency of mode; meanwhile, the operation complexity of SVMD is far lower than VMD. 5 ITD was raised by Frei. This algorithm is advantageous in adaptivity, high speed and efficiency and has rather wide application in the fault diagnosis of rotating machinery, including aero-engine.6,7 Dual decomposition extracts feature information through two signal decomposition algorithms. Compared with single signal decomposition, it can further eliminate interference and extract the key features of signals more exactly, and improve the robustness of feature. 8 Zhou, 9 et al., proposed a complete ensemble empirical mode decomposition with adaptive noise and continuous wavelet transform (CWT), and successfully separated vibration signals of rotor from original signals, and exactly judge a crack fault of rotor, and verified the advantages of dual decomposition. Li, et al., 10 brought forward a feature extraction method by combining LMS-adaptive filtering algorithm and empirical mode decomposition (EMD), and effectively removed the interference of electromagnetic noise of motor. It can be found that the dual decomposition method of signal can improve the accuracy of weak fault feature extraction. Based on that, the paper has proposed a rub-impact fault identification and location method based on SVMD-ITD. No matter when signals are decomposed by signal decomposition algorithms, or faults are classified and identified according to mode identification algorithms, signal evaluation index is usually required. Ding, et al., proposed a fault feature extraction method for wind power gear box based on parameter-free empirical wavelet transform. Margin factor was introduced to choose sensitive fault components after EMD and fault feature information of wind power gear box was effectively extracted according to selected component signals. 11 Luo, et al., took advantage of the sensitivity of kurtosis to fault signals and proposed a combined method of EMD and kurtosis and effectively strengthened the impulse signals contained in the fault signals of rolling bearing. 12 Zhang, et al., 13 brought forward a fault diagnosis method based on adaptive VMD and generalized regression neural networks. The method constructs feature vector sets according to compound multi-scale dispersion entropy, mean square root and barycentric frequency and effectively recognizes a compound fault of rotor system by combining the constructed feature vector and generalized regression neural networks (GRNN). Gini coefficient is an important index in economics and has been introduced to fault diagnosis. As an effective indicator to measure signal sparsity, Gini coefficient demonstrates significant advantages in vibration signal analysis, especially in identifying periodic impact components under strong noise. For instance, Zhou 14 took advantage of the excellent sparse measurement capability of Gini coefficient to effectively distinguish the repetitive pulses and even noises caused by bearing faults, or non-periodic disturbances. The method can precisely extract the time-frequency slices relevant to the fault-modulated components by quantifying the concentration degree of spectral energy, significantly improving the accuracy and robustness of fault feature frequency extraction. Cui, et al., 15 contributed early fault diagnosis method for rolling bearing according to Gini coefficient and minimum entropy deconvolution. Shi, et al., 16 proposed a parameter optimized feature mode decomposition method (POFMD), treated Gini coefficient as target function and achieved fault diagnosis through envelope spectrum. A fault diagnosis method with adaptive nonlinear frequency modulation component decomposition (ACMD) and improved multi-points minimum entropy deconvolution (IMOMEDA) is proposed. 17 In this method, to improve signal-to-noise ratio (SNR), signals were reconstructed and pre-treated by ACMD based on Gini coefficient and then envelope spectrum of signals was analyzed, and the type of faults was judged by comparing dominant frequency of envelope spectrum of components and theoretical fault feature frequency.
Based on the above studies, the paper proposed a rub-impact fault identification and location method based on dual decomposition SVMD-ITD and noise was reduced by eliminating the component signals corresponding to the highest frequencies after twice decomposition; rub-impact fault and affected position was described by calculating the Gini coefficients of residual component signals. The main contributions of paper include two points below: (1) Dual decomposition algorithm is applied to the identification and location of rub-impact fault. Compared with single decomposition algorithm, the features obtained by dual decomposition are more robust toward noise. The rubbing failure and affected location can be exactly estimated through dual decomposition of signals. (2) Gini coefficient is applied to the construction of rub-impact fault feature vectors. In the option of feature parameters, Gini coefficient is often applied to the fault analysis of rolling bearing and less to identification of rubbing failure. Gini coefficient is taking as feature parameter for identifying the rub-impact failure and affected locations, and has achieved good effect of fault identification.
Basic principle
Successive variation mode decomposition
To reduce the mode aliasing of VMD and the difficulty to determine the number of modes, SVMD has added constraint conditions on the basis of IMF and extracted all mode components in order. The specific process is as follow.
Set input signal is Y(n) and decompose it into L-th order mode component

SVMD extracts IMF in the way of continuous variation mode. There are four constraint conditions (1) Each mode is centralized in central frequency. The minimum constraint of L-th mode is:

Let (2) In the premise that (3) Under (4) The fourth constraint is that the original signal can be reconstructed based on each modality and the residual signals.



According to four constraint conditions, the matter of extracting L-th mode components is transformed to the matter of minimum constraint.
Intrinsic time scale decomposition
ITD can be decomposed into a series of proper rotational components (PRCs) of different frequency bands and a monotonous trend term. Given



The baseline signal

Proposed method
SVMD-ITD dual decomposition algorithm
Dual decomposition of signal can exactly extract the key features of sensor signal and improve the robustness of feature. SVMD algorithm is advantageous in lower calculation complexity and has stronger robustness toward the original value of central frequency of mode.
19
The specific process of proposed SVMD-ITD is shown in Figure 1. Block diagram of the SVMD-ITD dual decomposition algorithm.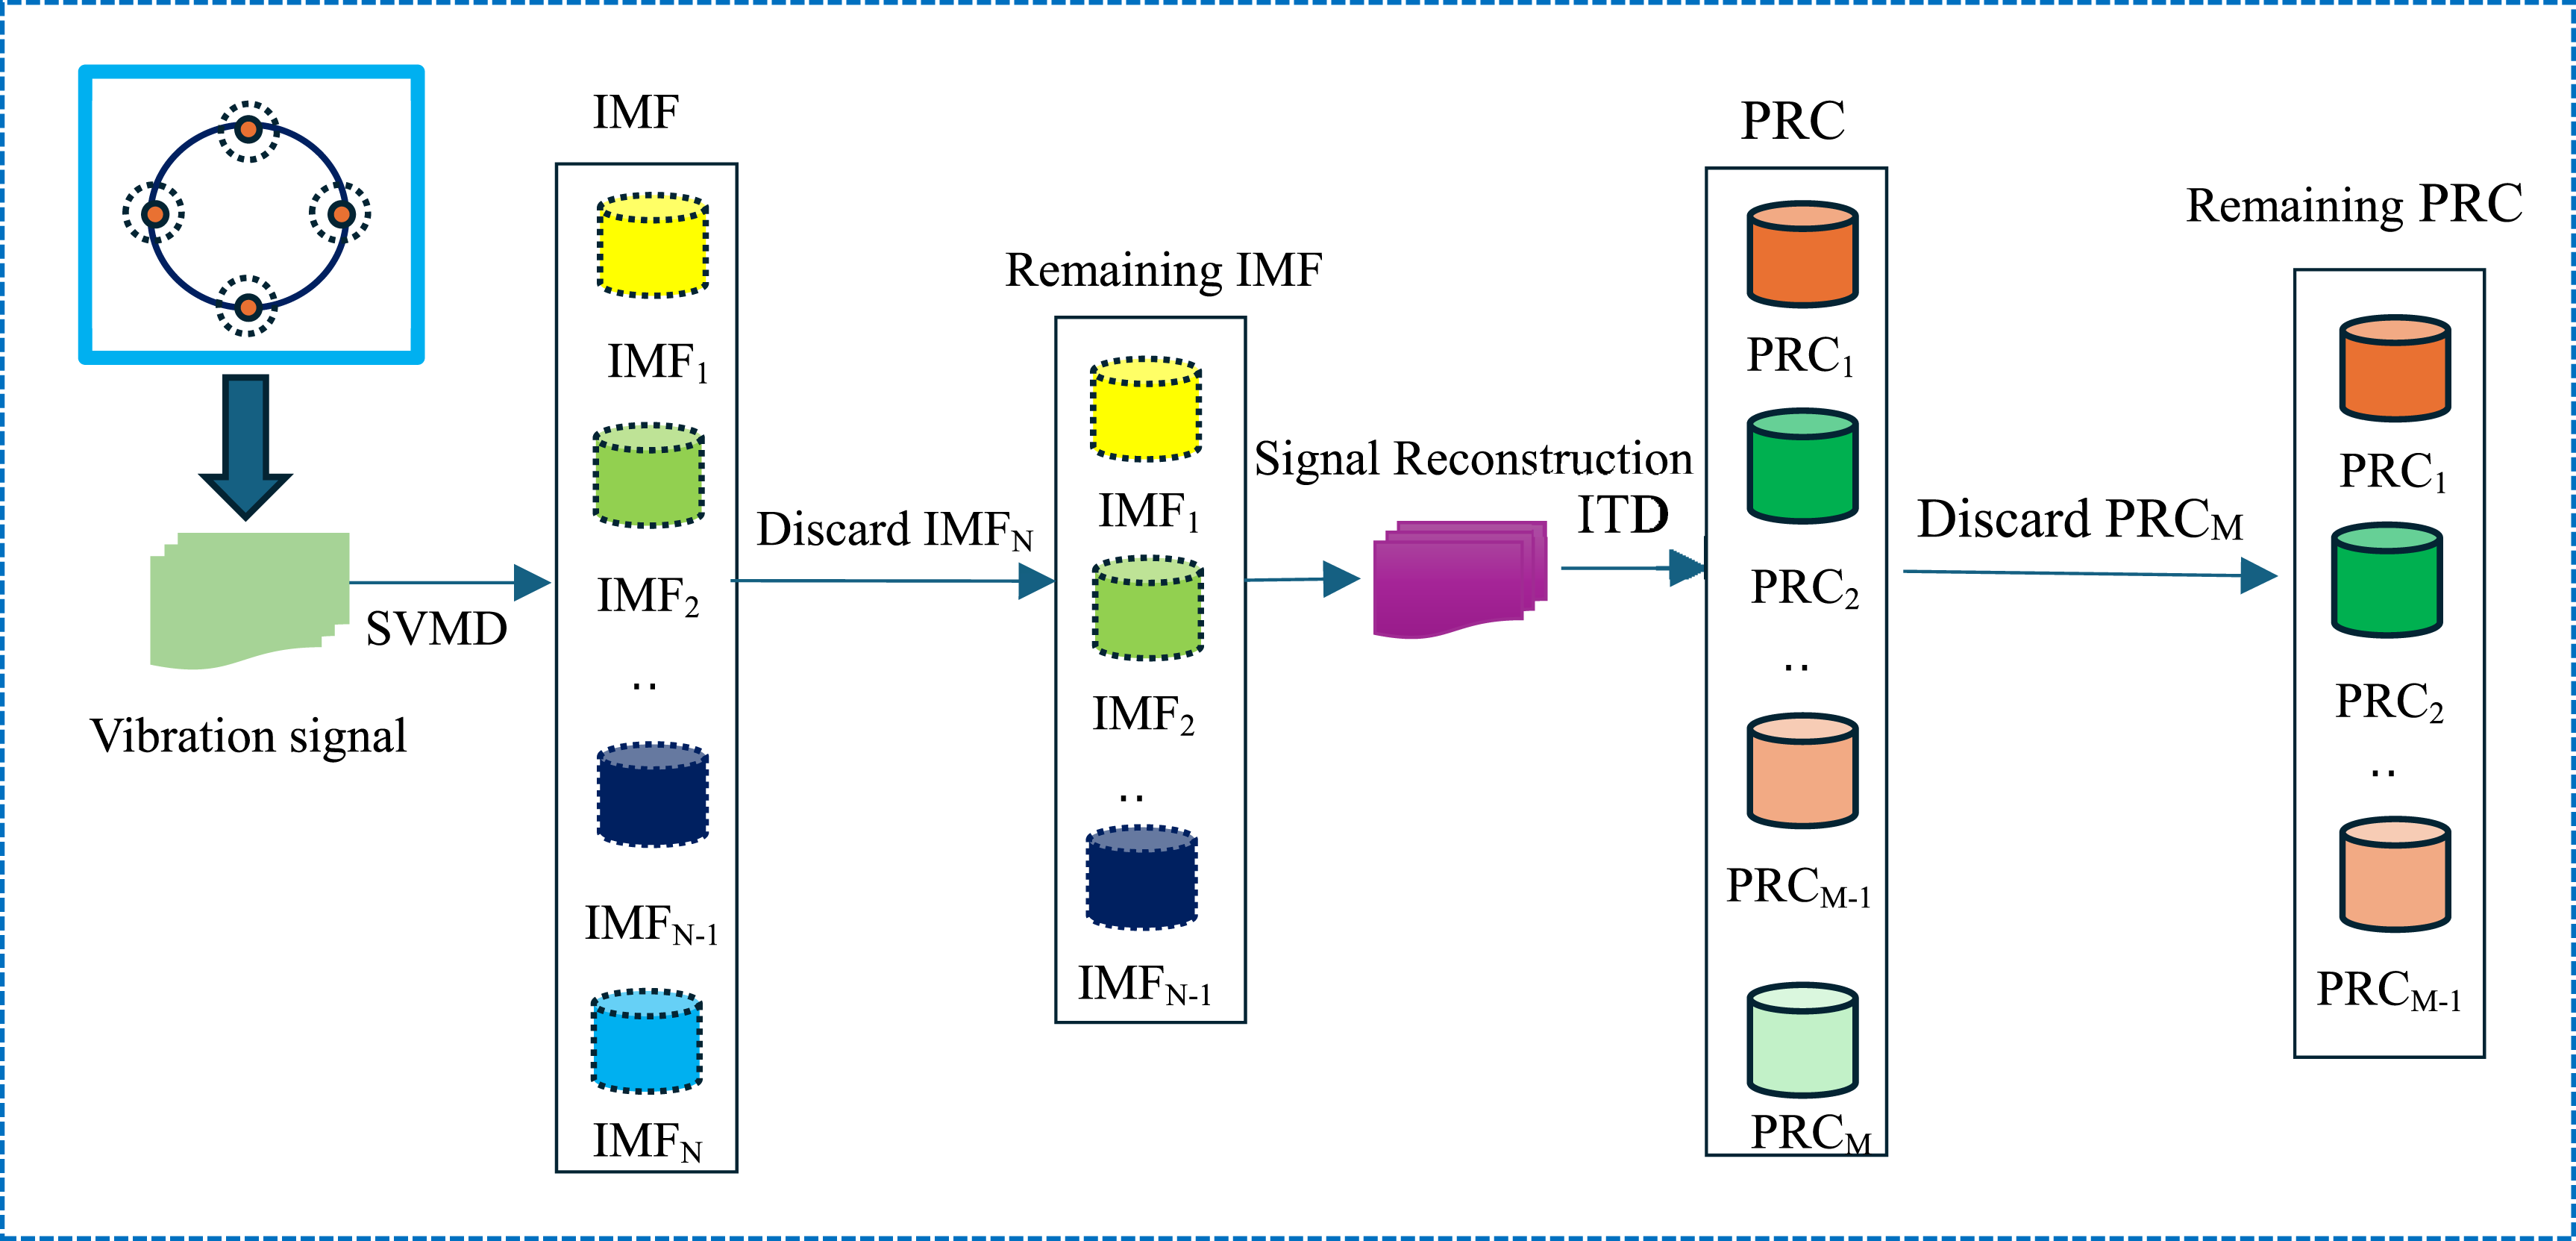
Dual decomposition of signals can be implemented according to step (1)–(6).
20
(1) Set original signal is (2) As most of noises in vibration signals are distributed in high-frequency information,
21
the IMFN components of highest frequency are abandoned to reduce the influence of noise on fault feature extraction. (3) Signals are reconstructed in the way of equal weight addition according to residual IMF1, IMF2……IMFN-1. Set reconstructed signal (4) (5) The PRCM of highest frequency is still eliminated to further control noise. (6) The residual components PRC1, PRC2……PRCM-1 are analyzed to estimate rub-impact faults.
The rub-impact fault identification and location method based on SVMD-ITD
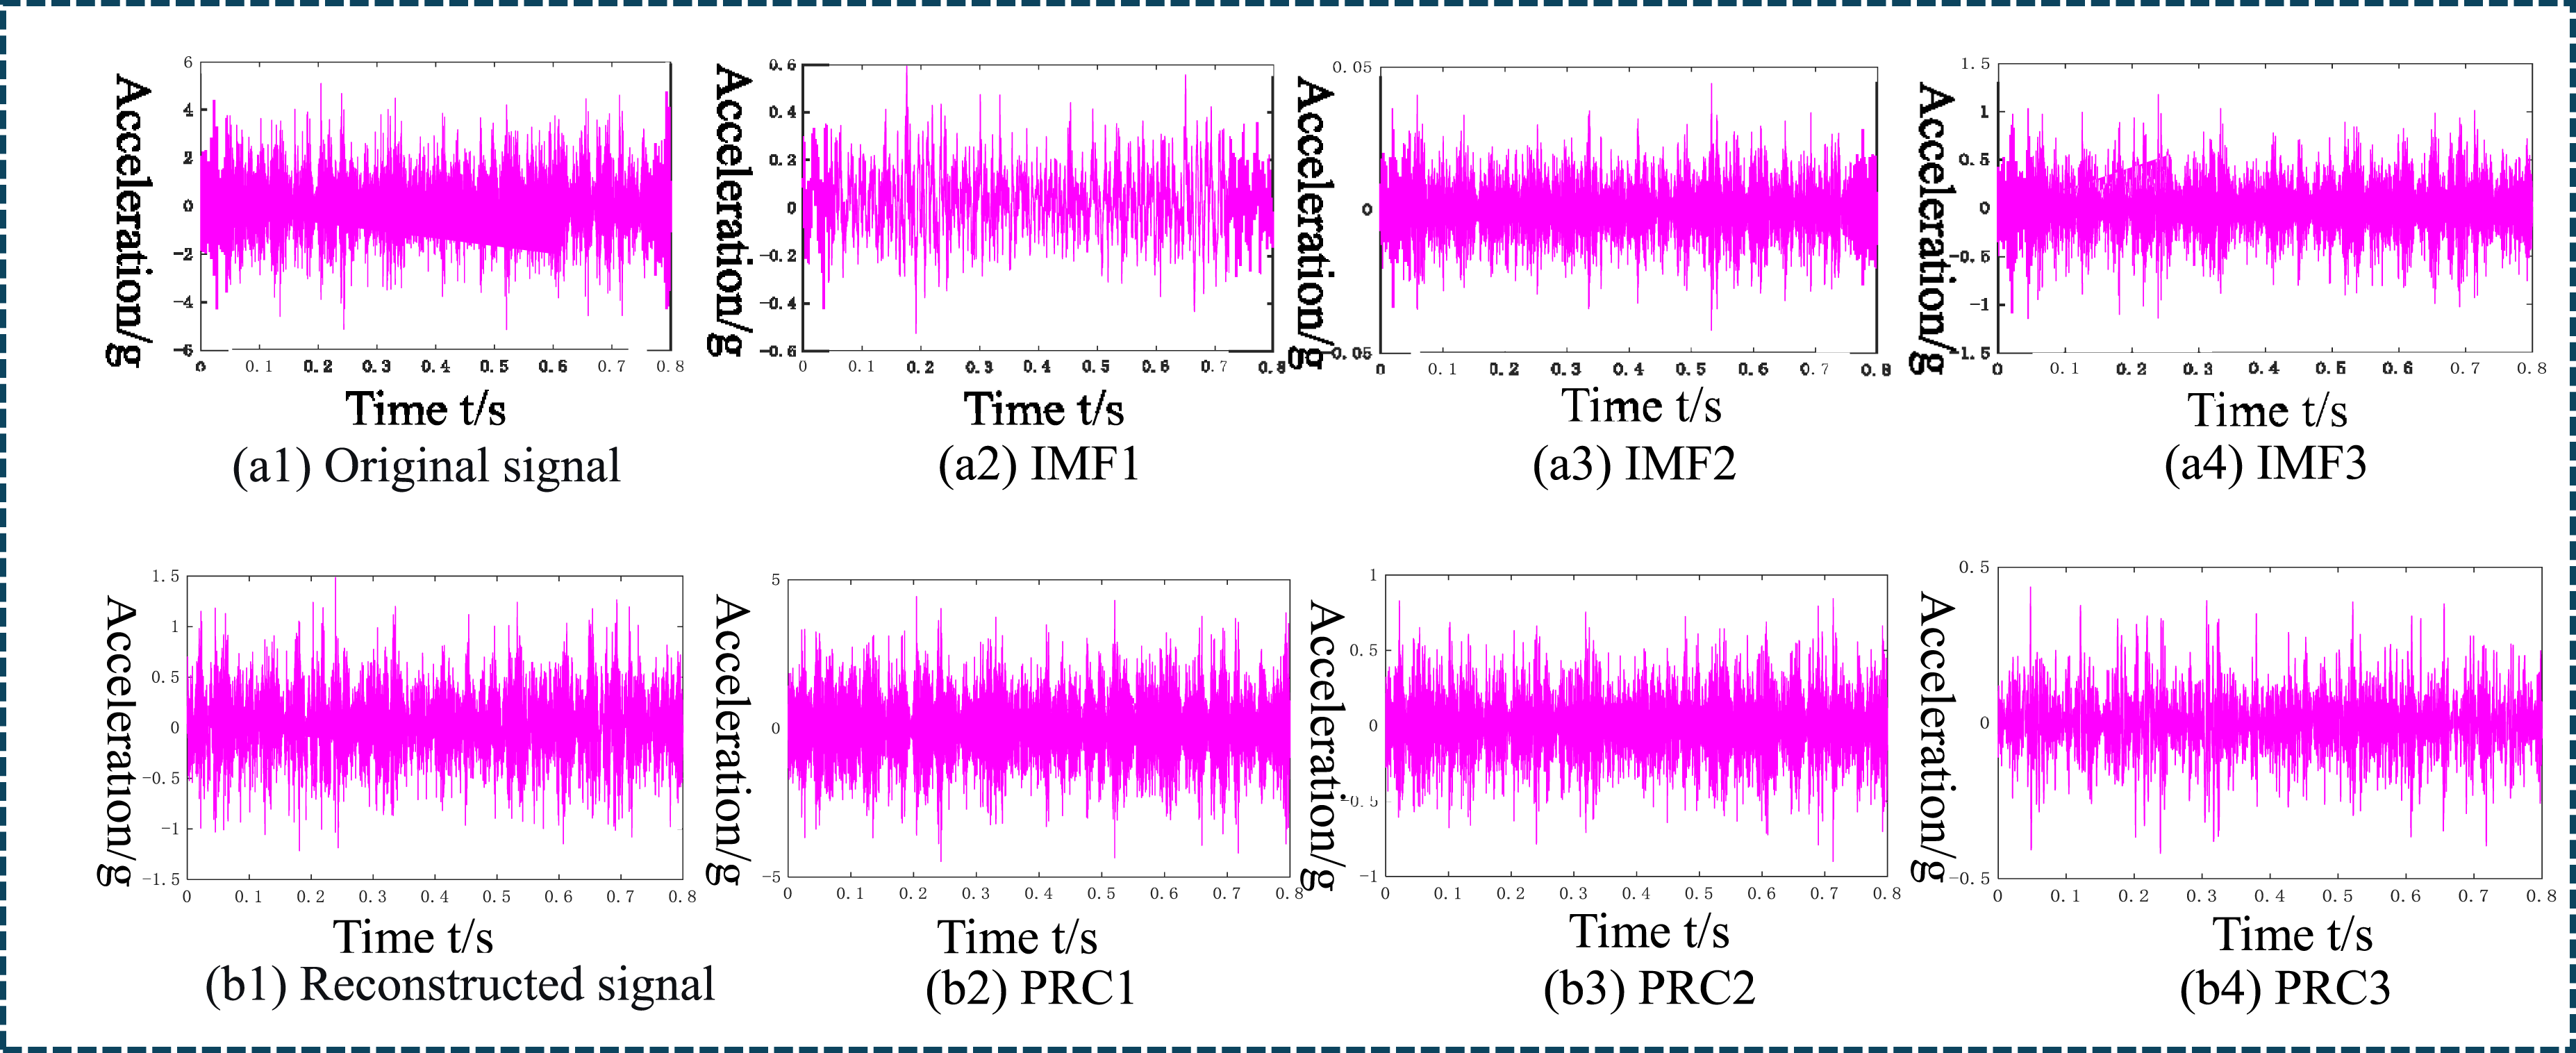
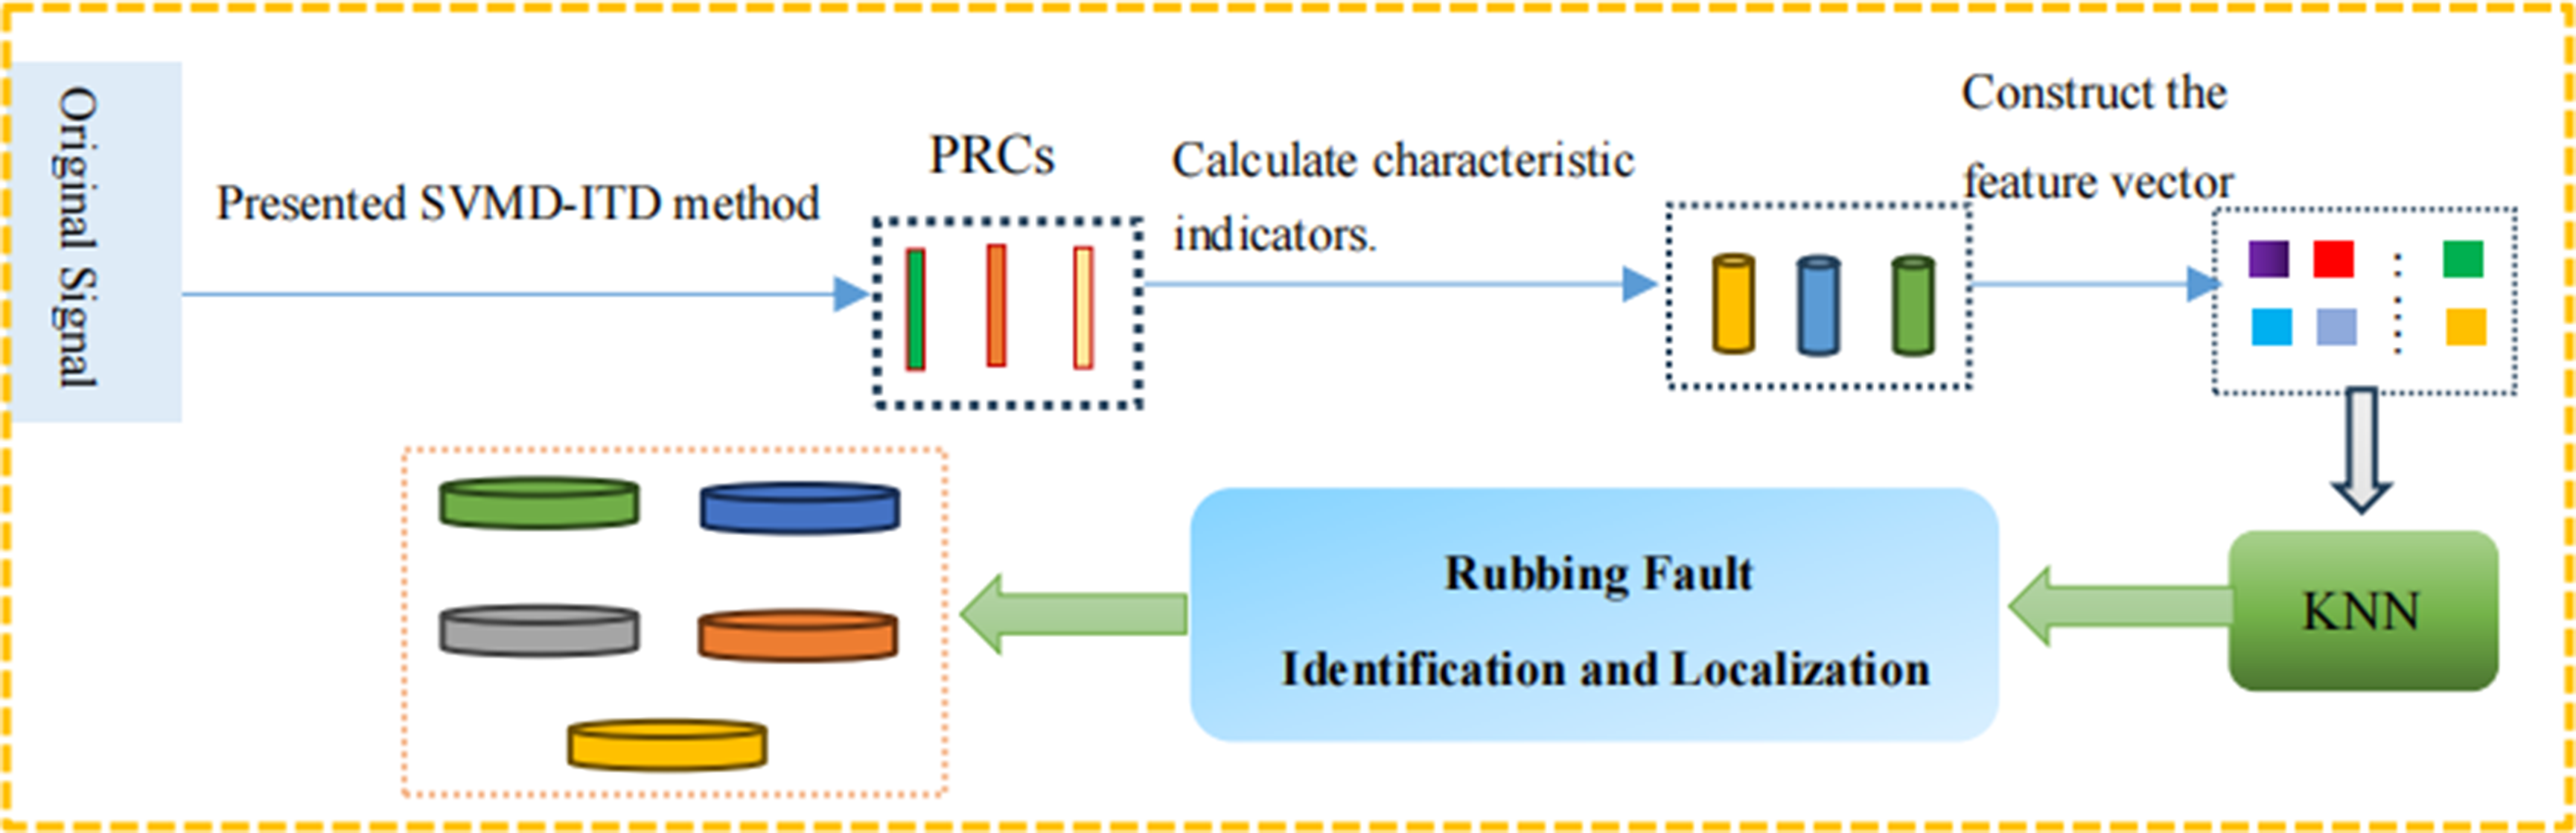
The component signals and reconstructed signals obtained by dual decomposition of SVMD-ITD are shown in Figure 2. Specifically, Figure 2(a1) represents original signal, while Figure 2(a2)–(a4) are the three component signals IMF1-IMF3 obtained after SVMD; Figure 2(b1) shows the reconstructed signal based on three components; and Figure 2(b2)–(b4) are the three component signals PRC1-PRC3 obtained by applying ITD to Figure 2(b1). Feature vectors are constructed with Gini coefficients to identify and locate a rub-impact fault. Specific block diagram is shown in Figure 3. Step 1: according to reference 21, the number of decomposition layers of SVMD and ITD is set as four; Step 2: according to the proposed method in Sec. “SVMD-ITD dual decomposition algorithm”, each signal from sensors is dually decomposed (the number of sensors is four and each state corresponds to 80 sets of samples); after dual decomposition, each signal corresponds to three PRCs; set the PRC of k-th signal from s-th sensor is PRCsk1, PRCsk2 and PRCsk3; Step 3: the Gini coefficient of PRCsk1, PRCsk2 and PRCsk3, GIsk = {GIsk1, GIsk2, GIsk3} is calculated; Step 4: the Gini coefficients GIT of all signals from all sensors are calculated and the feature vector of each state is constructed (the data of paper includes five states of tester: normal running (without a rub-impact fault) and rub-impact above, below, leftward and rightward); Step 5: K-nearest neighbor (KNN) is a kind of visual and powerful classification and regression method and widely applied in classification tasks due to its advantages of simple structure and powerful classification performance.
22
Therefore, the paper takes KNN as mode identification algorithm and implements rub-impact fault identification and location with the feature vectors constructed in Step 4. Raw signal and time domain diagrams after SVMD-ITD. Rubbing failure identification and localization with SVMD-ITD.

For verifying the advantages of presented SVMD-ITD method, contrastive proposal shown in Figure 4 is adopted. The data used is the same with paper for comparison. To guarantee consistency, the number of decomposition layers is the same with proposed method. Block diagram of the comparative schemes.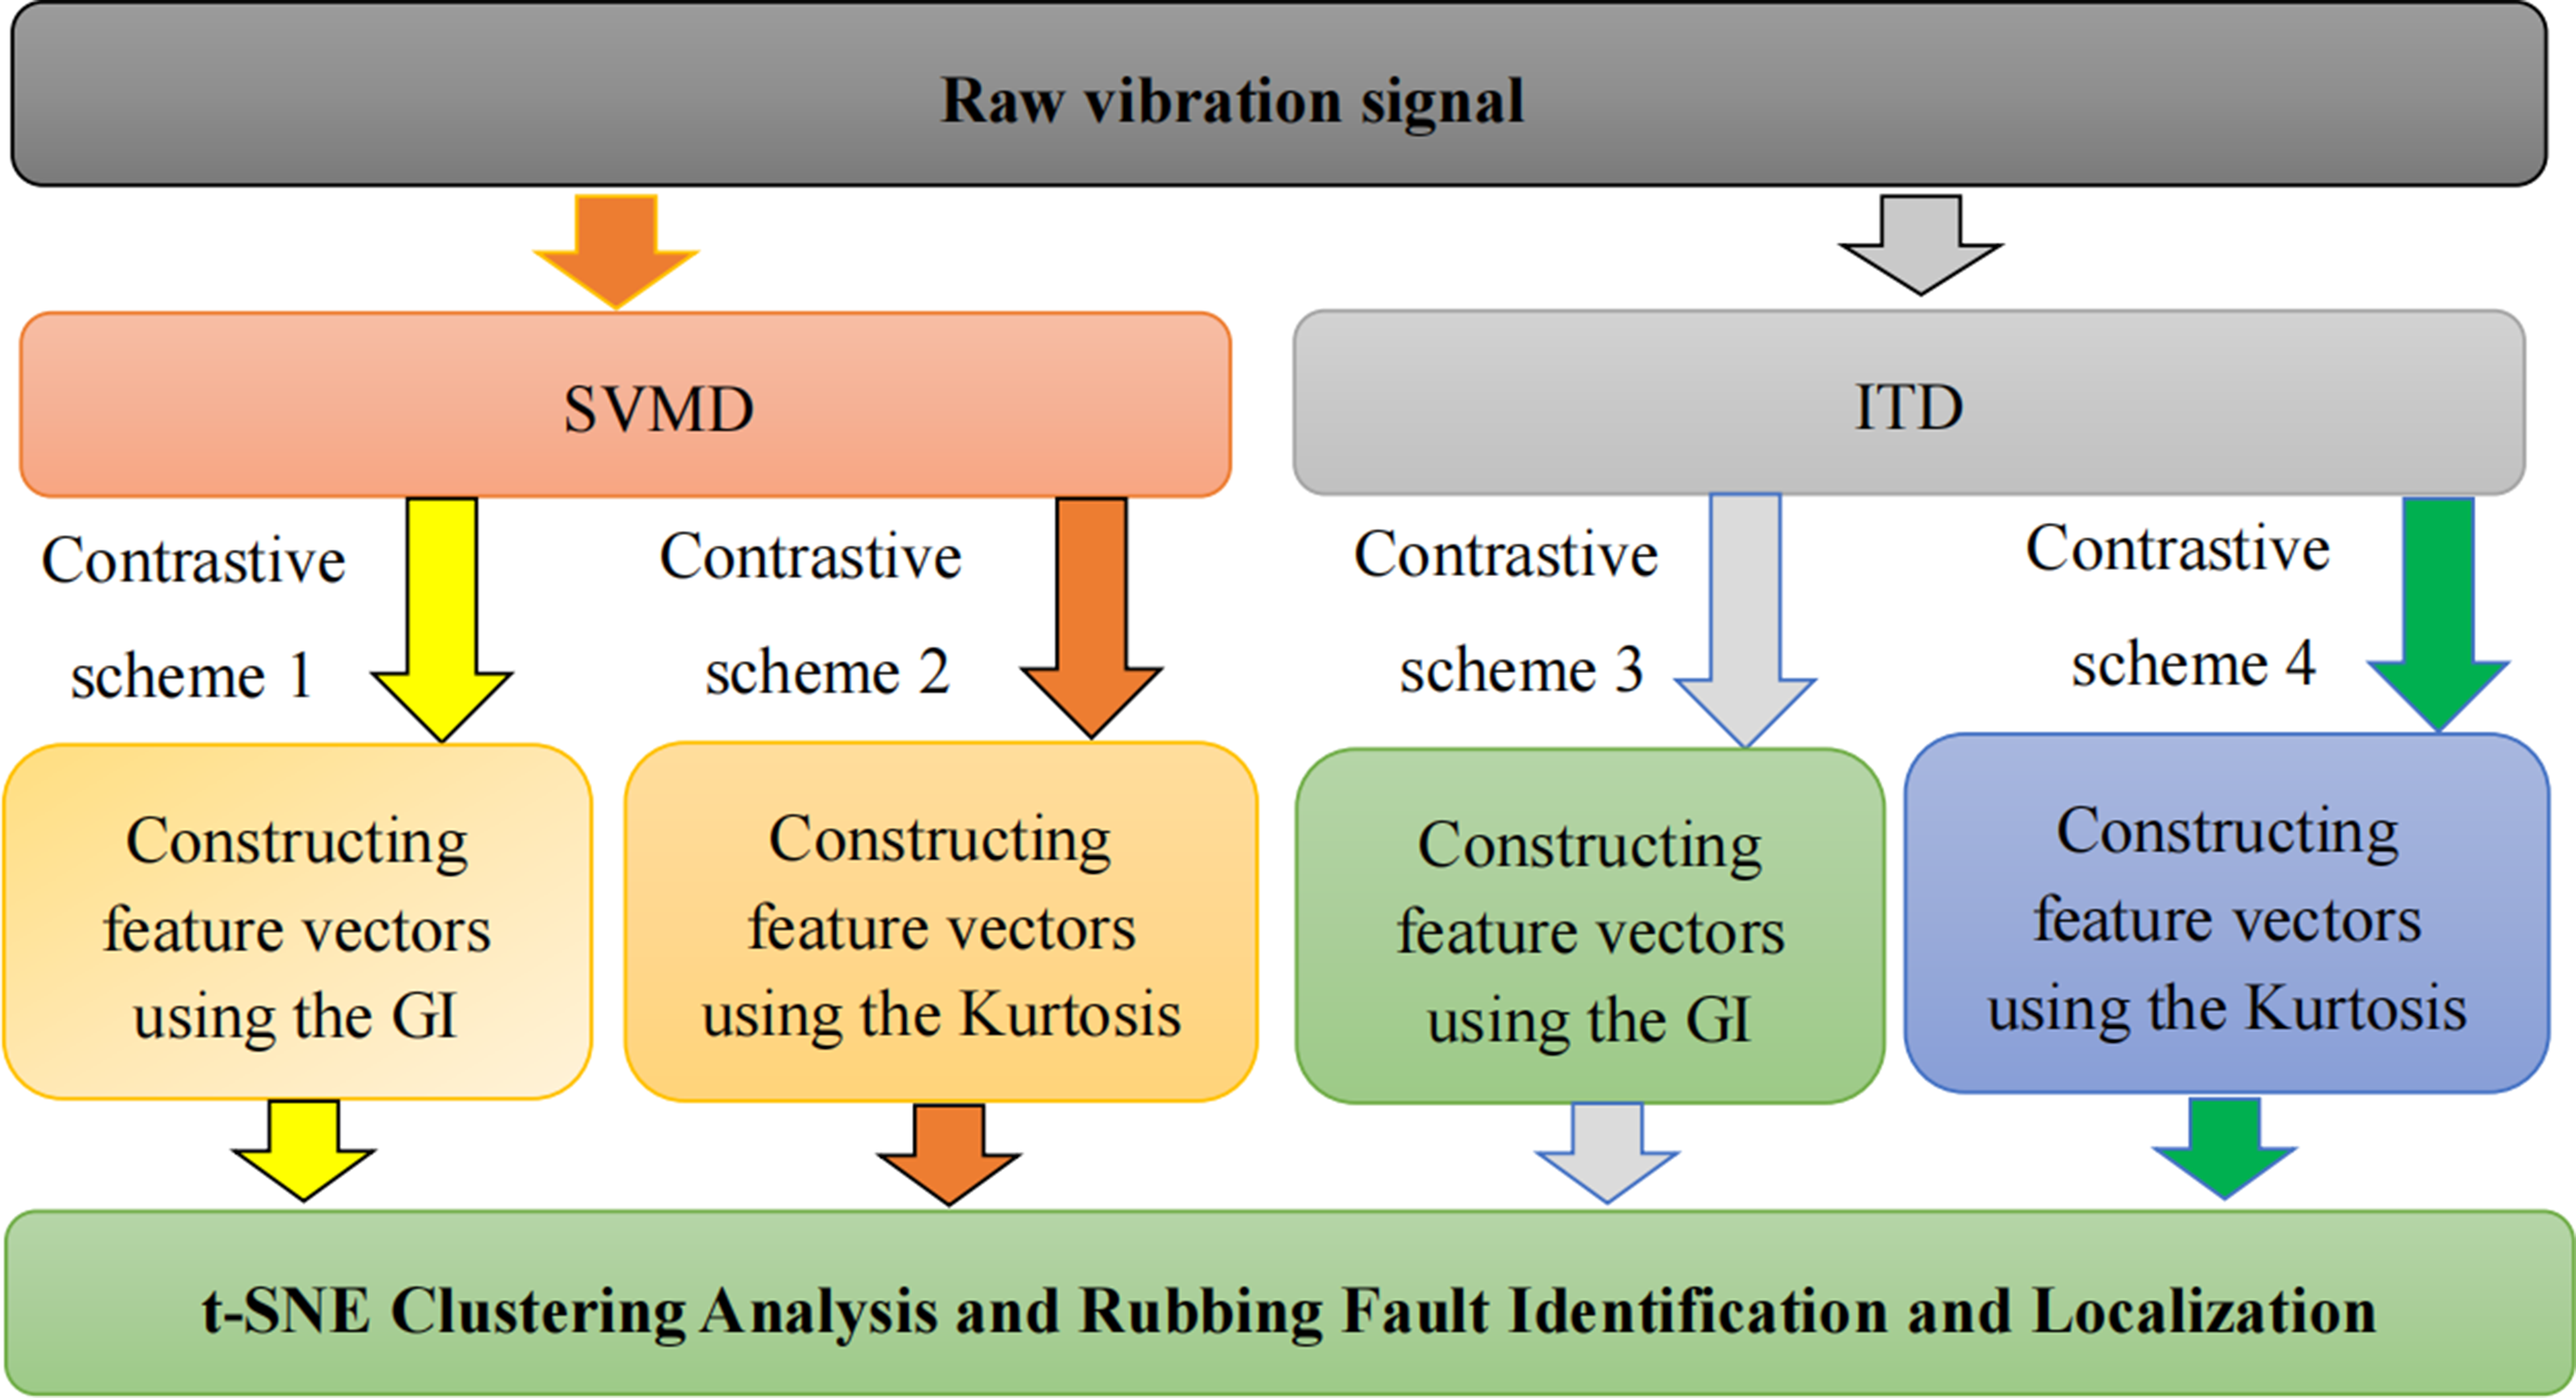
Contrastive scheme are shown as follow:
Contrastive scheme 1: this method differs from the method of paper in SVMD only and other steps and feature indexes (Gini coefficient) are the same with the method of paper; Contrastive scheme 2: this method differs from method 1 in replacing Gini coefficient with kurtosis; Contrastive scheme 3: this method differs from the method of paper in ITD only and other steps and feature indexes (Gini coefficient) are the same with the method of paper; Contrastive scheme 4: this method differs from contrast method three in replacing Gini coefficient with kurtosis;
Rub-impact fault test
The data of rub-impact faults comes from the test device shown in Figure 5(a). This tester is consistent with the casing of some aero-engine in shape and structure and internal structure has been simplified as required. The specific description of this tester is included in reference 23. Figure 5(b) shows the rub-impact position of test. When single-point rub-impact is required, a bolt is screwed by spanner to deform a ring which crashes with rotating turbine blades. In the experiment, vibration acceleration signals were collected by Danish B&K4508 acceleration sensor and NI NSB9234 data acquisition card. Four acceleration sensors were evenly distributed on turbine casing clockwise, above, below, rightward and leftward, which is shown in Figure 5(c). Rotor rub experiment.
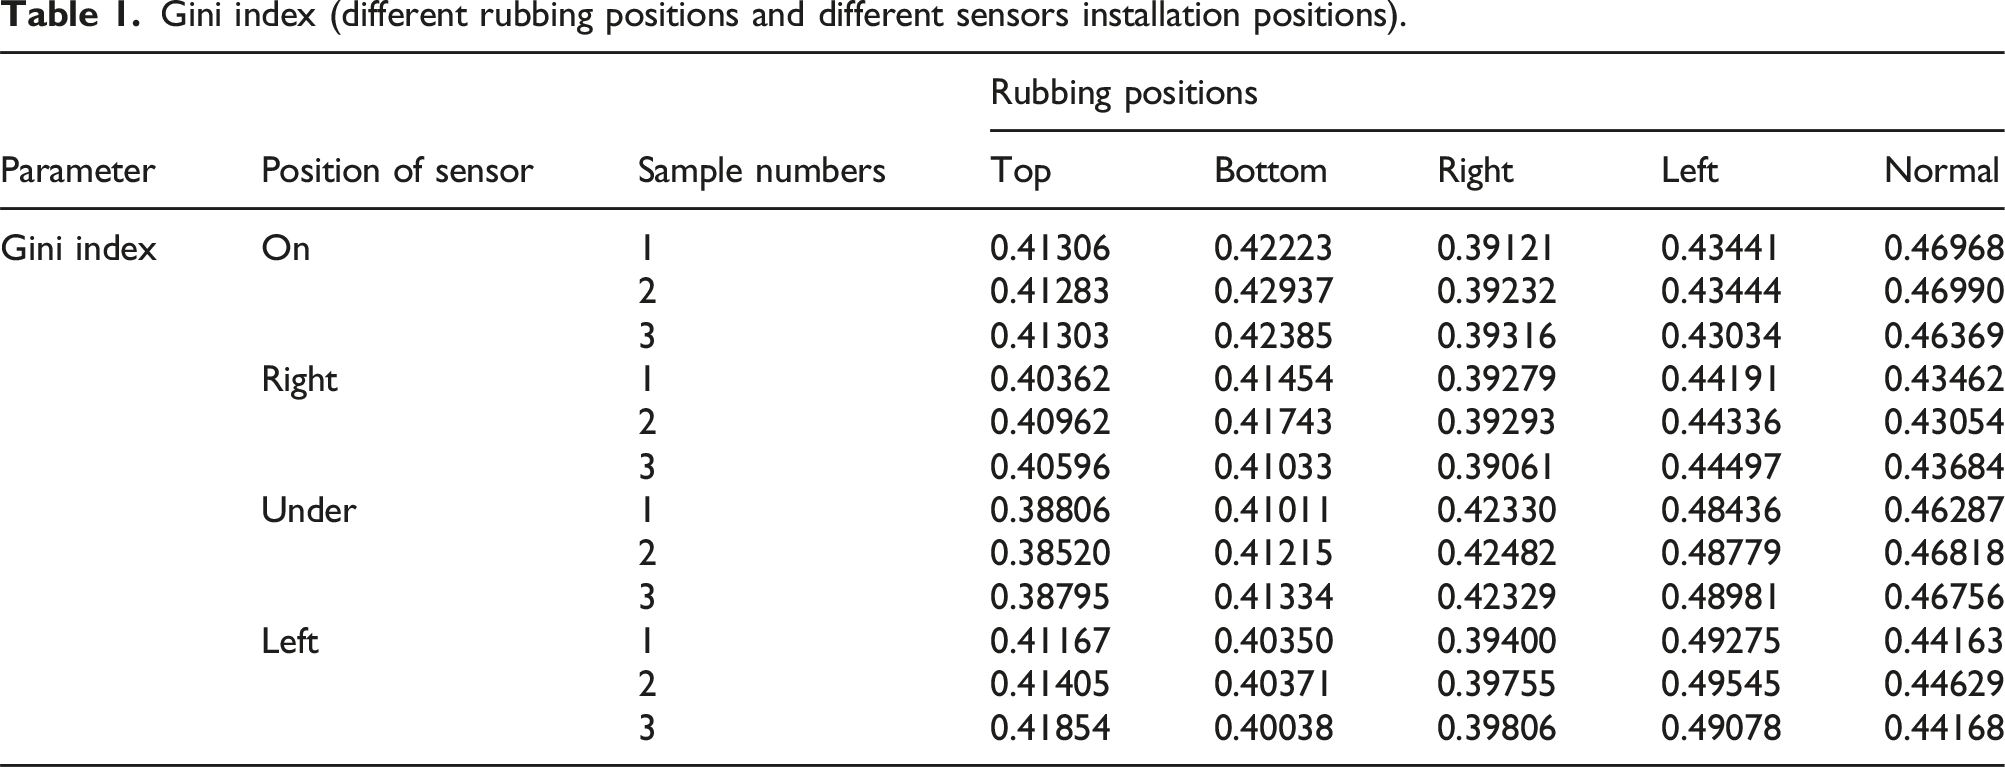
Gini index (different rubbing positions and different sensors installation positions).
Feature analysis of rub-impact faults
Aggregation and discreteness analysis of feature vectors constructed by proposed method
Firstly, an analysis was given to the aggregation and discreteness of feature vectors in the same and different samples to preliminarily verify the effectiveness of method, which were built by proposed method. The result is shown in Figure 6 and Table 1. Figure 6(a)–(d) shows the samples of sensors installed above, rightward, below and leftward. The number one-five in x-coordinate corresponds to five running states, normal running (without a rub-impact fault) and rub-impact position above, below, rightward and leftward of casing. Y-coordinate shows the values of Gini coefficient obtained by proposed method. Analysis of aggregation and dispersion for feature vectors of the proposed method  ,
,  and
and  corresponds to three groups of classical samples chosen randomly and successively.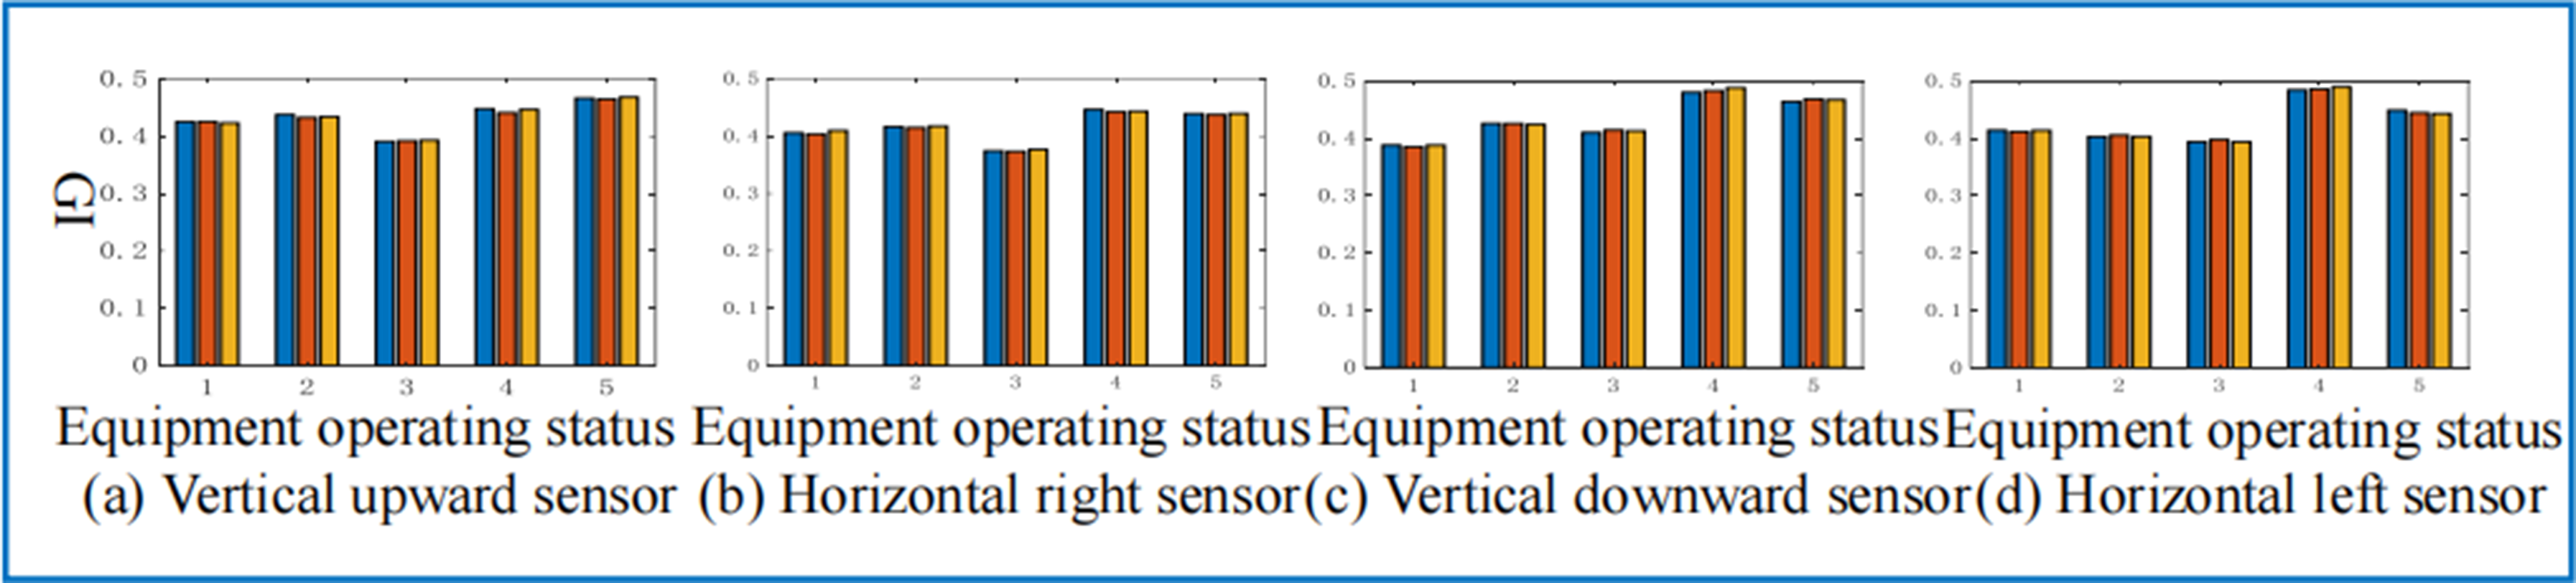
It can be found from the analysis of Figure 6 and Table 1 that. (1) In the same operation state, the Gini coefficients of signals from sensors in each position show good aggregation. In Figure 6(a), when rub-impact position is on the right of turbine casing, the Gini coefficients of three sample sets are distributed in the interval 0.39121–0.39316 and show high consistency. (2) In different operation states, the Gini coefficients of samples collected by the same sensor show significant otherness and can effectively distinguish different operation states. Taking the right sensor in Figure 6(b) as example, when the rubbing position is on the right side of turbine casing and normal running (without a rub-impact fault), the Gini coefficient range is 0.39061–0.39293 and 0.43054–0.43684 respectively. The mean difference between groups can reach 10.15%, which can exactly judge the different states of equipment.
t-SNE cluster analysis of proposed method
To further prove the effectiveness of proposed method, for all the data, feature vectors are constructed according to the Gini coefficients of component signals obtained by proposed dual decomposition algorithm SVMD-ITD; dimension of feature vectors is reduced with t-SNE method and the result is shown in Figure 7. Figure 7(a) and (b) shows the samples obtained in the first and second experiment. The t-SNE feature clustering diagram of the proposed method in two independent experiments  in Figure 7(a)–(b) shows the positions of rub-impact (above, below, rightward and leftward) and normal running (without a rub-impact fault).
It can be found from the analysis of Figure 7 that the difference of clustering center results in the difference of clustering position, but overall clustering effect is the same. The five types all have certain aggregation and discreteness and the details are shown as follow: (1) Among the same category, they are assembled into a cluster. For example, in the Figure 7(a), the feature sets of rub-impact fault occurring below turbine casing are closely got together. This has shown that in the same category, they have very good aggregation. (2) Among different categories, they are arranged in dispersion. For example, the feature sets represented by rub-impact-below (*) and rub-impact-right (
 ), in Figure 7(a), are arranged in dispersion; this shows the discreteness of different states.
What can be found through t-SNE clustering diagram is that the proposed method is better capable to judge a rubbing failure and different affected positions and can recognize and locate a rub-impact fault.
t-SNE cluster analysis of other contrast methods
To verify the advantages of proposed method, feature vectors are constructed with four contrast methods shown in Figure 4 according to the same data and dimension is reduced with t-SNE. After dimension reduction, the clustering result of each method is shown in Figure 8. Each contrast method randomly takes the data of first experiment for analysis (the result of second experimental data is similar to the first). In the Figure 8, Feature clustering diagrams of different comparative schemes. matching with the rubbing position above, below, right and left of turbine casing and normal running (without a rub-impact fault); Figure 8(a)–(d) corresponds to contrastive scheme1–4 respectively.
It can be found from the analysis of Figure 8 that though SVMD or ITD algorithm can identify the running state of tester and rub-impact fault in different sections by taking Gini coefficient or kurtosis as feature vector, there is the phenomenon of cross aliasing of features among different categories. For example, in contrastive scheme 1 (Figure 8(a)), the aliasing of samples is rather serious for normal state and rub-impact position below casing; for example, in contrastive scheme 4 (Figure 8(d)), the aliasing of samples is serious for rub-impact position above and below of casing. This will probably result in poor identification effect for these faults and even a misdiagnosis. This has also proved the effectiveness and superiority of proposed method.
State identification
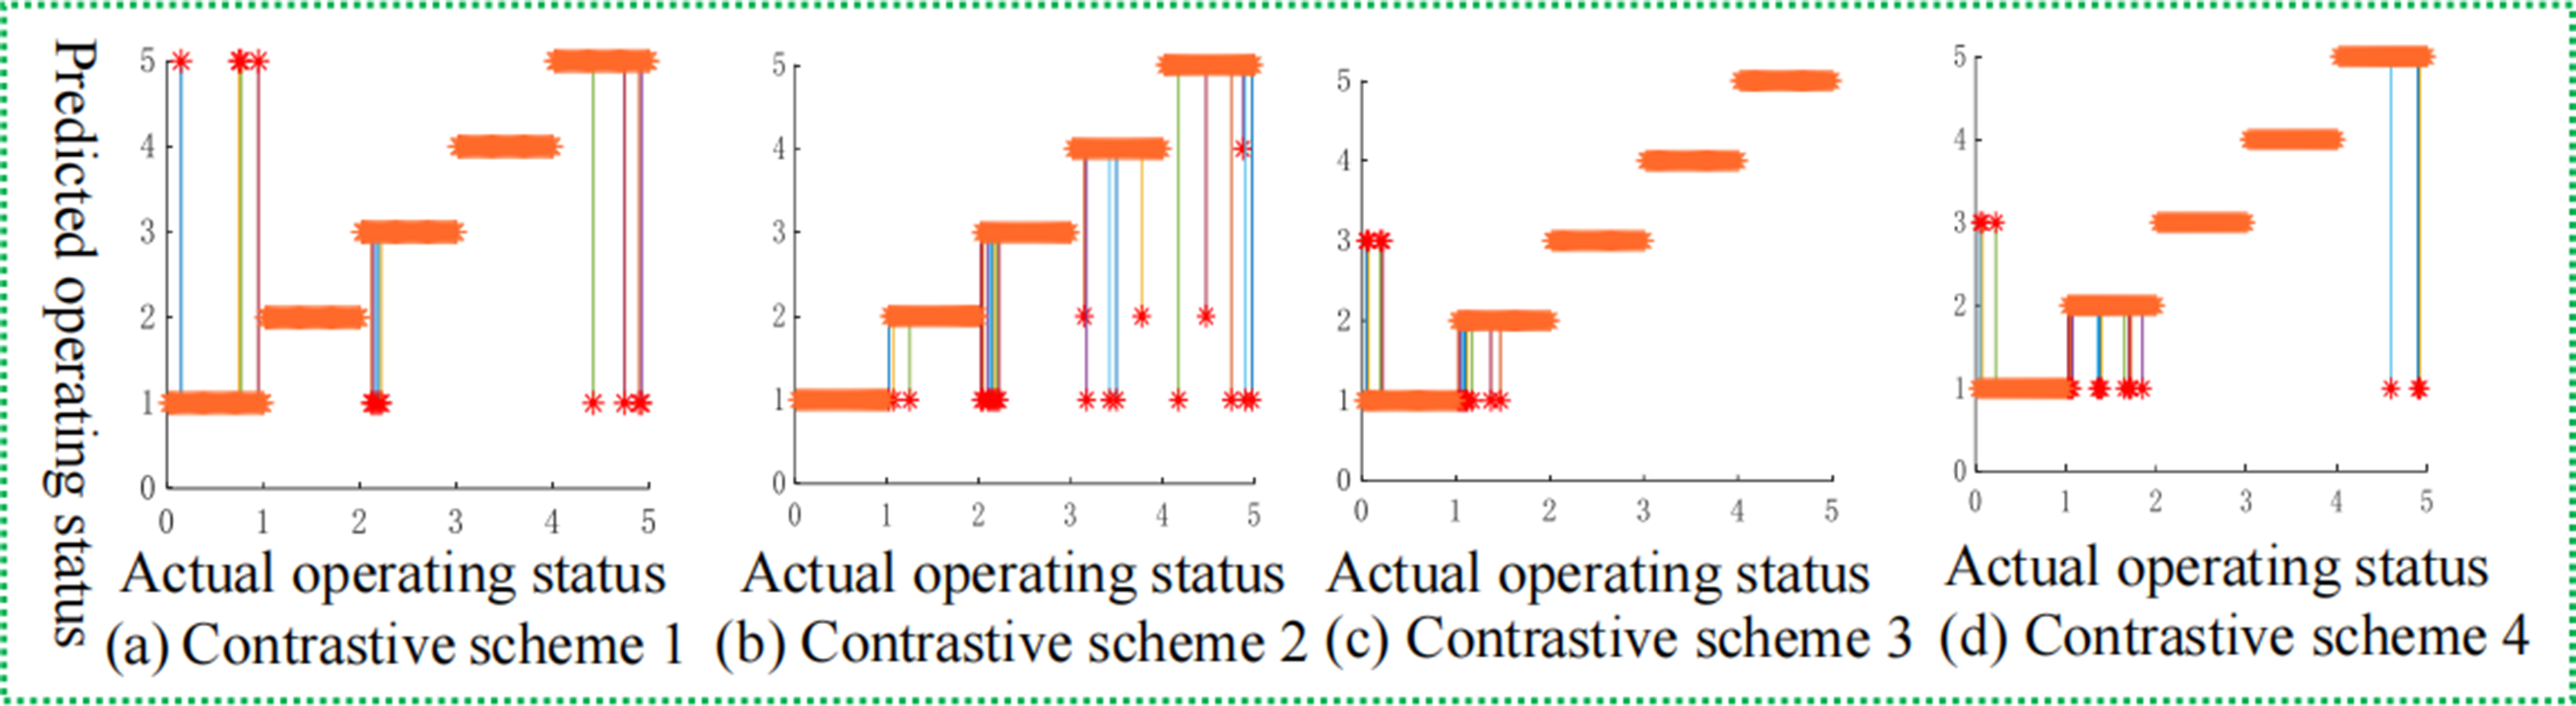
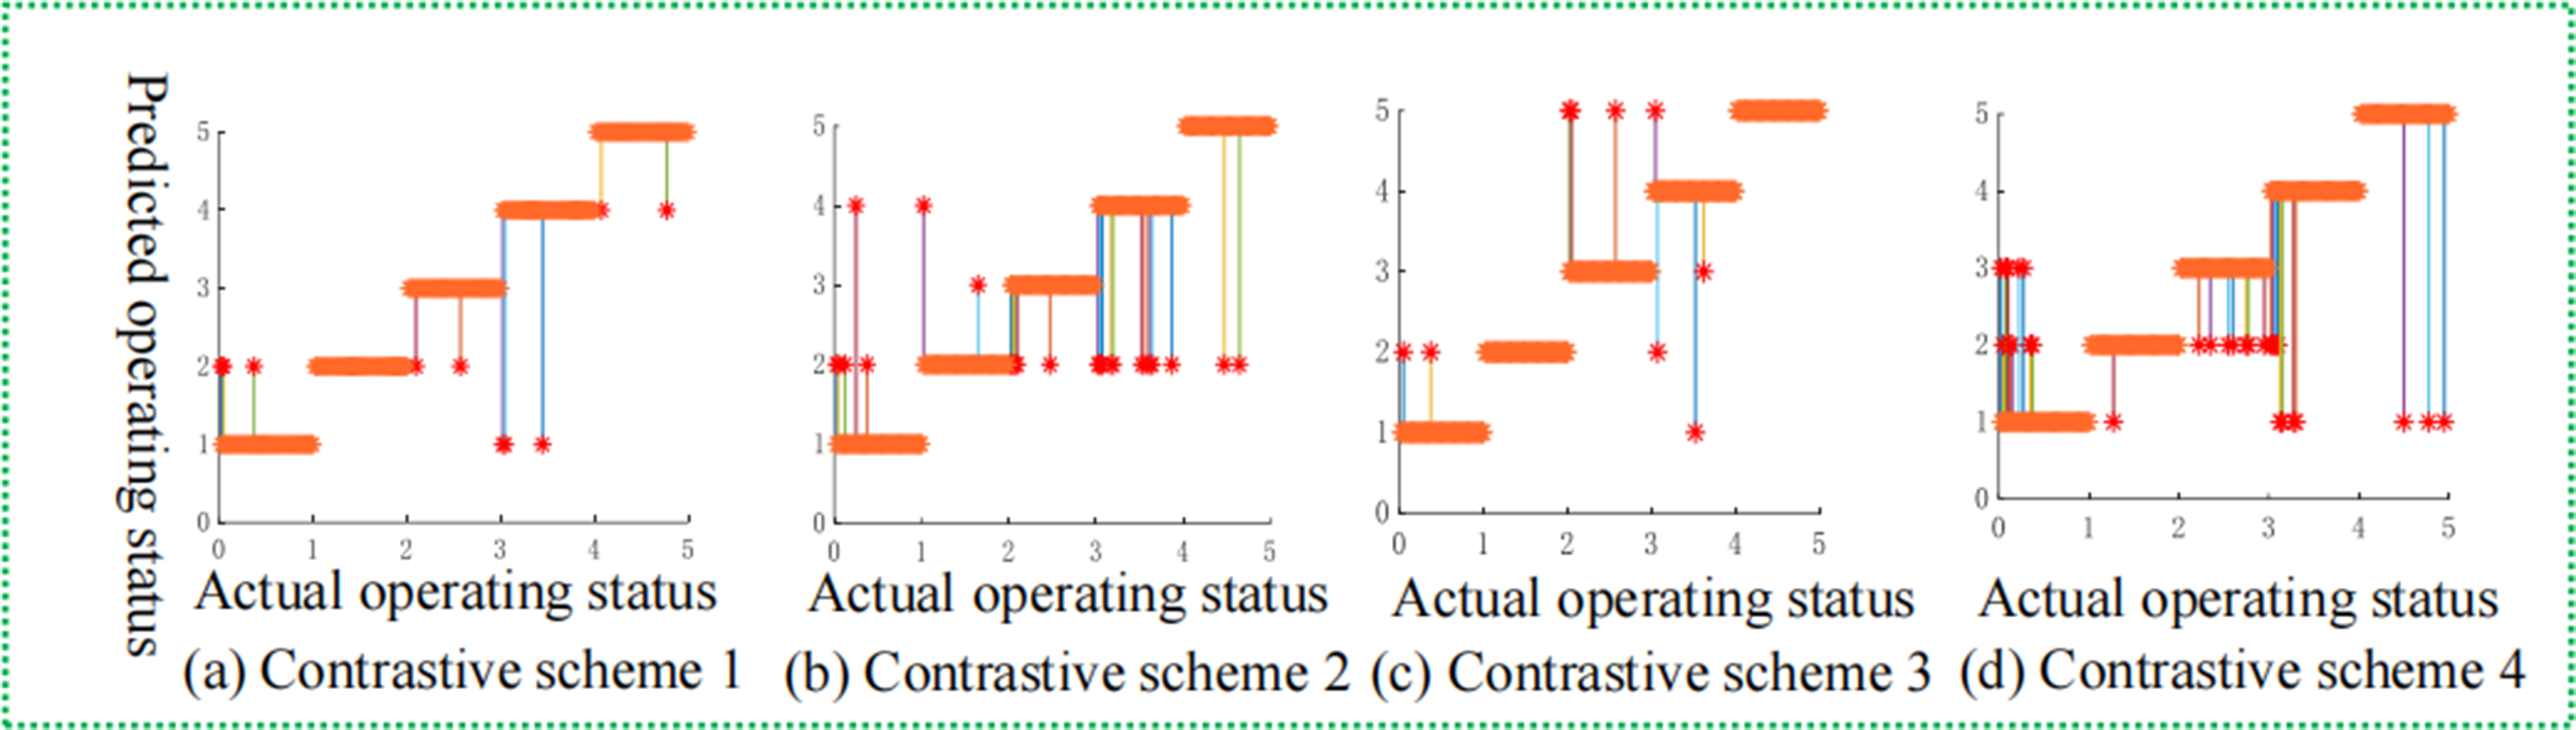
For further prove the accuracy of presented method, feature vectors are constructed and combined with mode recognition algorithm to identify the running state and rub-impact positions. As KNN classification algorithm is featured by multi-classification adaptability, it can effectively process multiple running states and identify different rub-impact positions, and is applicable to the analysis of nonlinear features of vibration signals. Therefore, KNN is treated as classification algorithm in the paper. In the classification and identification, half of data of each state is chosen as training samples and the other as testing samples, which is shown in Figure 9. For comparison and verification, the feature vectors constructed by four contrastive schemes are combined with KNN classification algorithm and the result is shown in Figures 10–11. Thereinto, Figure 9(a) and (b) corresponds to the result of data of the first and second experiment of proposed method. Figure 10 corresponds to the result of first experiment data and Figure 11 the second. In the Figures 9–11, x-coordinate is actual running state of equipment and y-coordinate is the forecasted running state; the number 1–5 in x-coordinate and y-coordinate respectively corresponds to five states: normal running (without a rub-impact fault) and rub-impact above, below, rightward and leftward turbine casing. KNN classification diagram of the proposed method KNN classification diagram of the comparative methods in the first experiment KNN classification results of comparative methods in the second experiment.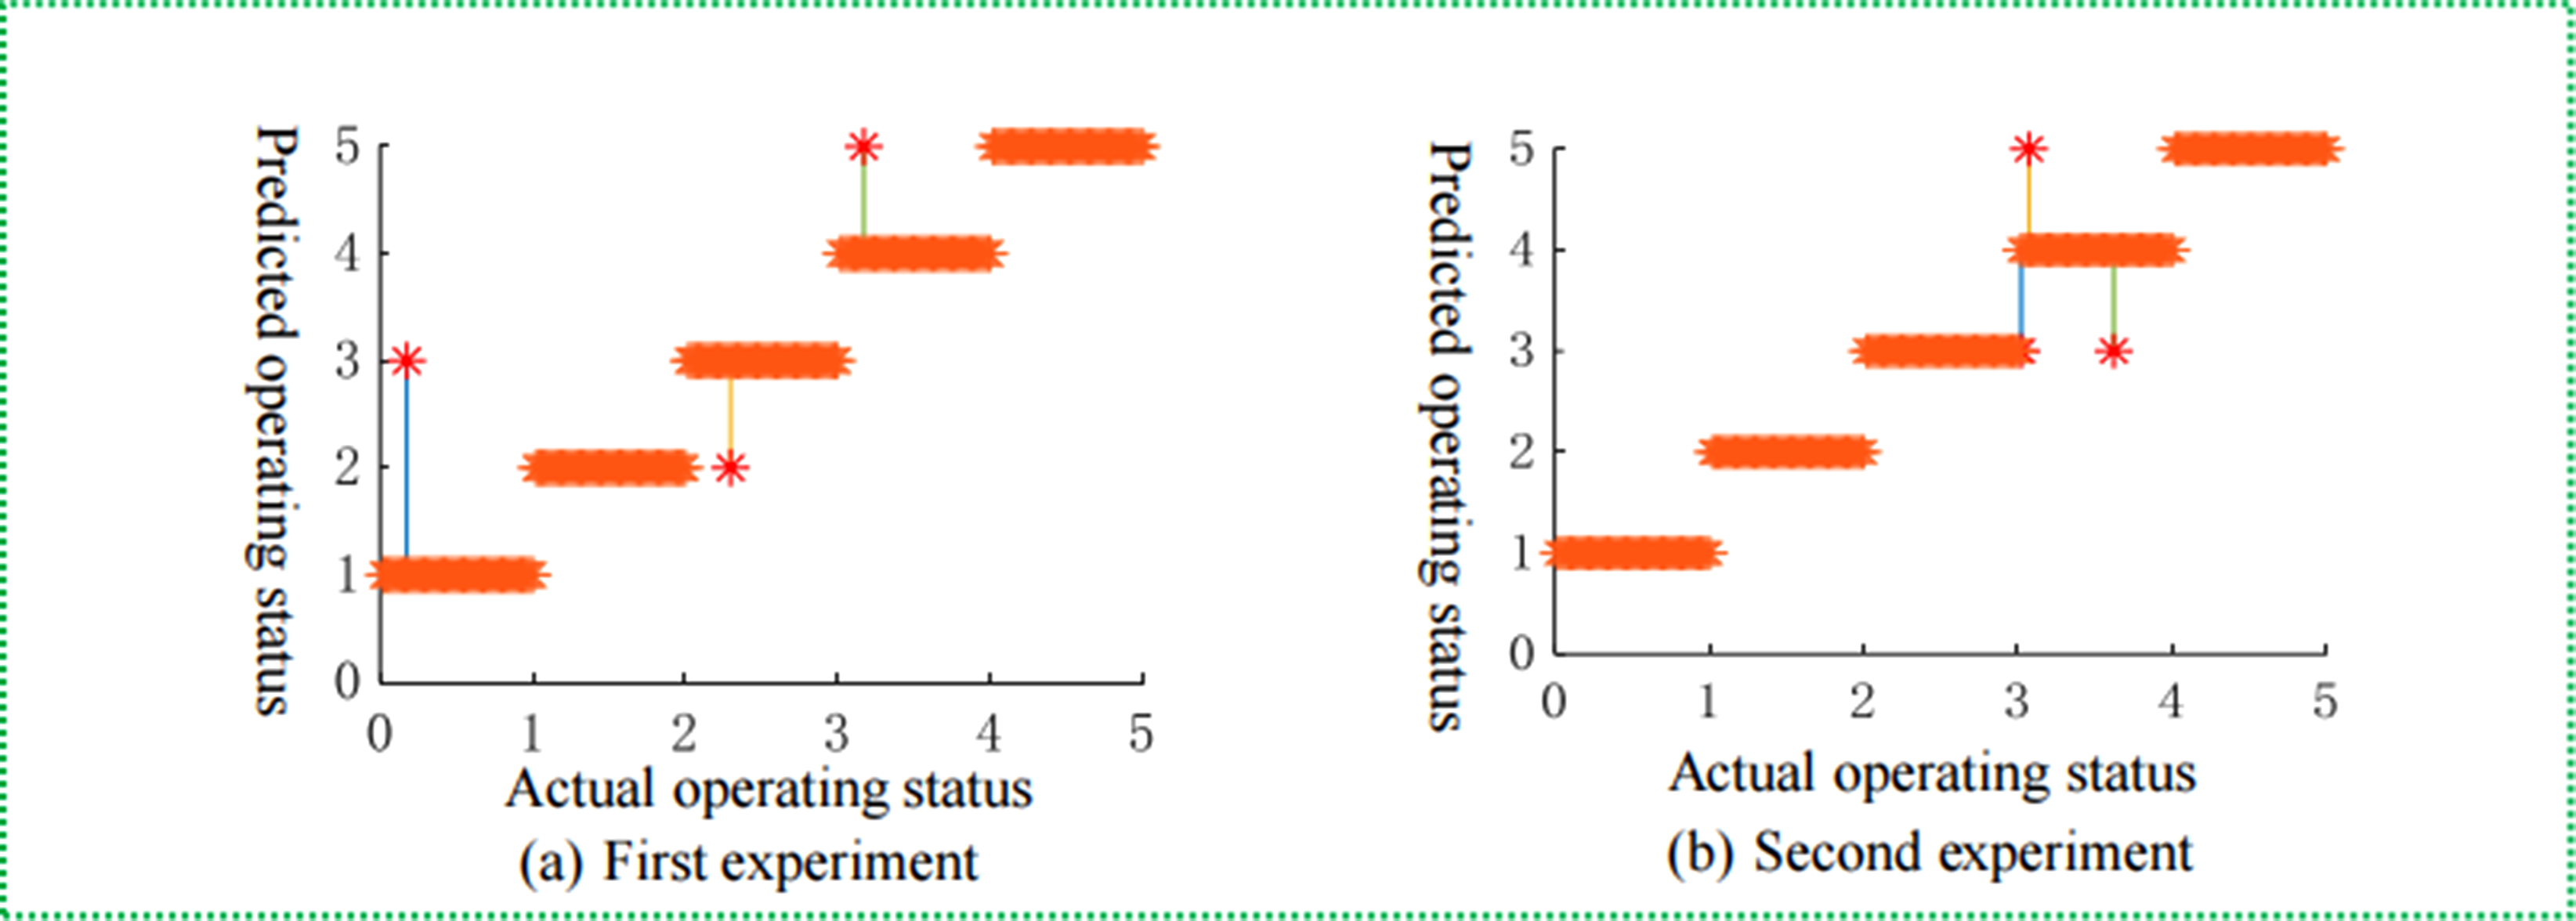
It can be found from the analysis of Figure 9 that the dual decomposition combined with Gini coefficient method has ideal performance in rub-impact fault identification and location. Details are as follow:
In Figure 9(a) and (b), the proposed SVMD-ITD algorithm has very high recognition rate for samples of five kinds of testing sets. In the two hundred testing sample sets for each experiment, only three samples are mistakenly classified and recognition rate can reach to 98.5%. This has verified the effectiveness of proposed method.
It can be found from the analysis of Figures 10–11 that the fault identification performance of four contrast methods is not as good as the method of paper in the two indecompendent experiments, but the method of taking Gini coefficient as feature index is better than the one of taking kurtosis as feature index in the performance of rub-impact fault identification and location. Details are shown as follow:
For example, in the first experiment (testing samples are entirely the same), when signal decomposition method is SVMD (Figure 10(a) and (b)), contrastive scheme 1 takes Gini coefficient as feature index and contrastive scheme 2 kurtosis. Then, 13 samples of contrastive scheme 1 are mistakenly classified and identification accuracy is 93.5%; 22 sample sets of contrastive scheme 2 are mistakenly classified and identification accuracy is 89%; For another example, in the second experiment, when signal decomposition method is ITD (Figure 11(c) and (d)), contrastive scheme 3 takes Gini coefficient as feature index and contrastive scheme 4 kurtosis. Then, 10 sample sets of contrastive scheme 3 are mistakenly classified and accuracy is 95%; 29 sample sets of contrastive scheme 4 are mistakenly classified and accuracy is 85.5%
Fault identification under different rotational speeds and rub-impact extents
In this section, in order to verify the effectiveness of proposed method, the data of slight rub-impact and rotate speed 1700 rpm is taken to identify and locate a rub-impact fault and the result is shown in Figure 12. Figure 12(a) is the t-SNE dendrogram of each state and the icons  still corresponds to the rub-impact positions on turbine casing, above, below, rightward and leftward and normal running (without a rub-impact fault). The x-coordinate of Figure 12(b) shows an actual operation state of equipment and y-coordinate shows a forecasted operation state. The numbers one-five in x-coordinate and y-coordinate correspond to the rub-impact positions on turbine casing, above, below, rightward and leftward, and normal running (without a rub-impact fault) five operation states.
Figure 12(a) shows that there is certain discreteness among samples when normal running (without a rub-impact fault), but this state has no aliasing with other states and can exactly distinguish normal samples from other states. In the Figure 12(b), two hundred groups of test set samples are classified with KNN classifier and only four samples are mistakenly classified. Accuracy of identification can reach to 98%. That means when rub-impact extent and rotate speed changes, the proposed method can still precisely identify and locate a rub-impact fault, which has verified the effectiveness and robustness of proposed method. The classification and identification result diagram of proposed method in different states – slight rub-impact, 1700 rpm 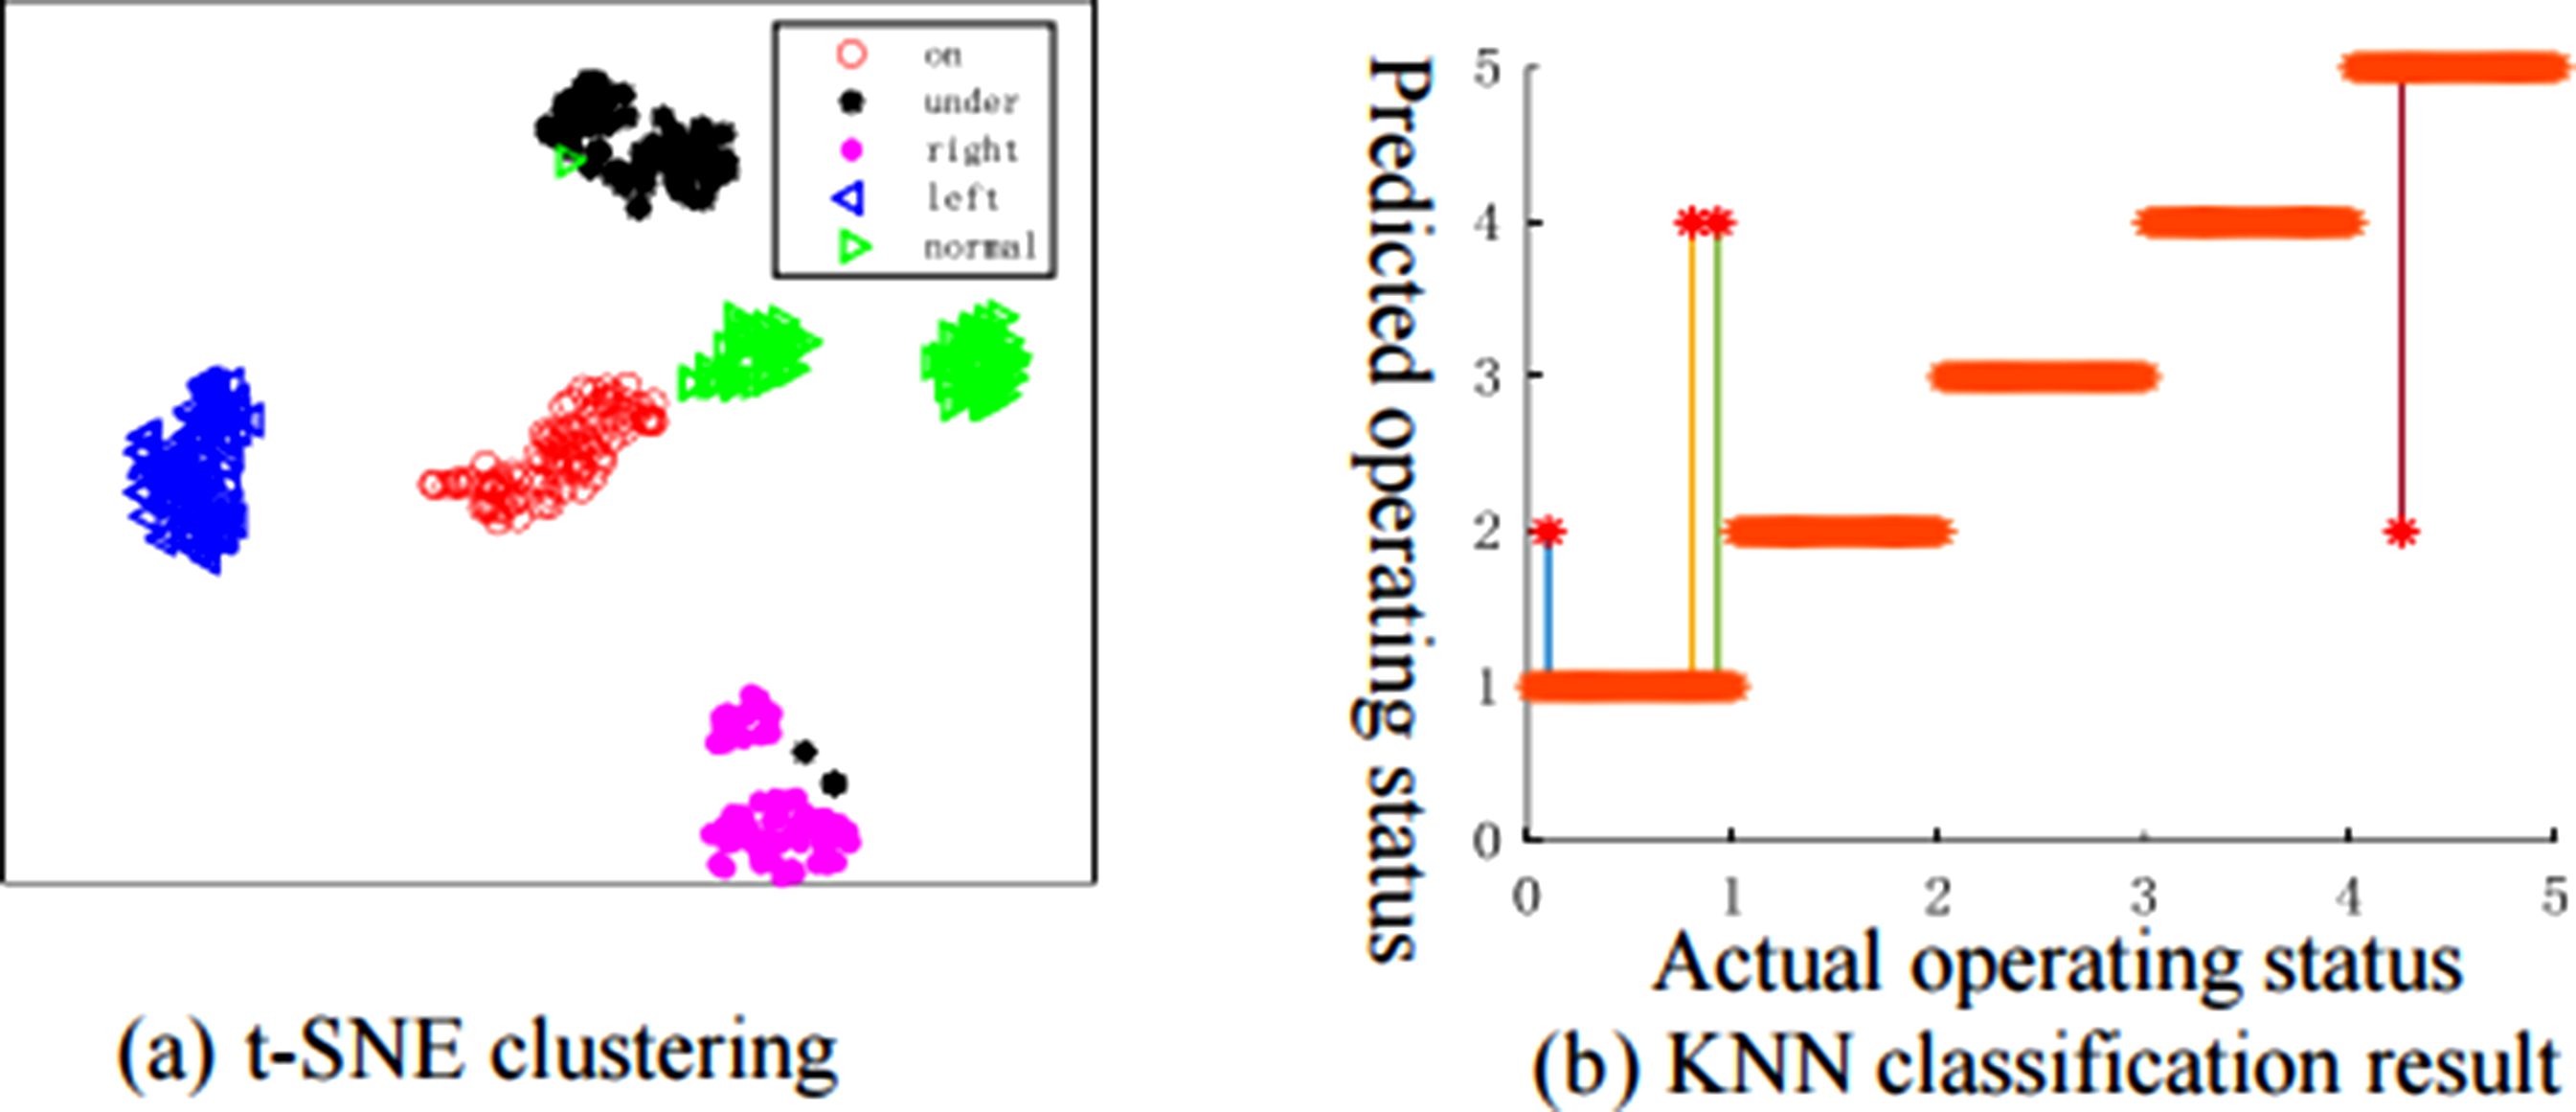
Conclusion
To effectively identify a rub-impact fault of aero-engine and accurately recognize an affected position, the paper starts with dual decomposition and proposes SVMD-ITD method. To verify the effectiveness of proposed method, four classical contrastive methods are implemented based on the same data and the following conclusion can be drawn: (1) The proposed SVMD-ITD method can further eliminate interference components, compared with single SVMD or ITD method, improve the robustness of feature and have better representation of rub-impact faults. (2) With the method of taking the Gini coefficient of component signals obtained by dual decomposition method as feature parameter, if running state of equipment keep the same, the features of signals collected by sensors from each position represent good aggregation; otherwise, the features of samples collected by the same sensor show significant discreteness, which is good for accurate determination of state and rub-impact position. (3) The proposed method can accurately identify a running state of equipment and rub-impact position. In the two independent experiments, the average recognition rate of testing samples can reach to 98.5%. Compared with four classical contrast methods, recognition rate is 5%–14.5% higher in the two independent experiments.
Footnotes
Declaration of conflicting interests
The authors declared no potential conflicts of interest with respect to the research, authorship, and/or publication of this article.
Funding
The authors disclosed receipt of the following financial support for the research, authorship, and/or publication of this article: This work was supported by National Natural Science Foundation of China [Grant No: 51605309], Department of Education of Liaoning Province [Grant No: LJKMZ20220529], Aeronautical Science Foundation of China [Grant No: 20230033054001], Natural Science Foundation of Liaoning Province [Grant No: 2022-MS-299], Steady fundamental supporting project phase II for scientific research institute of military industry [Grant No: 03020051] and the fundamental research funds for the universities of Liaoning province [LJ212410143047].
