
Abstract
To analyze the vibration response of the catenary under strong wind and icing conditions caused by wind speed variations, a 7-span catenary finite element model was established based on the ANSYS platform. The pulsating wind field acting on the contact network was numerically simulated by combining the spectral representation method. Firstly, wind-induced vibration analysis is conducted under strong wind conditions to reveal the correlation between wind speed and vibration characteristics. Secondly, an ice thickness calculation model is developed to evaluate the impact of icing on the catenary. Finally, typical icing wind speeds are applied to comprehensively analyze the response characteristics under wind-ice coupling. The results indicate that under strong wind conditions, lateral displacement dominates the catenary vibration, with amplitudes significantly larger than vertical displacements (maximum lateral: 249.63 mm, maximum vertical: −4.94 mm). The dominant frequencies are 1.14 Hz (lateral) and 1.04 Hz (vertical), respectively. Under icing conditions, vertical displacement of the catenary increases significantly with ice thickness (sag exceeds 0.1 m with 25 mm of ice). Under wind-ice coupling, within typical icing wind speed ranges, lateral displacement changes insignificantly with ice thickness, but vertical sag becomes the primary risk. The findings provide a theoretical basis for differentiated safety assessment and the development of protective strategies for catenary systems under complex climatic conditions.
Introduction
The pantograph-catenary system is a vital component for power transmission in electrified railways. Its operational stability is directly challenged by extreme meteorological conditions, among which strong crosswinds and icing are the most critical. 1
Extensive research has been conducted to quantify the dynamic responses of catenary systems under pure aerodynamic loads. Numerical simulations, particularly nonlinear finite element methods (FEM), have been widely employed to analyze wind-induced vibrations, spatial stochastic wind field responses, and their subsequent impacts on pantograph-catenary interactions.2–4 To validate these numerical models, researchers have conducted rigorous wind tunnel tests using aeroelastic models to determine aerodynamic coefficients and wind deflection mechanisms.5,6 Furthermore, advanced field monitoring systems and analytical measurement methods have been developed to capture real-time vibration characteristics and wave reflections under operational conditions.7,8
In addition to wind loads, ice accumulation significantly alters the structural and mechanical properties of the catenary network. Existing literature on catenary icing has explored the fundamental icing characteristics across various environments, 9 with a specific focus on the multiphysics simulation and structural optimization of critical components such as cantilever insulators.10,11 It is well established that the accumulation of ice inevitably degrades the dynamic performance of the pantograph-catenary interaction, imposing severe constraints on train speeds.12,13 To mitigate these operational hazards, recent studies have also advanced ice prediction models utilizing deep learning 14 and explored various electrothermal and high-frequency de-icing techniques.15–17
While the independent effects of wind and ice have been thoroughly investigated, the coupled wind-ice condition presents a far more complex fluid-structure interaction. The combined effects of wind and icing have been extensively analyzed in mountainous high-voltage transmission lines, 18 and phenomena such as the galloping oscillation of iced catenaries under crosswinds have been observed. 19 Moreover, accurate shape-finding techniques for ice-covered wires based on finite element analysis have been recognized as a prerequisite for reliable simulations. 20 However, a comprehensive nonlinear analysis detailing how the concurrent alteration of aerodynamic loads and the massive increase in structural inertia under coupled wind-ice conditions affect the spatial displacement of multi-span catenaries remains insufficient.
To address this gap, this study establishes a nonlinear finite element model of a 7-span simple chain-type catenary based on the ANSYS platform. The geometric nonlinearity of the flexible wires and the initial pre-tension effects are fully incorporated to ensure structural fidelity. A spatial stochastic wind field is synthesized using the spectral representation method based on the Davenport spectrum, while ice accretion is modeled by concurrently updating the conductors’ linear mass and equivalent aerodynamic diameters. This research quantitatively evaluates the spatial displacement responses—specifically lateral wind deflection and vertical sag—under various combinations of mean wind speeds and ice thicknesses. By analyzing the competition between the increased structural inertia and the altered aerodynamic loads, this study clarifies the dominant failure modes under coupled wind-ice conditions, providing a theoretical basis for the disaster prevention and maintenance of intercity railway catenary systems in cold and high-wind regions.
Methodology
Finite element model of the catenary
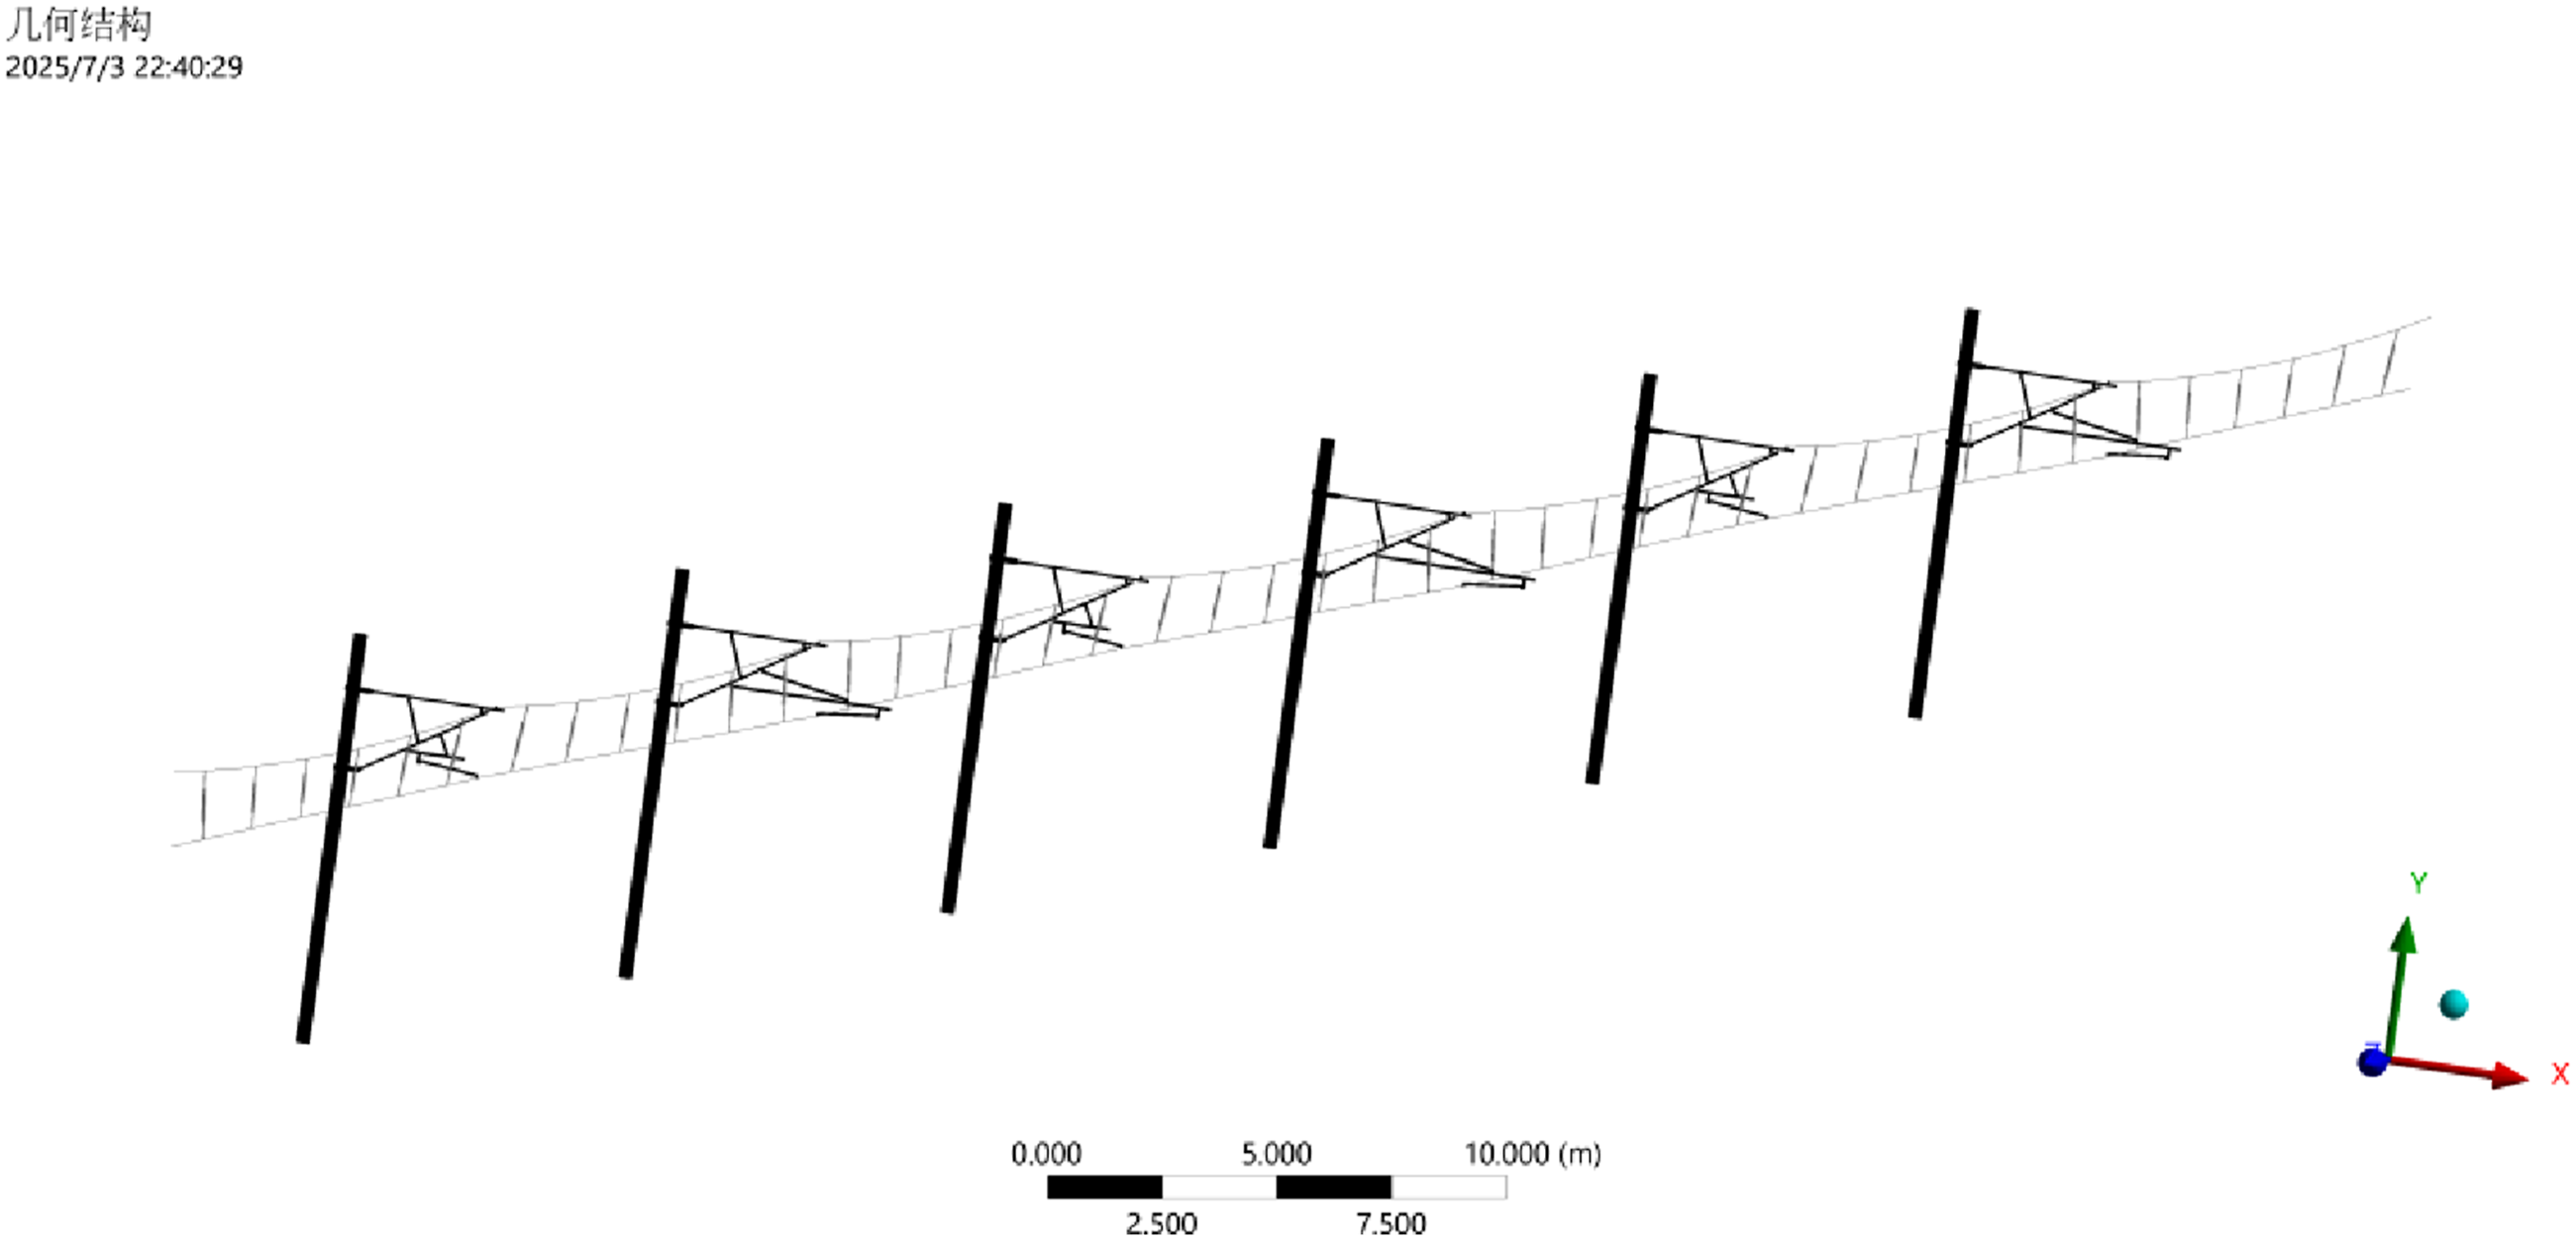
A 3D solid model of the catenary is established in SolidWorks and then imported into Ansys for finite element analysis. Since the catenary system is particularly complex, the solid model must be simplified for finite element analysis. The catenary solid model primarily includes the contact wire, messenger wire, droppers, and supporting and positioning devices. A 7-span simple chain-type catenary solid model is selected as the object for finite element analysis. The following assumptions and simplifications are made for the catenary and its boundary conditions during simulation: (1) The geometric stiffness effect cannot be ignored when the contact wire and messenger wire vibrate; therefore, beam elements in Ansys are used to model these components.
21
(2) The mass of each dropper is equally distributed to the clamps at both ends. The dropper is simplified into a spring-mass system consisting of concentrated masses at both ends and a spring in the middle, which are modeled in Ansys using Mass21 and Spring elements, respectively. (3) In this paper, the insulators of the catenary are only considered for their mechanical properties and can be simplified accordingly. (4) The wrist arm is linked to the support pillar through a revolute joint, enabling rotational motion about the pillar axis. The messenger wire and the horizontal wrist arm are connected via a Fixed Joint element. (5) The connection between the dropper and the dropper tube is hinged, simulated using a Revolute Joint element, while the interaction between the contact wire and the dropper is represented by a fixed joint, maintaining structural continuity during dynamic analysis. (6) To enable longitudinal vibration of the catenary, the Z-direction translational degree of freedom at one end of both the contact wire and messenger wire is unconstrained, as illustrated in Figure 1. A constant tensile force is introduced to mimic the clamping effect of the ratchet system in real-world catenary configurations, where the contact wire is subjected to 21 kN and the messenger wire to 15 kN. The other end is fully constrained to simulate the central anchor. (7) Nodes at the base of each support pillar are fully fixed. Finite element model of the 7-span catenary.
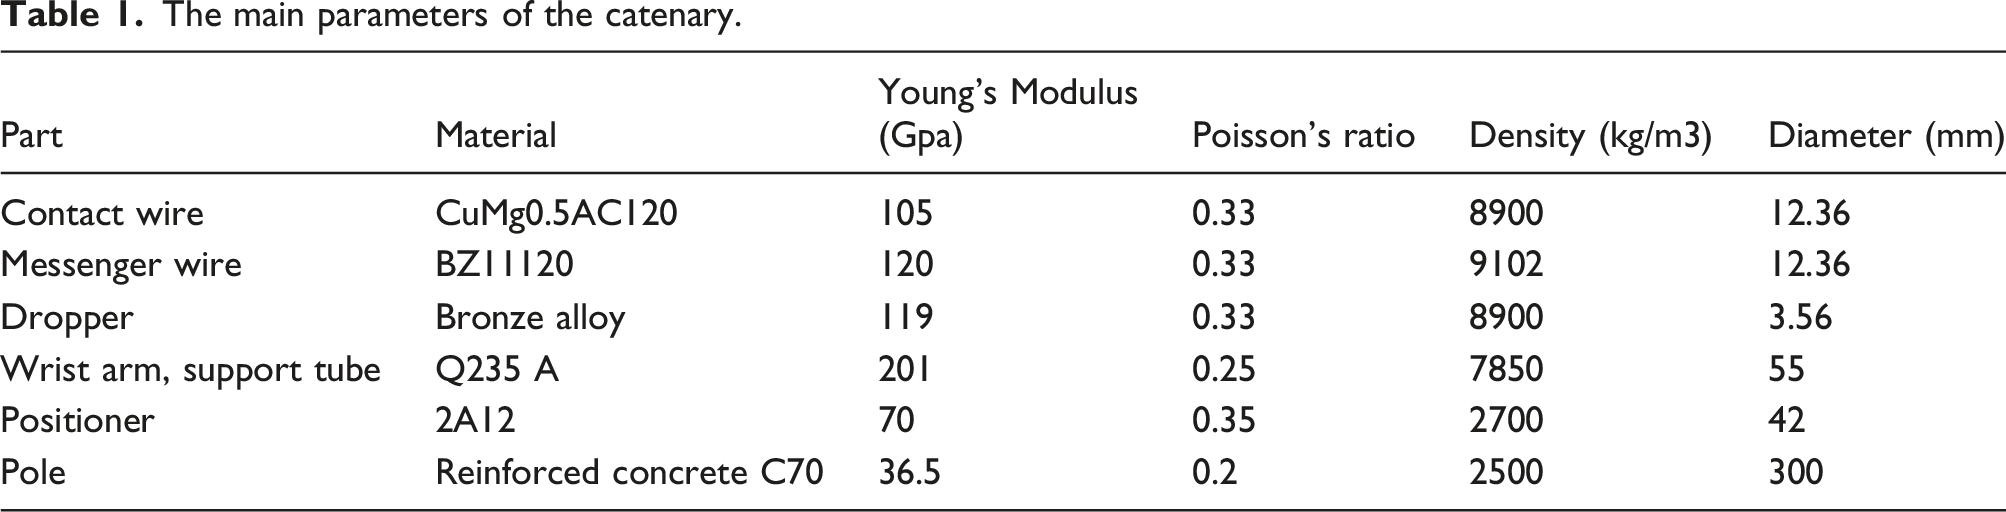
The main parameters of the catenary.
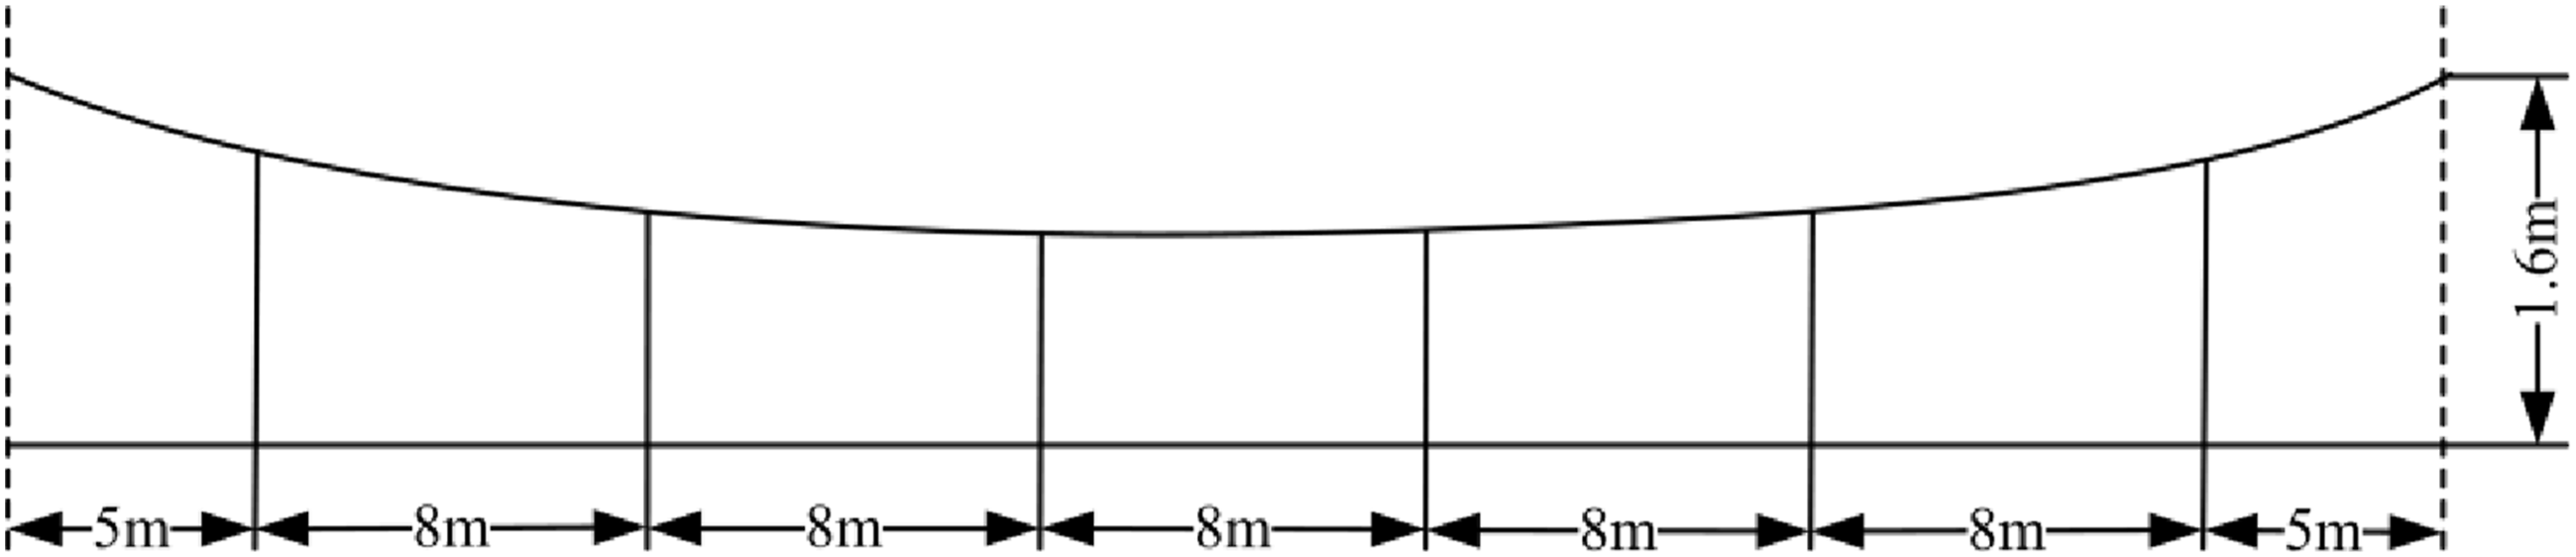
Hanging string arrangement.
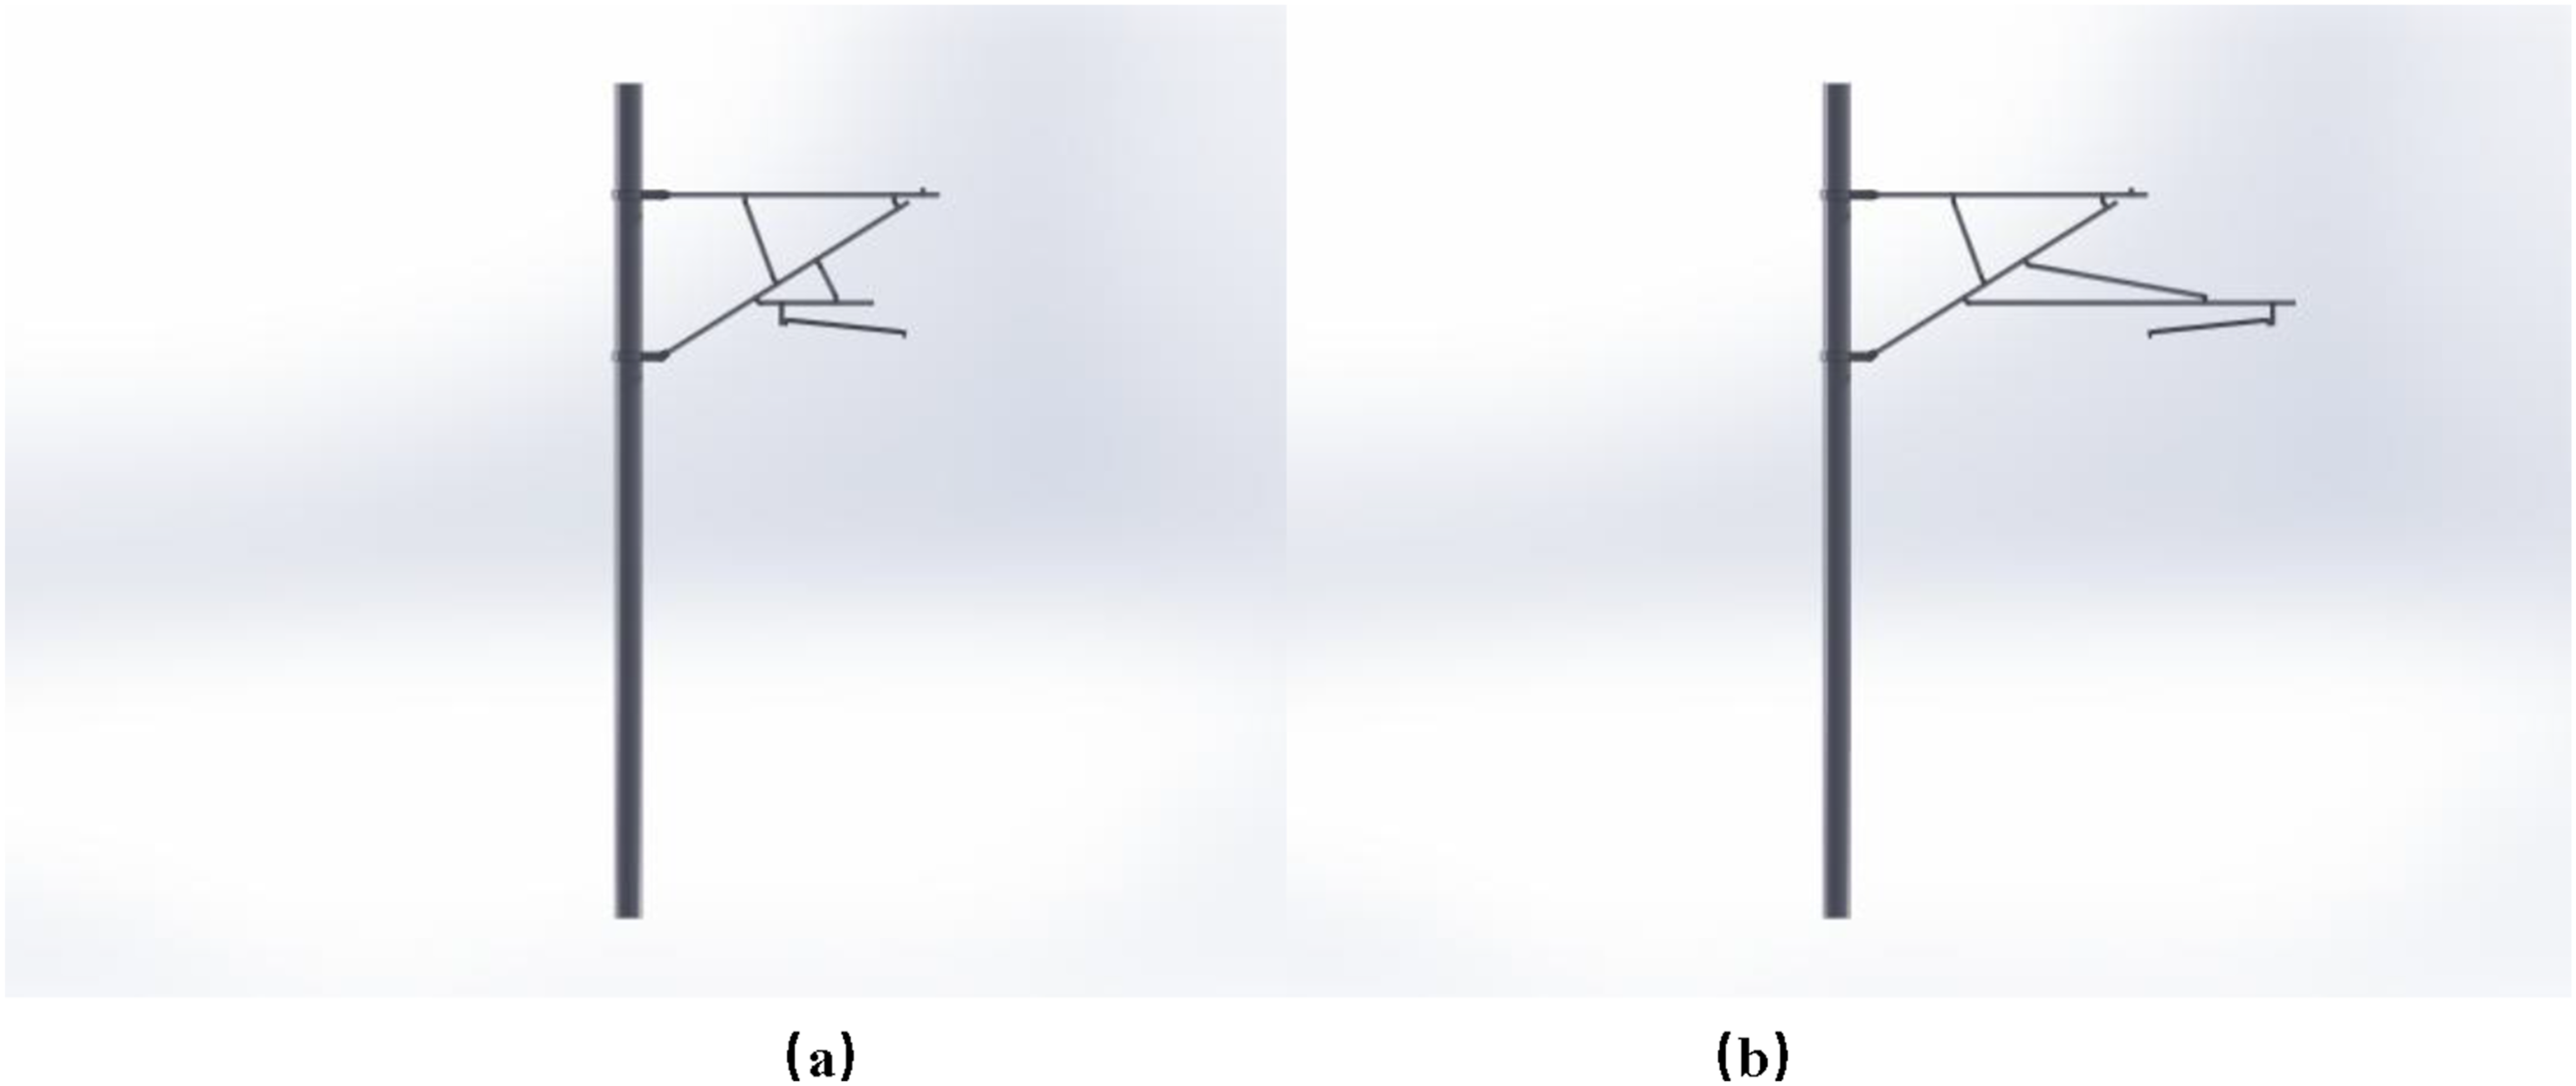
The support structure of the catenary: (a) Pull-off; (b) Push-off.
Simulation of catenary fluctuating wind field based on spectral representation method
Fundamental characteristics of wind
The total wind velocity u(t) at a spatial location (x, y, z) is composed of a steady mean component U(z) and a time-varying turbulent fluctuation v(t). 23 Given that the mean wind profile is temporally invariant over short durations, the primary focus of wind speed time-history generation lies in modeling the stochastic fluctuations. The turbulent wind component typically exhibits a near-Gaussian probability distribution and is statistically defined by its power spectral density and spatial correlation structure. The power spectral density (PSD), which represents the frequency-domain energy distribution of the fluctuating wind velocity v(t), quantifies how turbulence energy is distributed across different frequencies. The spatial correlation function captures the degree of statistical dependence between wind fluctuations at distinct locations within the flow field.
The wind speed acting at any point (x, y, z) in space is given by:
In space, the mean wind speed varies with height; therefore, the logarithmic law is used to calculate the mean wind speed: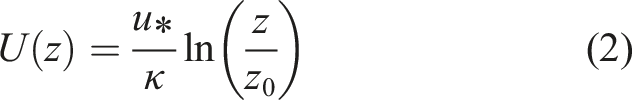
Given the limited vertical elevation change across the catenary, the Davenport spectrum—widely recognized as appropriate for turbulent flow in the atmospheric boundary layer—is employed to model the temporal variation of fluctuating wind speeds. The power spectral density of turbulence, as defined by the Davenport model, is formulated as follows: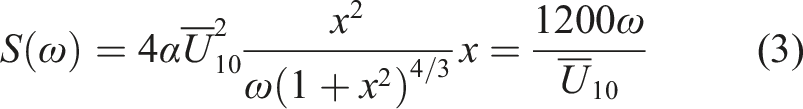
The cross-spectral density function between any two points x and y is as follows:
The correlation between any two spatial points 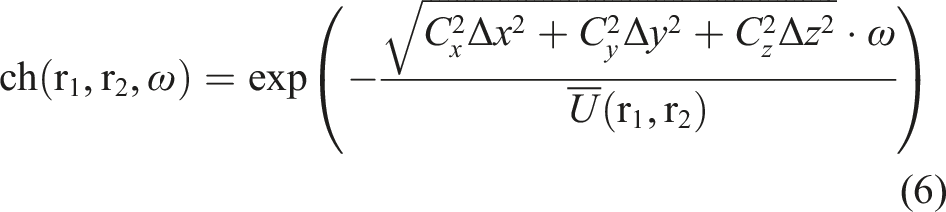
Wind field simulation
There are numerous methods for simulating fluctuating wind fields. In engineering applications, these methods are mainly categorized into the harmonic superposition method and the linear filtering method
24
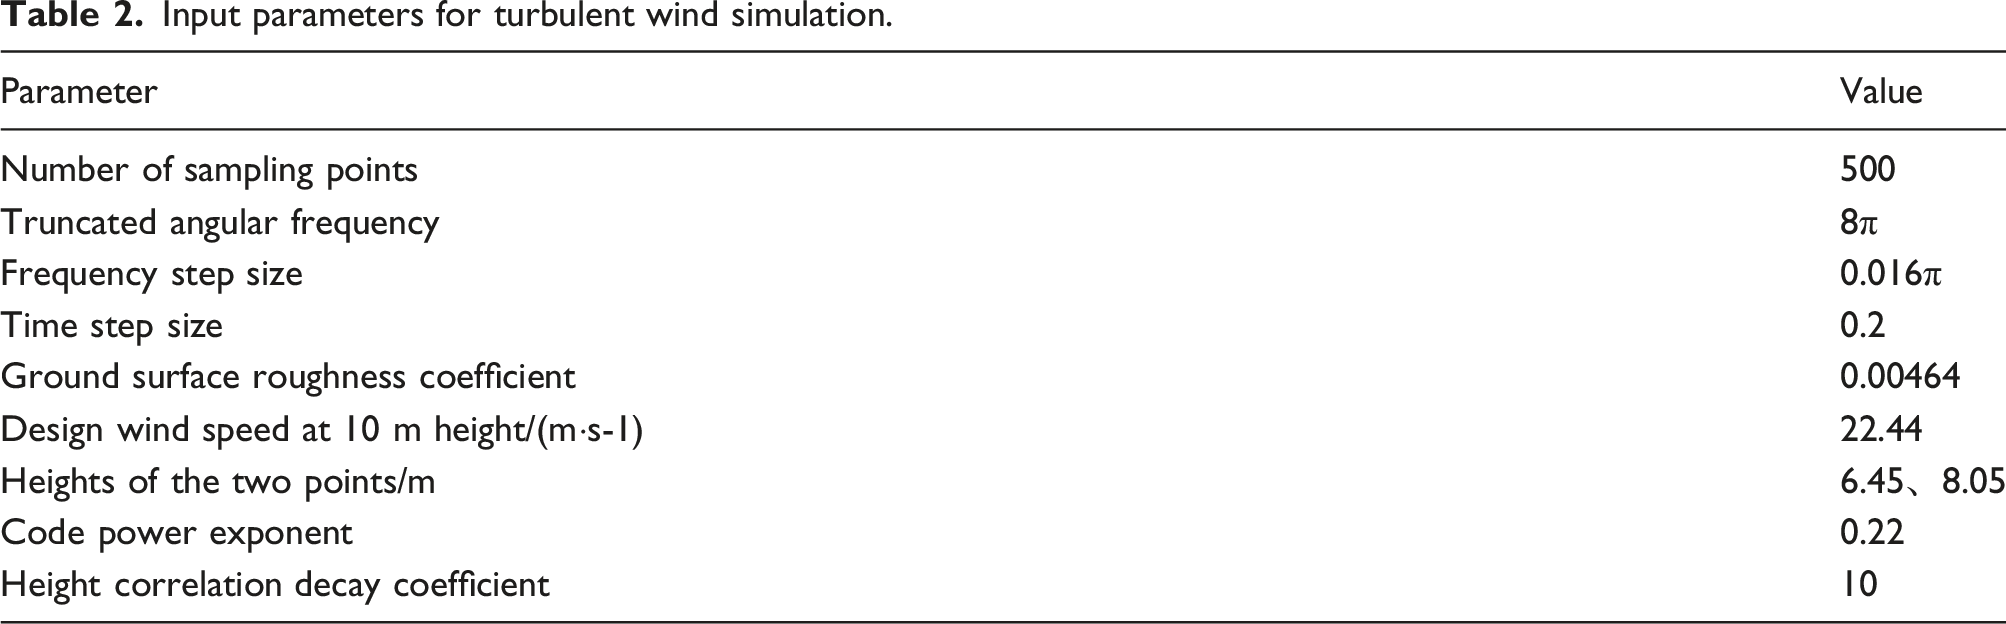
; however, these methods often face a trade-off between accuracy and computational efficiency. In this paper, the spectral representation method is adopted. This method decomposes the random process into harmonic components of different frequencies via Fourier transform, and generates time-domain signals by incorporating the target power spectral density function and spatial correlation function. The main steps are as follows: (1) The simulation process begins with the specification of key parameters, followed by the generation of wind speed time histories at the vertical positions of the contact wire and messenger wire support locations. The fundamental parameters for the fluctuating wind field simulation are determined according to the Chinese National Standard “Load Code for the Design of Building Structures” (GB 50,009-2012) and the specific operating environment of the intercity railway. The catenary system is assumed to be located in Terrain Category C (representing typical suburban areas or environments with dense obstacles). Therefore, the ground surface roughness coefficient is set to 0.00,464, and the wind profile power exponent is taken as 0.22. A summary of the simulation settings used in this study is provided in Table 2. (2) According to the fundamental characteristics of wind, fluctuating wind approximately follows a Gaussian distribution, and a discrete spectrum can be used to approximate the target random process. Consider n stationary Gaussian random processes with zero mean, whose spectral density function matrix is given by: Input parameters for turbulent wind simulation.
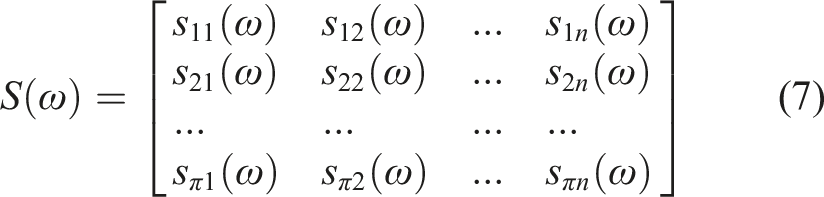

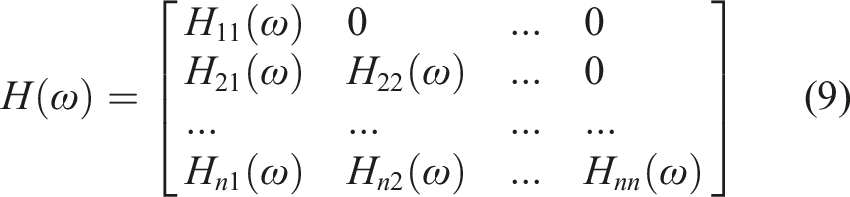
Since this paper only performs single-point wind speed simulation, for a multi-dimensional random process vector v(t) with a power spectral density matrix 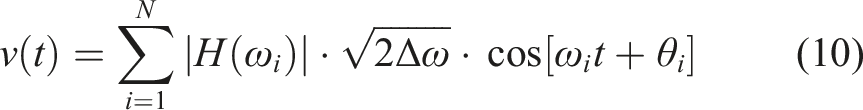
The total frequency bandwidth of the wind spectrum is partitioned into N discrete subintervals of equal width, where
The synthesized wind speed time history, formed by adding the mean wind speed to the generated fluctuating component, is illustrated in Figure 4. Wind speed time history curve under strong wind:(a) 6.45 m Wind speed; (b) 8.05 m Wind speed.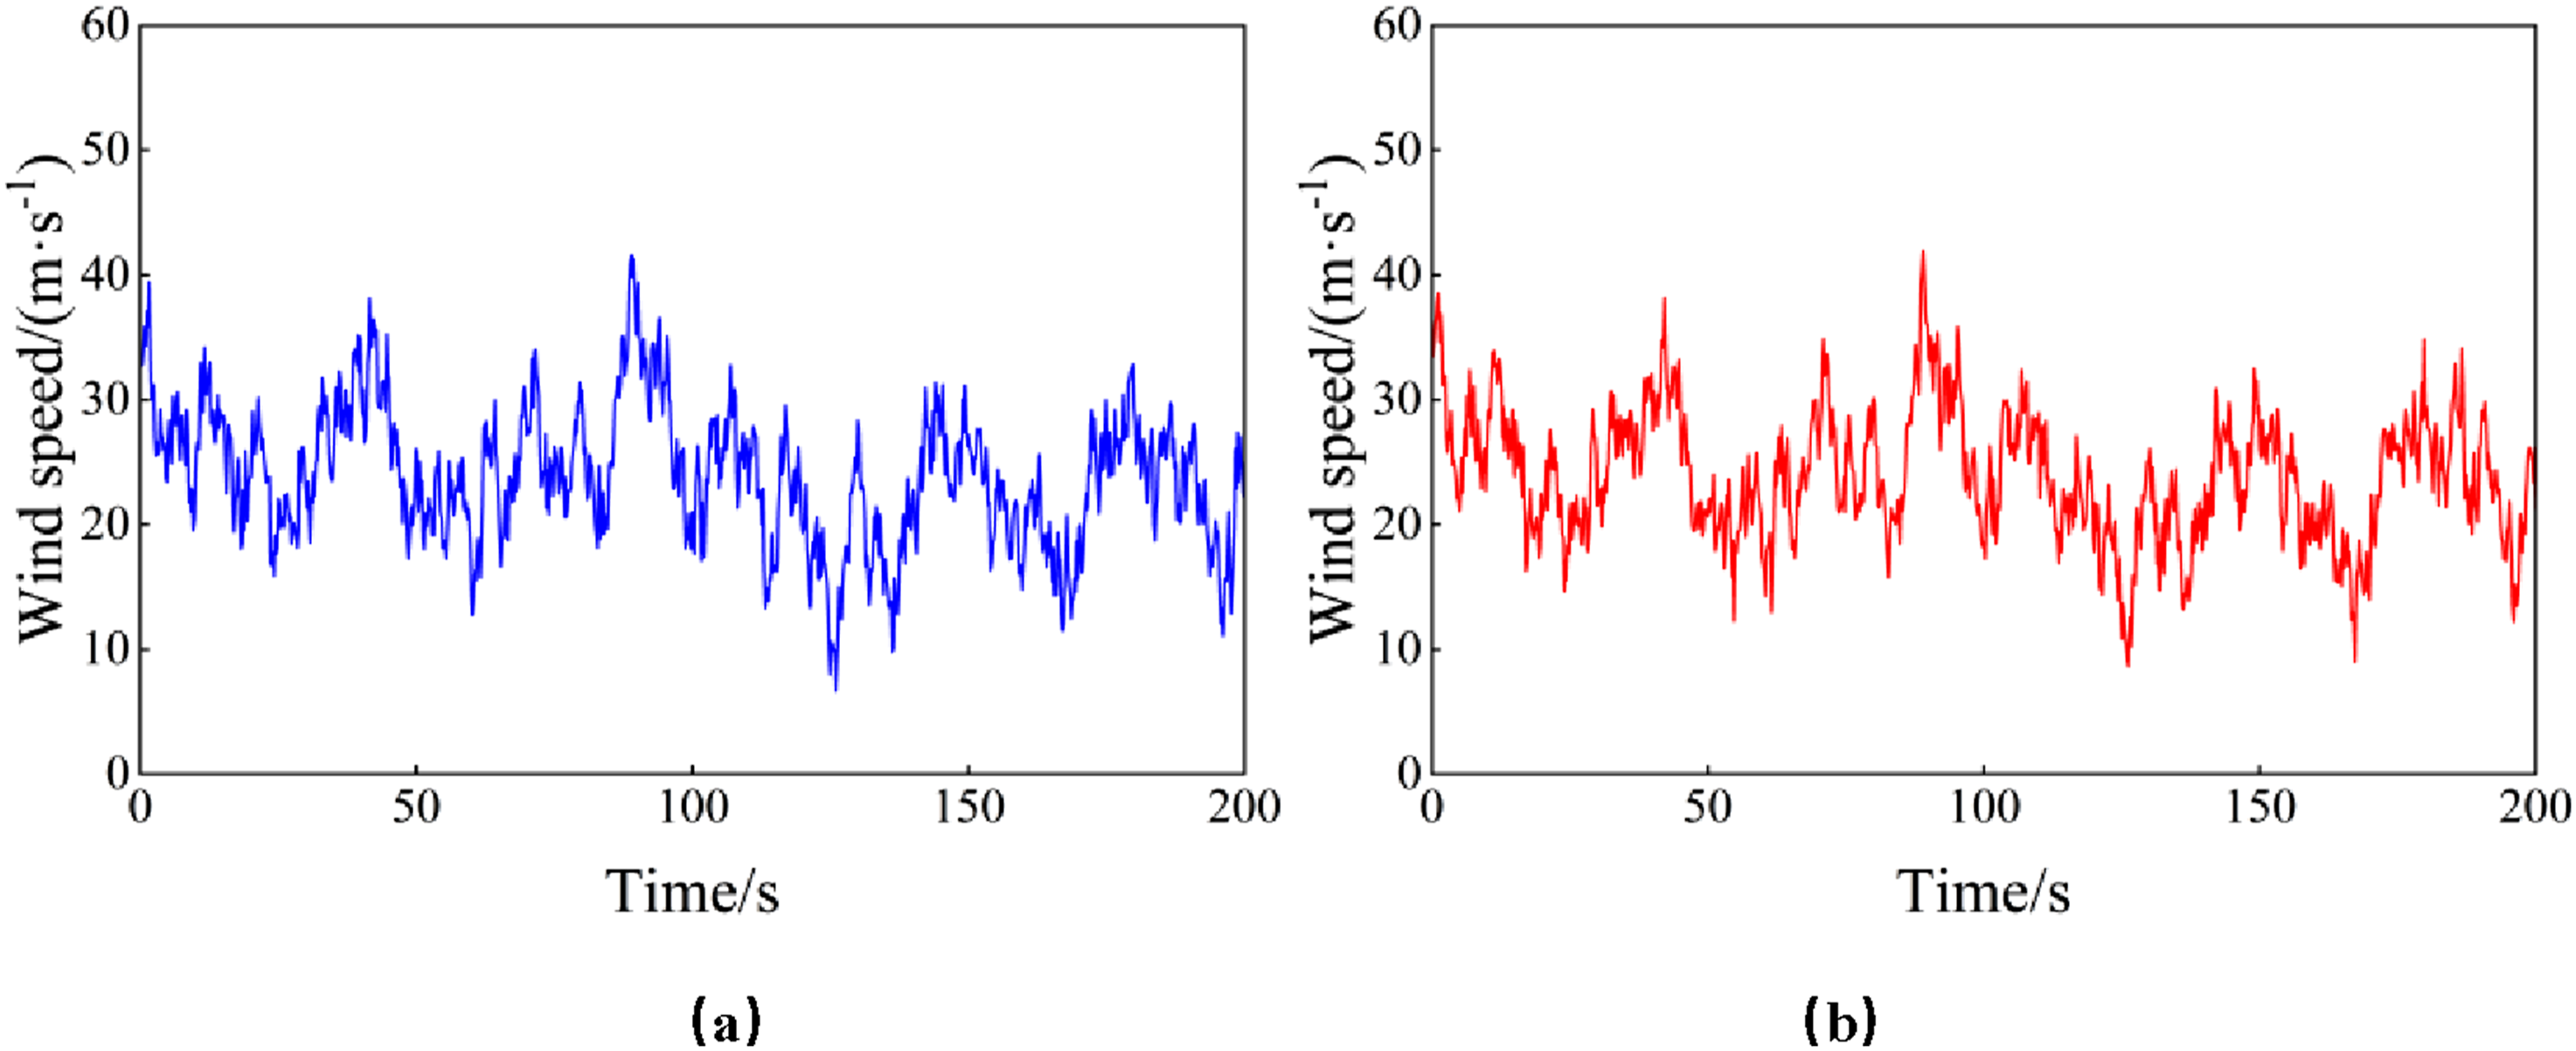
To verify the frequency-domain accuracy of the simulated wind speed time histories, Fast Fourier Transform (FFT) spectral analysis is performed on the generated wind speed sequences. As shown in Figure 5, the overall trend indicates that the simulated spectra generally coincide with the target spectra in the low-frequency range (0.01–0.1 Hz), accurately reflecting the primary energy distribution characteristics of wind loads. This demonstrates that the simulation method possesses high precision in capturing the dominant frequency components of the wind field.As the frequency increases, the simulated spectra exhibit certain fluctuations and localized peaks in the medium-to-high frequency regions, with particularly pronounced oscillations observed in the 0.1–1 Hz range. These phenomena may originate from the inherent randomness or discretization errors introduced during the numerical generation process. Nevertheless, the overall decay trend of the simulated spectra remains consistent with that of the target spectra, without exhibiting any divergence. This indicates that the simulation results maintain good convergence and physical rationality in the frequency domain.Although minor discrepancies exist in the high-frequency components, the overall matching degree is satisfactory. The results validate the feasibility of the constructed fluctuating wind speed time-history data for engineering applications and confirm their suitability for subsequent dynamic response analysis of catenary structures. Power spectrum verification diagram.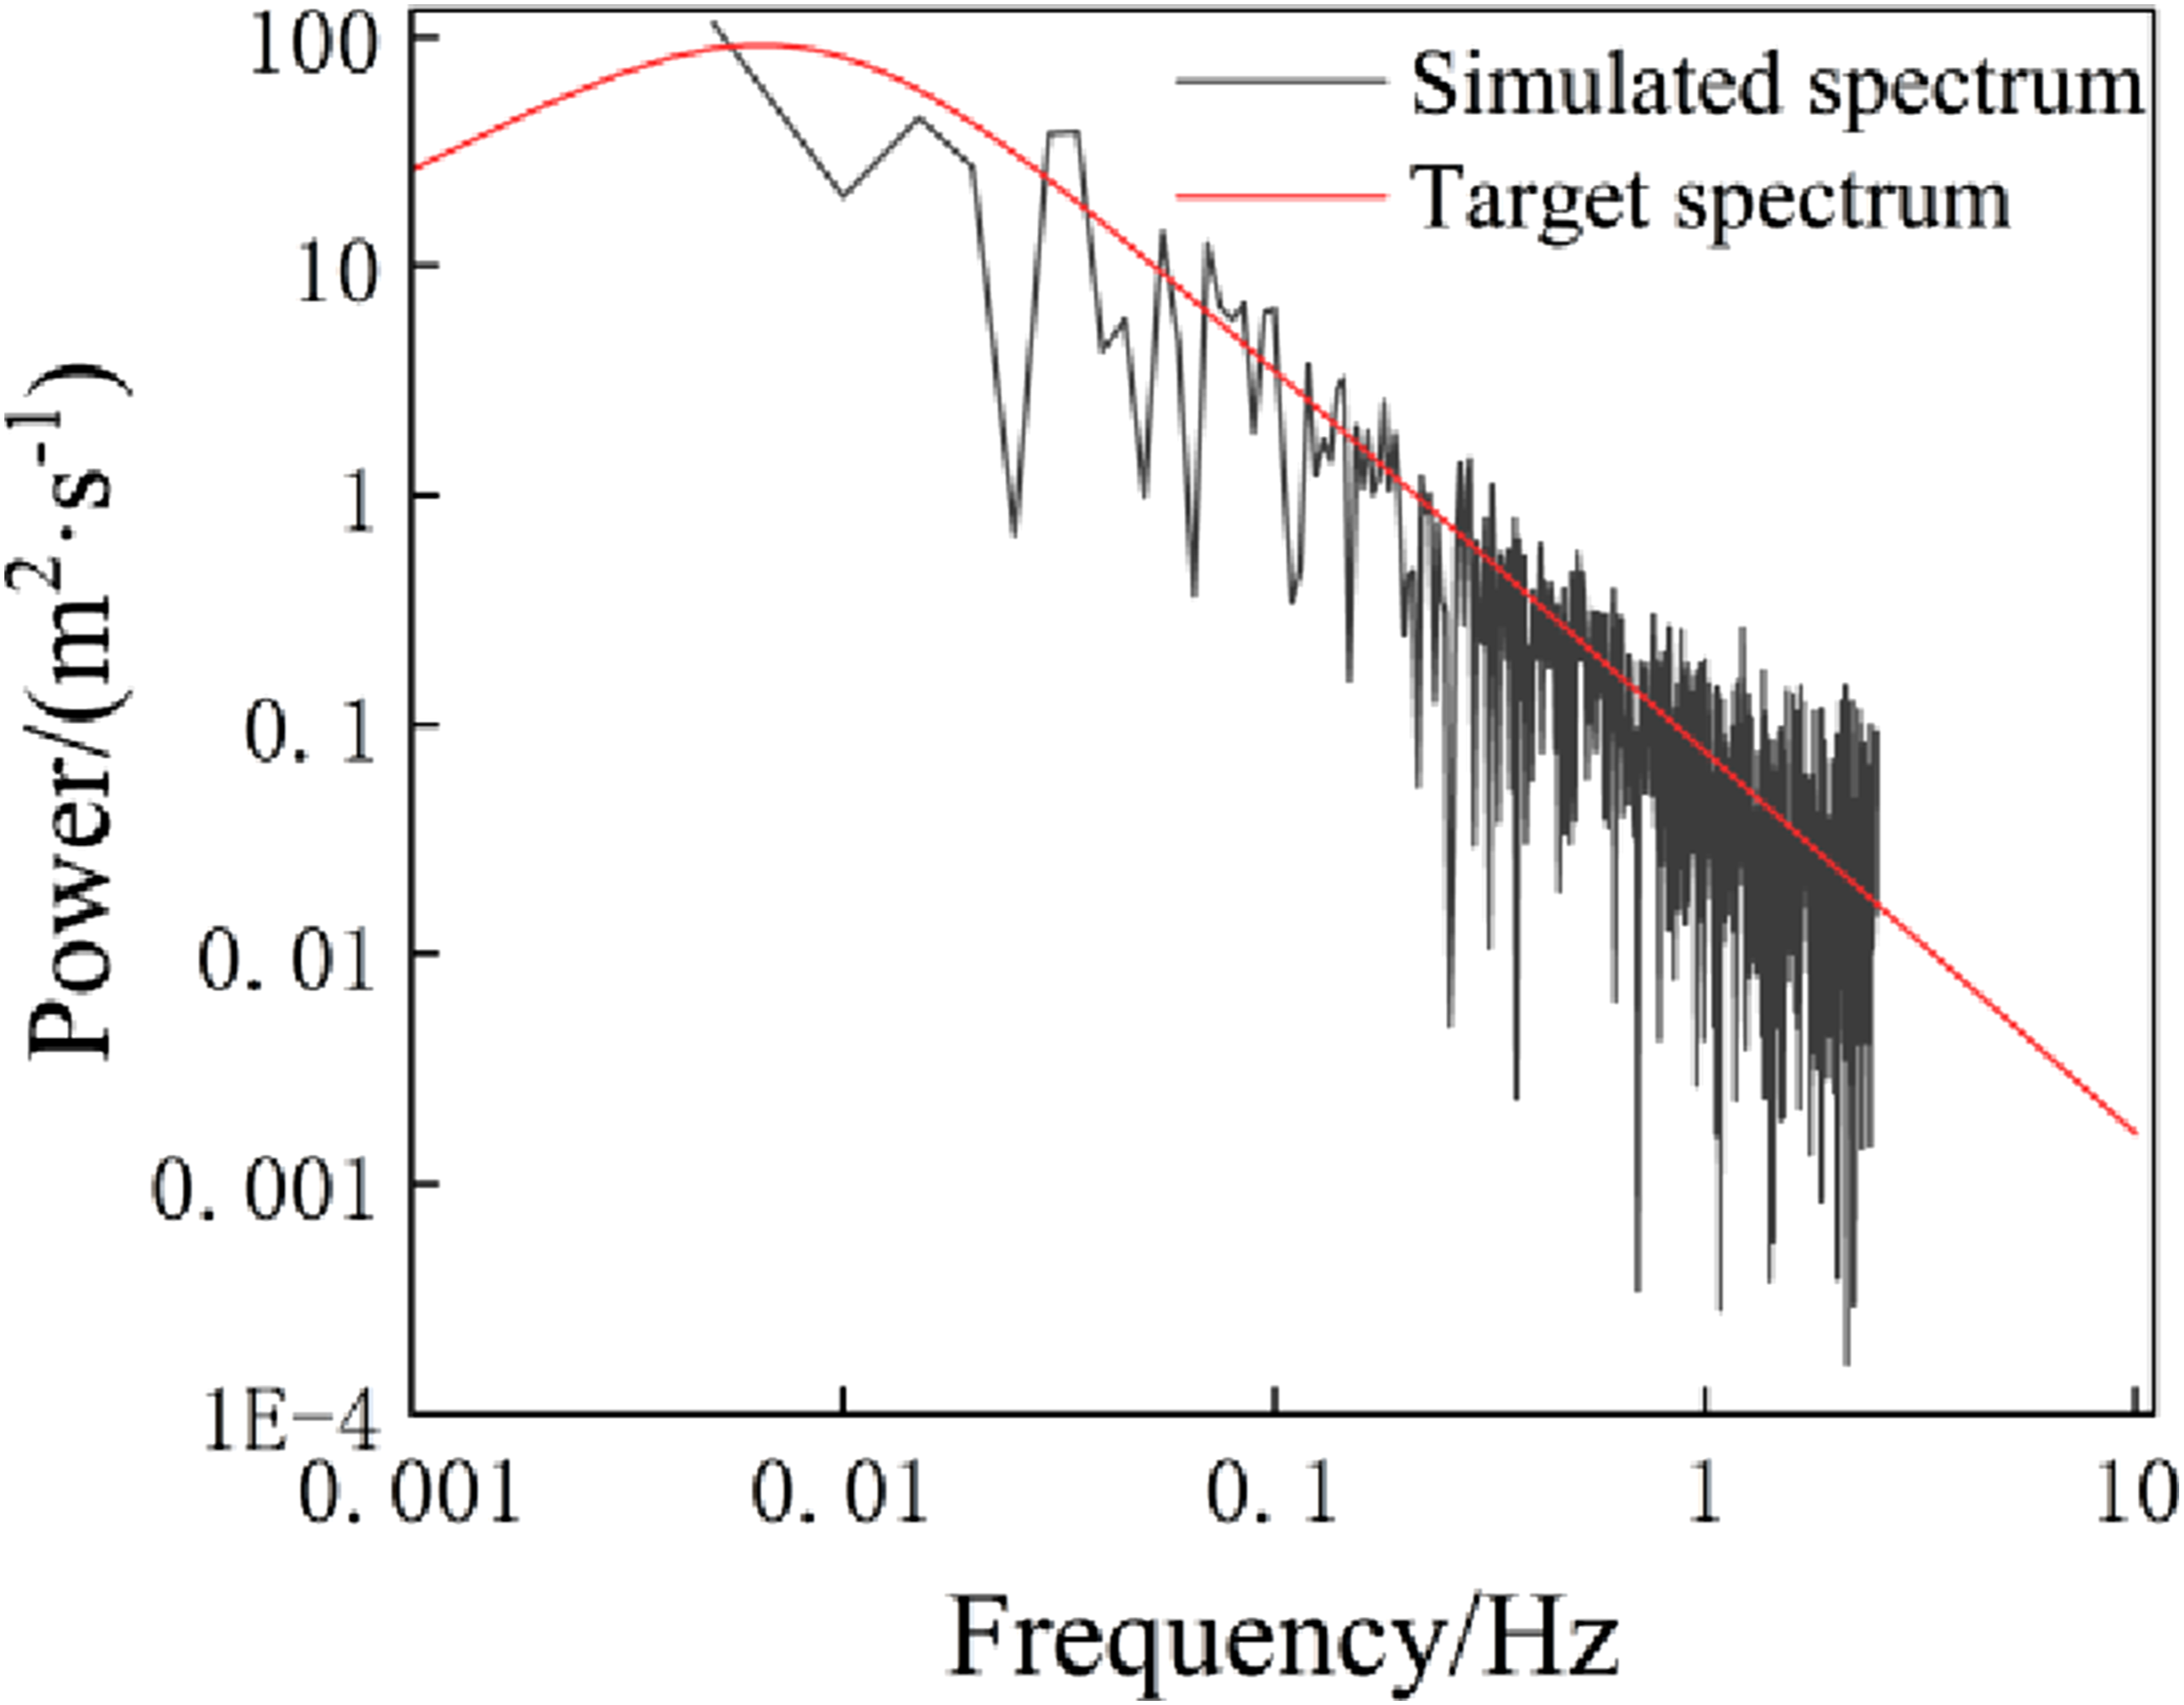
Results and discussion
Analysis of wind-induced vibration response of catenary under strong wind conditions
The catenary can be regarded as a special cable structure, and external excitations can induce vibrations in three directions: lateral, longitudinal, and vertical. The action of wind on a structure can be divided into three types: lateral wind, longitudinal wind, and torsional moment. Due to the catenary’s inherent characteristics of large span and strong nonlinearity, the effect of lateral wind is the most significant. To rapidly and accurately simulate the wind field around the catenary, we employ the spectral representation method to generate the wind field. The simulated wind field is then converted into wind loads for simulation analysis of the catenary finite element model, thereby obtaining the vibration characteristics of the contact wire and messenger wire under realistic wind conditions.
Simulation-based investigation of wind-induced vibrations in catenary structures under realistic wind conditions
The wind speed time series derived from earlier simulations is converted into equivalent line pressure and imposed on the catenary structure. To simplify the computational model, the line pressure is uniformly applied along the x-axis of the catenary model, which corresponds to the direction perpendicular to the contact wire, despite the fact that actual wind directions and attack angles would induce complex force components. Following the requirements stipulated in the “Code for Design of Railway Electric Traction Power Supply” (TB 10,009-2016), the wind-induced forces on the contact and messenger wires are computed using standardized formulas:
In Ansys, the simulation of the catenary is performed in two analysis steps. The first step applies gravity and the pretension of the catenary to bring the structure into its actual working state. The second step applies the external loads, primarily to solve for the structural response of the catenary under various loading conditions. 25
As illustrated in Figure 6, the time-dependent lateral and vertical displacements at the midpoint of the fourth span, together with their corresponding frequency spectra, were obtained through numerical simulation under realistic wind loading conditions applied to the catenary system. The lateral displacement of the contact wire demonstrates pronounced oscillations, peaking at 249.63 mm, whereas the vertical displacement remains relatively stable, exhibiting a peak amplitude of only −4.94 mm. Despite the application of purely lateral wind loads, the differential lateral motion between the contact wire and messenger wire generates unbalanced forces in the droppers, resulting in induced vertical vibrations of the contact wire. Excessive lateral deflection of the contact wire poses a risk of losing electrical contact with the pantograph or causing bow-scraping events, whereas vertical displacement fluctuations compromise the stability of the contact interface, thereby degrading current collection efficiency. Wind vibration response: (a) Transverse displacement; (b) Transverse displacement spectrum; (c) Vertical displacement; (d) Vertical displacement spectrum.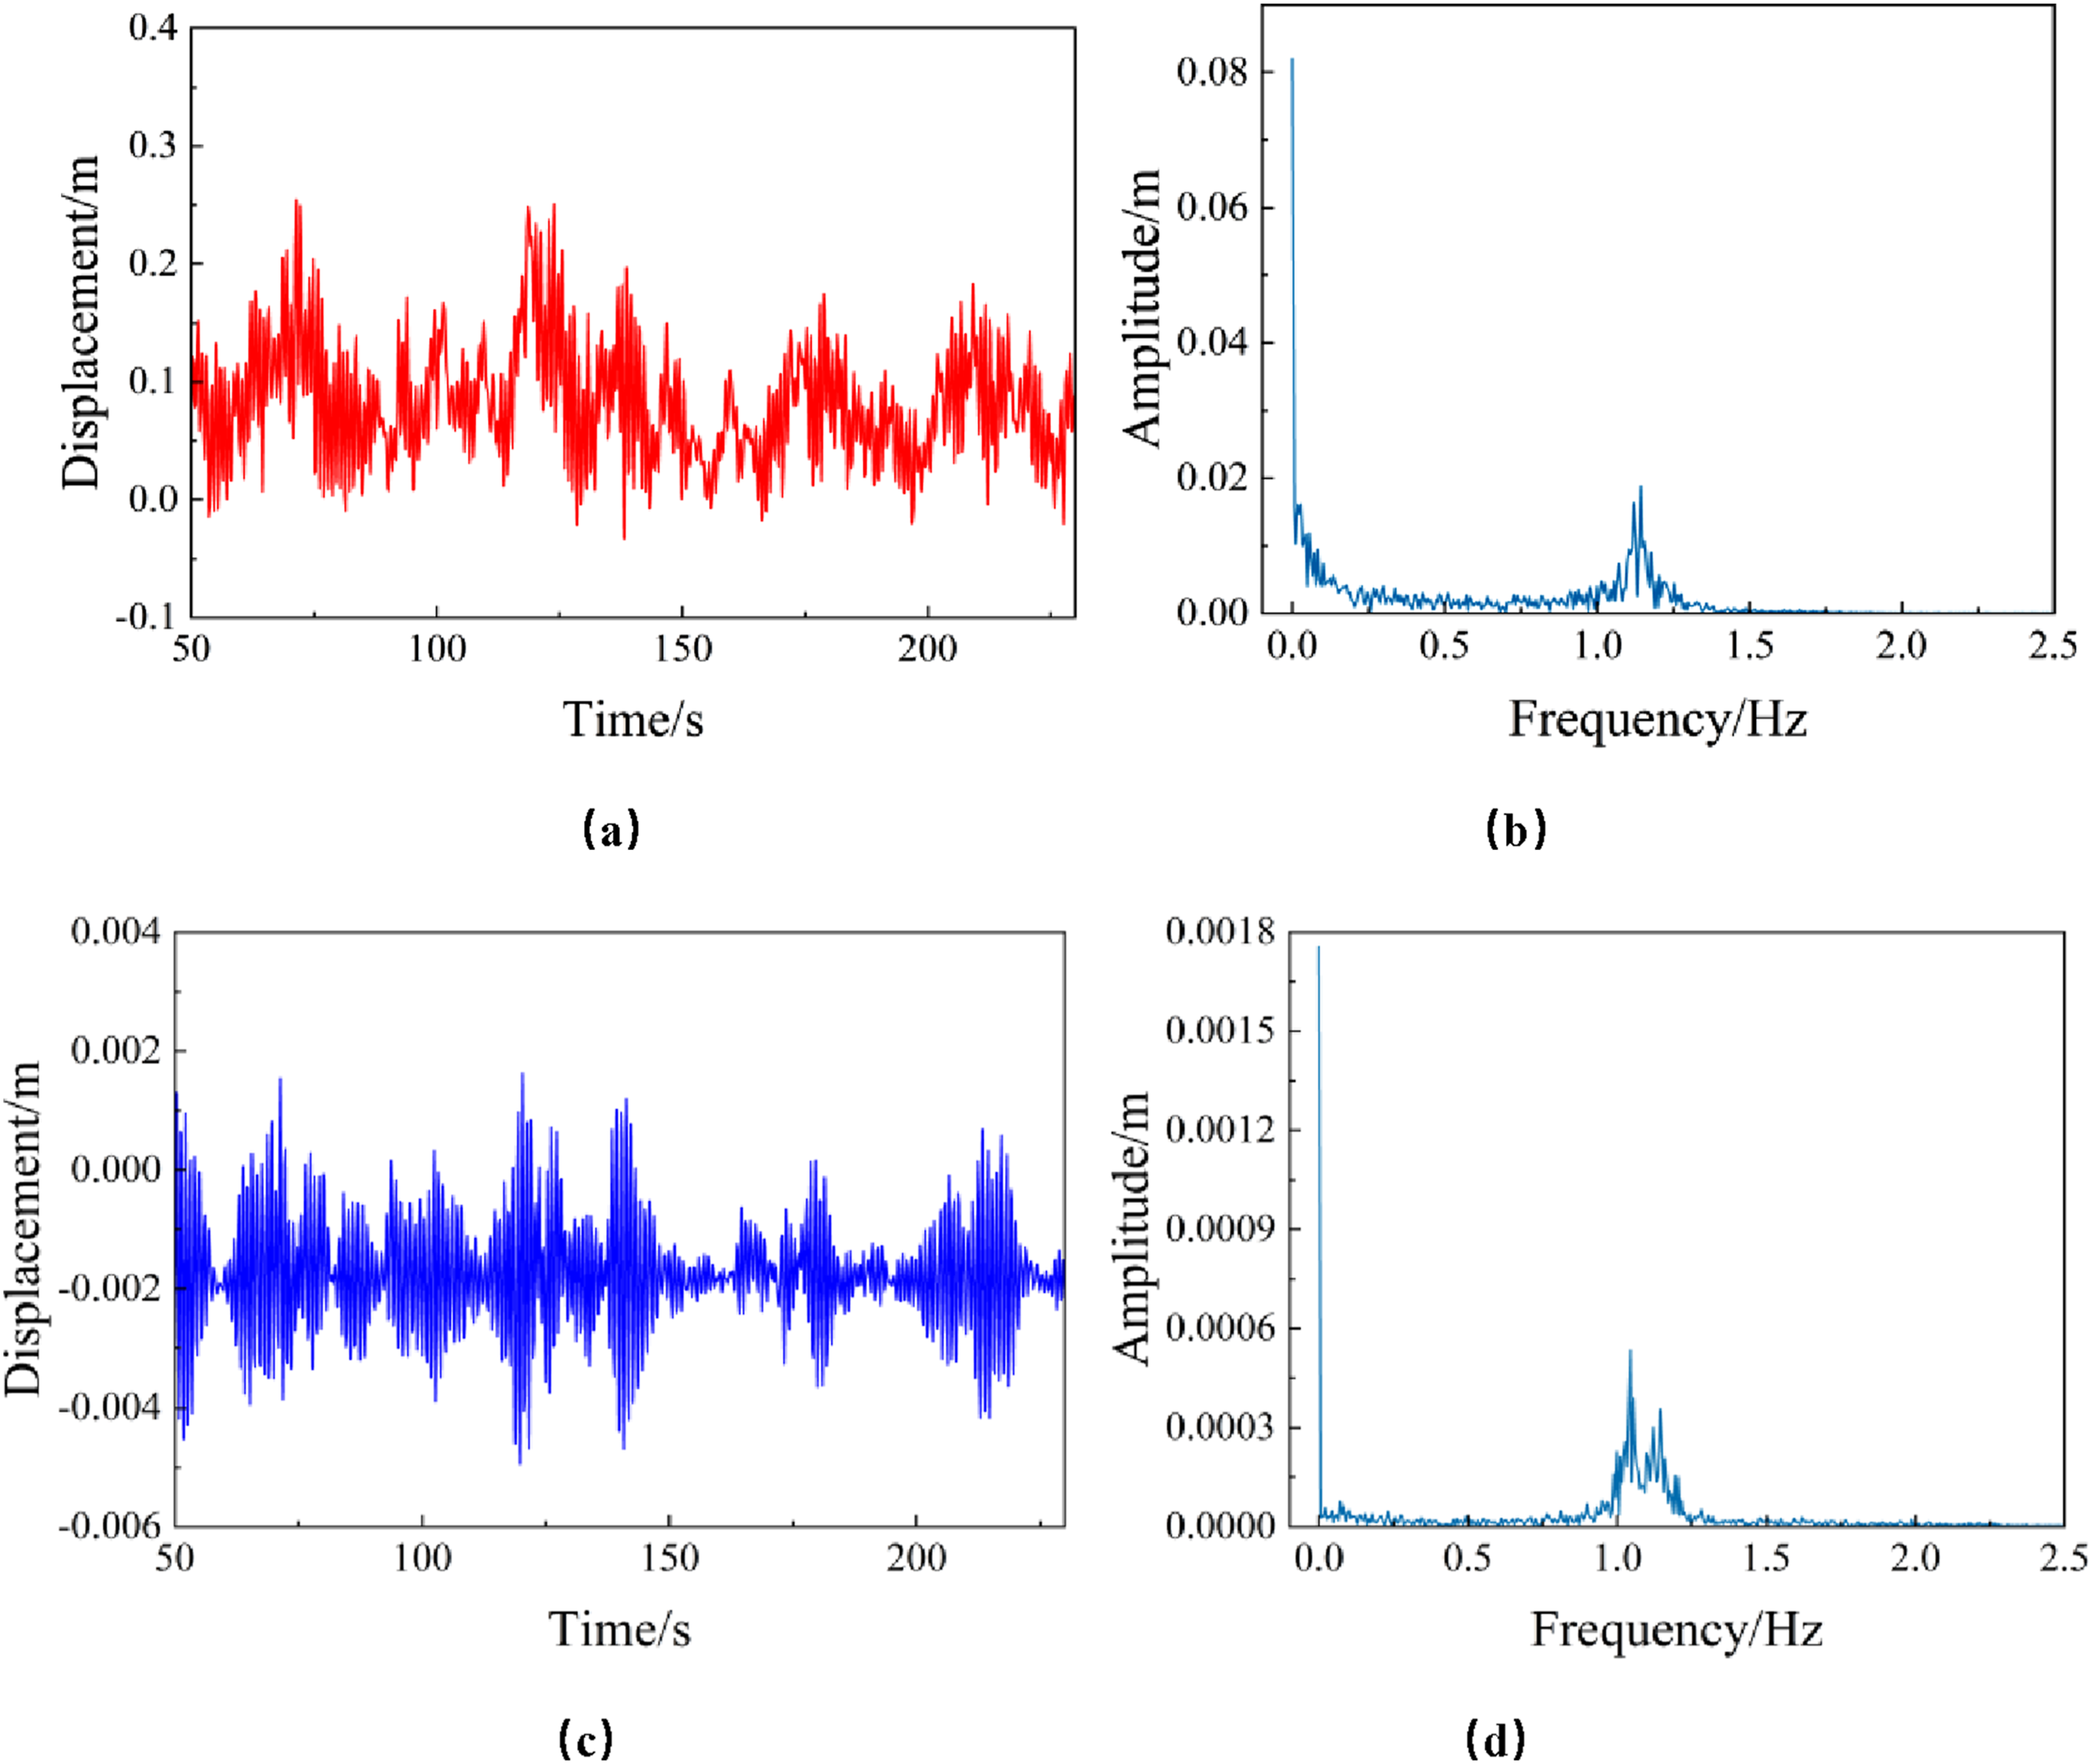
From the frequency domain waveforms, apart from a relatively large difference in amplitude at 0 Hz, the amplitudes in other frequency ranges are quite close. Both the lateral and vertical displacement spectra show significant amplitude peaks near 1 Hz. This is because the natural frequency of the contact suspension is around 1 Hz, and the fluctuating wind load at this frequency induces resonance in the suspension system.
To ensure the reliability of the simulation, the results obtained from the 7-span catenary model are quantitatively cross-validated with classic numerical models and field measurement data from existing literature. As shown in Figure 6, the dominant frequencies of the proposed model are 1.14 Hz (lateral) and 1.04 Hz (vertical). These values match the typical 0.8–1.5 Hz range perfectly, showing high consistency with the fundamental frequencies reported in classic nonlinear finite element models3,4 and field-measured results. 8
Furthermore, under the strong wind condition of 22.44 m/s, the maximum lateral displacement of the contact wire is 249.63 mm. This magnitude is highly consistent with the aerodynamic response ranges observed in wind tunnel tests using aeroelastic models5,6 under similar wind intensities. This quantitative agreement confirms that the mass distribution, structural stiffness, and aerodynamic load application of the established catenary model are accurate and reliable for the subsequent coupled wind-ice analysis.
Dynamic behavior of catenary under natural wind loads
Average wind load.
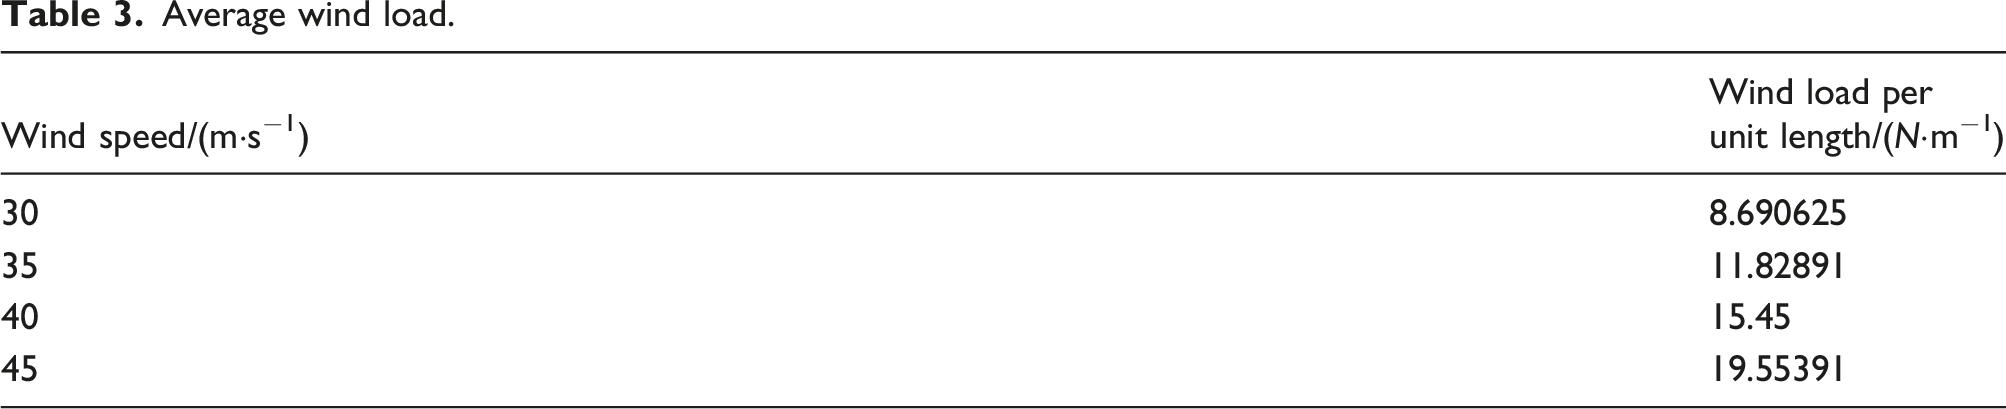
The lateral displacements of droppers and the mid-span node in the 4th span of the catenary under mean wind load are shown in Figure 7. In comparison with natural wind, it can be observed that mean wind is the primary factor causing the lateral offset of the catenary, while the maximum displacement is induced by the fluctuating component within natural wind. The vibration amplitude is larger at the mid-span and decreases toward the suspension points. The displacement is greater on the side of the suspension point facing downwind, indicating that the positioner provides certain restraint against lateral vibration of the catenary. Average lateral displacement of wind load.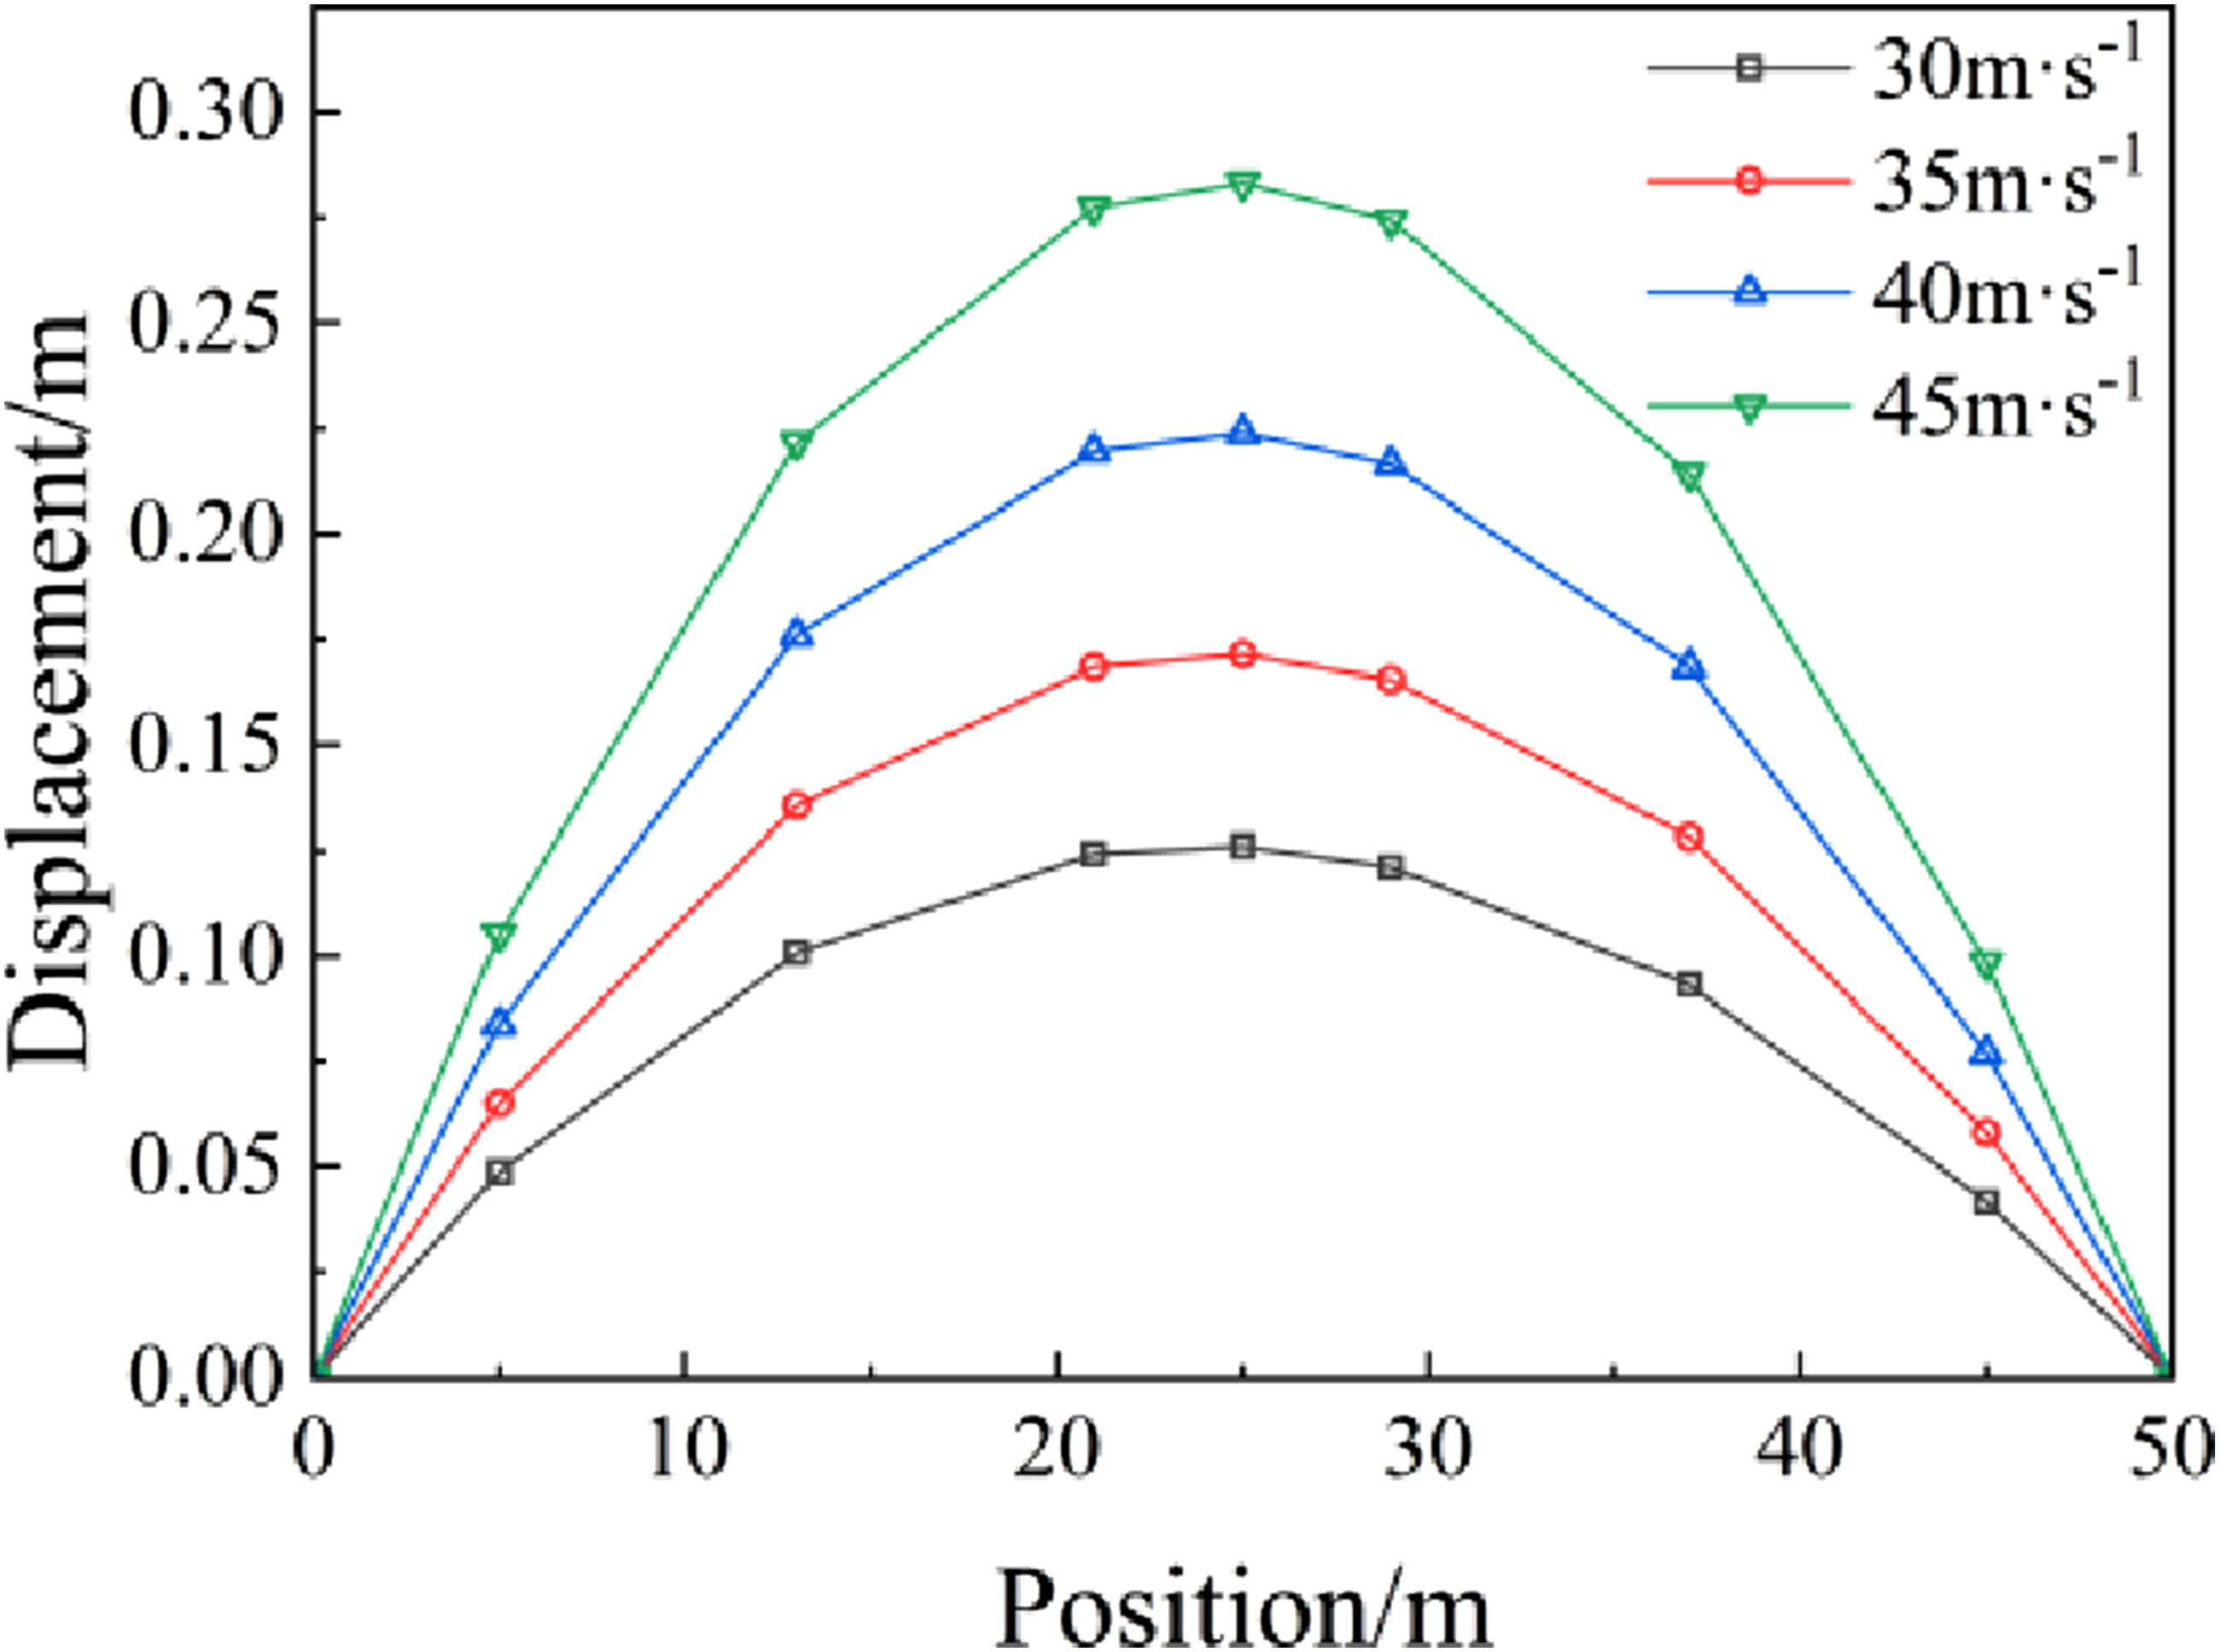
In accordance with the “Rules for Operation and Maintenance of Overhead Contact Systems in Conventional Speed Railways” (TG/GD116-2017), the lateral displacement of the contact wire due to wind loading—accounting for variations in stagger—must be limited to no more than 0.45 m. Under a peak wind velocity of 45 ms−1, the resulting oscillation amplitude of the contact wire does not surpass the specified threshold, thereby ensuring that the catenary system operates within acceptable safety margins.
Under wind loading, the positioner at the contact wire suspension point rotates around the Z-axis, thereby changing the stagger value. Figure 8 shows the variation in stagger values along the 7-span catenary due to rotation of the positioners. The reverse positioning on the leeward side exhibits an increasing stagger value with rising wind speed, while the forward positioning on the windward side shows a decreasing stagger value as wind speed increases. However, all changes remain within the allowable limits. The contact line pulls out the amount of change in value.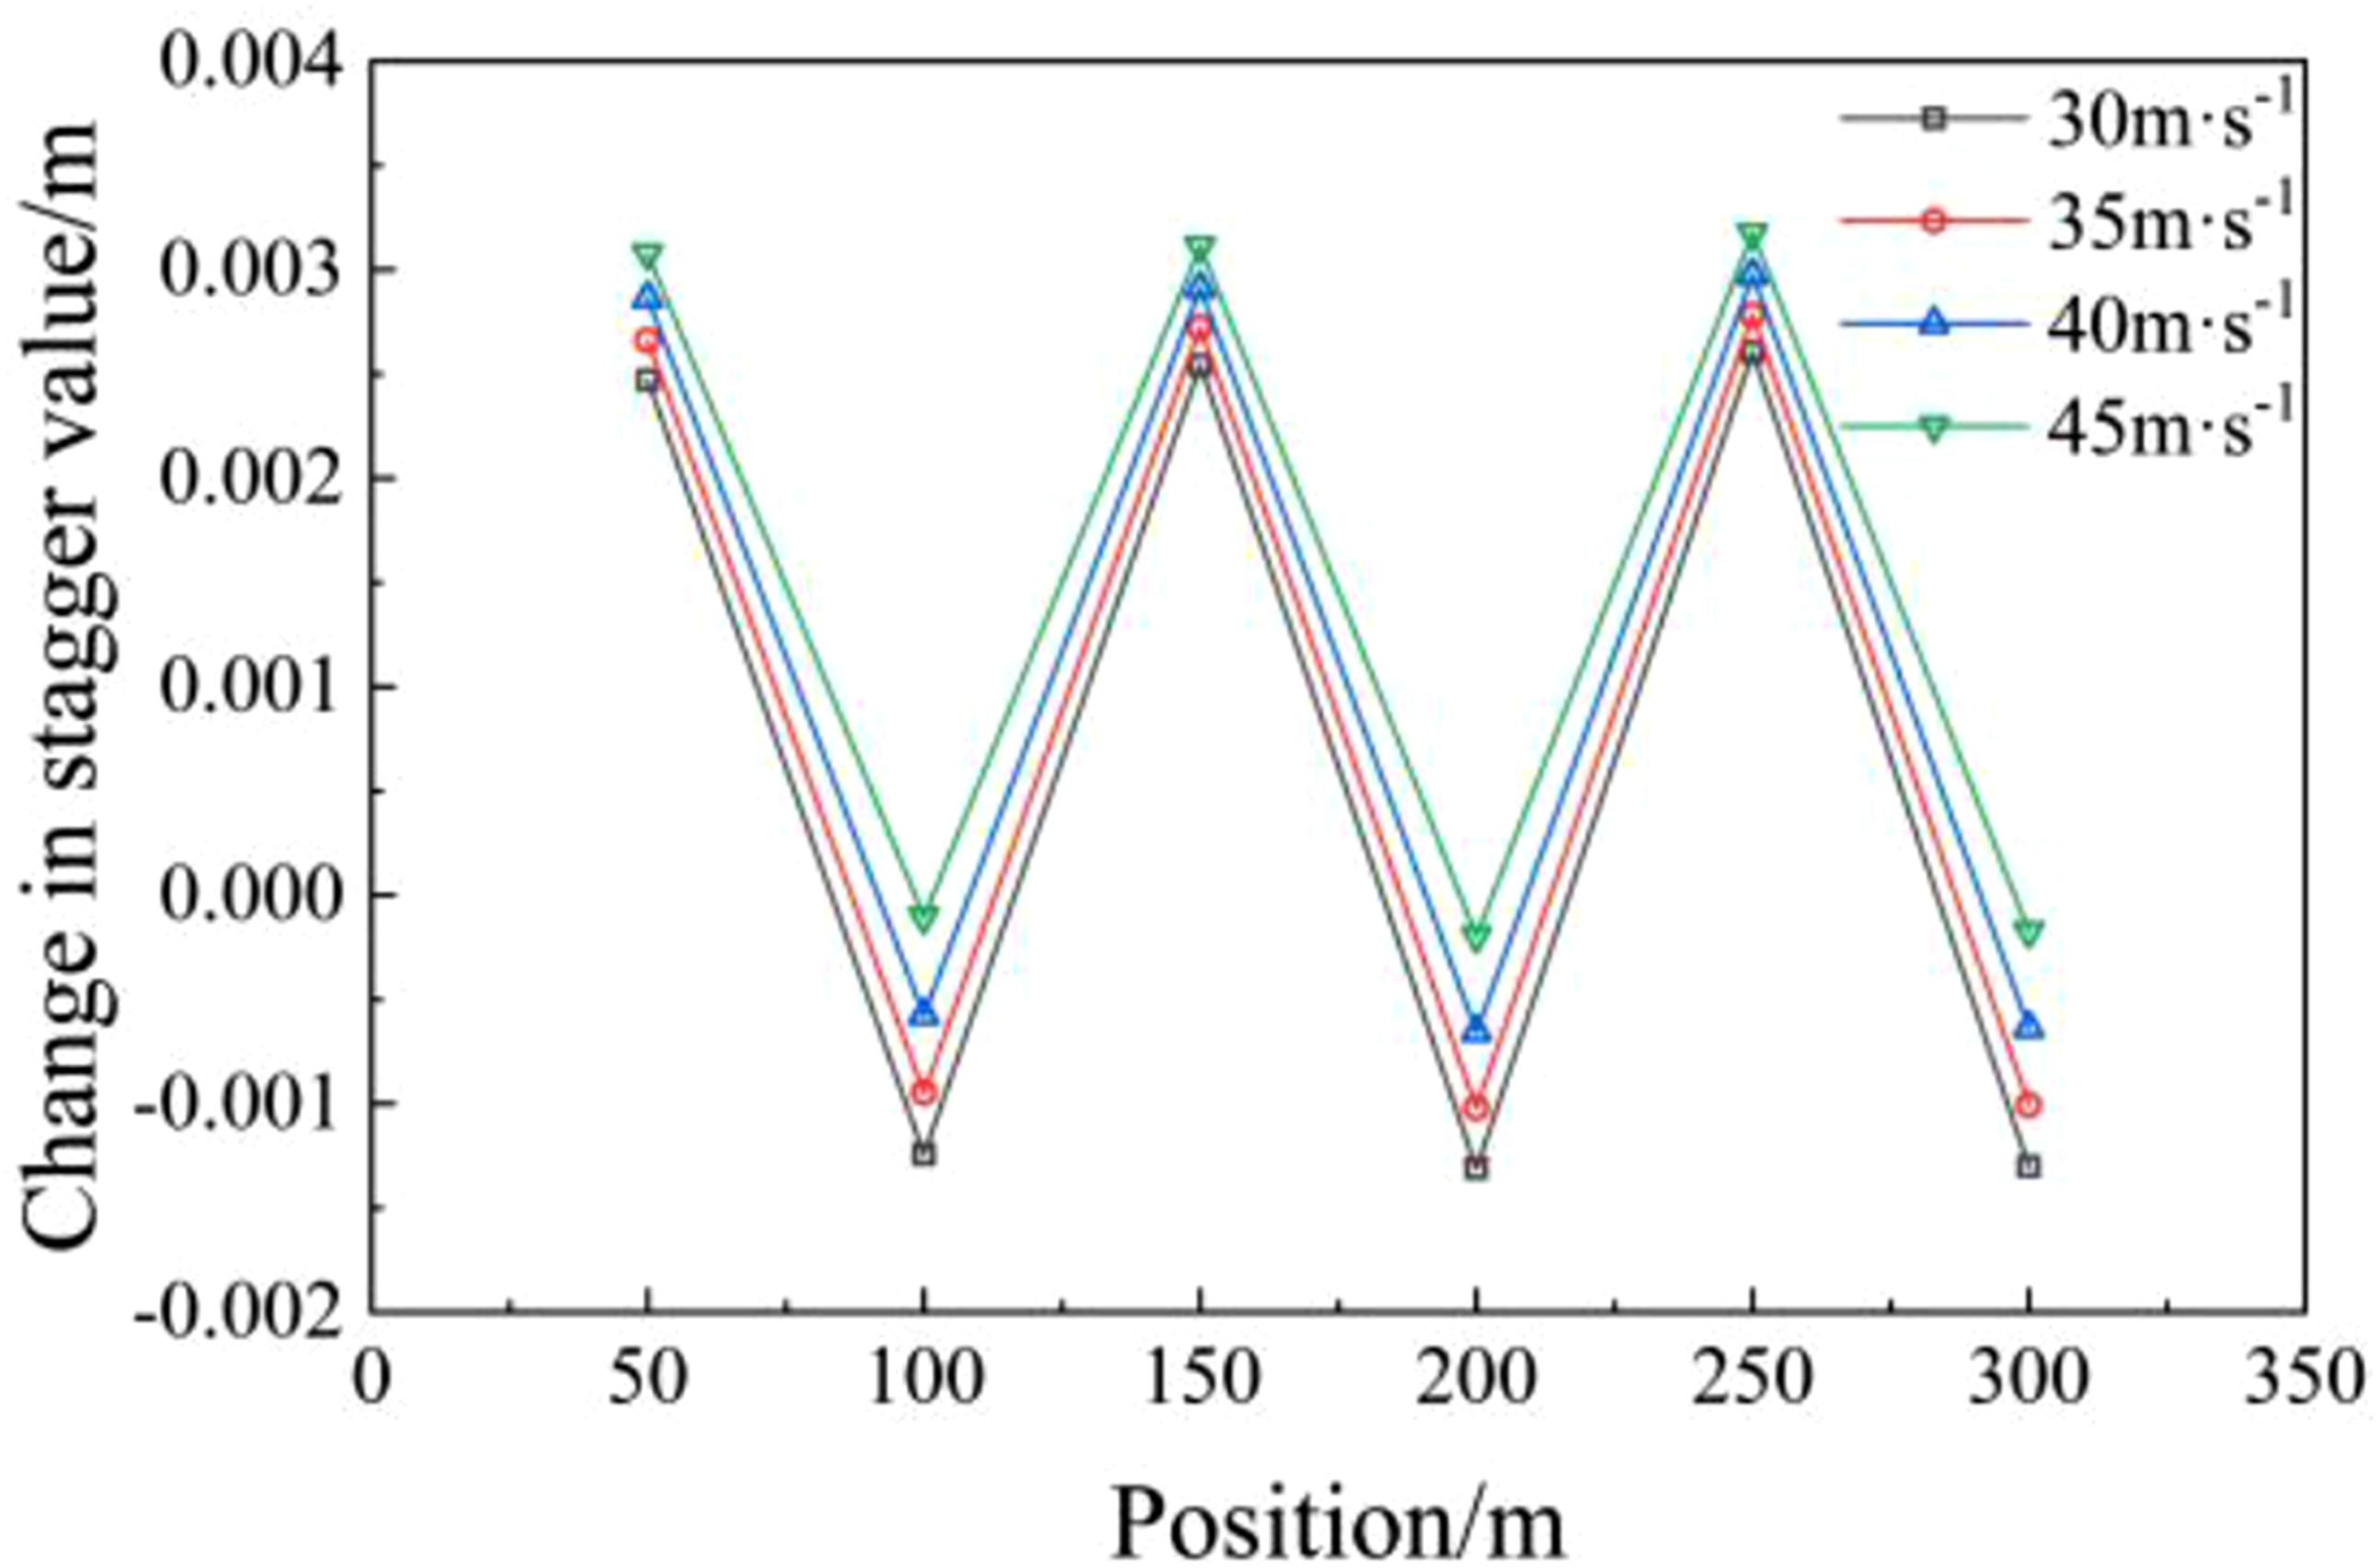
Analysis of catenary response under ice loading
To achieve condition assessment of iced catenary systems, it is necessary to analyze the response of the catenary under icing conditions. This paper first analyzes the formation conditions and physical model of catenary icing, and then uses Ansys to perform simulation analysis on the catenary with different ice thicknesses, thereby obtaining the variation patterns of vertical deflection of the contact wire and displacement changes at the anchoring points after icing.
Calculation model for catenary ice thickness
Atmospheric moisture contributing to ice formation on the catenary originates from a variety of sources, including supercooled fog particles, freezing precipitation, light rain, wet snowfall, and gaseous water vapor. Under meteorological conditions where the air temperature drops below 0°C, wind velocities fall within the range of 3–15 m/s, and relative humidity approaches 85%,
26
these suspended liquid droplets impinge upon the overhead conductors,
27
initiating the process of ice buildup, as illustrated in Figure 9. Supercooled water droplets suspended in the atmosphere impact the overhead conductors during ice formation.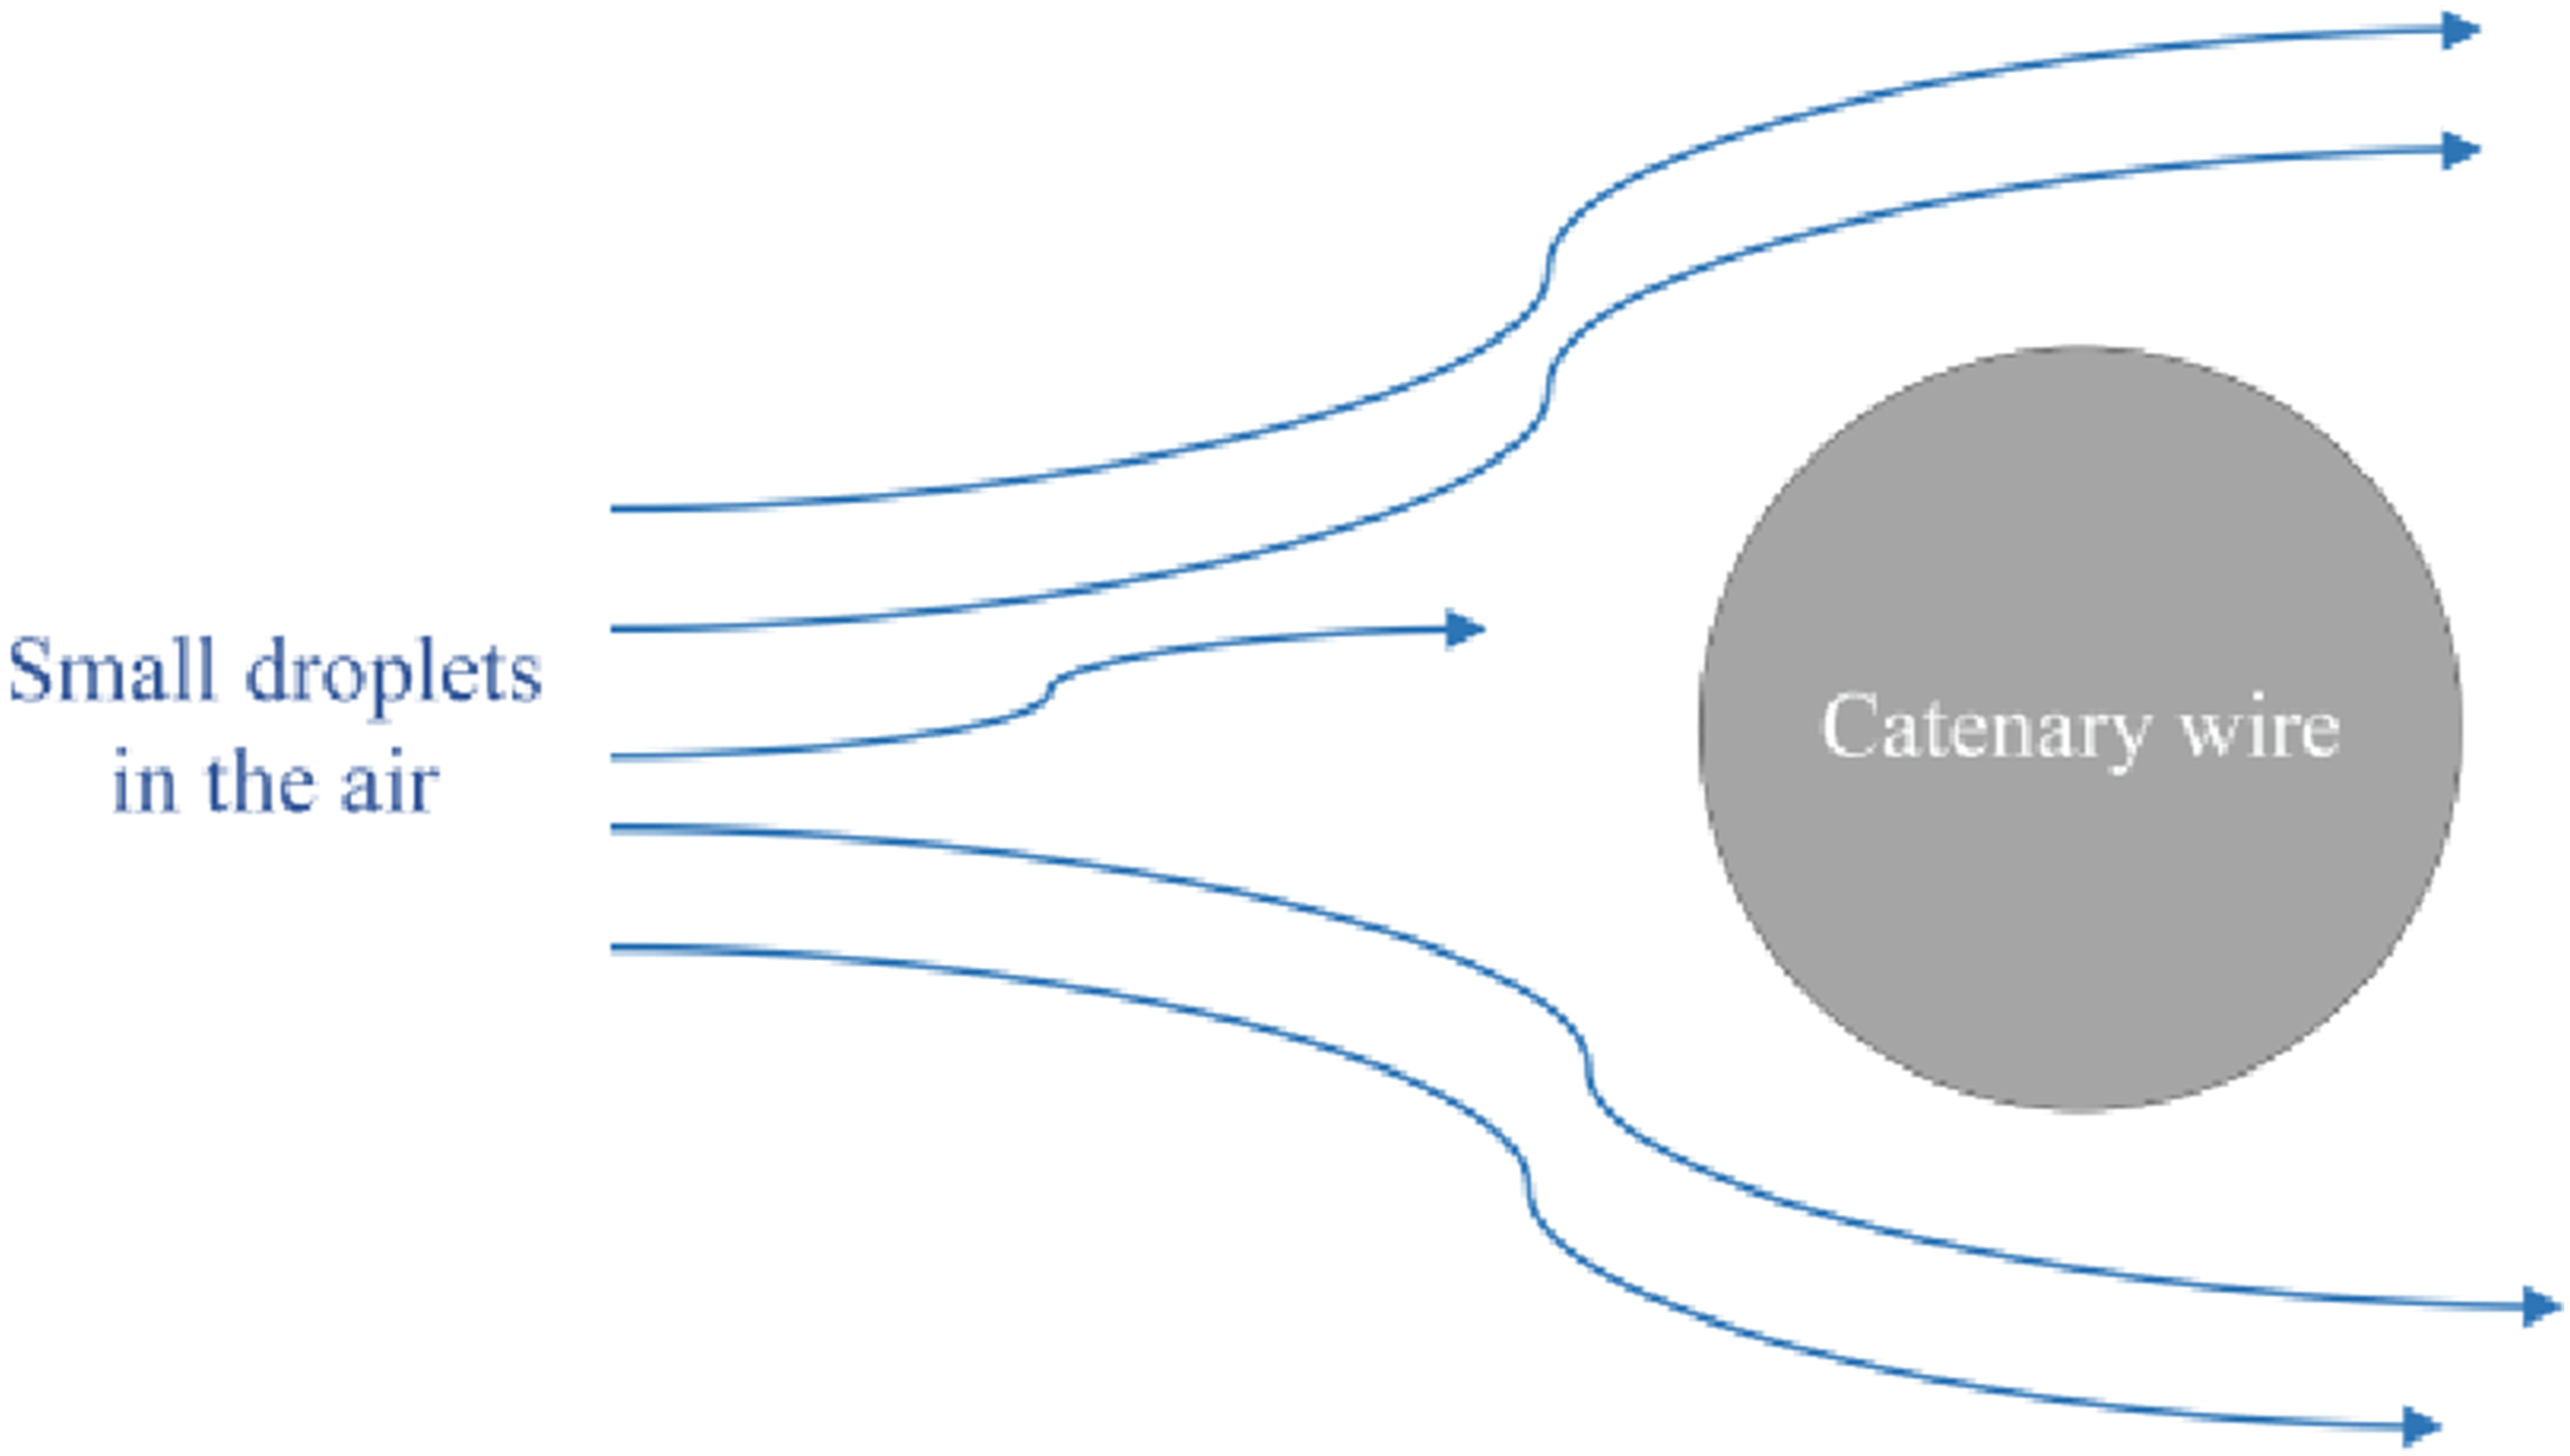
In consideration of the typical ice growth pattern observed in field measurements, the ice accretion morphology on the catenary is idealized as a crescent-shaped profile for computational convenience.
28
Figure 10 presents a schematic illustration of the post-icing cross-sectional profile of the catenary system, where the conductor is assumed to have a circular cross-section for simplicity. Mechanical abrasion occurs at the interface between the pantograph and the contact wire during train passage, leading to partial removal of accumulated ice. Consequently, for practical engineering applications, the ice thickness on the contact wire is conservatively estimated at half that of the messenger wire. Catenary ice covering model.
The force exerted by crescent-shaped ice accretion on the catenary wire can be decomposed into a component in the direction of gravity and a torque in the radial direction of the wire. The force per unit length acting on the iced wire is given by:

Numerical simulation results and interpretation
A numerical study was conducted to evaluate the static deformation behavior of the catenary system subjected to varying ice accumulation levels of 5, 10, 15, 20, and 25 mm. Figure 11 illustrates the variation in vertical deflection for both the contact wire and messenger wire at the central node of the fourth span across different ice loading conditions. A direct correlation is evident between increasing ice thickness and rising vertical displacements in both conductors. At the peak ice thickness of 25 mm, the vertical deflections surpass 0.1 m, posing a critical threat to the reliability of the electrified railway’s power delivery mechanism. Vertical displacement change of catenary.
Due to the difference in ice weight, under the same ice thickness, the displacement change at the messenger wire anchorage is more pronounced than that of the contact wire. Therefore, to measure ice thickness more accurately, the displacement at the messenger wire anchorage can be selected as the measurement target (Figure 12). Displacement at the lower anchor of the catenary.
Wind-induced vibration response analysis of iced catenary
In real-world operational environments, overhead catenaries are frequently subjected to concurrent wind-induced vibrations and ice accumulation. Despite extensive studies, current investigations predominantly focus on isolated environmental loads, with insufficient attention paid to the coupled dynamics of wind and ice loading. This gap hinders accurate prediction of system performance under severe weather scenarios. Consequently, elucidating the interaction mechanisms between aerodynamic excitation and ice loading is crucial for advancing both theoretical understanding and practical application in railway infrastructure resilience.
A numerical simulation framework incorporating wind-ice coupling effects is developed in this study, enabling the identification of how vibration modes evolve under different ice morphologies and wind profiles. The underlying mechanisms governing the impact of coupled wind-ice loading on catenary stability are explored, offering valuable insights for real-time health monitoring and risk mitigation strategies.29–32
Dynamic response of iced catenary to natural wind excitation
Based on prior findings, the wind velocity experienced by an iced catenary typically falls within the range of 3 to 15 m/s, falling below the standard design wind speed used in vibration analysis. In line with the wind field modeling approach described in Section 2, a representative wind speed of 10 m/s is adopted to replicate realistic wind conditions during icing events, as illustrated in Figure 13. Wind speed time history curve under icing conditions:(a) 6.45 m Wind speed; (b) 8.05 m Wind speed.
The first 50 seconds of the wind speed time history were imported into the finite element model of the catenary system and applied as distributed line loads. Numerical analysis was conducted to compute the lateral and vertical displacements of the contact wire, allowing the determination of the actual deflection at its midpoint relative to the initial position. Figure 14 displays the time-dependent vibration responses of the contact wire at the mid-span node under varying ice accumulation scenarios. Natural wind vibration response under different icing conditions: (a) Covered with ice 5 mm; (b) Covered with ice 10 mm; (c) Covered with ice 15 mm; (d) Covered with ice 20 mm.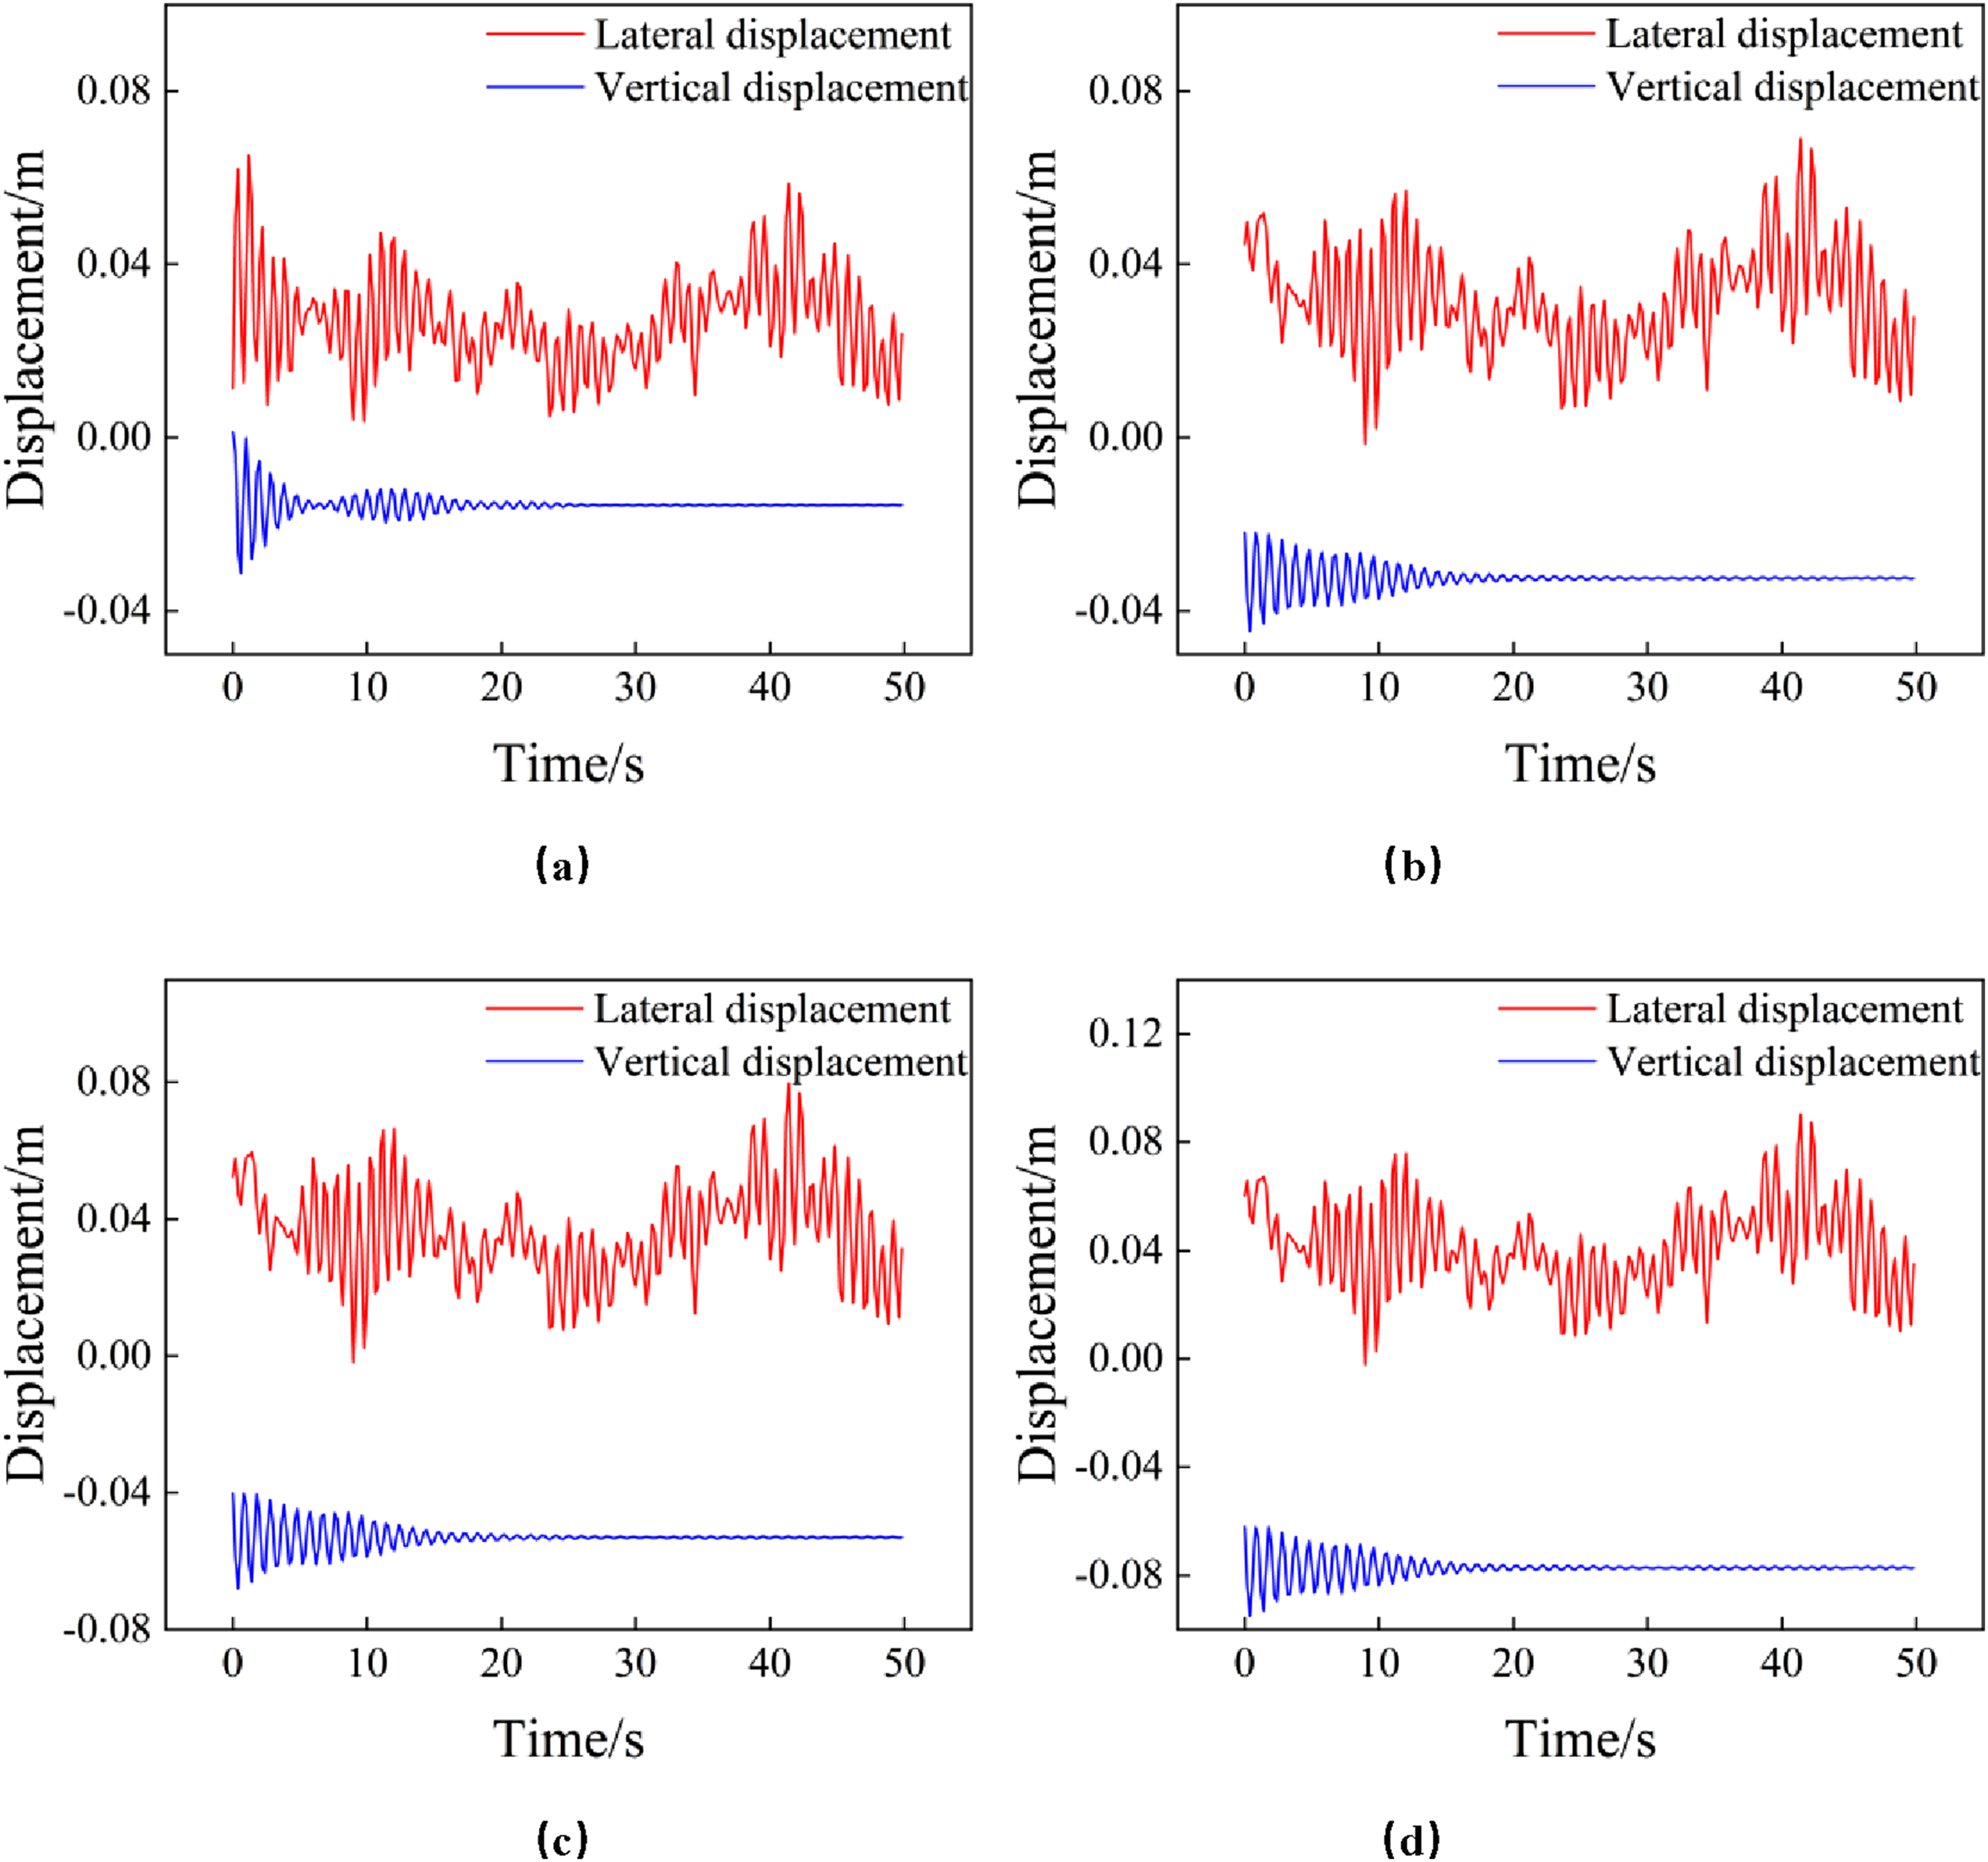
Comparing the simulation results of Figure 6 (pure wind condition without ice) and Figure 14 (coupled wind-ice condition), a cohesive comparative analysis reveals the following critical shifts in system dynamics: (1) Fundamental Shift in Dominant Failure Modes: Under the pure strong wind condition, the displacement response is highly skewed; the lateral displacement (with a maximum of 249.63 mm) overwhelmingly dominates the vertical displacement (−4.94 mm). This clearly indicates that in the absence of ice, aerodynamic wind deflection is the absolute primary risk. In stark contrast, the introduction of ice accumulation fundamentally alters this response pattern. The extreme disparity between lateral and vertical displacements disappears under the coupled condition. This comparative shift confirms that icing changes the force equilibrium: the added structural mass suppresses extreme lateral whipping while drastically amplifying vertical gravity effects. Consequently, the primary failure mode transitions from purely lateral wind deflection to a complex, multi-axial spatial deformation. (2) Lateral Displacement Does Not Change Significantly with Ice Thickness: At moderate to low wind speeds (e.g., 10 m/s), the amplitude of the lateral displacement at the mid-span node of the contact wire exhibits no significant variation as ice thickness increases. This phenomenon is primarily governed by structural dynamics rather than aerodynamic shape changes. The accumulation of ice significantly increases the linear mass and, consequently, the inertial resistance of the catenary system. Under such low wind speed excitation, the input aerodynamic kinetic energy is insufficient to overcome this massive inertial resistance, thereby restricting large-scale lateral oscillations. Furthermore, it should be noted that compared to high wind conditions (e.g., 22.44 m/s), the overall lateral response in this iced scenario is inherently much smaller due to the reduced aerodynamic loads. (3) Extreme Amplification of Vertical Displacement: Unlike the negligible vertical displacement (−4.94 mm) observed under pure wind excitation, the coupled wind-ice condition induces a severe vertical sag that scales with ice thickness. This occurs because the massive increase in self-weight overrides the upward aerodynamic lift forces. Furthermore, the excitation from fluctuating wind loads acts as an additional perturbation, superimposing high-frequency vertical vibrations onto the static ice sag, significantly exacerbating the risk of clearance violations.
Dynamic response of iced catenary under constant wind loading
To evaluate the effects of steady wind on the mechanical behavior of an iced catenary system, numerical simulations were performed under four wind speed conditions (3, 5, 10, and 15 m/s), each paired with distinct ice accumulation levels (5, 10, 15, and 20 mm). The resulting dynamic displacements at the mid-span node are displayed in Figure 15, revealing the coupled influence of wind intensity and ice thickness on system vibration. Average wind vibration response under different icing conditions: (a) Covered with ice 5 mm; (b) Covered with ice 10 mm; (c) Covered with ice 15 mm; (d) Covered with ice 20 mm.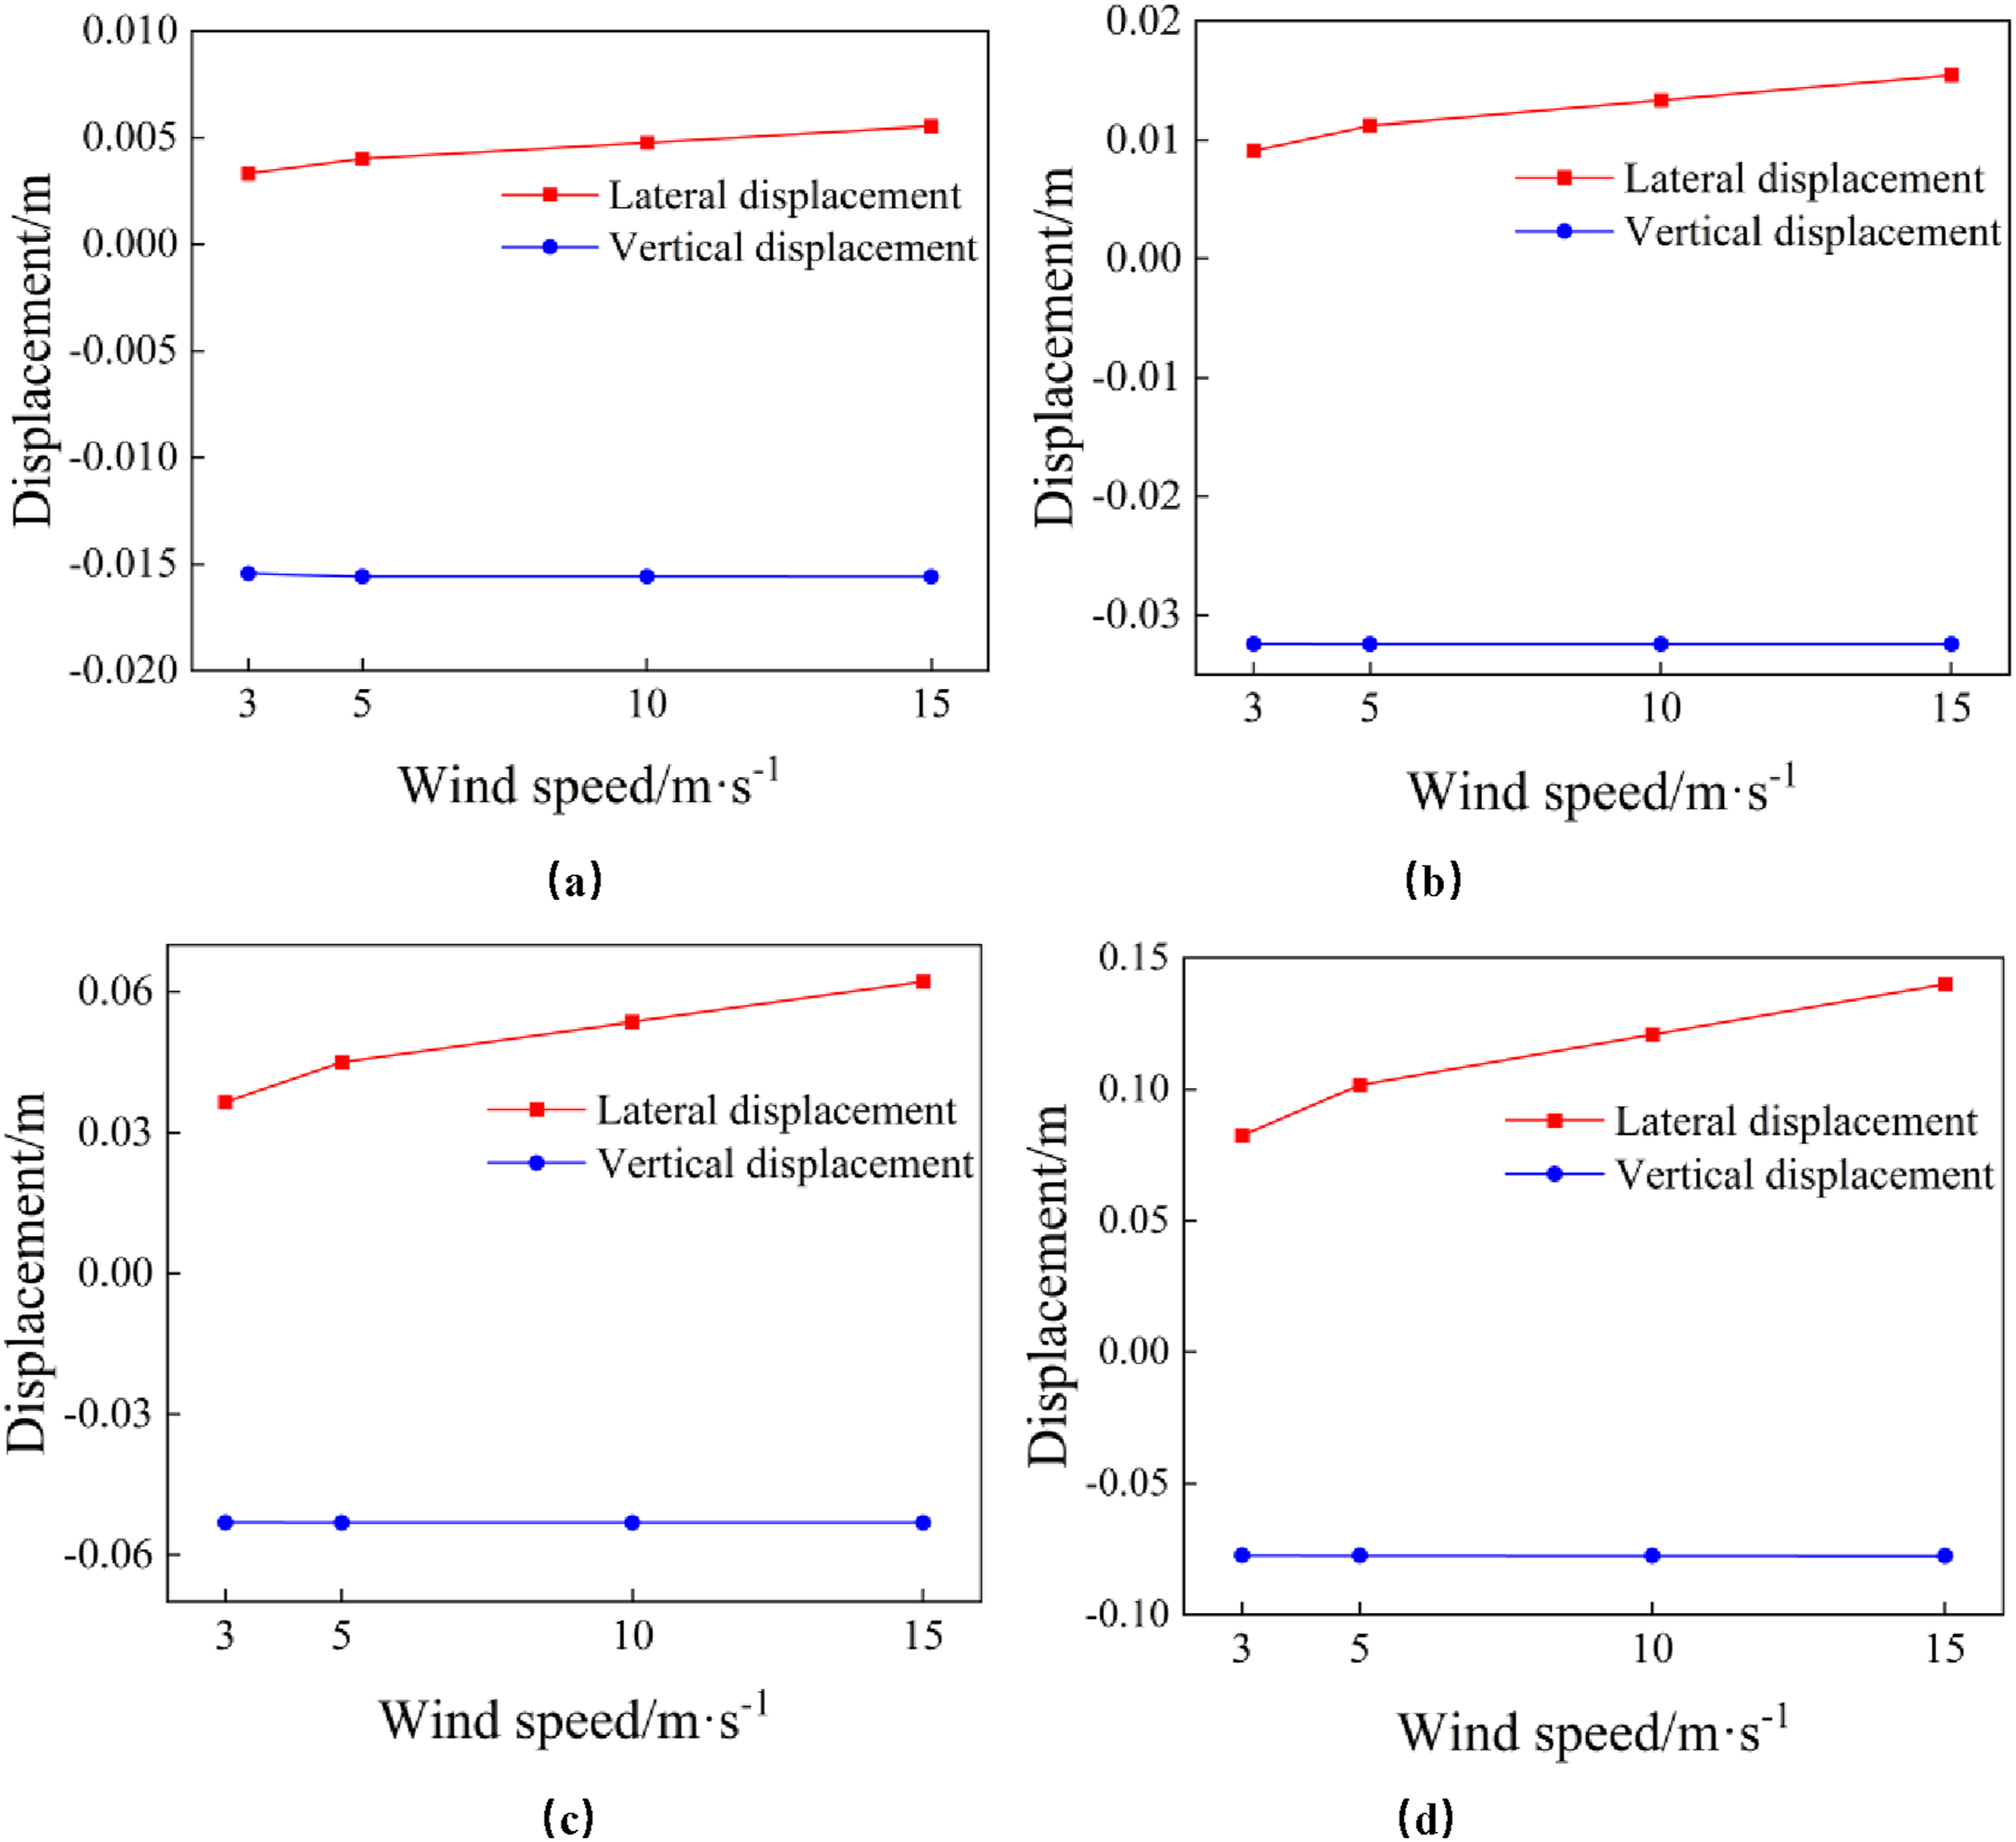
From the comparative analysis of Figure 15, the following mechanisms are identified: (1) Amplification Effect on Static Lateral Offset: The mean wind component exerts a quasi-static lateral force, causing a steady displacement. Compared to the pure wind scenario where the cross-sectional area is constant, the coupled condition introduces an amplification effect: the ice accretion not only adds mass but also expands the wind-exposed surface area (equivalent diameter). Consequently, even at identical wind velocities, the coupled system experiences higher lateral aerodynamic loading, leading to a more pronounced static offset. (2) Ice-Dictated Vertical Clearance Reduction: Under sustained wind loading, the vertical deformation is almost entirely controlled by the added mass of the ice rather than aerodynamic forces. As ice thickness increases, the sag grows monotonically and rapidly. Simulation results reveal that at 20 mm ice depth, the combined sag exceeds 70 mm. Therefore, the coupled wind-ice condition presents a simultaneous dual threat: the steady wind dictates the horizontal offset, while the ice dictates the vertical clearance limit. This combined spatial displacement severely compresses the safe operational envelope of the pantograph, increasing the probability of contact loss, arcing, or mechanical collisions.
Conclusions
Using the ANSYS platform, a finite element model of a 7-span simple chain-type catenary was developed to simulate its dynamic and static responses under coupled strong wind and icing conditions. The key findings are outlined below: (1) Dominant Lateral Vibrations under Wind Excitation: Under strong wind loading, the catenary’s motion is predominantly governed by lateral oscillations, where horizontal displacements significantly exceed vertical ones. The vibration frequency closely aligns with the natural frequency of the contact suspension (approximately 1 Hz), promoting resonance under fluctuating wind forces. This resonance leads to substantial lateral deflections of the contact wire, which may disrupt stable current collection and compromise the safety and reliability of electrified rail operations. (2) Progressive Vertical Sag under Ice Accumulation: In icing conditions, the catenary exhibits a marked increase in vertical displacement that grows continuously with ice thickness. At an ice thickness of 25 mm, the vertical deflection exceeds 100 mm, drastically reducing the dynamic clearance of the pantograph-catenary system. This compression increases the risk of electrical arcing and contact instability, representing the most significant operational challenge for catenary systems in cold climates. (3) Under Coupled Wind-Ice Conditions: There is no significant change in the amplitude of lateral displacement with increasing ice thickness. This indicates that the increased linear mass and massive inertial resistance of the iced conductors effectively restrict large-scale lateral wind-induced oscillations under the moderate-to-low wind speeds typical of icing events. Mean wind remains the dominant factor affecting the static lateral offset of the catenary, while the self-weight of the ice significantly increases vertical displacement, highlighting the risk associated with vertical responses. Therefore, under coupled wind-ice conditions within typical icing wind speed ranges, the primary risk type is excessive vertical sag. It is necessary to optimize the design and maintenance strategies of the catenary system specifically, focusing on monitoring sag changes and implementing proactive anti-icing measures.
Despite the findings presented in this study, several limitations should be acknowledged. First, the aerodynamic loads were applied as equivalent structural line pressures, meaning the complex Fluid-Structure Interaction (FSI) around the asymmetric iced conductors was not explicitly simulated. Consequently, the dynamic variations of aerodynamic coefficients (Cd, Cl, Cm) due to ice shape evolution were simplified. Second, due to the extreme and unpredictable nature of wind-ice environments, direct full-scale field measurements were not available for validation.
To address these limitations, future research will focus on developing a comprehensive FSI framework integrating Computational Fluid Dynamics (CFD) to investigate the precise aerodynamic instability (such as galloping) of iced catenaries under varying angles of attack. Furthermore, wind tunnel tests utilizing aeroelastic models with simulated ice accretion will be planned to further validate the numerical predictions and refine the understanding of wind-ice coupling mechanisms.
Footnotes
Acknowledgments
This work is supported by the National Natural Science Foundation of China (Grant No. 52375250), Qinglan Project of Jiangsu Universities.
Declaration of conflicting interests
The authors declared no potential conflicts of interest with respect to the research, authorship, and/or publication of this article.
Funding
The authors disclosed receipt of the following financial support for the research, authorship, and/or publication of this article: This work was supported by the National Natural Science Foundation of China (Grant No 52375250), the Qinglan Project of Jiangsu Universities, and the Postgraduate Research & Practice Innovation Program of Jiangsu Normal University (Grant No 2024XKT0664).
Data Availability Statement
The datasets generated and supporting the findings of this article are obtainable from the corresponding author upon reasonable request.