



Abstract
Based on spatial econometrics, this paper examines the impact of urbanization, coal consumption proportion, and traffic pressure on haze pollution and attempts to verify the environmental Kuznets curve hypothesis by using 30 provinces’ panel data in China from 2003 to 2015. The global Moran’s I index indicates the positive spatial correlation of haze pollution, and the local Moran’s I index indicates the clustering phenomenon of haze pollution in local regions. This model shows that haze pollution has spatial spillover effects in China. The relationship between urbanization and haze pollution is an inverse U-type curve, and the increase in coal consumption proportion and traffic pressure may enhance the degree of haze pollution. To govern China’s haze pollution, China should promote regional collaborative governance, expand urban afforestation areas, adopt green buildings, increase green elements, enhance ecological factors, optimize energy structure and implement energy substitution, and develop public traffic.
Introduction
Since 2013, haze has continued to shroud most parts of China. Haze pollution has adverse effects on human physical and mental health. 1 The haze pollution accompanies rapid urbanization and industrial development and is the central environmental problem for academia, the government, and the public in China today. 2 China’s government attaches great importance to haze pollution. What are influential factors of haze pollution? Studying these matters has important implications for building a beautiful China.
Various studies have investigated haze pollution in China and worldwide based on natural science. In terms of natural factors, many studies have shown that temperature, relative humidity and air pressure play an important role in the generation of haze pollution.3–5 Notably, haze pollution is a natural phenomenon and caused by human economic activities; thus, studies on haze pollution from an economic perspective have gradually increased in China and worldwide. These studies can be divided into three categories.
First, the studies were based on the environmental Kuznets curve (EKC) of economic development and haze pollution. Kuznets 6 proposed the inverted U-shaped Kuznets curve; Grossman and Krueger 7 proposed the EKC to verify the relationship between a country’s economic development and environmental pollution. Hao and Liu 8 and Ma and Zhang 9 have conducted an empirical study on whether there is an EKC curve between economic development and haze pollution. Second, the studies were based on the influencing factors of haze pollution. Many scholars have explored the causes of haze pollution from the perspectives of trade openness and energy consumption.10–12 They have asserted that trade openness and energy consumption aggravate haze pollution. Third, the studies were based on haze treatment. For example, Zhang et al. 13 proposed that strategies should be adjusted and coal use strictly used to reduce smoke, organic matter, and sulfate in air.
According to these examples in the literature, the studies on haze pollution are gradually rich, and this observation set the foundation of this paper. Notably, these studies have limitations. First, haze is mainly composed of inhalable particulate matter with aerodynamic equivalent diameters below 10 µm (PM10) and particulate matter with aerodynamic equivalent diameters below 2.5 µm (PM2.5). Notably, the literature contains more references to PM2.5 than PM10 and inadequately addresses the EKC between PM10 and urbanization and PM10 by combining the variables of, for example, coal energy consumption proportion and traffic pressure.
Based on these limitations, this study attempts to expand the literature by introducing the following three aspects: (1) with PM10 as the haze pollution, this paper inspects the EKC of PM10 and urbanization; (2) the variables of, for example, coal consumption proportion and traffic pressure are combined to study haze pollution; and (3) this study discusses the influential factors of haze pollution through a spatial Durbin model (SDM) and analyzes the direct and indirect effects.
The next section introduces the research methods and specifies the settings and selection of the spatial econometric model. “Results and discussion” section describes the empirical analysis on pollution problems in 30 provinces in China by applying a spatial econometric model. The final section provides conclusions and suggestions.
The aim of this study is to investigate the influential factors of haze pollution, such as urbanization and coal consumption proportion, expected to benefit China’s ecological civilization construction.
Methodology
Global spatial autocorrelation
Autocorrelation Moran’s I index is used to represent global spatial correlation with the following formula

In formula (1), I is Moran’s index, xi is the concentration of PM10 in the ith region, n is the region number, and wij is the spatial weight matrix. The value range of Moran’s I is from −1 to 1. If the value is greater than 0, the spatial autocorrelation is positive. If the value is close to 1, similar attributes get together. If the value is less than 0, the spatial autocorrelation is negative. If the value is close to −1, different attributes get together. If the value is 0, there is no spatial autocorrelation.
The setting principles of weight matrix W

Local spatial autocorrelation
Anselin
14
proposed Moran’s I (local indicators of spatial association (LISA)) to specify the cluster of variables in a local area. Ii is the index. If Ii is positive, there is positive local autocorrelation. If high values in area i are surrounded by high values in the surrounding areas, it is high–high cluster. If low values in area i are surrounded by low values in the surrounding areas, it is low–low cluster. If Ii is negative, there is negative local autocorrelation. If low values in area i are surrounded by high values in surrounding areas, it is low–high cluster. If high values in area i are surrounded by low values in surrounding areas, it is high–low cluster

Spatial econometric model
Anselin et al. 15 proposed that the panel data model may include a spatial lagged variable, or the error item of model may include a spatial autoregressive process when determining the spatial dependence between observation values. The first model is a spatial lagged model (SLM), the second a spatial error model (SEM), and the third an SDM with spatial lagged dependent variables and independent variables, as proposed by LeSage and Pace. 16
According to Elhorst,
17
the SLM formula of the SLM is as follows

In SEM, the error item
The specific form of the SEM is as follows

The SDM expands the SLM and its specific form is as follows

Variable selection and model setting
To explore the effects of urbanization and GDP, for example, on haze pollution in spatial econometrics, the stochastic impacts by regression on population, affluence, and technology (STIRPAT) model was established based on the impact population affluence technology (IPAT) model. The IPAT model was first proposed by Ehrlich and Holdren
18
and improved later. At present, the widely used model is the STIRPAT model proposed by Dietz and Rosa.
19
The specific form of this model is as follows

α is constant term; b, c, and d are exponential terms of population P, fortune A, and technology T, respectively; and

To inspect urbanization and energy consumption structure and verify the EKC, the improved model is the following formula

Data source and variable specification
The statistics of the PM10 data begins in 2003, in China; thus, this study investigates the PM10 of 30 provinces and areas in China (excluding Hong Kong, Macao, and Taiwan) from 2003 to 2015. Notably, the data for Tibet are missing in some years; thus, Tibet is also excluded. The data of the variables are from the China Statistical Yearbooks, that is 2004–2016 and 2004–2016. Urbanization is the proportion of urban population in the total population at the end of the year. GDP is the actual per capita GDP with 1997 as the base period. EI is the ratio of total energy consumption of each province to regional GDP. The CP is obtained by dividing total energy consumed with standard coal converted by coal consumption with coefficient. Traffic pressure is the ratio of private car ownership to highway length.
Results and discussion
Global spatial autocorrelation analysis
The Global Moran’s I index of PM10 in China from 2003 to 2015 is obtained by using the GeoDA9.5 software. According to the results in Table 1, the Moran’s I index in each year has passed the significance testing under 5% except for 2004, and there is positive spatial autocorrelation for PM10. Notably, since 2011, the Moran’s I index in China gradually increased, and the positive spatial autocorrelation of PM10 was enhanced. Anselin20,21 believed that the visual tool, the scatter plot of Global Moran’s I index, can intuitively display the situation of spatial autocorrelation. Figures 1 and 2 show the scatter plot of Moran’s I index in 2003 and 2015 with “queen” contiguity in the neighborhood spatial weight matrix. Most provinces are located in the first or third quadrant, that is a high–high or low–low positive correlation area. Notably, the provinces in the second or fourth quadrant, that is low–high or high–low negative correlation area, are less. Therefore, the haze pollution in China shows spatial agglomeration.
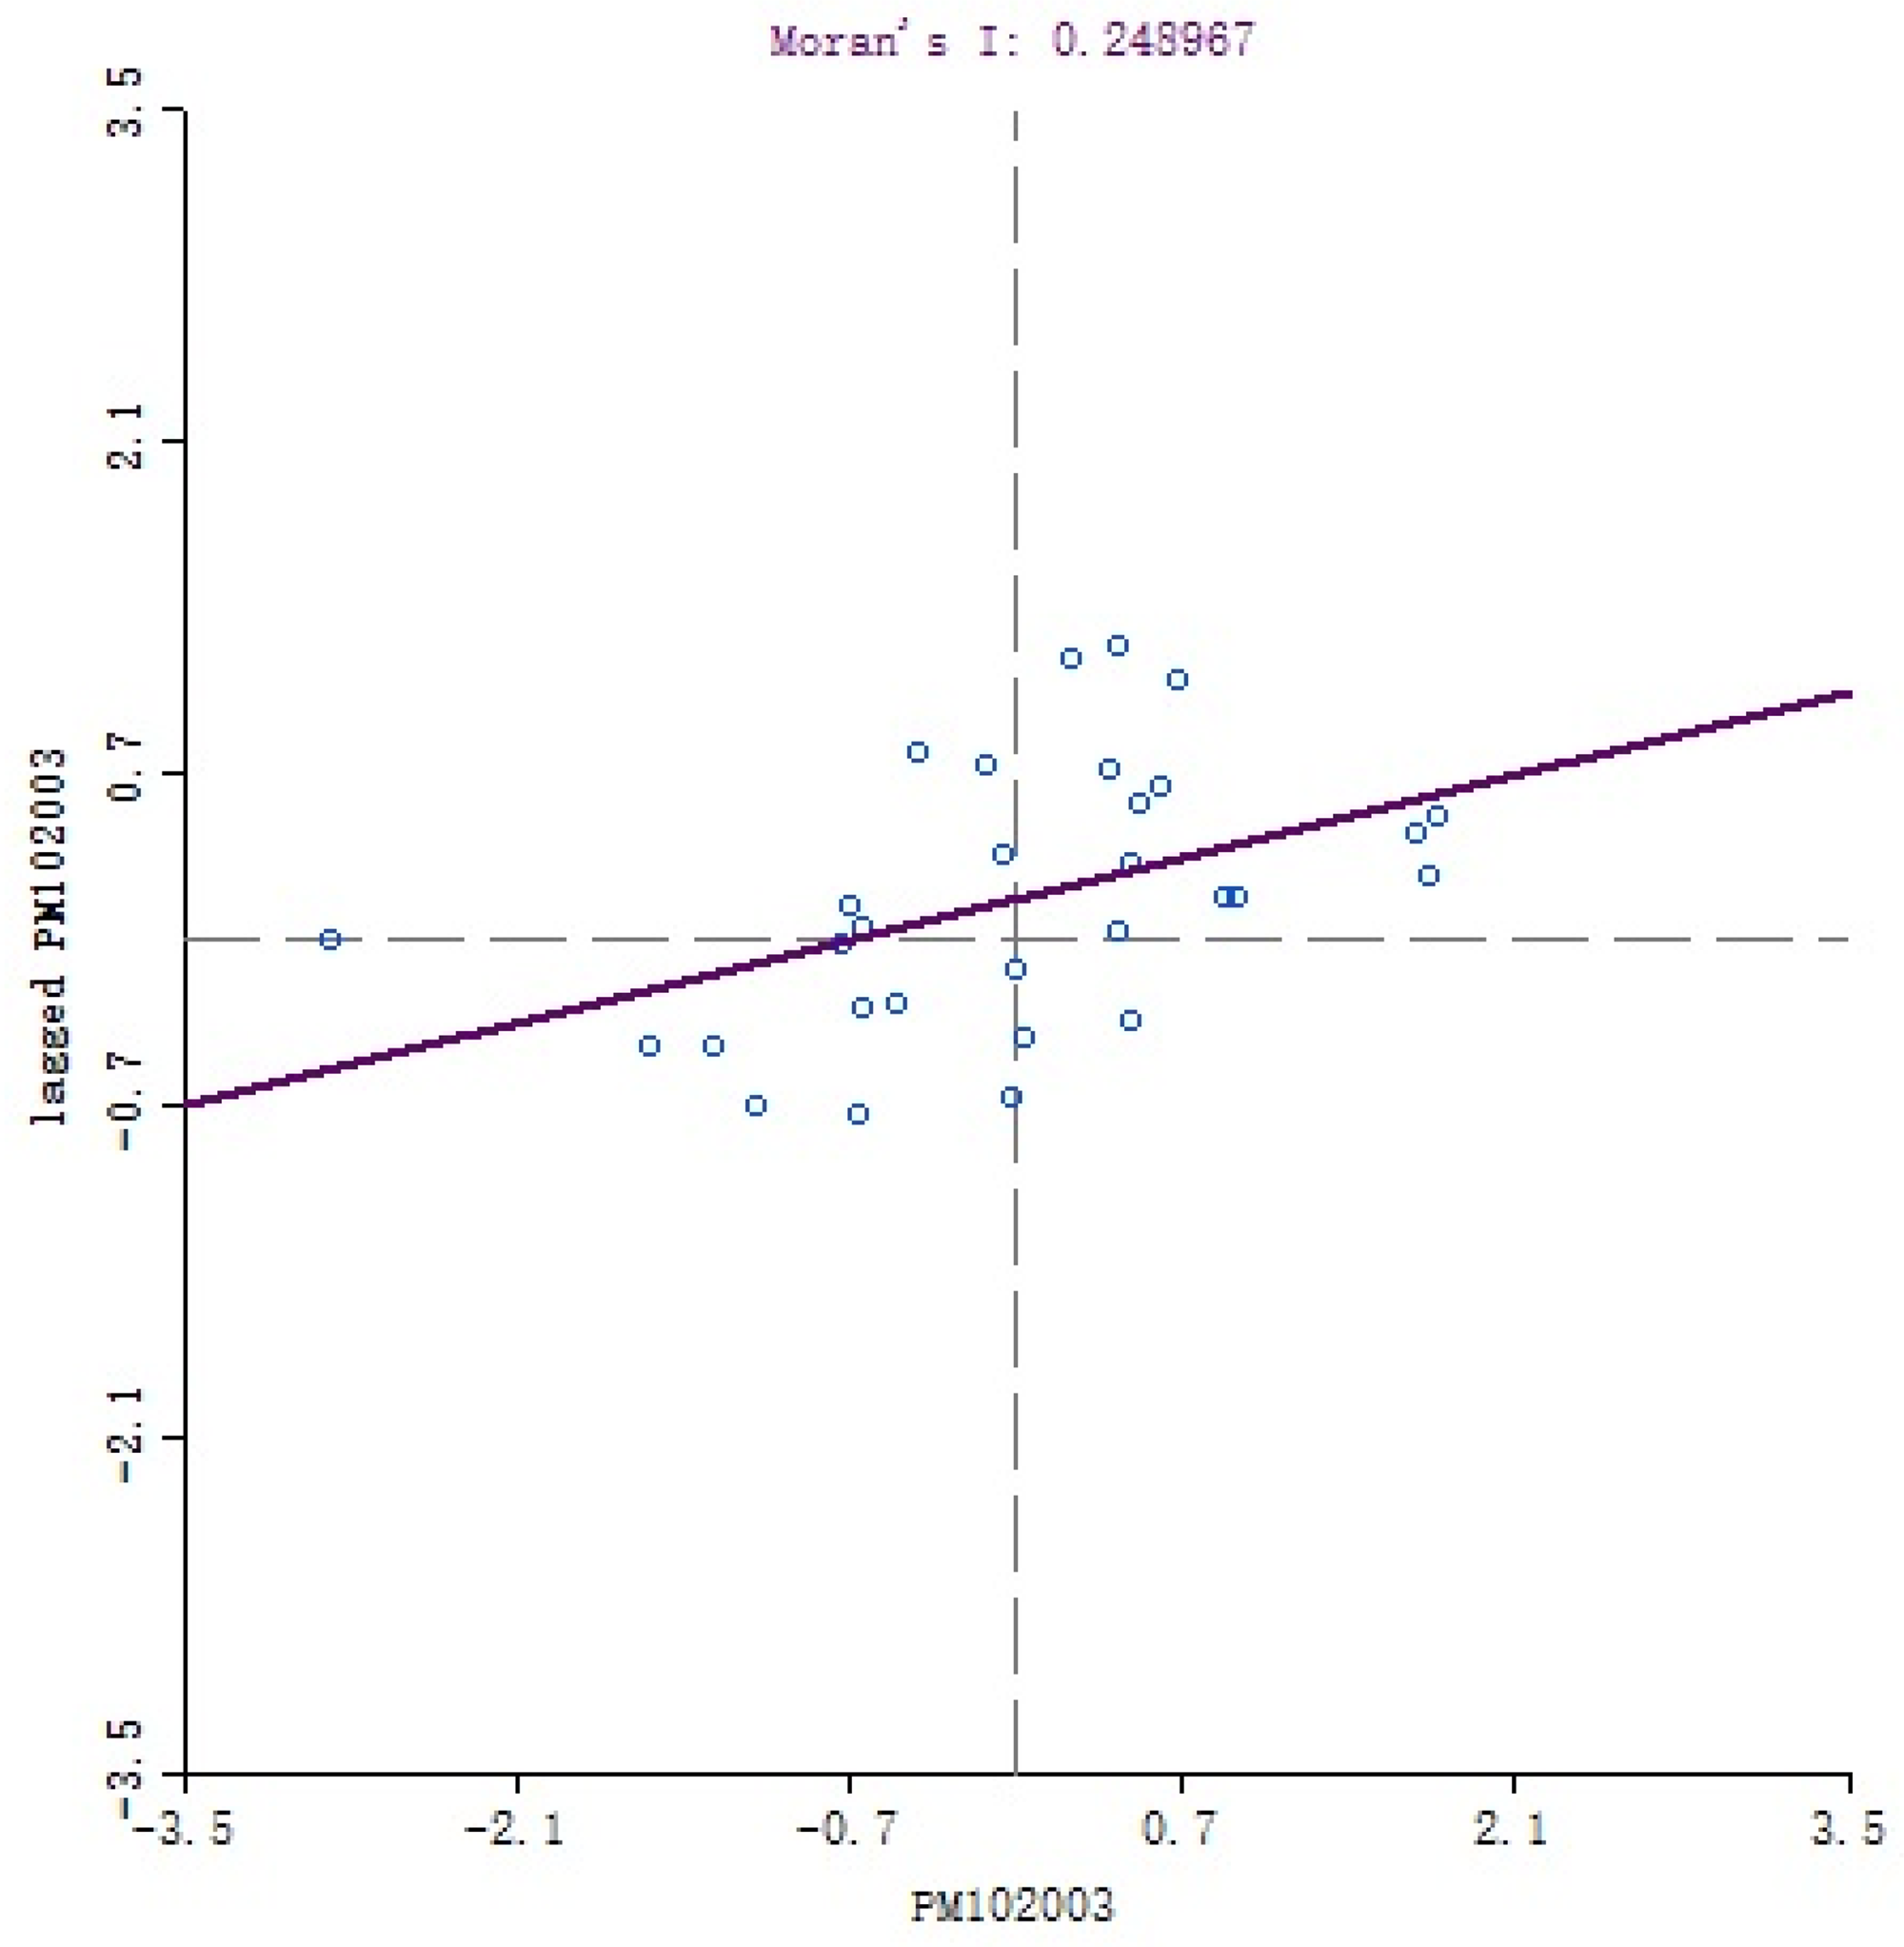
Moran’s I index scatter plot of China’s provincial PM10 in 2003.

Moran’s I index scatter plot of China’s provincial PM10 in 2015.

Local cluster plot of China’s provincial PM10 in 2015.
Global Moran’s I index of PM10.
Local spatial autocorrelation analysis
All the local cluster plots of PM10 from 2003 to 2015 passed the significance test of 5%. This paper only provided the local cluster plot in 2015, as shown in Figure 3. During 13 years, Shanxi, Hebei, Beijing, Shandong, Tianjin, Liaoning, and so forth mainly showed high–high cluster in 2003, 2005, 2006, and 2013–2014. Hebei, Shandong, Henan, and Shanxi showed a high–high cluster; Hunan, Yunnan, Guizhou, Fujian, Guangdong, Guangxi, and Hainan showed a low–low cluster in 2015. This result is identical with the high degree of haze pollution in Beijing–Tianjin–Hebei. Moreover, all these provinces and areas are neighboring, which shows obvious spatial dependence. Fujian, Guangxi, Guangdong, Jiangxi, Zhejiang, and so forth mainly show a low–low cluster. Above all, there is strong spatial overflow effect of haze pollution in China.
Spatial diagnostic test
According to global and local spatial correlation analysis, there is spatial autocorrelation in the studied panel data; thus, spatial estimation should be used. Next, spatial dependence was further tested by the classic Lagrange’s multiple (LM) and the robust LM improved by Zhang et al. 13 Table 2 shows the test results. The classic LM test shows that models of pooled ordinary least squares (OLS), spatial fixed effects, time-period fixed effects, and spatial and time-period spatial effects refused the null hypothesis without a spatial lagged item and spatial autocorrelation error item at the 1% significance level. The robust LM test shows that pooled OLS, spatial fixed effects, and time-period fixed effects refused the null hypothesis without a spatial lagged item and spatial autocorrelation error item. Notably, the spatial and time-period fixed effects did not pass the significance testing of a spatial lagged item and spatial autocorrelation error item. Anselin 14 believed that if the nonspatial model on the basis of these LM tests is rejected in favor of the spatial lag model or the SEM, caution should be used to endorse one of these two models. Zhang et al. 13 suggested using an SDM; thus, this paper estimates the SDM.
Diagnostic tests of spatial specification.
DOF: degree of freedom; LM: lagrange multiplier; LR: likelihood ratio.
Note: Numbers in parentheses represent p values. The alphabet c denotes a significance level of 1%.
To investigate the null hypothesis that the spatial fixed effects are jointly insignificant, the likelihood ratio (LR) test was conducted for the panel data. The lower part of Table 2 lists the LR test results. At a significance level of 1%, the LR test refused the null hypothesis of spatial fixed effects combined with nonsignificance, and the null hypothesis of time-period fixed effect with nonsignificance, that is the spatial fixed effect model and time-period fixed effect model cannot correctly explain the influence of the independent variable on PM10; thus, the spatial and time-period fixed effect model should be used. 22
Empirical results of spatial econometric models
Table 3 shows the estimated results of the SDM. The second column presents the direct estimated results of the spatial and time-period fixed effects. The third column presents the results after correcting the coefficient bias error. The fourth column presents the spatial random effect and time-period fixed effect. The lower half of Table 3 shows the results of the Wald, LR, and spatial Hausman tests. The Wald and LR tests show that spatial and time-period fixed effect, the correction of spatial and time-period fixed effect bias error, and the spatial random effect and time-period fixed effect models have passed the significance test, that is the SEM and SLM must be refused to use the SDM.
Results of the spatial Durbin panel data model.
CP: proportion of coal consumption; DOF: degree of freedom; EI: energy intensity; GDP: gross domestic product; LR: likelihood ratio; TR: traffic pressure.
Note: Numbers in parentheses represent P values. The alphabets a and b represent 5 and 10% significance, and c denotes a significance level of 1%.
To determine if an SDM is spatial fixed or random effect model, the spatial Hausman test should be conducted. In Anselin, 14 if P < 0.01 in the Hausman test, the random effect model must be refused. The estimated value of the Hausman test is 19.9113, with a freedom degree of 15 and P value of 0.1754. Therefore, the random effect model is not refused, and spatial random and time-period fixed effects should be used. Therefore, this paper mainly analyzes the estimated results in the fourth column of Table 3. The coefficient of spatial effect is 0.2219, which passed the significance test above 1%, that is the haze pollution in China has a spatial overflow effect. If the haze pollution decreases by 10% in the surrounding area, the haze pollution decreases by 0.2219%. Notably, the treatments of haze pollution in different regions are not independent. The treatment of haze pollution in one area may positively affect the surrounding areas. Therefore, the policy to reduce haze pollution by region is used in China. The coefficient of urbanization is positive, and the coefficient of the squared urbanization is negative. Both coefficients passed the significance test. There is an inverse-U curve between urbanization and haze pollution, which verified the environment Kuznets EKC hypothesis, that is the initial stage of urbanization caused haze pollution in China. Notably, after a certain period, the degree of haze pollution may decline. The coefficient of per capital GDP is negative, and the coefficient of the squared per capital GDP is positive. Both coefficients have not passed the significance test. The coefficient of traffic pressure on haze pollution is 0.1268, which passed the significance test, that is the increase in traffic pressure in provinces may aggravate haze pollution.
The estimated coefficient of spatial lagged per capital GDP is −6.0016, and the coefficient of spatial lagged squared per capital GDP is 0.3328, which passed the significance test at the 10% level. There is U curve between economic growth and haze pollution. The estimated coefficients of spatial lagged traffic pressure are negative, showing that the increase in traffic pressure in the surrounding area may greatly decrease the local haze pollution and protect the local environment.
Based on Zhang et al., 13 effect resolution was conducted to analyze the spatial overflow effects of factors in an SDM on haze pollution (Table 4). With the feedback effect, the direct effect coefficient in Table 4 is different from the estimated coefficient in Table 3. The feedback effect includes the influences of spatial lagged dependent variables and independent variables.
Direct and indirect effects of SDM model.
CP: proportion of coal consumption; EI: energy intensity; GDP: gross domestic product; TR: traffic pressure.
Note: Numbers in parentheses represent P values. The alphabets a and b represent 5 and 10% significance, and c denotes a significance level of 1%.
The direct and total effects of urbanization and urbanization square have passed the significant test, and this result shows that there is an EKC curve between the local and global urbanization and haze pollution and validates the EKC hypothesis between urbanization and haze pollution. The direct effects of coal consumption proportion and traffic pressure are significantly positive. The increase of coal consumption proportion and traffic pressure increases the haze pollution in the local region.
Conclusions and policy implications
By using the panel data of provinces, this paper examines the influences of urbanization economic growth, coal consumption proportion, traffic pressure, and so forth on haze pollution by spatial econometrics. The major research findings are as follows: the Global Moran’s I index indicates that PM10 has positive spatial relevance, and the LISA cluster map shows a cluster phenomenon of PM10 in the local area. The spatial diagnostic test shows that the SDM of spatial and time-period fixed effects is the optimal model. The results of an SDM show that haze pollution has a spatial overflow effect in China. The haze pollution can decrease by 0.2219% locally, when that in surrounding areas decreases by 10%. Moreover, the inverse-U curve between urbanization and haze pollution is verified by the EKC hypothesis. The increase in coal consumption proportion and traffic pressure increases the haze pollution in the local region.
First, the promotion of regional collaborative governance and formation of a joint force to control haze pollution should continue. The concentrations of PM10 in the provinces of Hunan, Yunnan, Guizhou, Fujian, Guangdong, Guangxi, and Hainan are relatively low, and these regions can collaborate to consolidate their achievements and present these positive effects throughout China. The concentrations of PM10 in Shanxi, Hebei, Beijing, Shandong, Tianjin, and Liaoning are relatively high. The provinces and regions within these regions must negotiate, cogovern, collaborate, share resources and information, and reduce their respective concentrations of PM10.
Second, the study suggests the following: use green as the banner, expand urban afforestation areas, adopt green buildings, increase green elements, enhance ecological factors, and protect the environment. Improvements should also be made regarding energy-saving infrastructure in cities and towns, including the construction of a convenient public transportation network, strong sanitation, and a sewage system to ensure reduced emissions and sustainable development. A notable concept is green town planning, which includes abandoning the one-sided pursuit of the scale of the city, attaching importance to environmental capacity, and achieving the sustainable development of urban ecology and coordinated development of urbanization.
Third, plans to optimize energy structure and implement energy substitution should be implemented. An increase in the CP increases the concentration of PM10 in the local region. Therefore, China should reduce its CP and optimize its energy structure. Although the rapid reduction of China’s coal consumption is a difficult task in the short term, managing the pollution control of bulk coal by formulating coal quality standards, using gasification and purification methods to generate electricity, and using liquid fuels to utilize coal in a cleaner manner is possible. Additionally, as soon as possible, achieve coal-fired power generation on behalf of coal while improving coal quality, reducing the use and supply of coal, optimizing its energy consumption structure, increasing the ratio of clean energy and renewable energy, implementing energy alternatives, supporting the development of new energy, and promoting the consumption of new energy.
Lastly, develop a public traffic network. Traffic pressure harms the atmospheric environment due to energy consumption and vehicular exhaust, 23 public traffic should be greatly developed to ensure the trip is smooth by distributing public bikes, increasing bus routes, and so forth. Public traffic can reduce residents’ desire to own vehicle and decrease the car ownership. Moreover, residents should be encouraged to purchase cars fueled by new energy. Research and development of new energy vehicles should be supported, and the public should be encouraged to purchase new energy vehicles with a subsidy.
Footnotes
Acknowledgements
For their helpful comments and suggestions, the authors would also like to thank Editor-in-Chief Yiu Fai Tsang, the associate editor, and two anonymous referees.
Declaration of conflicting interests
The authors declared no potential conflicts of interest with respect to the research, authorship, and/or publication of this article.
Funding
The authors disclosed receipt of the following financial support for the research, authorship, and/or publication of this article: This paper is supported by the social science fund project in Jiangsu Province (17EYD006) and sponsored by Qing Lan Project in Jiangsu Province.