
Abstract
The causal relationship between energy consumption and gross domestic product in Hong Kong from 1992 to 2015 is investigated in this study. Different from the previous studies focusing on the causal relationship between total energy consumption and total gross domestic product per capita, this study further investigates the causal relationship from sectoral perspective, including residential, commercial, industrial and transportation sectors. For each sector, the time series data of sectoral energy consumption and sectoral per capita value added are collected. To conduct the Granger causality test, the unit root test is first applied to analyse the stationarity of time series. The cointegration test is then employed to examine whether causal relationship exists in long-term. Finally, based on the aforementioned tests, both vector error correction model and vector autoregression model can be selected to determine the Granger causality between time series. It is interesting to find that the sectoral energy consumption and corresponding sectoral per capita value-added exhibit quite different causal relationships. For both residential sector and commercial sectors, a unidirectional causal relationship is found running from the sectoral per capita value added to sectoral energy consumption. Oppositely, for industrial sector and transportation sector, a unidirectional causal relationship is found running from sectoral energy consumption to sectoral per capita value added. Regarding the Granger causality test results, the indicative suggestions on energy conservation policies, energy efficiency policies and greenhouse gas emission reduction policies are discussed based on the background of Hong Kong’s economic structure and fuel types.
Keywords
Introduction
The Granger causal relationship test is first conducted in 1978. 1 They chose the United States as the target country and year 1947–1974 as testing period and conducted the test to determine the causal relationship between total energy consumption and gross national product (GNP). Thereafter, substantial literatures can be found on analysing the causal relationship inner relationship between economic performance (i.e. the growth of gross domestic product (GDP)) and total energy consumption, with an aim to provide advisory recommendations to policy makers. There are four types of causal relationship between economic performance and energy consumption. The causal directions and features are explained below, and a summary of related studies is tabulated in Table 1. The results have implications to policy makers on the environmental policies such as energy conservation policies, energy efficiency policies and greenhouse gas (GHG) emission reduction policies. Scarce research could be found analysing Hong Kong’s situation with comparison to China, but the colonial history makes Hong Kong politically and economically different from China and need to be studied independently. The uniqueness of economic structure and energy mix in Hong Kong will be mentioned subsequently. In addition, the energy consumption and economic performance are changing with time, therefore, there is a need to update the data on the energy consumption–GDP relationship close to the present time. More importantly, no detailed study on the causal relationship in different sectors has been conducted for Hong Kong yet. In particular, sectoral-based studies on analysing the causal relationship in Hong Kong have not been conducted yet. Therefore, this research is purposely designed to fill the research gap to provide advice for policy makers explicitly on residential sector, commercial sector, industrial sector and transportation sector. The contribution of this paper can be highlighted as renewing the time series data of both total and sectoral energy consumption and GDP up to year 2015 to conduct the Granger causality test, and more concrete test results are obtained. Furthermore, policy implications are discussed in accordance to the Granger causality results, which are crucial to energy-related policy makers in Hong Kong.
Summary of Granger causality studies.
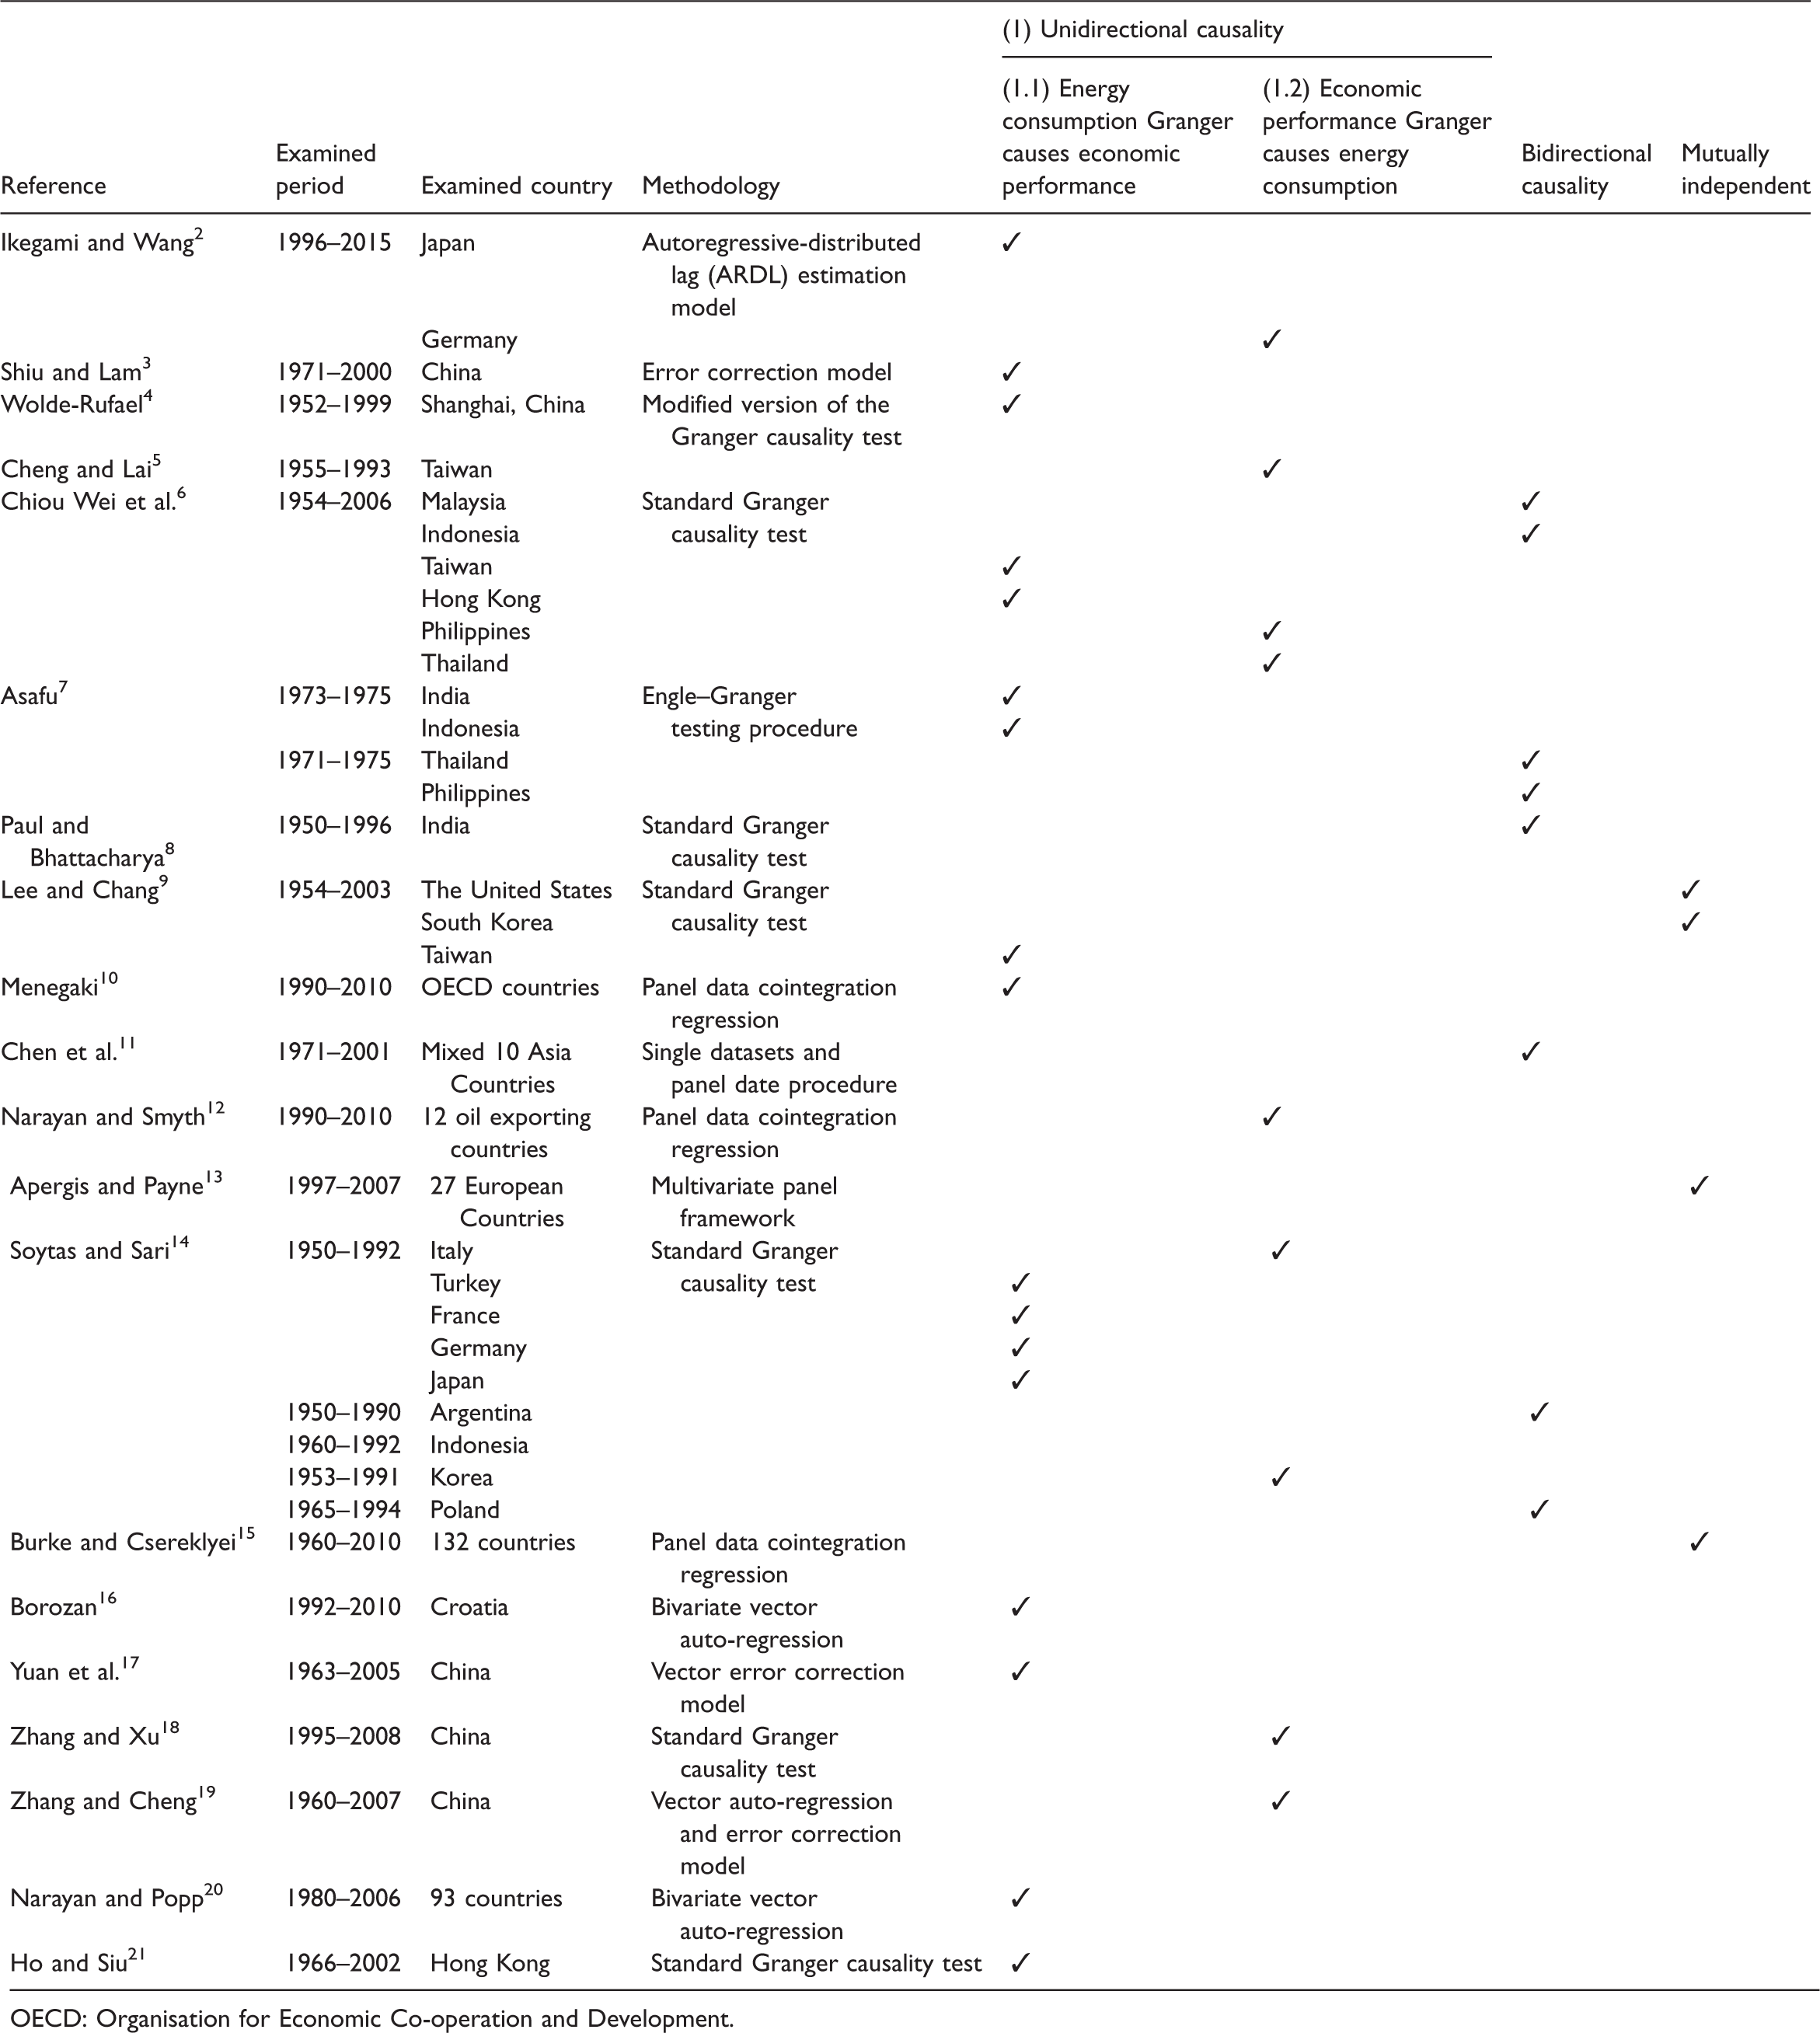
OECD: Organisation for Economic Co-operation and Development.
Unidirectional causality
1.1 Energy consumption Granger causes economic growth
This type of causal relationship implies that the economic growth is associated with the increase of energy consumption. A typical case of this causality type is Japan. Study indicates that the booming development of Japan’s economy relies on its domestic electricity consumption from 1996 to 2015,
2
and the sudden loss of nuclear power supply after Fukushima accident has resulted in the first trade deficit in Japan 2011 since 1980 oil crisis. As a compensation to nuclear power, the substantial and expensive imports of fossil fuels have significantly struck Japan’s economic performance.
22
This implies that Japan has a revived intention to reboot nuclear power in the future since the shortage of electricity supply will trigger the Japanese economy to a large extent.
23
Shiu and Lam
3
examined China’s situation during 1971–2000 and the result also indicated unidirectional causality running from energy consumption to economic growth. This implication is consistent with Wolde-Rufael’s
4
research that only examined Shanghai’s case. Under this causality type, the implementation of energy conservation policies, energy efficiency policies and GHG emission reduction policies may impede the development of an economy and should be carefully conducted based on continuous evaluation of the impact on economic performance.
1.2 Economic growth Granger causes energy consumption
The second type is another form of unidirectional causality relationship running from economic performance to energy consumption. Taiwan and Germany are good examples.
5
This causal direction implies that economic growth leads to more energy consumption. That is to say, the implementation of energy conservation policies, energy efficiency policies and GHG emission reduction policies would not significantly affect economic growth or the impact could be mitigated if proper countermeasures are undertaken.
24
2. Bidirectional causality
The third causality type is the bidirectional causality between economic performance and energy consumption. Southeast Asian countries such as Malaysia, Indonesia, Philippines and Thailand are representative countries.6,7 In South Asia, this causality type is also found in India by Paul and Bhattacharya.
8
The bidirectional causality implies that the economic development relies on the energy consumption, but simultaneously it might be affected by the implementation of energy-related policies.
3. Mutual independence
The last type is the mutually independent relationship between energy consumption and economic development, which means no statistically causal relationship between these two variables. United States and South Korea are representative examples. 9 Under this causality type, the economic development is statistically unrelated to the energy consumption. The implementation of energy and environmental protection policies is therefore in sound conditions and will not impede economic growth.
In addition to analysing the causality relationship in a particular country, some studies have examined the panel data of a set of countries by regions or by organizations. For example, a study has analysed the relationship between energy consumption and economic development in European countries and concluded that the energy consumption Granger caused economic growth. 10 Other studies have also conducted this test on 10 Asian countries and found that long-term bidirectional causal relationship exists. G-7 countries and Organisation for Economic Co-operation and Development countries have also been investigated.11–13 Test on nine independent countries has been delivered and diverse types of causal relationship were found among these countries. 14 Furthermore, some studies do not simply analyse these two variables, but further decompose the variables by sectors or by fuel types. For instance, a study has decomposed the energy consumption and GDP elasticity in 132 countries by sectors and fuel types. It was found that residential energy consumption was inelastic to per capita household expenditure added if biofuels were counted in total energy consumption tallies. Moreover, from the sectoral perspectives, residential electricity consumption was proved to be more closely connected to GDP growth than other sectors in those sample countries. 15 Besides, the causal relationship between economic performance and energy consumption by fuel types in Croatia has also been examined. 16 A unidirectional causal relationship is found running from GDP to primary energy resources such as liquid fuel, and natural gas, as well as secondary energies such as solar power and wind power. No causal relationship is identified between GDP and coal consumption. From a policy maker’s perspective, it indicates that the formulation of energy-related policies should comprehensively take fuel types into consideration.
The results of Granger causality test might be different and cause ambiguity sometimes even examining the same countries or regions due to different time span being selected, methodologies being applied, and model specifications being employed or the bias appeared in the estimates of parameters in a regression analysis. 25 In addition, different results can also be caused by various conceptual frameworks and various policies adopted by different countries. 26 Studies have compared different Granger causality results in the Chinese context based on different model and time span, or reported the cross-section dependence between countries which is usually overseen, and this leads to biased results.17,27 Taking China as an example, a study has concluded that the increase of energy consumption is associated with economic growth, 18 which is consistent with the result delivered by Zhang and Cheng, 19 but is contradicted to the results by others. 20
Hong Kong has a very different economic structure and energy mix from mainland China as a Special Administrative Region. After China adopting open-door policy since late 1970s, Hong Kong is gradually shifting its economic structure as well as its energy mix. A large amount of manufacturing activities outflows to Mainland China, leading to the industrial sector GDP share dropped from 33.2 in 1984 to 7% in 2014. However, the GDP share of the commercial sector increased dramatically from 20% to more than 80%, trailed by smaller rises in the residential sector and slight drop in the transportation sector. The relationship between energy consumption and economic consumption could be affected by economic structure change because the energy mix changes from industrial- to commercial-led economic structure and shows obvious discrepancies.21,28
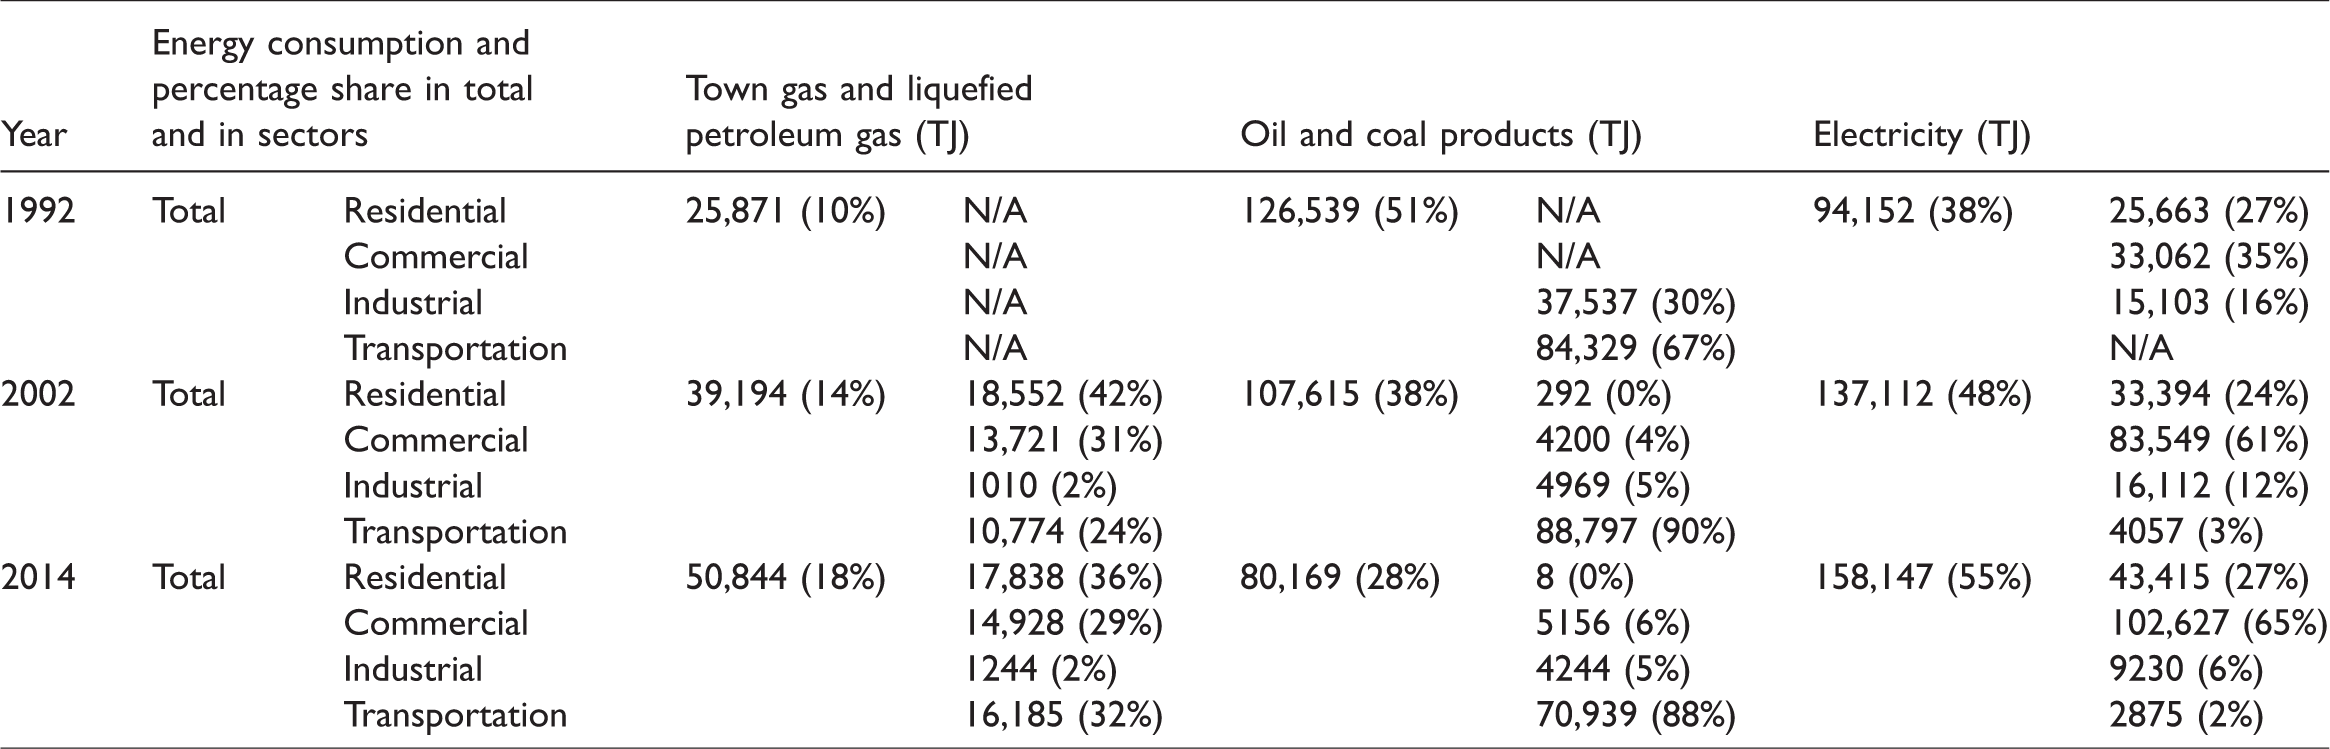
Regarding the Hong Kong Electrical and Mechanical Services Department (EMSD), the energy data are categorized into town gas and liquefied petroleum gas (LPG), electricity, and oil and coal products. This paper extracted the energy mix data in year 1992, 2002 and 2014 from EMSD for comparison purpose (Table 2). ‘Electricity’ refers to the electricity generated from natural gas, coal, solar energy as well as wind energy. ‘Town Gas and Liquefied Petroleum Gas’ includes town gas, bio-gas and LPG. ‘Oil and Coal Products’ include charcoal, biodiesel, gasoline, diesel, kerosene, semi-coking coal coking coal, anthracite as well as aviation fuel. It is evident that the energy mix in Hong Kong has shifted significantly and the use of oil and coal products is gradually replaced by electricity. Besides, it is found that residential sector, commercial sector, industrial sector and transportation sector are four dominating energy consumers in Hong Kong. The fuel type consumed in these sectors has also shifted drastically in the past decades.
Energy mix in 1992, 2002 and 2014.
The changes of structure have flourished the local economy and shaped Hong Kong as an important financial centre in the world. Import–export, finance and insurance and business services have dominated Hong Kong’s economic structure. Under a rapidly developing economy and possessing a huge energy market, Mainland China has always drawn plenty of attentions from the global market and been studied by researchers. However, those studies on China are always not including Hong Kong since Hong Kong is a politically and economically autonomous region. So the relevant results and conclusions could not be generalized and applicable to Hong Kong. The integration with China has brought about tremendous challenges to Hong Kong, especially the localism procedure under political and economic dynamics. 29 Nevertheless, the feature of ‘post-colonial’ Hong Kong has exaggerated the contrasting from extended infrastructural projects to retain a local culture. 30 In addition, the extremely dense population and the sub-tropical climate makes the energy mix in Hong Kong very unique. 31 In other words, Hong Kong needs to be studied independently. Nevertheless, insufficient studies have selected Hong Kong as a target city. Therefore, this paper considered the special background of Hong Kong and examined the causal relationship between energy consumption and economic performance of Hong Kong over the past decade on the basis of four sectors: commercial sector, residential sector, transportation sector and industrial sector. Up to date, only two papers could be found focusing on Hong Kong, one has applied both linear and non-linear Granger causality test to examine the causal relationship between total energy consumption and GDP of Hong Kong during period 1954–2006. The results show a unidirectional causality running from total energy consumption to GDP. 6 Another research focuses only on the electricity consumption rather than energy consumption of Hong Kong from 1966 to 2002, which has indicated a unidirectional causality running from electricity consumption to GDP. 21
To achieve the research purpose, the structure of this paper is organized as follows: the next section introduces the methodology in this paper. ‘Empirical research’ section consists of the data collection and empirical results. ‘Discussions and policy implications’ section discusses the policy implications with accordance to the test results in section three. The final section concludes and summarizes this paper.
Methodology
The methodology consists of three steps to achieve the aim of this paper, which includes unit root test, cointegration test and Granger causality test. The initial step is the unit root test, which is applied to check the stationarity of each time series, middle step is the cointegration test for checking the presence or absence of spurious regression and is able to identify whether stable long-term relationship of the variables exists or not. The last step is the Granger causality test for determining the direction of causal relationship.32,33
Unit root test
Two preferred techniques in the unit root test are the Phillips–Perron (PP) test and the augmented Dickey Fuller (ADF) test.34–36 The Kwiatkowski–Phillips–Schmidt–Shin (KPSS) test could be referred if results of PP test and ADF test are controversial. The time series variables are tested in level, in the first difference (and the second difference if necessary until the null hypothesis is rejected to all in the same order). MacKinnon p-value is used to determine the statistical significance.
37
The basic vector autoregression (VAR) model is presented as

Cointegration test
To check if spurious regression exists or not, two testing techniques are suggested by Johansen and Juselius.
38
One is the trace statistics and the other is maximum eigenvalue statistics. Equations (2) and (3) explain trace statistics test and maximum eigenvalue statistics test, respectively. r denotes the number of relationships being tested. λi is the ith largest canonical correlation and T denotes the sample size
39

For general cases, trace statistics and maximum eigenvalue statistics generate similar cointegration results when dealing with small test samples. If the sample is too large, it is found that the trace statistic test is more powerful than the maximum eigenvalue statistic test.
40
The cointegration test starts with the VAR of order p given by

Granger causality test
The unit root test and cointegration test are cooperated to determine the presence or absence of the long-term cointegration relationship. If it is present, the vector error correction model (VECM) is employed to test the direction of causal relationship. If it is absent, the VAR is employed to test the Granger causality.
42
The bivariate VECM regression form is presented as


Empirical research
Data collection
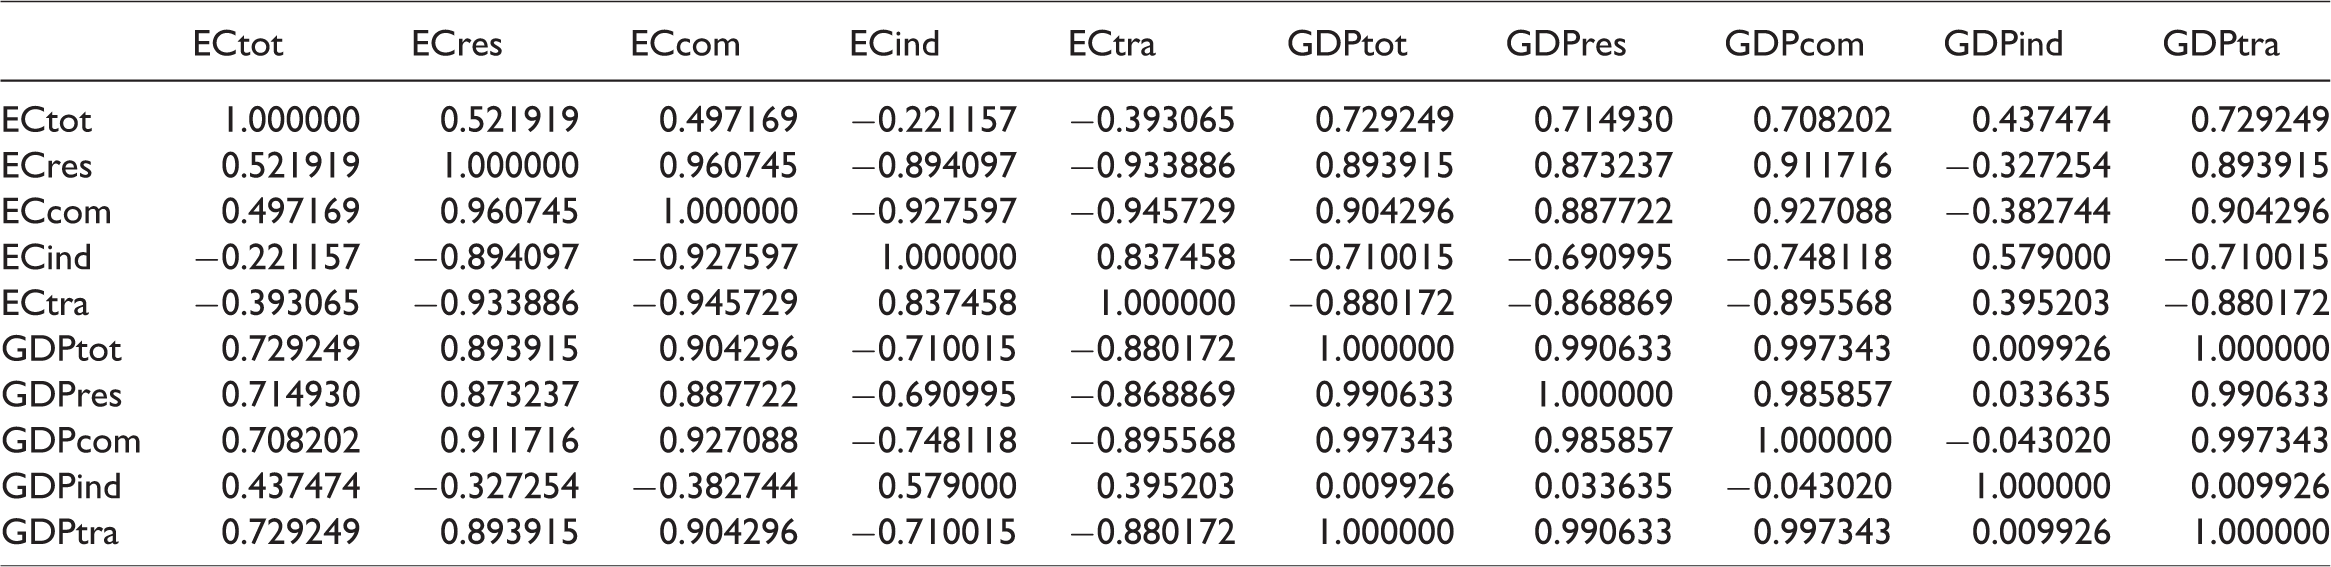
The energy consumption datasets are collected from the Hong Kong EMSD, including the total and sectoral energy consumption from 1992 to 2015 (data available only to year 2015), with the original unit of ‘terajoule’ (Figure 1). The GDP and the value-added datasets in industrial sector, commercial sector and transportation sector, and the added household expenditure are extracted from the GDP (yearly) published by the Hong Kong Census and Statistics Department, all data with the unit of ‘Millions of Hong Kong Dollar’. To convert the GDP unit to USD per capita (Figure 2), the original data (with Hong Kong Dollar) are divided by the total population of Hong Kong which is obtained from the Hong Kong Census and Statistics Department. The population is selected by stages as according to the Census results in mid-1996, mid-2001, mid-2006, mid-2011 and mid-2016, respectively. To convert per capita Hong Kong Dollar to per capita USD, an average exchange rate of 0.128 (1Hong Kong Dollar = 0.128USD) is used for calculation (data available at the World Bank), since the linked exchange rate system mechanism stabilizes the exchange rate between Hong Kong Dollar and USD. Ten time series of data are collected and summarized in Appendix 1. The descriptive statistics and correlation matrix of 10 time series are represented in Tables 3 and 4, respectively. The Jarque–Bera test measures whether the series is normally distributed or not. The results shown in Table 3 indicate that the series of per capita industry value added should be rejected from the null hypothesis of normal distribution, whereas other series are statistically proved normal distribution. However, normality is not a prerequisite condition when testing the stationarity of a series.
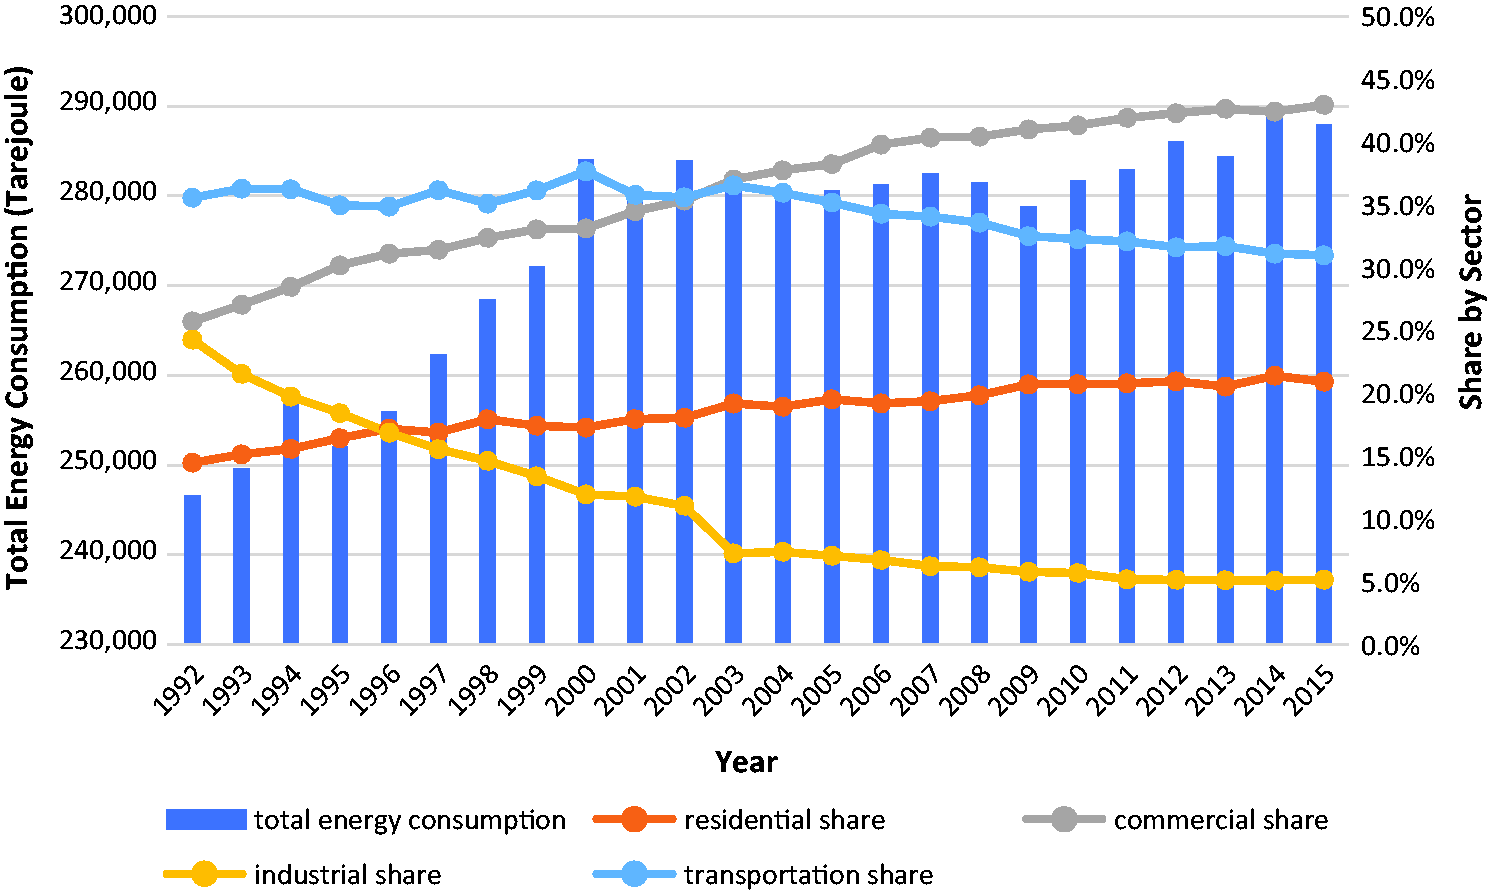
Total energy consumption (terajoule) and the share of four sectors.
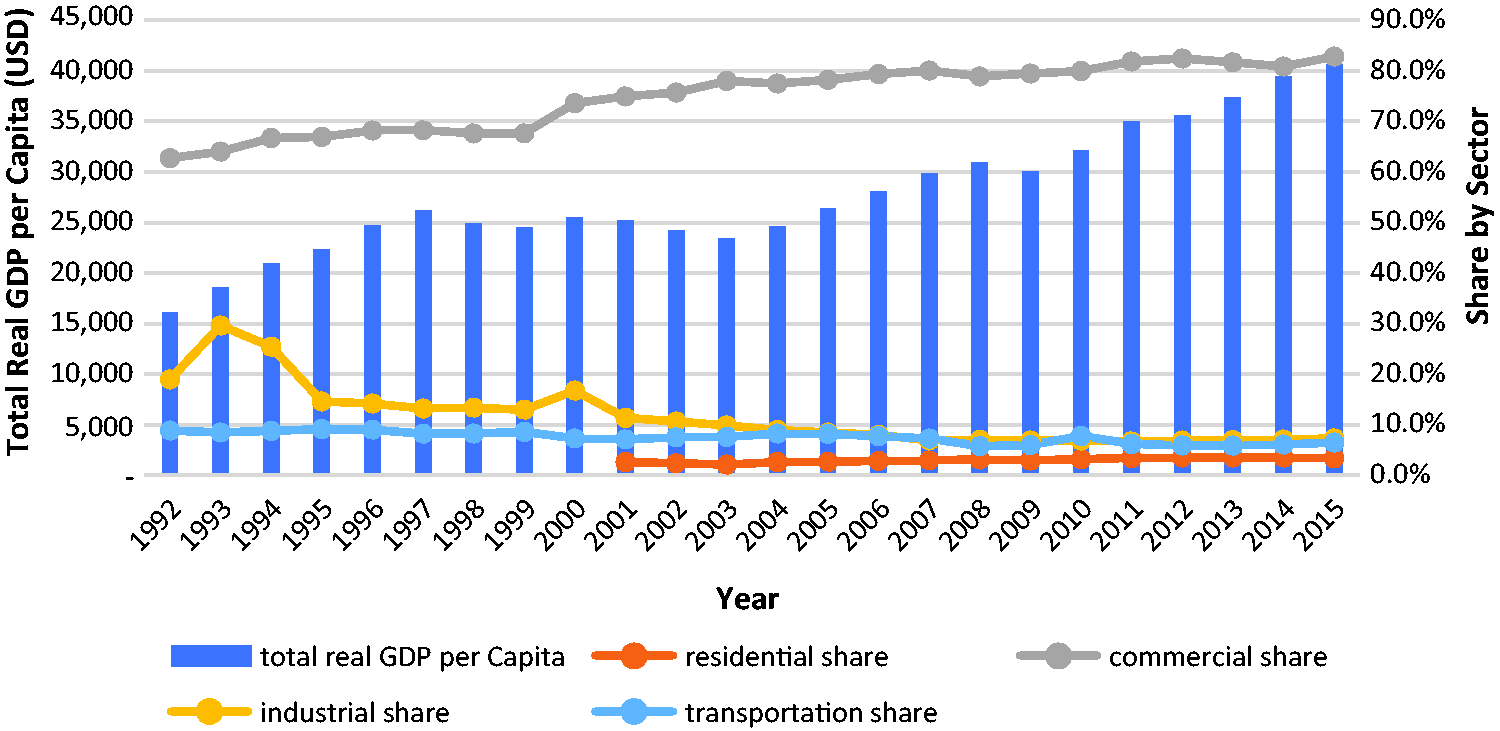
Total real GDP per capita (USD) and the share of four sectors. Note: The added household expenditure from 1992 to 1999 are lacking in the original publication of the GDP (yearly) as published by the Hong Kong Census and Statistics Department. GDP: gross domestic product.
Descriptive statistics.
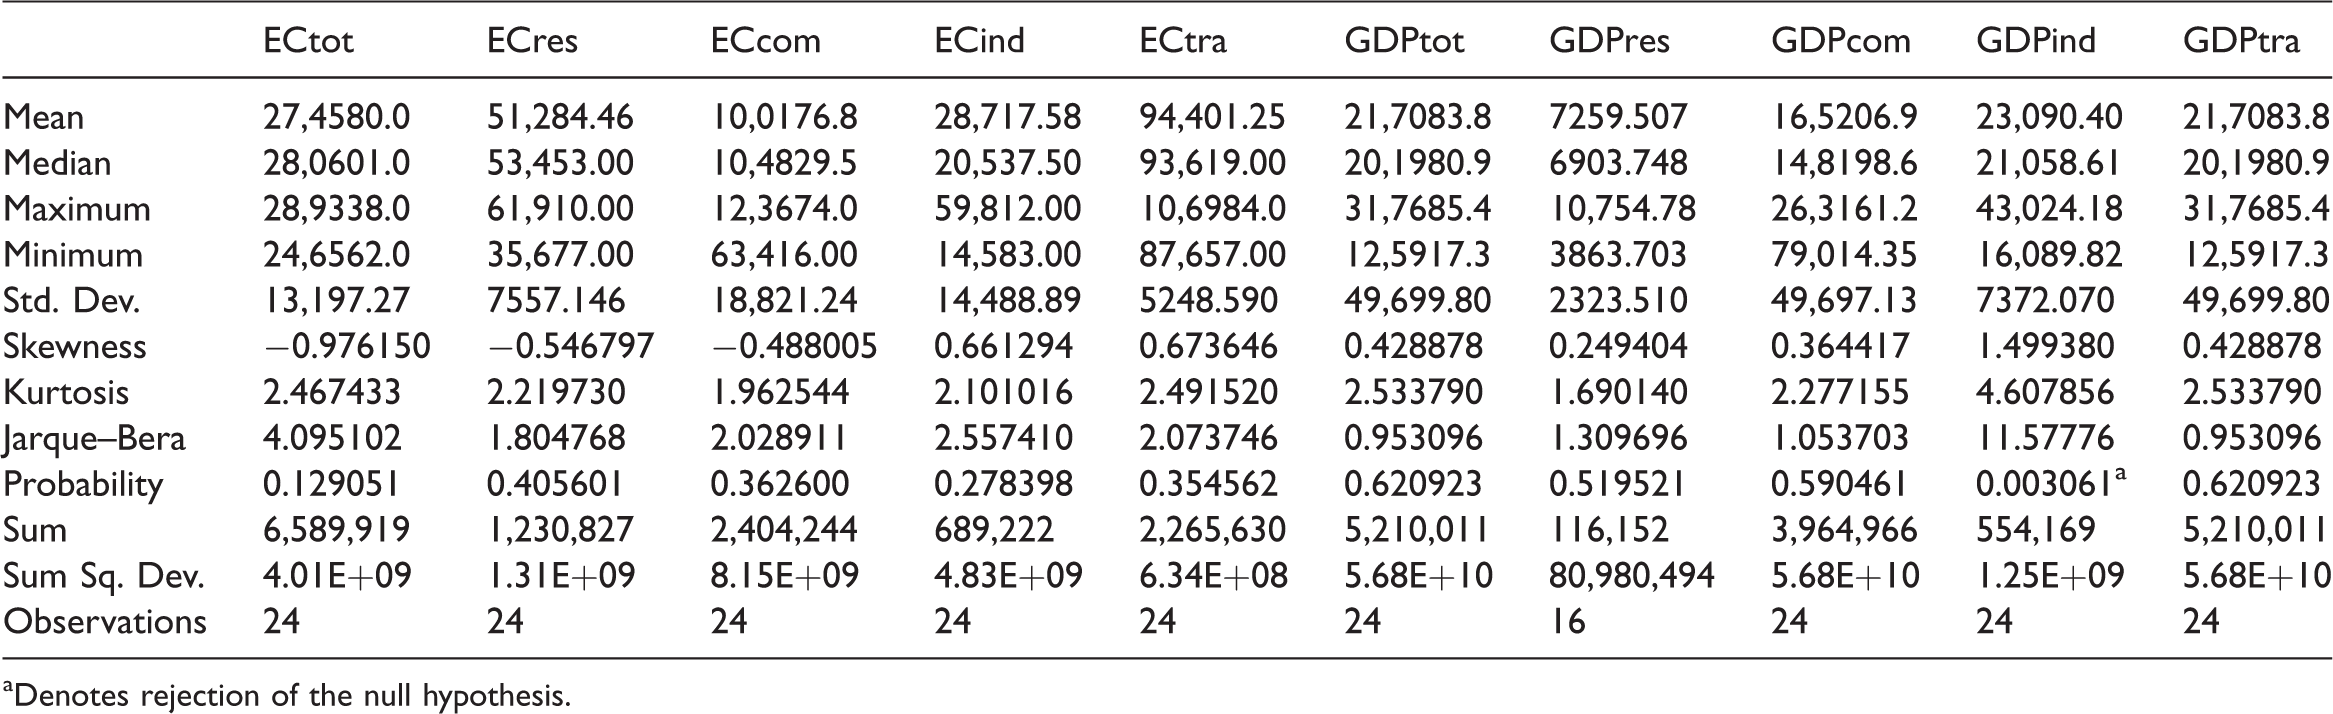
aDenotes rejection of the null hypothesis.
Correlation matrix.
Empirical results
In this section, unit root test, cointegration test and Granger causality test are conducted and the results are shown from Tables 5 to 8.
Unit root test.
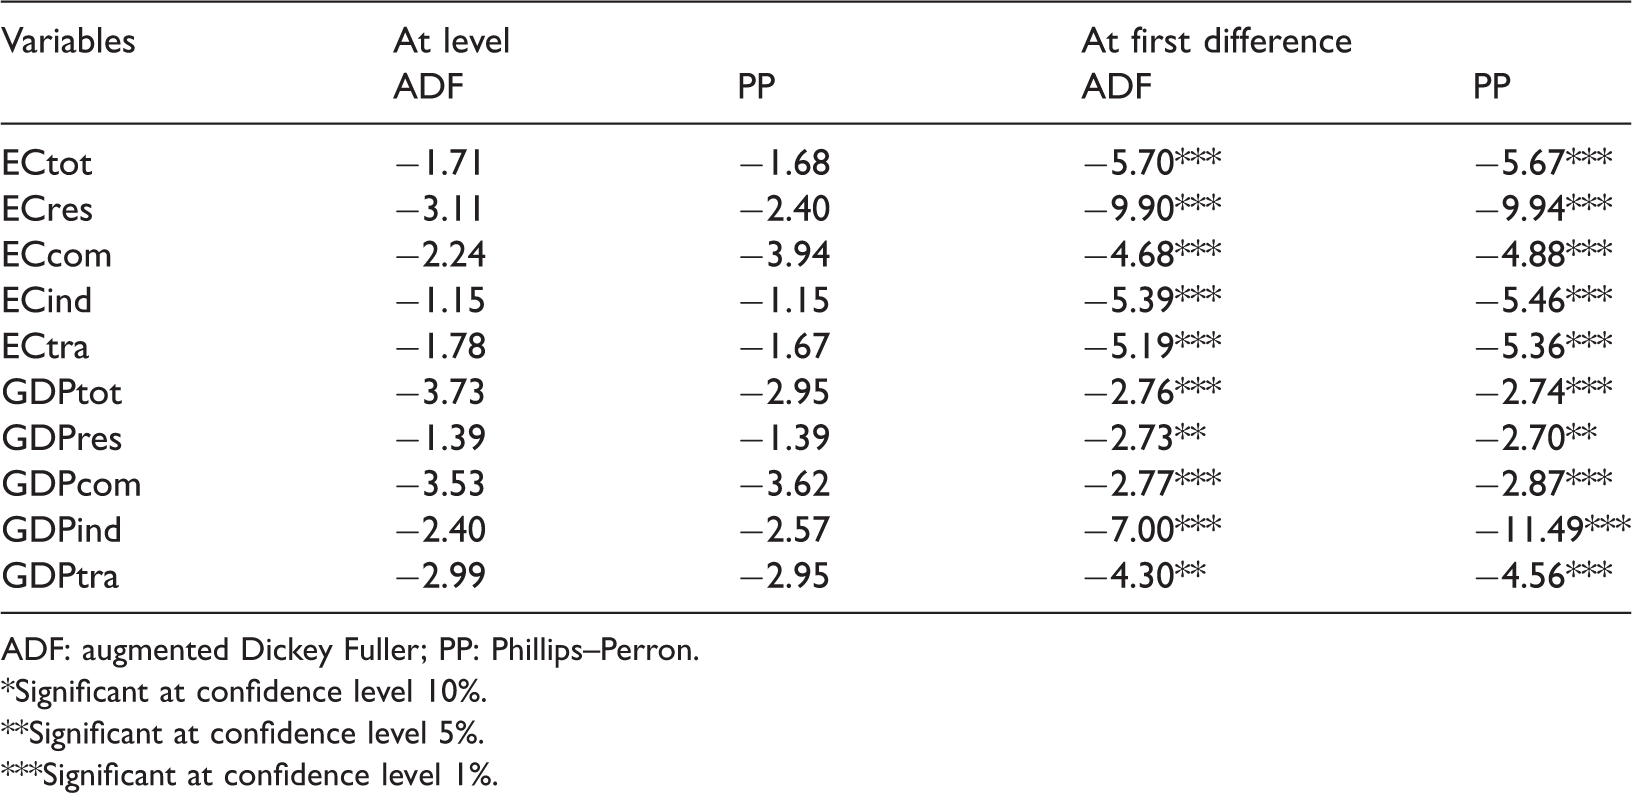
ADF: augmented Dickey Fuller; PP: Phillips–Perron.
*Significant at confidence level 10%.
**Significant at confidence level 5%.
***Significant at confidence level 1%.
Lag length selection.
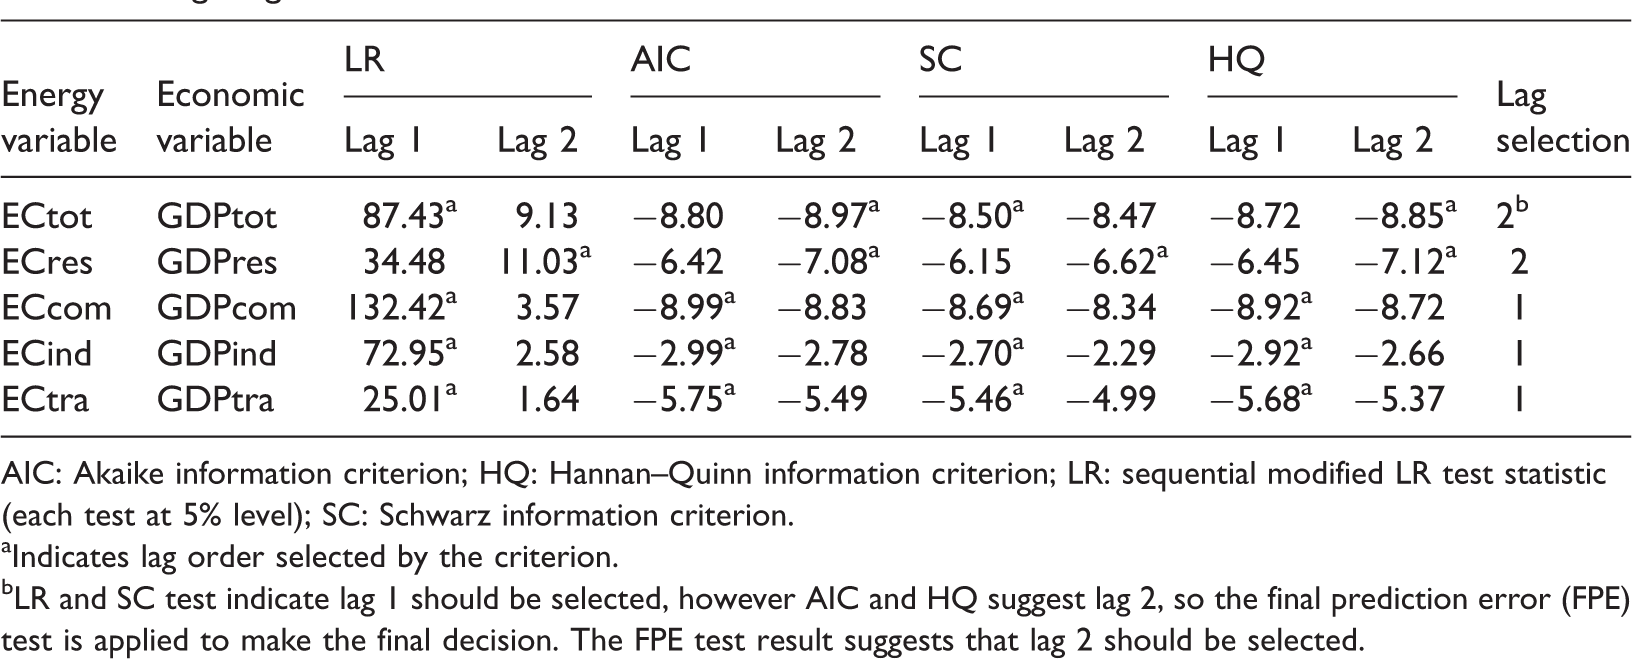
AIC: Akaike information criterion; HQ: Hannan–Quinn information criterion; LR: sequential modified LR test statistic (each test at 5% level); SC: Schwarz information criterion.
aIndicates lag order selected by the criterion.
bLR and SC test indicate lag 1 should be selected, however AIC and HQ suggest lag 2, so the final prediction error (FPE) test is applied to make the final decision. The FPE test result suggests that lag 2 should be selected.
Cointegration test.
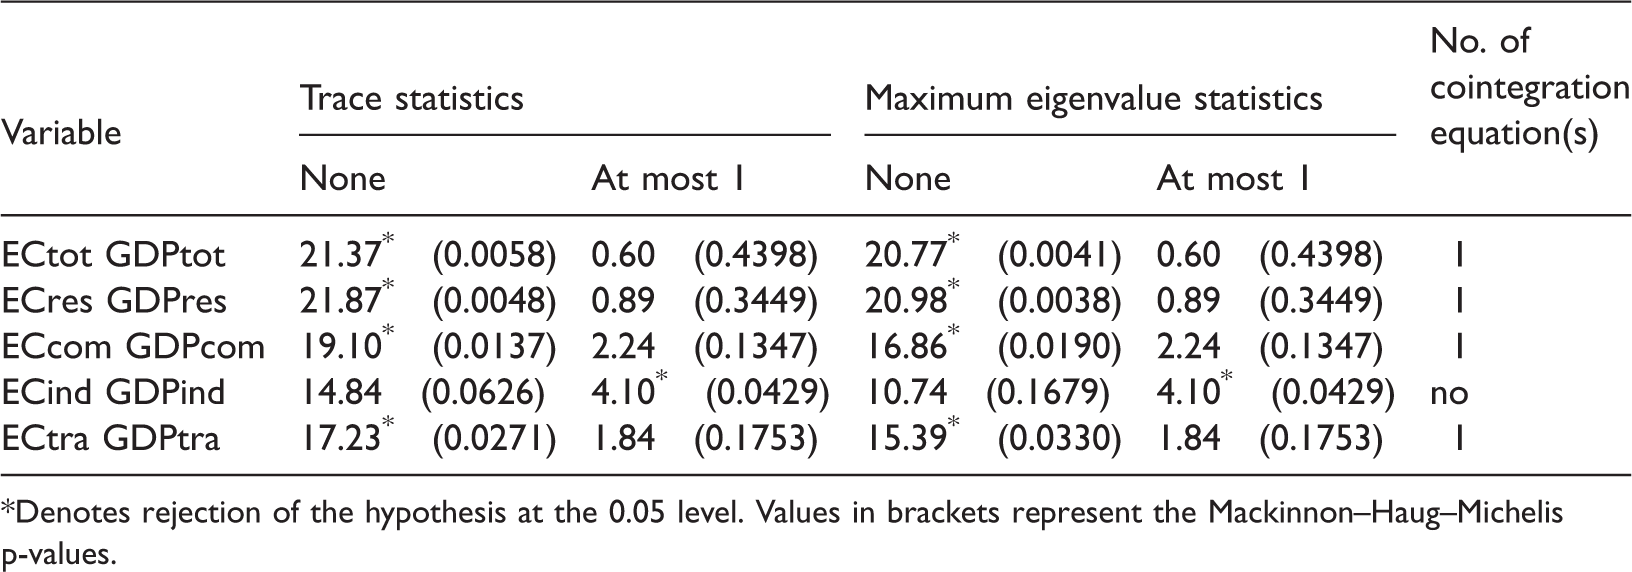
*Denotes rejection of the hypothesis at the 0.05 level. Values in brackets represent the Mackinnon–Haug–Michelis p-values.
Granger causality test.
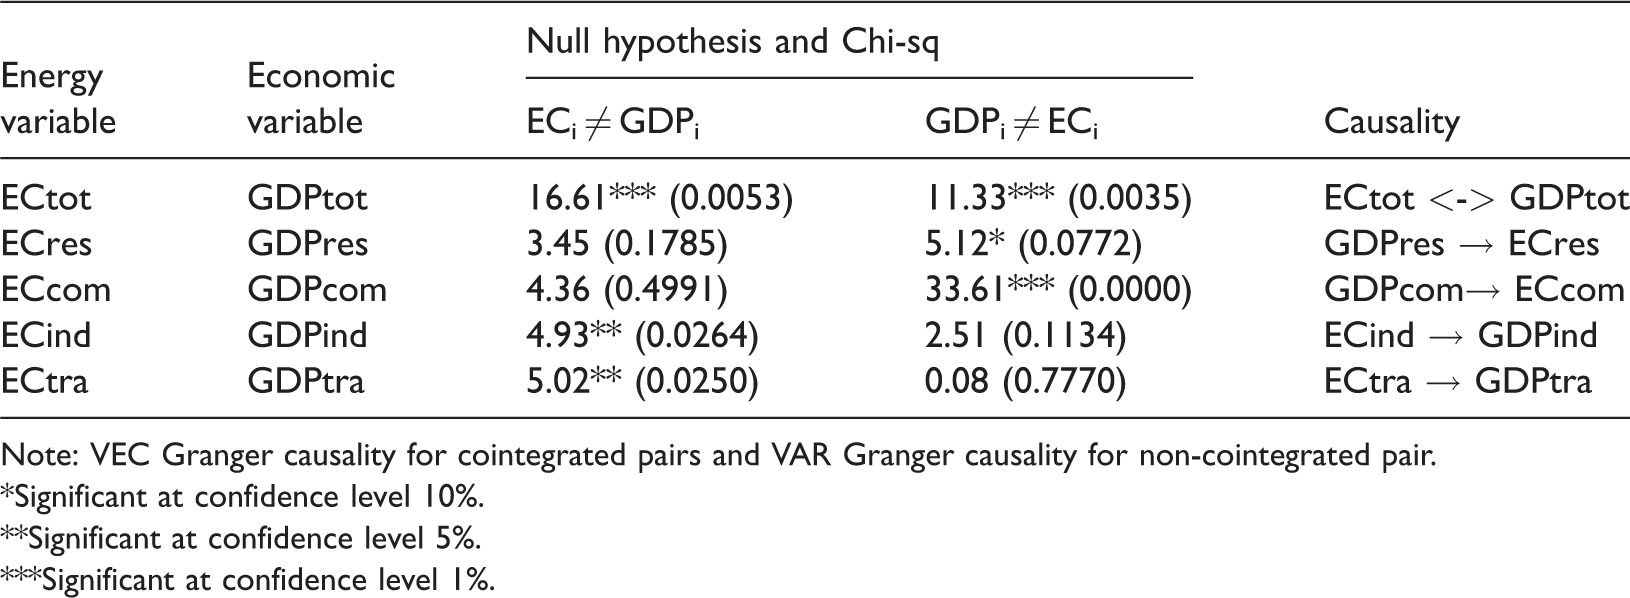
Note: VEC Granger causality for cointegrated pairs and VAR Granger causality for non-cointegrated pair.
*Significant at confidence level 10%.
**Significant at confidence level 5%.
***Significant at confidence level 1%.
The unit root test results are presented in Table 5. The results suggest accepting the null hypothesis (the existence of unit root) at level but rejecting the null hypothesis at first difference, which implies that all time series are non-stationary at level but are stationary at the first difference. To improve the test accuracy, this paper also adopts KPSS test to prove the rationality of the results, 43 which is presented in Appendix 2.
The selection of the appropriate lag length for time series variables is extremely important, since a non-optimal lag length may negatively affect the test results due to mistaking dynamic status of time series or distorting the power of the variables. 44 The lag order selection is commonly determined by LR, AIC, SC and HQ criterion and the lag length selection result is shown in Table 6. The results indicate that the optimal lag length of two models (total energy consumption and real GDP per capita, residential sector) is two, and optimal lag length of other three models (commercial sector, industrial sector and transportation sector) is one. The FPE test is used for the total energy consumption and GDP model for final decision.
The results of cointegration test are displayed in Table 7. No cointegration relationship is found between the time series of industrial energy consumption and per capita industry value added. The cointegration relationship between energy consumption and per capita of added value for other sectors is observed in the long-term. Therefore, for the Granger causality test, we add an ECM term only to the models which are cointegrated.
The results of Granger causality test regarding the energy variables and economic variables are presented in Table 8, which shows great differences among different sectors. Bidirectional causal relationship is found between the total energy consumption and per capita GDP. For the decomposed sectors, unidirectional causal relationships are found running from the added per capita household expenditure to energy consumption in residential sector and from per capita commerce value added to energy consumption in commercial sector. This finding implies that for the residential and commercial sectors, the increase of energy consumption is associated with the improvement of sectoral economic performance. Therefore, energy conservation policies, energy efficiency policies and GHG emission reduction policies for these two sectors would not significantly affect economic performance, or the negative impacts of implementing such kind of policies on economic performance could be mitigated. On the other hand, unidirectional causal relationship is found running from energy consumption in industrial sector to per capita industry value added and from energy consumption in transportation sector to per capita transport value added. This reveals that the boost of economic performance in industrial sector and transportation sector relies on the energy consumption. As a result, implementing energy conservation policies, energy efficiency policies and GHG emission reduction policies might impede economic performance of these two sectors.
Discussions and policy implications
Evidence from ‘Empirical results’ section indicates that the economic performance of industrial sector and transportation sector is more sensitive to energy-related policies. Energy policies for residential sector and commercial sector should be carefully formulated and evaluated to avoid its negative effect on the per capita GDP. A testing period is suggested to measure the performance of the electricity conservation policy on specific buildings or firms. Some voluntary policies seem to be ineffective and thus mandatory policies should be implemented. Since energy policies for industrial sector and transportation sector may affect the per capita value added, energy policies for industrial sector and transportation sector should be carefully examined for the pros and cons, especially regarding the pollutant emission reduction policies.
Transportation and industrial sectors
The changing structure has also contributed to the transportation sector. The declining importance of manufacturing industry in Hong Kong leads to a dropping necessity on the raw materials transportation into China, and consequently a decreasing necessity on transporting back again for exporting to the foreign markets. Hence the energy consumption of goods vehicles rapidly drops from 33,946 TJ in 1992 to 25,009 TJ in 2014. 45 However, the passenger transport demand is inexorable changing with the movement of inhabitant from Hong Kong Island (20.6% in 2004 and 17.2% in 2014) and Kowloon (31.0% in 2004 and 30.2% in 2014) to the New Territories (48.1% in 2004 and 52.6% in 2014). As more people decide to transport by cars and taxis, the energy consumption by cars and taxis is gradually increasing in the past decade. However, the energy consumption by rails and buses is decreasing, probably because of the ‘Area Approach Bus Route Rationalisation’ plan by the Transport and Housing Bureau in 2013 to alleviate traffic congestion and vehicle exhaust gas pollution problems.
Nevertheless, although energy consumption by goods vehicles drops rapidly over the past decades, the goods vehicles still consume 30% of the oil and coal products in 2014, followed by cars and motorcycles (27%) as well as bus and taxis (21%). Therefore, there is a large space to improve the energy transit from grey energy to green energy in the future. Replacing gasoline by LPG or electricity for small sized vehicles (taxis, private cars and motorcycles), and replacing diesel by biodiesel for generous sized vehicles (buses and goods vehicles) should be encouraged by the Government and the Transport Department. Changing the energy structure is the most effective way to eliminate pollutant emissions; however, it is usually done by energy legislation and regulation. In addition, fuel tax, road tunnel tolls and parking controls are also effective mandatory ways to reduce the number of private cars.
To stimulate environment sustainability, some voluntary policies are necessary. The government should encourage local people to choose public transportation for daily travelling. ‘Area Approach Bus Route Rationalisation’ plan by the Transport and Housing Bureau in 2013 presents a good example to attract passengers to choose bus for travelling. This plan has merged, changed or shortened some bus routes to meet passengers’ needs. However, this plan is implemented mainly in Kowloon and New Territories, so efforts should be made in the Hong Kong Island in the future. With more people choosing to use public vehicles and a higher usage rate of green energy, energy consumption could be reduced, and air pollution could be eliminated.
The share of energy consumption in industrial sector drops drastically by 19.1% and the per capita industry value added reduced by 11.3% in the past two decades. In accordance with the economic structure change in Hong Kong, the mandatory policies have been effectively implemented to address the pollutant emission problem by power plants over the past years although the total electricity demand has increased significantly. From year 1997, the coal-fired power plants have been prohibited, and gas-fired power has been encouraged afterwards. Currently, there exist some laws and regulations aiming to control the pollutant emissions from construction activities, power plants, manufacturing, etc. such as the Technical Memorandum for Allocation of Emission Allowances in Respect of Specified Licences issued by Hong Kong Environmental Protection Department.
Residential and commercial sectors
The residential and commercial sectors consume 92% of the total electricity, 65% of the total town gas and LPG in 2014. According to ‘Residential and commercial sectors’ section, space conditioning, cooking, hot water and lighting are the most energy-consuming items. The local people become wealthier and are more willing to pay for durable household appliances, which has stimulated the rising trend of per capita household expenditure added. 21 However, it happens when per capita income rises, the energy consumption in residential sector reversely decreases. Another study pointed out that it might be true in some countries under specific development stages, 28 that the occupants have higher energy conservation consciousness and the household appliances are more energy efficient. Nevertheless, it does not seem to happen in Hong Kong so far.
Although the government has enacted some energy conservation policies, the reactions by the users are pessimistic because most of those policies are voluntary instead of mandatory. For instance, the BEAM Plus scheme, which only requires public housing to fulfil the rating requirements, nevertheless is voluntary for private housings. More importantly, the standards and specifications in BEAM Plus regarding thermal performances of building envelopes and air-conditioning units are inexplicit and the criteria are described ambiguously and the expected outcomes are not well-defined. 46 Another example is a voluntary agreement target on shopping malls to adjust the air-conditioning thermostat to 25.5°C for energy saving, since usually the shopping malls in Hong Kong set up very low temperatures. 47 Their research reveals that the enterprises with higher compliance costs would prefer not to comply the energy saving agreement, and they would not be punished due to the voluntary nature.
Therefore, the voluntary energy conservation and energy efficiency policies are ineffective and could not draw public attention. It is suggested that mandatory regulations should play a dominant role, whereas voluntary agreements work as supplementary role, which would be more efficient to draw public attention and raise their consciousness about sustainability and environment protection. However, it is of necessity to implement the mandatory policies with caution. Although the Granger Causality test indicates that sectoral per capita value added Granger causes sectoral energy consumption, it does not mean that the energy conservation or energy efficiency policies would not negatively affect economic performance. It means that there might be negative influences but are able to be addressed or eliminated by suitable countermeasures. Therefore, this paper suggests that the mandatory policies need to be implemented under mutual compliances between the government and the enterprises, with a testing period to identify possible drawbacks, monitor the performance, and gradually adjust the standards and specifications to reach consensus by both parties.
Renewable energy policy
The utilization of renewable energy is limited in Hong Kong. Although Hong Kong has abundant renewable energy resources, the feasibilities of adopting those technologies are restricted. A study points out that 239,833 out of 309,606 buildings in Hong Kong are suitable for installing solar panels. The electricity generation potential by solar photovoltaic (PV) on building rooftops is estimated as 5.944 TW h annually, 48 which accounts for about 16% of total electricity consumption. 49 However, the application of PV panel is still a dilemma issue for Hong Kong, owing to the low average potential PV per building, the high upfront cost of solar PV system and the relatively low energy efficiency under real outdoor conditions. 50 Alternatively, solar water heating systems for domestic hot water usage, as well as for floor/wall/ceiling heating are becoming more popular due to higher efficiency and much lower cost, thus the wide application of solar water heating for residential and commercial sectors should be highly encouraged in the future.
As for the wind energy development, since offshore wind resources are very abundant in Hong Kong, some researches have investigated the potential offshore wind energy to evaluate the viability for Hong Kong to develop offshore wind farms. The investigation scope of Gao’s research was within Hong Kong’s marine boundary of around 360 km2, and the estimated wind power generation was 11 TW h, 51 which accounts for more than 30% of the annual electricity consumption in year 2011. Therefore, it is suggested that the Hong Kong Government should consider constructing offshore wind farms and developing offshore wind power in the future.
In addition, biomass is also feasible in Hong Kong since 400 km2 (accounts for 36% of Hong Kong’s total land area) of the land area is used for energy crop plantation, although the crop biomass only accounts for insignificant energy share (approximately 1%). 52 Other renewable resources such as tidal power, geothermal energy and hydropower are negligible regarding the contribution to energy demand, so would not be discussed in this paper.
Conclusion
The causal relationship between energy consumption and GDP in Hong Kong during period 1992–2015 from a sectoral prospective is investigated in this paper; the methodology employed consists of unit root test, cointegration test and Granger causality test. The results of the Granger causality test have indicative evidence to policy makers for energy policy decision making related to energy conservation policies, energy efficiency policies as well as GHG emission reduction policies.
The results indicate great differences among different sectors. Unidirectional causal relationships are found running from per capita household expenditure added to energy consumption in residential sector and from per capita commerce value added to energy consumption in commercial sector. This finding implies that energy conservation and energy efficiency policies aiming to residential sector and commercial sector would not significantly affect economic performance, and effort should be made to eliminate the negative effect. Currently, Hong Kong has enacted some voluntary energy conservation and energy efficiency policies, but they are ineffective. Therefore, voluntary agreements are proposed to work together with mandatory regulations, in order to draw more public attention and power. However, it should be noted that the mandatory regulations need to be made with caution. Although the Granger causality test indicates the causal relationship running from per capita GDP to energy consumption, it does not mean that the energy conservation policies would not affect GDP, it is because that the Granger causality test reflects statistical significance rather than real significance. Thus, the mandatory policies need to be implemented under mutual cooperation by the government and the specific body, to monitor the improvement or discrepancy by a conservation policy in a testing period, and gradually adjust to reach consensus. Unidirectional causal relationship is found running from industrial sector energy consumption to per capita industry value added, as well as from transportation sector energy consumption to per capita transport value added. Therefore, the emission reduction policies and change in fuel mix may impact the economic performance contributed by these two sectors. It is noted that changing the energy structure is the most effective way to eliminate polluted emissions. Furthermore, the wide application of renewable energy in Hong Kong is strongly recommended to be encouraged by government, especially for solar water/space heating system and wind power energy.
There are two suggestions for the future study. First, a longer period could be investigated in a panel data regression model integrated with other countries or districts similar to Hong Kong’s context, for instance, Singapore and Taiwan. Thus, a comparative study on the Granger causality direction and policy implications could be completed. Second, it is suggested that future studies should focus on investigating the Granger causality between segmental energy consumption and per capita GDP under four sectors. For instance, residential sector could be further divided into public housing, private housing, Housing Authority subsidized sale flats and other housing. Commercial sector could be further divided into restaurant segment, retail segment, office segment, education segment, human health segment, accommodation segment and others. Industrial sector is then separated into textile and wearing apparel, food and beverage, metal and machinery, non-manufacturing and others. Finally, transportation sector could be considered as the combination of freight segment, passenger segment and others. Followed by obtaining a more sophisticated and well-directed causality direction in a specific segment, it will be more helpful for expertise to stipulate energy and environmental policies in practice.
Footnotes
Declaration of conflicting interests
The authors declared no potential conflicts of interest with respect to the research, authorship, and/or publication of this article.
Funding
The authors received no financial support for the research, authorship, and/or publication of this article.