
Abstract
In this study, we defined new energy generation inputs as the installed capacity of solar energy, wind power, geothermal energy and biofuel production, and we defined electricity from new energy as an output indicator. Based on panel data in OECD and non-OECD countries from 2007 to 2016, we used stochastic frontier analysis to calculate the efficiency of new energy generation and analyzed the influencing factors. We found the following results: the efficiency of global new energy generation is improving; the energy price, technological progress and education level have positive impacts on the efficiency of new energy generation; and industrial structure and opening up have a negative impact on the efficiency of new energy generation. Based on our study results, we offer some recommendations to promote the development of new energy generation.
Introduction
In recent years, new energy generation (NEG) technologies and their applications in environmental protection and economics have attracted increasing attention. 1 Most countries have gradually assigned greater importance to NEG technologies related to the process of energy restructuring. Furthermore, to meet the energy requirements of sustainable social development and to prevent and mitigate serious environmental pollution and ecological damage caused by fossil fuels, it is necessary to choose new energy in order to achieve sustainable development.2,3 With the advantages of large reserves and low emissions, new energy is crucial to solving the problems of environmental pollution and the depletion of fossil fuels. 4 According to the Annual Development Report on Global New Energy (2016), the total global power generation capacity was 23,000 TWh in 2015, which was 27% higher than that in 2014. Furthermore, NEG was 18% higher in 2015 than in 2014, accounting for 7% of total global power generation capacity. 5 Wind, bioenergy, and solar power are, respectively, 50%, 29%, and 15% of global NEG, while geothermal and ocean energy account for 4% of NEG. Germany is the most successful country in terms of NEG, with its daily power generation of renewable energy reaching 78% of total daily power consumption. Specifically, approximately one-quarter of Germany’s power consumption at night comes from wind, bioenergy, hydropower, and other renewable resources. At present, 28% of electricity in Germany comes from renewable energy, which means that Germany is quickly making the structural transformation to a low-carbon economy. 6 Moreover, most countries have made efforts to achieve sustainable development by developing NEG.
However, the phenomenon of giving up wind and solar energy sources is currently threatening the development of NEG. Data show that the installed capacity of wind power in China in 2016 was 149 million Kw, accounting for 9% of the total installed power generation capacity. This utilization decreased by 16%, or 49 kWh, which means that its wastage was approximately 16 Mtce. In addition, China’s cumulative solar generating capacity was 66 billion kWh, but approximately 8 billion kWh of electricity was wasted since its utilization decreased by 12%. 7 Because wastage of solar and wind power sources decreases efficiency, it is worth examining the factors that affect NEG efficiency.
Technical efficiency can be used to assess the distance between actual output and maximum output, which reflects the potential to optimize utilization. In order to grow and survive, NEG companies must improve their technical efficiency. Therefore, a critical approach is to objectively assess technical efficiency and identify the key influencing factors. Two approaches are widely used to assess technical efficiency: data envelopment analysis (DEA) and stochastic frontier analysis (SFA). DEA is based on the hypothesis that all deviation frontier factors come from technical efficiency. In this method, measurement error and statistical noise are not considered. 8 To solve this problem, SFA introduces a random variable to represent statistical noise. In the SFA model, technical efficiency is reflected by the output, which is taken as a function of the non-negative random error, and the noise is reflected by the system random error. SFA can perform analyses based on the panel data and is more capable of examining relationships over time and space. 9
The existing literature focuses primarily on assessing NEG efficiency at the technological level.10–12 However, few studies have measured NEG efficiency from the perspective of economic impacts. Therefore, in this paper, SFA is applied to measure economic efficiency. Currently, installed capacity is expanding because of government support for financial investments in equipment and increases in the grid price. Here, we use the new energy input (installed capacity) and output (power generation) to calculate NEG efficiency at the economic level.
This paper makes the following contributions to the current research on this subject. First, the calculation of efficiency includes the economics of technology. Second, this study is based on input data from the new energy subsectors (solar, wind, geothermal, and bioenergy) in OECD and non-OECD countries between 2007 and 2016. Third, the factors influencing NEG efficiency are analyzed from a new perspective in this paper, and suggestions for improving the efficiency of new energy grid-connected power generation are proposed.
Literature review
Researching energy efficiency
Energy efficiency can be measured by DEA or SFA. Both approaches estimate an effective efficiency frontier and then measure efficiency as the relationship between the efficiency frontier and the inputs/output. The method that is most suitable depends on the specific research subject.
As a non-parametric mathematical programming method, DEA requires the researcher to obtain the sum of different outputs, and there is no opportunity for model misspecification. The DEA method is widely used in the study of energy efficiency and energy savings. In a previous study, Azadeh et al. 13 combined the DEA and principal component analysis (PCA) methods to study energy efficiency in energy-intensive sectors of OECD countries. Their results showed that fossil fuels have greater energy conservation potential than electricity. Examining energy efficiency in China based on provincial panel data, Shi et al. 14 found that excessive dependence on energy results in waste. Hernandez-Sancho et al. 15 examined the energy efficiency of the wastewater treatment industry in Spain and obtained a very low level of efficiency (only 10%), which was mainly caused by the size of the company and the quantity of organic matter removal. Furthermore, Olanrewaju et al. 16 estimated energy efficiency and predicted its value in 15 Canadian industries based on the index decomposition analysis (IDA), artificial neural network (ANN), and DEA methods. Toshiyuki and Mika 17 calculated the energy efficiency of Japanese power plants and found that the operating performance of these plants did not change between 2005 and 2009. Using a similar research method, Khoshnevisan et al. 18 assessed the energy utilization efficiency and CO2 reduction potential in the greenhouse cucumber industry in Iran. Using DEA and ANN to examine the transportation sector in China, Chang et al. 19 found that environmental efficiency was no more than 50% and that CO2 reduction potential ranged from 1.6 million tons (Qinghai Province) to 33 million tons (Shanghai and Guangdong Province).
With regard to SFA, many scholars have applied this method to measure efficiency since it considers stochastic noise. SFA is capable of measuring energy efficiency performance because of its discriminating power.20,21 In a prior study, Maria et al. 22 applied the Cobb-Douglas SFA to examine the energy efficiency of Spanish industries and found that the government must manage reductions in carbon emissions. Examining commercial buildings in Canada, Buck and Young 23 concluded that these buildings were energy efficient because of the ownership and economic activities that occurred in them. Moreover, Boyd 24 analyzed wet corn milling plants and concluded that SFA can eliminate the problem of defining energy intensity. Boyd et al. 25 also used SFA to measure energy efficiency in the US manufacturing sector at the company level. Furthermore, Shi et al. 26 applied the variance decomposition method to examine the effects of the main factors related to energy efficiency in China from 1980 to 2005; they concluded that the average contribution of total factor productivity was 36%, the capital–energy ratio was 45%, and the labor–energy ratio was 18%. Alfonso et al. 27 applied the SFA method to analyze the energy efficiency of the food and drink, textile, chemical and non-metallic mineral industries and found that every industry has the potential for 20% energy conservation. To evaluate the energy consumption and efficiency of the residential sector, Massimo and Lester 28 used data from 48 US states between 1995 and 2007 and concluded that the SFA model is capable of evaluating energy efficiency by controlling a series of economic variables. Lin and Yang 29 examined the thermal power industry in China based on the stochastic frontier production function, finding that the average energy efficiency was 0.85 between 2005 and 2010 and that the total energy conservation potential was 551 Mtce. In another study, Chen et al. 9 examined the effects of size, location, government ownership, and mixed sources of electricity generation on the efficiency of fossil fuel power plants in China from 1999 to 2011 and found substantial variation in efficiency among them. In addition, Katuwal et al. 8 applied the SFA method to assess the effectiveness of suppressing resource inputs to generate controlled fire lines that include large wildfires. They concluded that the use of bulldozers and fire engines generated a greater impact than the use of firefighter crews. Furthermore, their results showed that controlled fire lines may be more efficient when associated with natural or man-made breaks (such as rivers and roads) within the area where the wildfire previously occurred.
The efficiency of new energy and its influencing factors
The factors influencing NEG efficiency have not been consistently recognized by scholars. Because of the employment of different research methods, different factors influencing NEG efficiency have been identified by different scholars. Judging from the practical experiences of various countries, NEG efficiency is basically determined by factors such as energy price (EP), industrial structure (IS), technological level, opening up (OP), and education level (EDU). However, the influence of these factors varies greatly in different stages of development and in different economic conditions.30,31 In the following subsections, this paper summarizes the existing research results and reviews of NEG efficiency factors.
Energy price
EPs are considered by most scholars to be among the most important factors affecting NEG efficiency. The theoretical basis is that energy is a production factor. In a previous study, Yuan et al. 32 claimed that energy should never be regarded as a secondary factor of production; it should be used as the first input factor together with capital, labor, and technology. Moreover, Sorrell 33 argued that an increasing EP can improve energy efficiency. They noted that in a state of equilibrium, production factors including capital, labor, knowledge, and energy should have the same marginal output, so a rise in the price of one of these factors can probably result in factor substitution. Furthermore, Rashid and Kandemir 34 reported that rising EPs is one of the main factors that contributes to the reduction in energy intensity. Using the fuel and power purchasing index to reflect the total EP, Fang and Chen 35 analyzed the impacts of overall EPs and relative prices on overall energy intensity and classified energy intensity, respectively. Their results showed that increasing energy relative prices reduce the overall energy intensity of the manufacturing industry, but the cross-elasticity results of classified EPs for other energy efficiency vary. In general, most scholars believe that EPs might have an impact on energy efficiency.
Industrial structure
Su and Ang 36 observed that because of differences in input and output, IS has a significant impact on energy efficiency, and this impact can be measured quantitatively by factor analysis. In a study of energy efficiency in Taiwan, Huang and Wu 37 found that the efficiency of various major energy sources increases as a result of changes in IS. Their results showed that the Taiwan region is in the process of shifting from high energy-consuming industries to other regions and shrinking internally. In the process, the overall IS is gradually shifting toward the service industry. Zhang and Da 38 posited that improvement in the IS has significantly enhanced China’s energy efficiency, noting that it still has considerable potential for improvement compared with the energy efficiency in developed countries. Moreover, Ouyang and Lin 39 calculated the energy consumption elasticity coefficients of three industries in China and found that the energy consumption elasticity coefficient of the secondary industry is significantly higher than that of the primary and tertiary industries. Therefore, changes in the proportion of the secondary industry in the national economy can probably affect energy efficiency, which also applies to the primary and tertiary industries, but to a relatively small extent.
Technological progress
In a study of the impacts of technological improvement on energy efficiency, Alpanda and Peralta-Alva 40 found that the overall energy intensity and the power energy intensity of enterprises using advanced manufacturing technology were lower than those of enterprises that do not use the technology. Ouyang et al. 41 also noted that technological progress (TP) is an important factor influencing energy efficiency. Behind this TP, there are more in-depth factors, such as the construction of existing infrastructure, the level of technological development, the EDU of the labor force, and the level of related technologies. The direct driving force of these factors is government support and corporate R&D investment. Those authors posited that the analysis of how TP improves energy efficiency is similar to the analysis of the relationship between price and energy efficiency; both of them are achieved through factor substitution and changes in final output. In a further study, Bloch et al. 42 used national research expenditures to measure technological inputs for improving energy efficiency and reported that energy efficiency is highly correlated with technological improvement. Their results showed that technology has a significant impact on the improvement of energy efficiency.
OP
Analyzing China’s energy efficiency, Dan 43 found that the two open periods from 1949 to 1960 and from 1978 to the present have significantly higher levels of energy efficiency than is found for the closed period from 1961 to 1977. He analyzed the reasons from the perspective of the flow of factors and reported that factors for both outflows and inflows can probably increase energy efficiency. Outflows of factors might help ease the contradiction between energy supply and demand, coordinate input–output ratios and supply–demand relations, and achieve rapid economic growth, thereby improving energy efficiency. Inflows of factors involve the technical and managerial effects derived from foreign direct investment (FDI). Indeed, Elliott et al. 44 noted that FDI has strongly promoted China’s industrialization process and played a positive role in promoting technology transfer, management skills, and international marketing skills, thus positively impacting the energy efficiency of China’s manufacturing industry.
EDU
Human resources are the key motivational force for the development of the new energy industry, as rich human resources are the foundation for and a source of technical innovation. Development of the new energy industry requires the support of high-quality human resource reserves. The new energy industry is a strategically emerging technology-led industry in which technological human resources play a crucial role in promoting industrial development, knowledge diffusion, and technical innovation. Development of the new energy industry requires the support of high-quality human resource reserves. 45 In particular, high-tech talent, engineers, and professional and technological experts play a key role in new energy enterprises. This kind of human resource might bring considerable growth in corporate performance. Having a high proportion of technological staff can probably promote enterprise efficiency.
Methodology
Data sources and description
Data sources
Based on the selection of countries with more successful new energy development and data availability, 30 countries are considered in this study: Australia, Austria, Belgium, Canada, Denmark, Finland, France, Germany, Greece, Iceland, Ireland, Italy, Japan, South Korea, Mexico, the Netherlands, New Zealand, Norway, Poland, Portugal, Spain, Sweden, Turkey, the UK, the USA, China, Russia, India, Brazil and Indonesia. For countries that have not developed geothermal energy or biofuel production, the indicators for these sources are zero. On the one hand, new energy input is represented by installed capacity. This paper focuses on solar capacity, the installed capacity of wind energy and geothermal energy, and biofuel production. The raw data come from BP energy and the World Energy Database (2007–2016) of the EPS global statistical platform. On the other hand, NEG output can be represented by electricity generation. These data are from the World Bank and the World Economic Development Database (2007–2016) of the EPS global statistical platform.
The inefficient explanation of NEG efficiency
To be consistent with the approach taken in the literature, we selected EP, IS, TP, OP and EDU as the explanatory variables related to inefficiency in this paper. EP is indicated by the new energy purchasing price index, which was 100 in 2006. IS is indicated by the ratio of the total output value of the secondary industry to GDP. TP is indicated by the natural logarithm of new energy R&D expenditures. OP is expressed by the ratio of total exports to GDP. EDU is indicated by the ratio of skilled workers to people over the age of six. The descriptive statistics for the above variables are presented and sorted in Table 1.
Descriptive statistics of variables.
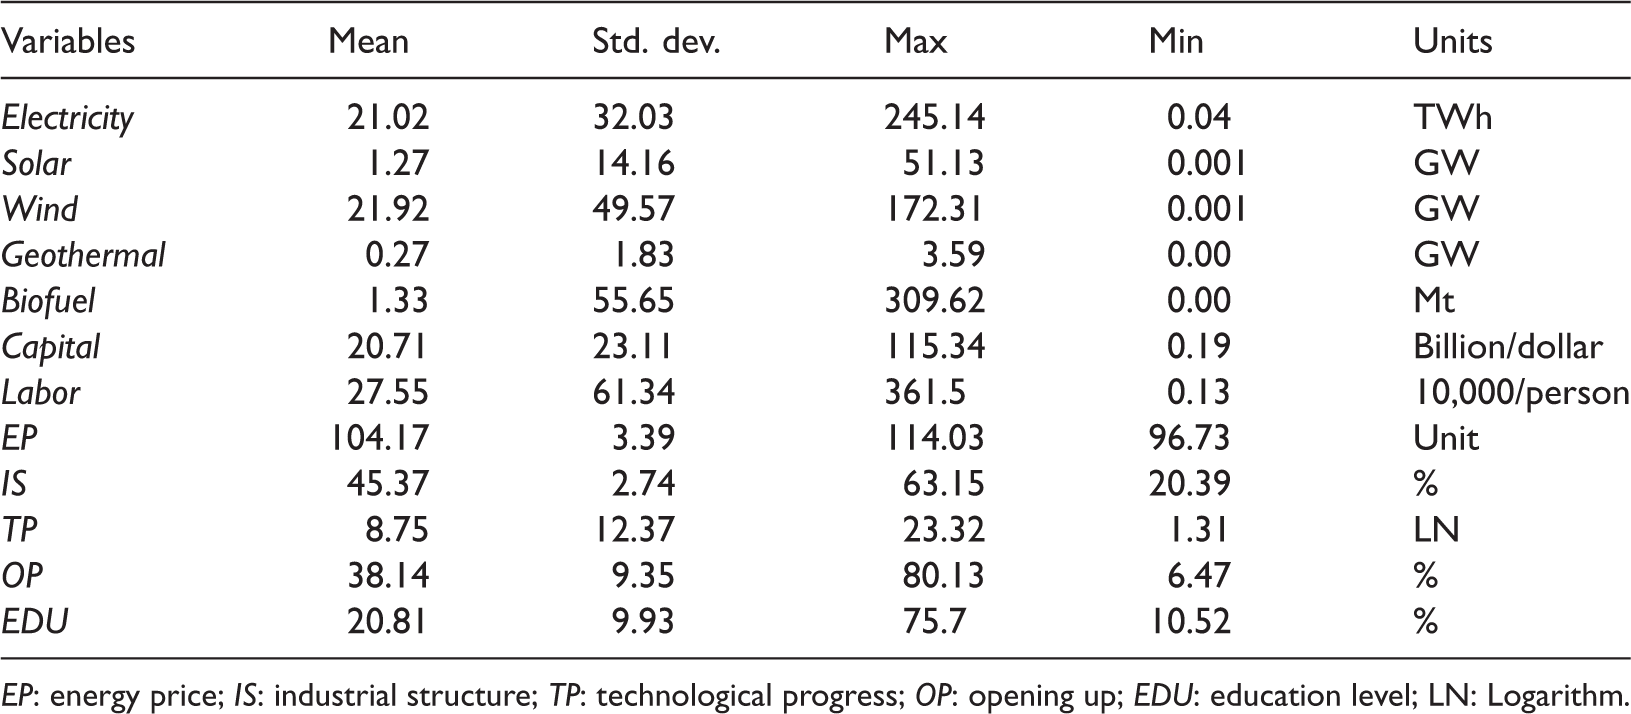
EP: energy price; IS: industrial structure; TP: technological progress; OP: opening up; EDU: education level; LN: Logarithm.
SFA
Our analysis estimates the production frontier (maximum output observed for given inputs) and then integrates the exogenous variables that affect performance or technical inefficiency.
46
In a stochastic frontier model, the error term has a one-sided component and a traditional random error. The one-sided component can measure the effects of technical inefficiency, and the traditional random error can determine the effects of measurement error. The production function is shown as follows

In the two-step approach, the first step estimates inefficiency without considering all exogenous influencing factors. The second step develops a regression of the inefficiency estimates against explanatory variables. However, if the variables in the production function and the variables in the inefficiency effect components are correlated, the estimates from the two-step approach are biased.46,47
The one-step approach used in this paper can estimate the relationships in the production process and the factors explaining inefficiency.
47
The inefficiency effects component of the frontier model includes the explanatory variables that affect technical inefficiency. Therefore, the inefficiency effects model is shown as follows


We then use the Cobb-Douglas functional form and the key predictor variables discussed above to develop the general model for NEG.8,48 Initial inputs include the installed capacity of solar, wind, geothermal, and biofuel. The basic production function is as follows


Equation (4) represents a stochastic frontier model for the inputs. We transform equation (4) into the following


In equation (7), E (·) is the conditional expectation and Effit is the energy input efficiency.
Results and empirical analysis
The results in Table 2 show correlations between electricity and EP, IS, TP, OP, and EDU. Therefore, the selection of non-efficiency variables in this paper is effective. The results in Table 3 show that the VIF values of the non-efficiency variables are much less than 10, indicating that there is no multicollinearity between variables.
Correlation analysis of variables.
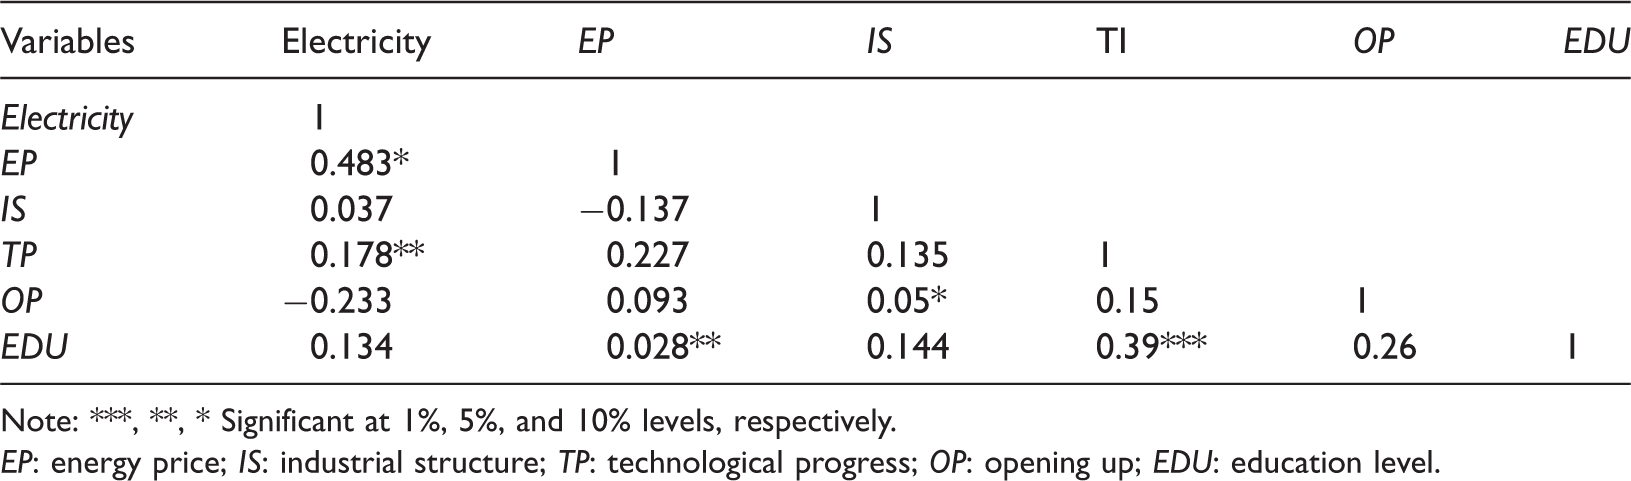
Note: ***, **, * Significant at 1%, 5%, and 10% levels, respectively.
EP: energy price; IS: industrial structure; TP: technological progress; OP: opening up; EDU: education level.
VIF test.
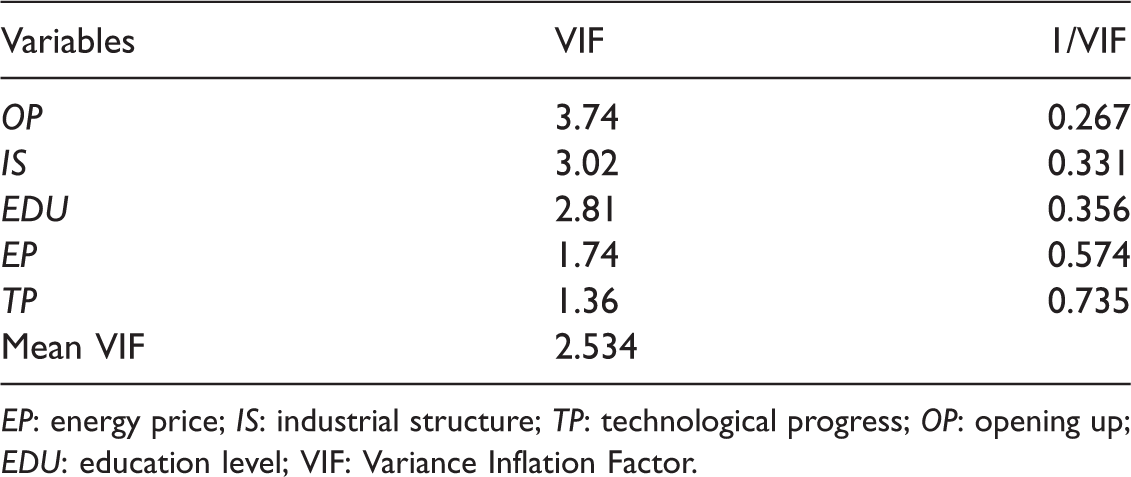
EP: energy price; IS: industrial structure; TP: technological progress; OP: opening up; EDU: education level; VIF: Variance Inflation Factor.
The results in Table 4 show that γ1 = −0.306, and the 10% significance test is passed, indicating a significant positive correlation between EP and NEG efficiency. At present, the global new EP continues to rise, which, to a certain extent, improves the production efficiency of new energy. However, γ1 passed only the 10% significance test because the non-marketization of the global new EP mechanism causes a malfunction in the transmission mechanism through which the new EP affects NEG efficiency. This kind of new energy pricing method that distorts the relationship between supply and demand can probably reduce energy efficiency, but it also means that once a reasonable pricing mechanism is established, new EPs might be an important factor likely to increase new energy efficiency.
Results of stochastic frontier models.

Note: ***, **, * Significant at 1%, 5%, and 10% levels, respectively. LR: Likelihood Ratio.
The results showed that γ2 = 0.059, and this passed the significance test at the 5% level, indicating a significant negative correlation between IS and NEG efficiency. With other factors unchanged, if the proportion of the secondary industry output value increases by one unit, the NEG efficiency will decrease by 0.059 units, which is the same as the findings of Wei and Shen. 49 The NEG efficiency improves because of the employment of more efficient techniques and improved technologies in the secondary industry.
The results also indicated that γ3 = −1.403, and this result passed the significance test at the 1% level, indicating a significant positive correlation between TP and NEG efficiency, which is consistent with most scholars’ conclusion that TP is a critical factor affecting NEG efficiency. The model shows that if the difference in TP among countries increases by one unit, the difference in energy efficiency would likely increase by 1.403 units. The elasticity is greater than 1. This result shows that during the 10 years between 2007 and 2016, the difference in TP between countries is the main reason for the difference in energy efficiency.
For the result γ4 = 0.911, it passed the significance test at the 5% level, indicating a negative correlation between OP and NEG efficiency. If the difference in the degree of OP decreases by one unit, the difference in NEG efficiency between countries will probably rise by 0.911 units. This is because the OP, on the one hand, can probably bring advanced technology and management concepts and increase production efficiency. However, given the differences in social economic development levels between countries, the scale and quality of foreign capital introduced from the outside are not the same, which leads to differences in the extent to which foreign investment improves NEG efficiency. Areas with a better investment environment can probably achieve a greater increase in energy efficiency, and areas with a worse investment environment can probably achieve only a slight increase, which results in a growing difference in energy efficiency between the two kinds of areas. On the other hand, due to the socioeconomic development and rising labor costs in developed countries, foreign countries have gradually transferred high-energy and high-pollution enterprises to developing countries and regions. At the same time, given the limitations of the geographical environment, economic strength, and technological levels, developing countries might focus solely on economic benefits but neglect environmental effects when introducing foreign business and capital. As a result, the difference in economic openness narrows, while the difference in energy efficiency widens.
The results showed that γ5 = –2.015, and this passed the significance test at the 5% level, which indicates that EDU is positively correlated with NEG efficiency. Thus, higher EDUs lead to higher technical efficiency. Therefore, education developments might promote the efficiency of the new energy industry.
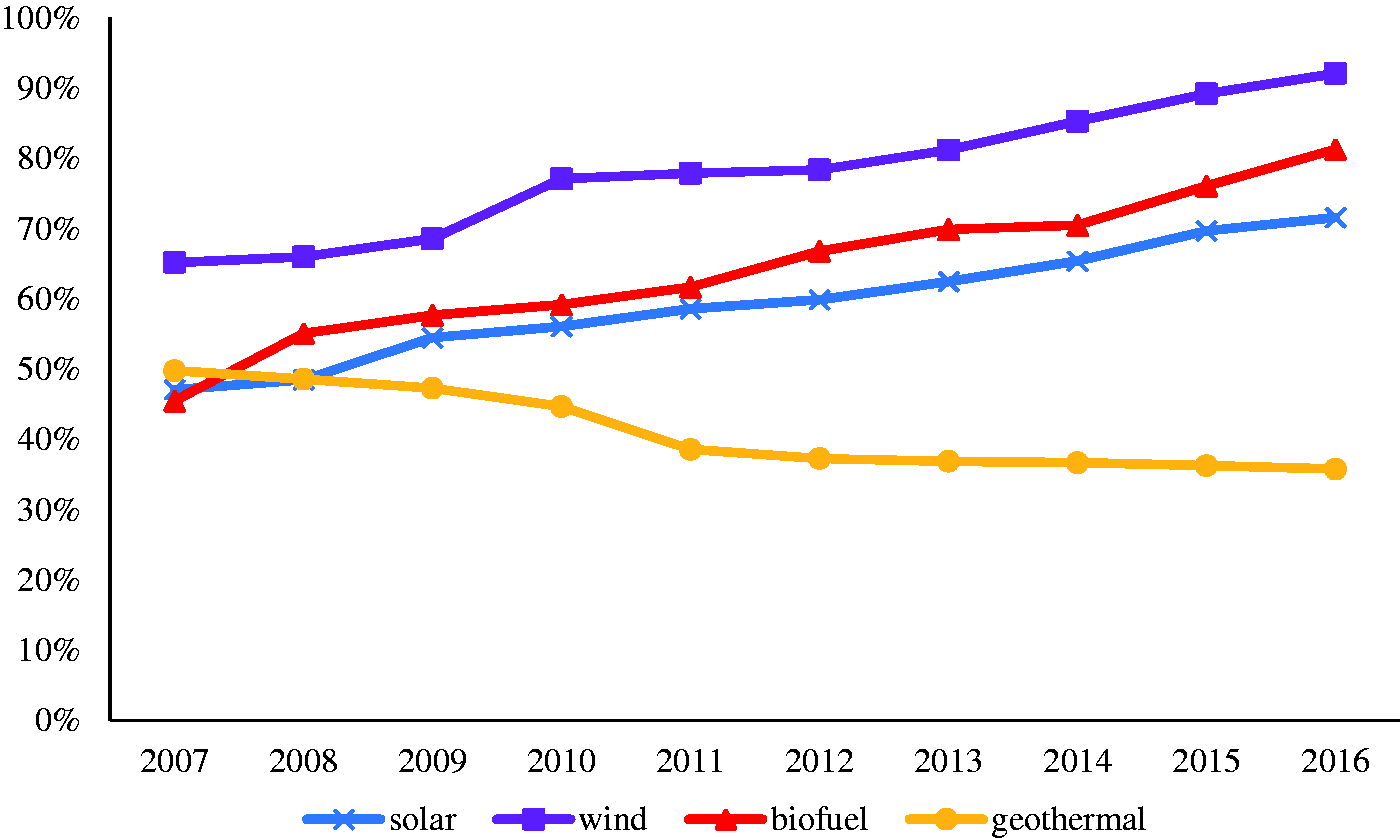
In Table 5, the average technical efficiencies of wind, biofuel, solar, and geothermal generation are 0.783, 0.644, 0.594, and 0.412, respectively. As shown in Figure 1, wind, biofuel, and solar generation efficiency have increased, while geothermal efficiency has decreased.
The average efficiency of four types of new energy generation (%).

The technical efficiency of four types of new energy generation.
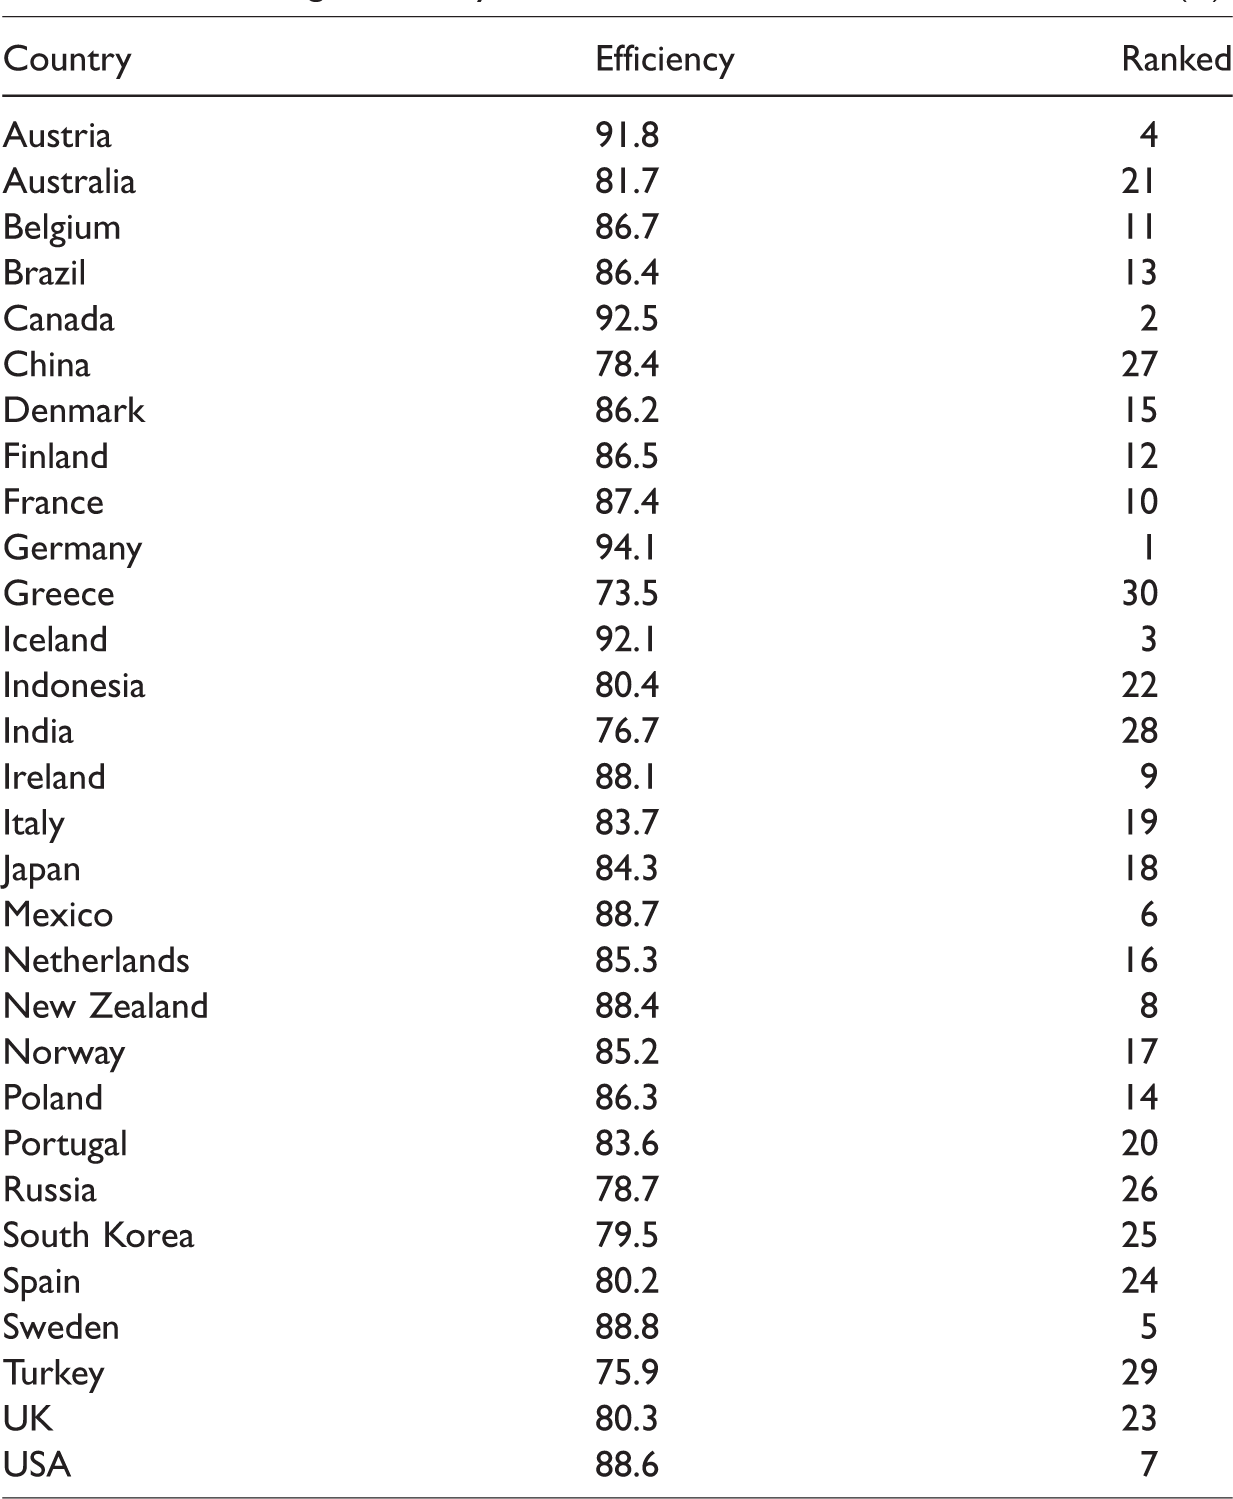
As shown in Table 6, Germany, Canada, and Iceland achieved the highest NEG efficiency, while Japan, Italy, the UK and Greece lagged behind as a result of their overreliance on imported energy and vague energy policies. The UK ranked 23th because it mainly used fossil fuels as its energy source, making it more difficult to achieve improved efficiency through NEG in the short term. Since 2011, NEG efficiency has been rising because of achievements in power generation and storage technology.
The average efficiency of NEG in 30 countries from 2007 to 2016 (%).
Conclusions and policy implications
Conclusions
Existing studies focus on maximizing power generation efficiency at the technical level, whereas we employ the SFA approach to measure the power generation efficiency of new energy at the economic level and analyze its influencing factors. After conducting a practical investigation, we obtained the following results. EP and TP could promote improved NEG efficiency, while IS and OP are negatively correlated with NEG efficiency. In addition, higher EDUs might lead to higher technical efficiency. Regarding the inefficient factors of technical efficiency, we propose the following suggestions.
Policy implications
We provide some suggestions to develop NEG from the perspectives of EPs, IS, TP, OP, and EDU as follows.
Improve the construction of the EP system
All countries and regions should gradually improve the construction of new EP systems, realize the marketization of new EPs, and allow new EPs to truly reflect changes in market supply and demand. Taxation of traditional energies and increases in the prices of some traditional energy should be introduced and promoted to adjust the energy demand. Moreover, there should be increased support for the use of renewable and clean energy sources, provision of convenient policies, and reduction in the demand for traditional energy.
Upgrade the IS of new energy
Optimizing and upgrading the IS might be the most direct and effective strategy for improving NEG efficiency. The IS can probably be reflected in the ratio of the secondary industry’s added value contribution to GDP. In general, the structural effect might be primarily affecting NEG efficiency. In other words, increasing the proportion of new energy-efficient industries in the economic system can probably improve overall NEG efficiency. Therefore, it is imperative to curb the excessive growth of high energy-consuming and high-emission industries in the secondary industry. In particular, countries and regions with low NEG efficiency should pay greater attention to optimizing and upgrading the IS.
Emphasize improvements in science and technology
Countries and regions should pay more attention to improvements in science and technology while making great efforts to develop their economies, increase investment in scientific and technological innovation, and improve the efficiency of various production factors. Advanced technologies should be adopted extensively, R&D related to industrial energy-saving equipment and technologies should be strengthened, and the transfer of knowledge from scientific research to production should be accelerated. Furthermore, science, education, and culture should be emphasized; the quality of workers should be improved; and the improvement and application of technologies should be promoted.
Strengthen communication and cooperation between countries
The flows of capital, technology, and talent between developed and underdeveloped countries/regions should be strengthened to achieve bilateral communication and cooperation. In this regard, efforts should be made to eliminate barriers to the flows of NEG efficiency factors between countries/regions, such that differences in NEG efficiency can probably be reversed. Countries with high NEG efficiency should be encouraged to cooperate with those with low NEG efficiency on new energy projects, and full attention should be given to the spillover effects of advanced energy technologies. In addition, the governments of developing countries/regions should optimize the investment environment and provide assurance of a favorable system for new energy cooperation.
Cultivate new energy professionals
The cultivation of technical personnel should be emphasized. The independent innovation capability of the new energy industry might ultimately be improved by depending on technical personnel, who are the leading force of technical innovation. For the cultivation of technical personnel, the first step is to retain employees through a reasonable, scientifically based salary system. Second, companies should provide necessary technical training and learning opportunities for employees, focus on the cultivation of high-tech professionals, and continuously expand the number of technical personnel for cutting-edge technological research and innovation. Such efforts can likely lay a foundation for the development of the entire new energy industry.
Footnotes
Declaration of conflicting interests
The authors declared no potential conflicts of interest with respect to the research, authorship, and/or publication of this article.
Funding
The authors disclosed receipt of the following financial support for the research, authorship, and/or publication of this article: This work was supported by Youth Project of Humanities and Social Sciences of Ministry of Education in China under Grant 18YJC630213, Joint of FDCT and NSFC under Grant 0037-2018-AFJ, Natural Science Foundation of Hunan Province under Grant 2019JJ50382, and Hunan Normal University Funds under Grant 2018BQ05.