
Abstract
With the world seeking ways to cope with climate change, the interest in and demand for electric vehicles are increasing as part of the efforts to resolve the issue of fine dust, especially in South Korea. The Korean government has consistently announced plans to promote electric vehicles as a means of transportation by providing benefits such as subsidies for electric vehicle purchase and expansion of charging infrastructure. Meanwhile, as electric vehicles continue to grow in number, the energy industry has become attentive to its role as a resource for power generation through vehicle to grid technology. This study analyzes electric vehicle consumer preferences using the discrete choice experiment (DCE) and found that there exists a clear nested structure in Korean consumers’ choice of vehicle. The study also estimates the amount of vehicle to grid electricity supply in the power market and calculates not only national but also individual economic benefit of electric vehicle owners participating in vehicle to grid services based on the estimated amount of electricity supplied. The results of scenario analysis indicate that the estimated electric vehicle supply in Korea will be about 560,000 units cumulatively and that the vehicle to grid electric vehicle power supply scale will reach 1.81 GW by 2030. The estimation shows that the economic benefit of vehicle to grid at the national power market level is 50.9 billion KRW per year, while the economic benefit at an individual level (per vehicle) is 104,151 KRW.
Introduction
As traditional vehicles using fossil fuels have been recognized as a significant cause of global environmental pollution, international efforts are consistently being made to commercialize and to spread the use of electric vehicles (EVs). The reason the world regards EV supply as a top priority is not simply due to a desired reduction in emissions pollution; batteries installed in EVs can also be used as eco-friendly power sources in the power market through vehicle to grid (V2G) technology and, thus, are attracting attention as another means to effectively respond to climate change. When the EV supply in the market is minimal, the impact of EV as a power source is insignificant. However, considering the policy goals of 30% and three million EV diffusion in the global and the South Korean automobile market, 1 which is the scope of empirical analysis in this study, respectively by 2030, the amount of electric power aggregated by EVs that can be returned to the power grid is expected to account for a considerable share in the electric power market. a
When a large-sized EV charges and discharges simultaneously to perform V2G, it can play a major role as an aggregated, flexible power source through load leveling and the provision of auxiliary services in the power system.2–7 V2G technology is also an effective means of expanding the EV market share by reducing the cost for EV owners. 8 The economic benefits of EVs as a power resource can catalyze the low-carbon transition of the transportation industry as well as the electricity industry. 9
The technical feasibility of V2G has already been proven and has reached a considerably advanced technological level. Furthermore, many studies are currently trying to empirically demonstrate the participation of V2G in the electric power market. 10 It has been proven that V2G is a practical means to ensure grid stability by discharging the stored electricity in a short time when needed, while providing economic benefits for the owners of EVs.11,12 In the case of the US, the V2G analysis which focused on PJM b has shown that profits can be generated by participating in the auxiliary service market. 13 In South Korea, a study conducted by Seoul National University (SNU) and Gwangju Institute of Science and Technology (GIST) has shown that national benefits were generated by a V2G pilot project through peak load reductions throughout the year in 2015. The study claimed that such benefits should be transferred back to the individual V2G providers. 14
This paper contributes to the literature by first, identifying the nested choice structure between the existing coal-fired fuel-powered vehicles and the environment-friendly vehicles based on the Korean consumers’ vehicle selection, and also by construing the recent trend of diesel sales decline as being offset by the increase in sales of gasoline vehicles (GVs) rather than EVs. 15 The switch from diesel to gasoline is evident in Europe as well. 16 The paper also forecasts the power supply capacity of V2G considering the operation and charging patterns of EV drivers in South Korea according to the time period. By doing so, it is revealed that the V2G technology is a resource that can be meaningfully considered in the establishment of a national energy plan as a decentralized and flexible power generation source in the power industry. Moreover, the economic benefits created by a domestic EV consumer as a power supplier using V2G technology are identified, which can later become the basis of compensation standards for incentives for an individual consumer’s participation in the power market. 17 This also strengthens the legitimacy of policy-driven investments that build V2G infrastructure by deriving the national economic benefits of V2G.
The paper proceeds as follows. In Literature review section, relevant prior studies are reviewed; in Methodology section, the data and model used for the analysis are explained; and in Results and discussion section, the analysis and simulation results are presented as well as the forecasts of the supply capacity of V2G. Subsequently, an economic evaluation of the V2G power is performed. Finally, Conclusion section summarizes the research and presents key findings and policy implications.
Literature review
Discrete choice experiments for EVs
Hidrue et al. 18 conducted a study using a stated preference discrete choice experiment with 3029 US consumers who were asked to select the most preferred vehicle among a gasoline vehicle and two versions of EVs. Using the latent class model, consumers were divided into an EV-friendly group and a GV-preference group, and their preferences for each attribute were accordingly estimated. Byun et al. 19 analyzed consumer preference for EVs and hydrogen fuel cell vehicles (HFVs), predicting the market share of eco-friendly vehicles by 2025 through simulation. The selection attributes were CO2 emissions, number of charging stations, charging time, vehicle maintenance cost, vehicle purchase cost, and vehicle type (gasoline, diesel, hydrogen, and electric). The market shares of the EVs and HFVs were estimated at 6.13% and 2.6%, respectively, under the scenarios of improving the infrastructure and reducing the eco-friendly vehicle purchase price based on aggressive incentives from the government. Moon et al. 20 analyzed the prevalence of EVs and charger types (fast or slow) using mixed logit analysis and estimated an increase in electricity consumption according to the demands of charging by time and season. According to their scenario analysis, the average daily power consumption was expected to be about 194–447 MWh. Ito et al. 21 calculated willingness to pay for EV infrastructures using the multinomial nested logit model. It was found that the infrastructure development of battery exchange stations can be efficient when the EV sales reach over 5.6%. Many studies have performed consumer preference analysis using the DCE and have assessed the impact of consumers’ EV selections on electricity consumption and carbon emissions reduction.18–22 However, such research do not explain the recent trend where diesel vehicles (DVs) are being replaced by gasoline vehicles rather than by EVs or HFVs, increasing carbon emissions. 23 In the early stage of EV diffusion, the objectives of the extant research have focused on the analysis of attractive attributes of the vehicles and the infrastructure. Within a decade, however, a huge electric car fleet is expected. 24 The research objective of this study embraces revealing consumer preference of green vehicles and identifying the environmental effects of those vehicles with regard to the impact on the national electricity market as an aggregated flexible power resource when EV has spread sufficiently.
V2G feasibility
Guille and Gross 3 provided a framework for battery vehicle (BV) V2G execution. Aggregated BVs can provide controllable loads and regulation service for load leveling (parked time), and thus to provide such services, the aggregator effectively defined the role of collecting the BVs and of performing energy trading with the independent system operator/regional transmission operator (ISO/RTO). The study of Parsons et al. 6 estimated consumer preference and selection probability for V2G EVs through a discrete choice experiment using the stated preference method. The selection attributes for V2G EVs included required time for charger connection and minimum driving distance. The premise of the contract between the EV consumer and the V2G aggregator was to provide the grid as a reserve power. According to the results of the study, if initial cash compensation is provided for the V2G service provision, V2G service will have a positive effect on the EV market share expansion. The concept of V2G was also established in the study by Kempton and Tomić, 5 where the expected returns and costs for reducing the peak load, providing operational reserve, and participating in the frequency adjustment market were calculated. The authors argued that V2G is not only an environmentally friendly concept, but it also reduces energy system costs and improves system reliability, providing a backup for renewable power at a low cost. Previous studies have mainly dealt with the roles and capabilities of V2G EVs in technical aspects, 22 whereas large-scale V2G fleets will soon be commercialized when the infrastructure is completed. 25 For EV to be used as a power source in the power market, predicting the potential power supply scale and economic value is critical. 26 In this regard, we need to analyze the available discharging time periods and the V2G electricity amount while considering the driving patterns of EV owners. Subsequently, the value of the V2G power resources can be properly calculated, and policy makers can apply this knowledge to national energy plans.
Methodology
The discrete choice experiment design
To measure public preferences related to EVs, a discrete choice experiment was conducted allowing respondents to repeatedly select the most preferred alternative among the given set of alternatives consisting of key attributes with varying levels.27–30 The survey was conducted online in South Korea by the specialized survey company, Gallup, from 26 to 27 December 2016. A total of 418 respondents ranging from ages 20 to 59 were asked to perform discrete choice experiments to determine their preferences for EV attributes and to respond to the preferred charging time period through a simple selection question. To ensure the representativeness of the sample, purposive quota-sampling was performed by setting the composition ratio of the age, sex, and the city of residence similar to the actual population composition.20,31,32 The discrete choice experiment used here is similar to that performed by Moon et al., 20 which referenced previous studies on the preference analysis of EVs using mixed logit model. (Refer to Appendix 1 for the characteristics of survey respondents and population.)
Table 1 shows the attributes and levels used in the discrete choice experiments. The first attribute of fuel cost is determined by considering the real average fuel cost in South Korea. 3 Vehicle price indicates the total cost of purchasing a car, including taxes and registration fees. The types of fuel the consumers choose from were gasoline, diesel, hybrid, and electric. As per convention, the vehicle body type was classified into SUV/RV, economy/subcompact, compact/midsize and full size. 20 Lastly, station accessibility refers to the average shortest distance a consumer must travel to charge an EV, as the study by Hong et al. 33 showed how this distance significantly influences the purchase of EVs.
Designed attributes and levels for discrete choice experiments.

Based on the combination of defined attributes and levels, the number of possible alternatives was 768. However, because presenting all alternatives to the respondents would be inefficient and unwieldy, we used the fractional factorial design method to choose 16 alternatives that guarantee orthogonality, divided into four choice sets that contain four alternatives. The respondents were asked to choose the most preferred alternatives from each choice set. Choice set examples are shown in Figure 1. In addition, respondents were asked to answer multiple questions to help identify their preferred EV charging time, where the charging time refers to the actual time needed to charge the car for the next ride (refer to Appendix 2). During this time, discharge for V2G is noted to be impossible.
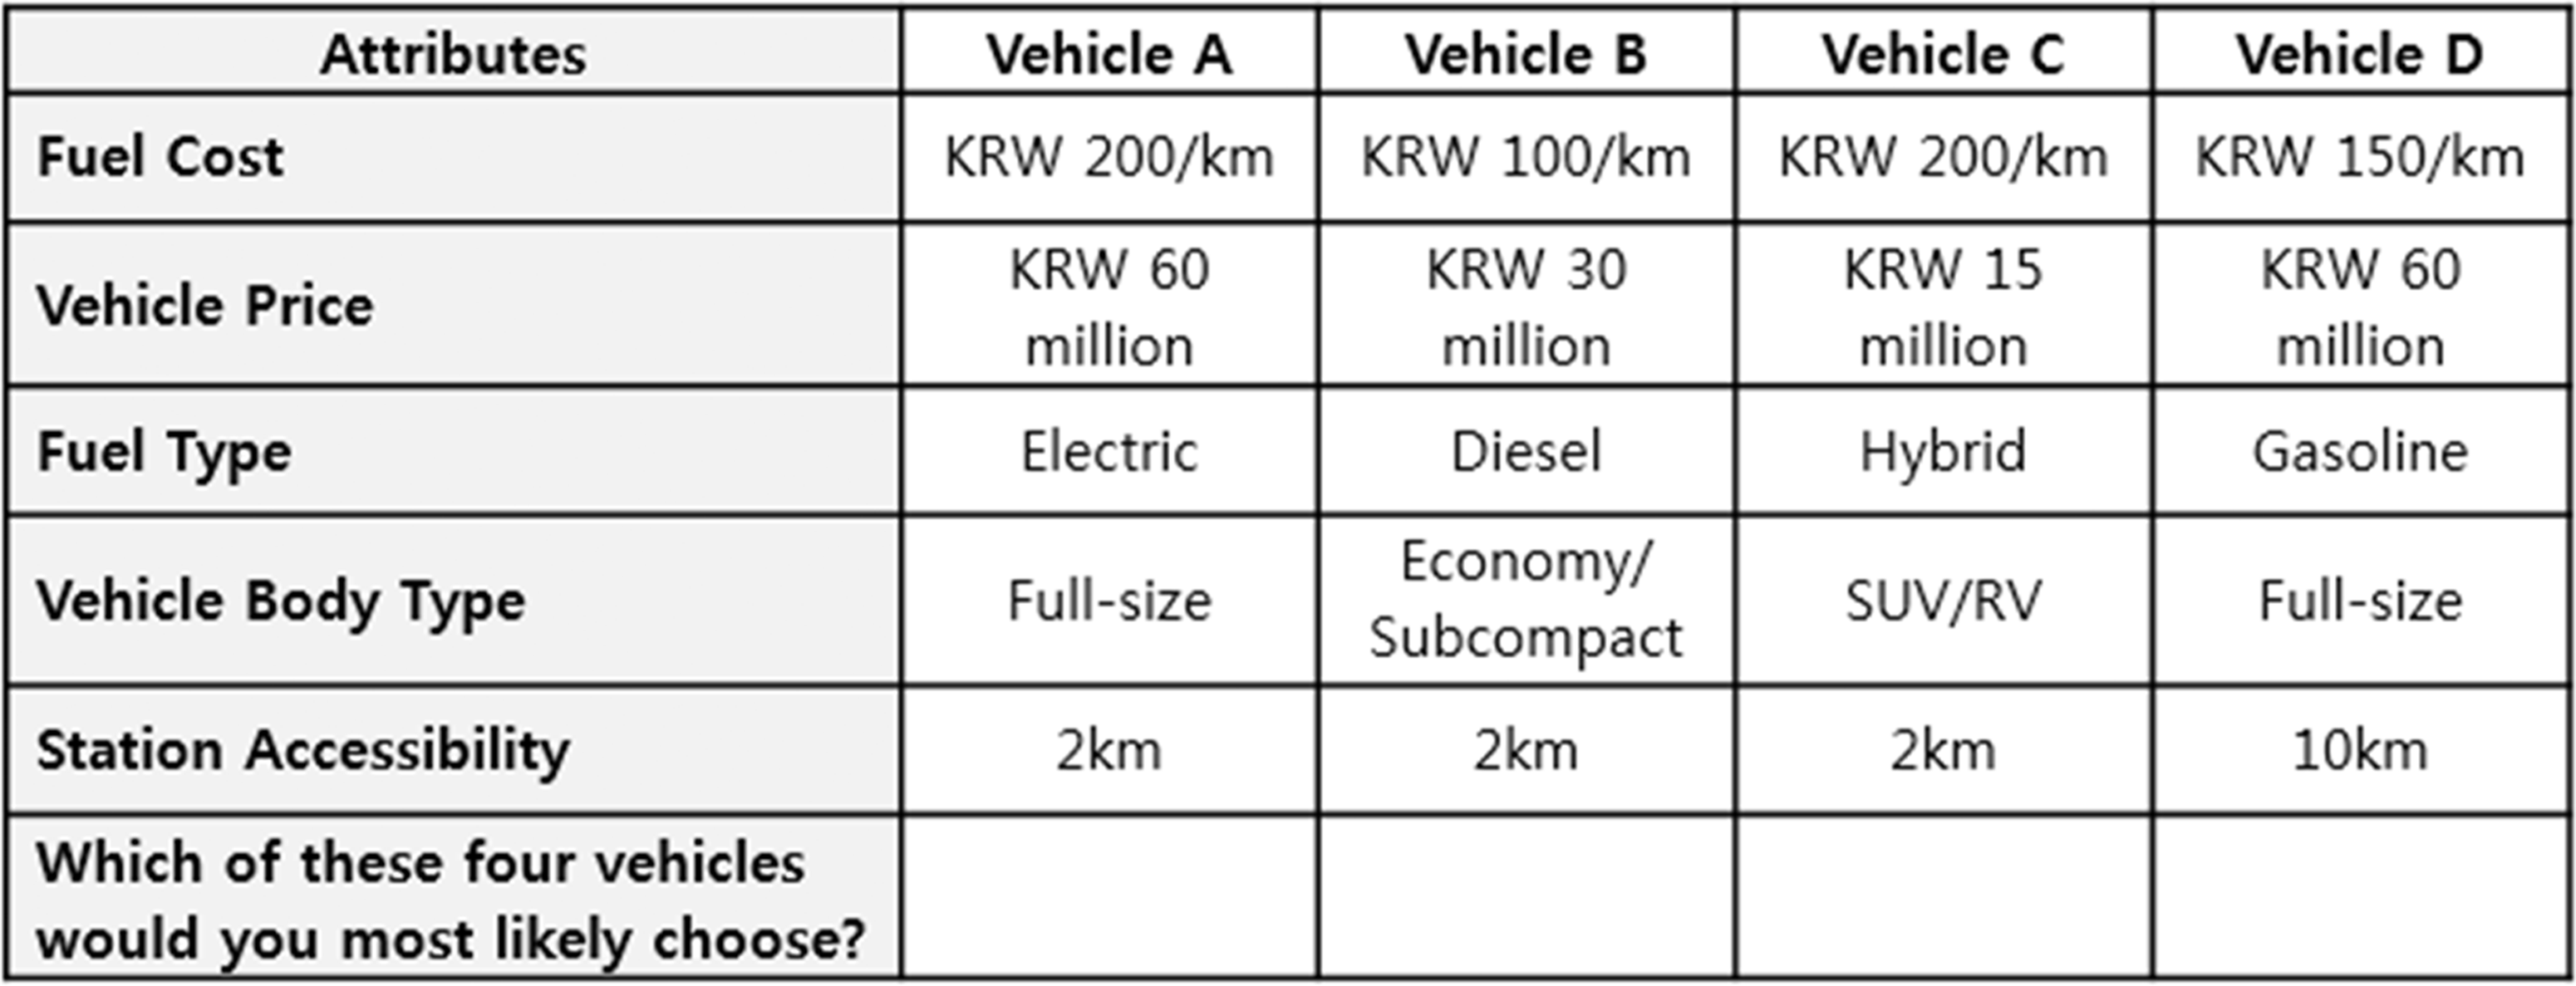
A sample of actual choice sets.
Nested logit model
While the standard logit model exhibits independence from irrelevant alternatives (IIA), assuming that the relative selection probability for one alternative is not affected by the existence of other alternatives, it is often seen as the limitation of the logit model. The basic assumptions of generalized extreme value (GEV) models are that the unobserved portions of utility for all alternatives are jointly distributed as a GEV, and amongst, the nested logit model relieves the strong IIA assumption underlying the multinomial and conditional logit models, enabling applicability to diverse empirical studies. The most widely used GEV models is a nested logit model.
34
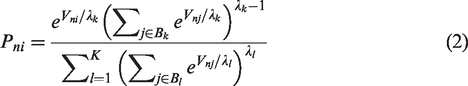
The nested logit model is basically an extension of the conditional logit model, assuming that it is possible to partition
The probability that person 

The alternative-specific constants (ASCs), which can capture the influence of non-observable factors, are incorporated to the nested logit model. In terms of forecasting, recalibration of the ASC through an iterative process is effective in reducing the gap between the real market share and the market share deduced from the estimation.
20
The new ASC 
Results and discussion
Model structure and estimation results
We established the vehicle choice structure of consumers as shown in Figure 2. As it can be seen, the nest was constructed based on the emission characteristics of fuel, with GV and DV grouped as conventional vehicles, and hybrid electric vehicle (HEV) and EV grouped as green vehicles.

Tree structure of the nested logit model.
The estimation results of the nested logit model based on the discrete choice experiment are shown in Table 2. The fuel cost, vehicle price, and station accessibility are set as continuous variables, with the fuel type and vehicle body type as dummy variables. We also defined four fuel type variables as ASCs.
Estimation results of the nested logit model.

***Significant at 99% level, **significant at 95% level; *significant at 90% level.
According to the estimation, the IV parameter
Moreover, consumers preferred vehicles with cheaper fuel costs and cheaper purchase prices, as expected; however, the station accessibility was shown to be insignificant. It was also revealed that consumers favored the SUV body type the most, followed by the full-size, midsize and subcompact. The results also show that the consumer preferred electric, hybrid, and diesel than gasoline.
Market share simulation
Following, Korean consumers’ EV choice probabilities were estimated according to the changes in the market environment scenarios through 2030 based on the nested logit estimates. For the first scenario, the fuel cost was based on data published by the Korea Energy Corporation, and it was assumed that there was no change in fuel cost until 2030. Regarding the vehicle cost, the price of KIA Soul in 2016 was used for gasoline, diesel, and EV. In the case of EV cars, Bloomberg New Energy Finance (BNEF) predicts that the EV purchase price will be lower than that of an internal combustion engine car in 2020–2030.36,37 The ownership cost of an EV is expected to match that of conventional vehicles in early 2022. 38 Considering the consistent decrease in battery prices, the price of an EV car is expected to fall to the level of diesel cars by 2022 and the level of gasoline cars by 2030, where the annual decline was applied to the logarithmic function estimates. Further, because the South Korean government publicly announced the goal of distributing 10,000 EV rapid chargers by 2022, it was assumed that in 2030, EV infrastructure would be expanded to the level of existing gas filling stations in terms of accessibility, with the number increasing annually in the form of the exponential function. 19 Table 3 summarizes scenarios established for 2022 and 2030. d,e, 20 The second scenario observes the impact of the diesel vehicle production regulation which is currently being widely discussed around the world, while keeping the assumptions of the first scenario, that is, the infrastructure improvement, the same. The current South Korean government has pledged to abolish diesel vehicles by 2030, and Norway has announced that it will ban the sales of diesel and gasoline vehicles after 2025. Volvo, the global automotive company, has announced the halt of diesel vehicle production from 2025. Thus, the scenario was designed to identify how the diesel vehicle regulation could impact the consumers’ choice of EVs assuming that diesel vehicles will not be produced after 2025.
Simulation scenarios.

EV: electric vehicle.
Based on the results of the scenario analysis with the estimated coefficients and the base values of 2016 as variables, the average EV selection probability was calculated as 24.7%. This result is highly overestimated compared to the 0.6% of the actual new EV sales rate of 2016 (fuel selection of vehicles in 2016: gasoline 31.6%, diesel 61.2%, hybrid 6.5%). The difference between the estimate and the actual value is due to barriers caused by attributes used in the questionnaires on actual EV sales, such as limitations of the EV models, underestimation of risk averse tendencies, and the possibility of the “yea-saying” effect.6,19 To reduce the difference between the estimated value and the actual market share, ASC recalibrations of EVs and HEVs were applied with values of −1.75 and −2.31, respectively.19,34 Table 4 shows the simulation results for the EV share of new vehicle sales after the recalibration and Figure 3 shows the forecasted cumulative EV sales according to the simulation result.
Simulation results of market share after recalibration.

EV: electric vehicle.

Cumulative EV sales forecast.
New vehicle sales volume is assumed to grow at an average annual growth rate of 2% each year based on the global new vehicle sales forecast. 39 The estimates of new EV sales by simulation were 22,000 units in 2017 and 44,000 units in 2018, which are similar to the actual sales of 25,000 units and 46,000 units, respectively, as announced by the Ministry of Environment in September 2018, validating the results of the scenario analysis.
The estimated market share of EVs is 2.35%, and accumulated sales of new EVs are expected to be 558,414 units in 2030 according to the Scenario 1 considering infrastructure improvement. According to the simulation results of Scenario 2, if new diesel production is banned after 2025, the proportion of EVs selected by domestic consumers is expected to reach 3.7%, and the accumulated sale of EVs is forecasted as 729,741 units in 2030.
It is also seen that 64% of diesel-selecting consumers (as of 2016) are to opt mostly for gasoline vehicles. This is due to the fact that there exists a clear correlation amongst alternatives based on the categorization of eco-friendliness of fuel as described in the nest structure. Therefore, the regulation restricting purchase of new diesel vehicles will not directly and dramatically lead to the spread of environmentally friendly vehicles. Considering the government’s goal of three million EV units by 2030, the forecasted market shares of EVs in the scenarios of this paper are too small. For the government to achieve its goal and to demonstrate the spread of green vehicles as a clear outcome measure, means such as taxes on burning fossil fuels and financial incentives for EV owners must be set forth in addition to diesel restrictions.
Prediction of the V2G electricity supply capacity
According to the expert analysis, V2G commercialization is expected after the year 2020. Likewise, we assumed a supply of 489,257 units and 660,584 units of V2G, respectively, from newly sold EVs from 2020 to 2030 from each scenario analysis. In addition, vehicles that can perform V2G by daily periods were defined as idle vehicles excluding the demand for required charging and traveling among all supplied V2G EV vehicles. Shoup 40 indicated that vehicles in the US were parked, on average, 95% of the time a day. Parsons et al. 6 considered such vehicles as V2G resources rather than as charging demand. The study by Kempton et al. 41 estimated the off-road EVs as 96% during peak hours using daily traffic data to derive EV demand for V2G. In this study, we used the data from the questionnaires to identify the demand for required charging times 9 (refer to Appendix 2), and similar to Kempton et al., 41 assumed that the vehicles required on the road during the period are idle, with the remaining EV vehicles performing V2G. Table 5 shows the results for the proportion of charging and traveling demand by time.
Demand for charging and traveling.

V2G is possible in conjunction with the proportion of the traffic as by periods (sectioned by 3 h), excluding the average daily driving hours set by summing the average percentage of traffic during 2013–2017.41,42 In conclusion, the proportion of vehicles that can supply V2G power in each time period is at least 74–85%.
For the EV battery capacity, 40 kWh as the market mainstream is used as forecasted by the Korea Electric Vehicle Association (KEVA). 43 The average daily power consumption of 6.27 kWh is calculated reflecting the average daily driving time of 1.16 h/day, the fuel efficiency of 6.3/kWh (Hyundai Ionic), 44 and the daily average mileage of 39.5 km/h. 45 To calculate the discharge power per hour, the discharge capacity of about 5 kW per EV is standardized based on the results of the empirical study conducted by the Korea Institute of Energy Research. f Based on the above assumptions, the state of charge (SOC) of EVs is 46.83% to 71.83% when discharged for 1, 2, or 3 h prior to the calculation of supply capacity. This V2G is possible because it does not exceed the appropriate SOC of EVs (see Table 6). g
Electric vehicle vehicle to grid (EV V2G) capacity calculation assumptions.

Of the newly distributed vehicles from 2020 to 2030 according to the presented scenarios, about 74% of the total V2G participation rate (minimum usage rate between 9:00 and 21:00) is available, while the potential supply capacity for V2G discharge is estimated as 1810 MW for scenario 1, and 2444 MW for scenario 2 with a 5 kW/unit scale. This is 5.43 GWh, and 7.33 GWh when discharged 3 h, respectively. We only consider basic assumptions about battery charging, but there will be a variation in the supplied amount of power by seasonal temperature. 46
Benefits of V2G power system and policy implications
The one of main advantages V2G brings to the power market is load leveling through bidirectional discharges (power supply) and charging (power consumption).47,48 The daily load leveling contributes to optimization of the power operation with EV being charged at night and discharging at peak time. This leads to the overall reduction in the power purchase cost by reducing the supply of generators with high fuel cost such as liquefied natural gas (LNG). Here, we consider the benefits of replacing LNG when estimating the load leveling benefit of EVs. Moreover, the benefits are calculated considering the environmental costs incurred due to an increase in the coal utilization rate during nonpeak hours.
Assuming the estimated V2G supply capacity of 1.81 GW and 2.44 GW respectively for Scenarios 1 and 2, and that it is each discharged for 3 h during peak time and charged for 3 h at based load time, V2G electricity of 5.48 GWh and 7.33 GWh are delivered to grid. Results of the economic benefit of the entire power market from load leveling, as well as the resulting daily benefit from one EV, are described in Table 7.
Electric vehicle (EV) benefits from load leveling for 3 h.

LNG: liquefied natural gas; EV: electric vehicle.
As V2G power provides load leveling, the domestic electric power market is expected to generate economic benefits of 51 billion KRW and 69 billion KRW per year in each scenario, while the per vehicle benefit is expected to be relatively low at 104,151 KRW per year; the smaller the individual revenue benefit from V2G, the lower the participation of EV owners in the V2G power market. However, we should focus on the huge national economic benefit from aggregated V2G power in the peak periods for the clean energy future. Therefore, the government should continue to support policies that build a market environment suitable for V2G power trading and that encourages individual participation.
Conclusion
In this study, consumer preference for EVs is analyzed, and the size of EV distribution in 2030 is predicted according to the infrastructure increase and vehicle price decline resulting from expansion of charging facilities, lowering of purchase cost, and regulatory scenarios of diesel vehicle production. Then, based on the predicted EV market size, the size of the power supply from V2G EVs, a market in the limelight, is predicted and its economic value assessed. Based on the current level of consumer preference, we estimate that the cumulative EV units sold will be about 560,000 with the assumptions of charging infrastructure expansion to the level of gas and the vehicle price being competitive Also, even if new diesel vehicle production are discontinued after 2025, the most diesel-preferred consumers will be transferred to gasoline vehicles, limiting the impact of EV diffusion in 2030 to significant extent. Although the market size is smaller than what the government target, the power supply through V2G technology with these vehicles is estimated to be about 1.81 GW and 2.44 GW for Scenarios 1 and 2, respectively. Considering that the installed capacity of the newly completed LNG combined thermoelectric power plant is about 900 MW, conservatively calculated V2G EVs are expected to make an impact in the power market at a supply scale corresponding to the 2–3 units of new LNG. Assuming 3-h discharge at peak time and 3-h charge at baseload time for the remaining EV vehicles, the economic benefit incorporating the necessitated charging and traffic demand as well as the decrease in fuel cost and increase in the environmental cost would be about 51–69 billion KRW per year. Yet, individual economic benefits are expected to be low at 104,151 KRW per year compared to national benefits. Therefore, it will be necessary to prepare policy alternatives that provide sufficient monetary incentive standards for V2G participation.
The limitations of this study are as follows. First, we analyzed the heterogeneous preferences of consumers at a specific point in time and the acceptance of vehicles, rather than over a longer period, when performing the DCE. In this regard, the scenario analysis considered attribute changes, such as the price of vehicle and increased accessibility of gas stations, rather than demographical changes among consumers. 49 Second, only four attributes were taken into account when designing choice alternatives to avoid respondents’ confusion. However, the selection of these attributes could cause omitted variable bias. 50 Third, in calculating the V2G EV capacity, only the average driving patterns and technical characteristics of the EVs were taken into account. Additional factors need to be considered such as the EV owner’s participation in the V2G electricity market and the impact of external temperature changes on battery efficiency. 46 Future studies considering these limitations will be conducted.
Footnotes
Declaration of conflicting interests
The authors declared no potential conflicts of interest with respect to the research, authorship, and/or publication of this article.
Funding
The authors received no financial support for the research, authorship, and/or publication of this article.