



Abstract
The present study discusses alternative ways of achieving optimum energy efficiency for historic buildings in areas where sustainable energy projects are planned. About 25% of Europe’s building stock was constructed before the mid-20th century and despite EU’s strenuous efforts for the protection and conservation of historic buildings and complexes, achieving energy efficiency with the minimum or preferably no intervention remains as a requirement. The settlement of Monemvasia, has been selected as our case study. A model building was chosen, its special characteristics are presented, and four solutions to the energy efficiency upgrade of the building were tested: (a) the application of internal insulation, (b) a heat pump installation, (c) the application of roof insulation, and (d) the replacement of the internal doorframes. The four scenarios were simulated via the TEE-KENAK software and the percentage of the annual energy saved through the application of each one of the mentioned measures was estimated. The results proved that installing a heat pump and internal insulation would maximise energy savings. Coupling the energy demand of the settlement in correlation with a wind energy project in the wider area, and the available curtailment was explored. The results showed that if 300 houses decide on acquiring their electricity consumption from the local wind independent power producer, at a price of EUR 35/MWh, the possible profit from the market could reach EUR100,000 per year. Such a business-driven concept could be extrapolated and evolve into a holistic wind energy and historic environment symbiosis setting.
Introduction
Approximately a quarter of all the existing buildings in Europe was built prior to the middle of the last century; in some European countries up to one-fifth of the housing stock was built before 1919. 1 All of those buildings were built before the introduction of energy efficiency standards in building regulations (1980), which means that they are significantly less energy efficient than their modern counterparts.
Historic homes provide a two-fold challenge: (a) the lack of information around the actual energy usage of historic homes and (b) the difficulties in choosing suitable energy saving measures to apply. Traditional energy performance modelling tools cannot accurately simulate the thermal properties of historic homes such as the large thermal mass. Whilst the European methodology for measuring energy performance is robust, many of the tools used to calculate energy performance for Energy Performance Certificates do not take into account the way historic buildings were designed and make inaccurate assumptions about the thermal properties of historic houses such as the U-value of building elements and airtightness. Therefore, there is evidence that energy performance calculation methodologies do not take into account how traditional buildings were designed – and in some cases, the results under-estimate the thermal performance of traditional dwellings. 2 This is important because such calculations are the basis for building energy assessment, legislation and policy, including the Energy Performance of Buildings Directive (2002/91/EC). 3 If this data is inaccurate, then there is a risk of installing measures in historic properties that are unnecessary to achieve these goals – or conversely, not installing enough improvements to achieve the results required.
Even if the calculations were accurate, the allowed interventions in the historic buildings – due to their historic character – are not enough to compensate for their energy-demanding nature. Energy efficiency interventions that are widely used in other types of housing are not always appropriate for historic housing, either due to aesthetic impact on buildings of cultural or historic significance, or because of other characteristics of the intervention, such as their water vapour resistance or other minimizing disturbance to the historic character, and materials. 4 The last one can affect the condition of the building fabric and structure and could have an impact on the longevity of the building and occupants’ health. 5
Housing providers find it difficult to make decisions about the optimum set of measures in order to refurbish historic buildings to acceptable levels of energy efficiency and indoor environmental comfort. Historic buildings’ compliance with introduced energy efficiency standards, such as Zero or Nearly Zero Energy Buildings, is an important issue, since tackling refurbishment of existing buildings, including historic buildings, has been seen as a top priority within EU countries.
About 9.8% of households in the European Union (EU) cannot afford to heat their homes adequately. 6 The impact on vulnerable households living in historic properties can be especially significant. Higher fuel bills may lead to more incidence of energy poverty; inhabitants of these buildings face a choice between spending a significant part of their income on energy, or reducing the use of heating, which may result in poor condition of the building structure and/or health impacts on the inhabitants. Historic housing, therefore, provides a challenge for housing managers. In many parts of Europe, a disproportionate number of the most vulnerable people live in historic buildings, and therefore social housing providers have a role, recognised by the European Parliament in its resolution of 11 June 2013, in promoting labour mobility; improving health and social well-being; stabilizing the economy; and combating energy poverty. 7 The same document (the resolution on social housing) advocates making priority investment in energy efficiency and renewable energy sources in social and affordable housing, and calls for the implementation of integrated cooperation models to promote the thermal renovation of social housing.
In the current study, the importance of upgrading the energy efficiency of the houses in the historic environment in a sustainable way was studied. The historically protected areas started feeling the pressure of improving the energy performance of their buildings, with all the restrictions of the allowable interventions (outside). Since wind and solar energy are growing it is about time to find a way to collaborate with such energy sources in the historic environment than being considered as unfitted by the local authority advisers and historic environment planners. The study proposes a method for how wind farms can sensitively and unobtrusively be incorporated – especially when such projects are planned under a safe distance.
The remaining of this paper includes five more sections; the literature review, the proposed method, the results and the analysis, the implications (and the symbiosis) plan, and the conclusions.
Literature review
For many areas in Europe, energy poverty is a fact. For instance, 27% of households in Scotland are in fuel poverty. This is primarily due to the increased fuel bills. Average energy prices have been increased by 37% between October 2010 and November 2013, while the average household income has been increased by only 4.4%. The same trend has also been followed over the last five years. Fuel poverty levels of the social housing sector are higher than the private sector, primarily due to the lower household income. Therefore, energy efficiency is a priority and the Scottish Government is introducing new minimum Energy Efficiency Standards for Social Housing. This will be particularly challenging for historic property owners of a significant amount of historic housings. Furthermore, a number of studies have shown that the assumptions in the software tools underestimate the thermal performance of construction components of historic homes. It has been proven that the thermal inertia of the building has been under- or overestimated.8–10
In Europe, more than 40% of the overall energy consumption and 36% of the overall CO2 emissions are produced by buildings. European policy regarding the environment is gradually becoming strict with the launch of a series of directives and legislation. In fact, Europe is leaning towards the reduction of the total energy demand and CO2 emissions, as a means of protecting the environment. The Directive 2010/31/EU states that the aim of the EU is a 20% reduction of the Union’s energy consumption by 2020. 11 Decision No 406/2009/EC of the European Parliament and of the Council of 23 April 2009 12 emphasises the effort the state members should make, by setting national binding targets for CO2 reduction, in order to conform with the EU greenhouse gas emissions reduction commitments by 2020.
On the other hand, only 1–1.5% of the European building stock is newly built each year. This translates to only around 1–3% energy savings per annum for the replacement of existing building stocks,13–17 while the most energy consumed is by existing buildings. New buildings take into account new standards and technology, which did not exist many decades (even centuries) ago when the buildings were built. For historic buildings, the energy situation is even worse. During the last decade, many governments and international organisations have put significant effort towards energy efficiency improvement in existing buildings. The EU recommends a two-step approach, i.e. the application of energy efficiency measures to a cost-optimal level and supply of the remaining energy needs through on-site renewable energy production. In 2010, the UK government made a significant commitment to upgrade the energy efficiency of 7 million British homes by 2020, aiming at reducing carbon emissions by 29%. 18 At the same time, the International Energy Agency has launched a set of Annex projects to promote energy efficiency of existing and historic buildings. 19 These efforts provided policy guidance, financial assistance and technical support for the implementation of energy efficiency measures in existing buildings. For example, the federal government of the United States has provided significant financial assistance to support existing building retrofits.20,21 In Australia, the Commercial Building Disclosure programme, which came into effect November 1 in 2010, requires the owners of Australia’s large commercial office buildings to provide energy efficiency information to potential buyers or lessees. 22 Such initiatives are on the right direction, but do not solve the long-lasting challenge of the high energy-related operational costs of historic buildings. Allowed retrofit-based interventions may not be enough when the primary materials used are of the previous century or similar.
As a result, of the aforementioned policies, ambitious energy standards and passive house energy standards have been set, both for new buildings as well as for major refurbishments. However, while those standards can easily adhere to new buildings, refurbishment projects require a greater effort. In refurbishment projects, a common practice that leads to high-energy savings and reduction of GHG emissions is the installation of facade systems. They improve the building’s envelope U-value, while minimizing thermal bridges improving the airtightness compared to on-site construction. Although energy efficiency of historic buildings can be drastically improved by exterior wall panel installation, such systems are not considered proper, since they can ruin the historic character of the buildings.
The available retrofit technologies can be categorised into supply-side management and demand-side management, while the human factors have a significant impact. The retrofit technologies for supply-side management include building’s electrical system retrofit and the use of renewable energy, such as solar hot water, solar photovoltaics, wind energy, geothermal energy, etc., as alternative energy supply systems to provide electricity and/or thermal energy for buildings. In the last five years, there has been an increasing interest in the use of renewable energy technologies (a) as on-site building retrofit solutions and (b) off-site, far from the building. The use of renewable energy technologies may bring more benefits where a utility rate structure includes time-of-use differentiated electricity prices and demand charge.
The retrofit technologies for demand side management consist of the strategies to reduce building’s heating and cooling demand, and the use of energy efficient lighting and equipment and low energy technologies. Heating and cooling demand can be reduced improving the building’s envelope properties by insulating it or replacing the existing windows, improving the air-tightness and lowering components’ thermal conductivity. Low energy technologies may include advanced control schemes for natural ventilation, shading and artificial lighting, heat recovery and thermal storage systems.
Such strategies were considered more appropriate for historic buildings. There is no or very little intervention in buildings that want to maintain their character and at the same time serve their purpose and secure the well-being of the residents without increasing the costs for them. Demand side management strategies in the historic environment coupled with renewable energy projects not far – respecting though the nature of historic settlements – could bring along a more sustainable way to deal with the challenge of the inefficient historic environment proposing a business-driven holistic approach. Therefore, the research question is; Can historic settlements and renewable energy projects live together? Are wind turbines compatible with historic towns and communities?
Method
The aim of the present study is to identify if the retrofit of historical buildings, combined with wind energy developments can lead to a sustainable symbiosis model. The historical settlement of Monemvasia is used as a case study. The alignment of the national policy with the European for Renewable Energy Sources deployment is examined and integration options are presented. After the analysis of the various retrofit scenarios, coupling the energy demand of the settlement with the available curtailment from the wind farm installed in the surrounding area is explored. The main question to be answered was whether curtailed power can be locally distributed or not. Figure 1 illustrates the followed method of the study.
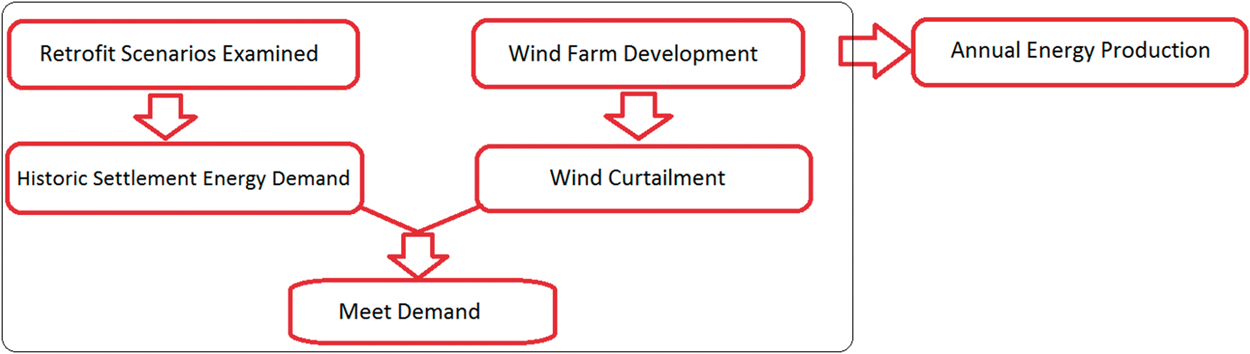
The flowchart of the methodology proposed.
At first, four alternative retrofit scenarios are tested. At the same time, the wind farm development proposed in this area is presented and a detailed statistical analysis of the under development project is done. The wind curtailment is estimated and various pricing scenarios are hypothesised to meet the energy demand, presenting a symbiotic approach of wind farms in historic environments in general, especially in wind “congested” areas.
The Monemvasia case study
As mentioned, a typical building of Monemvasia settlement has been selected as a case study. Figure 2 shows an aerial photo and a topographic map of the settlement, as well as a cross-sectional view and a 3D illustration of the selected building.
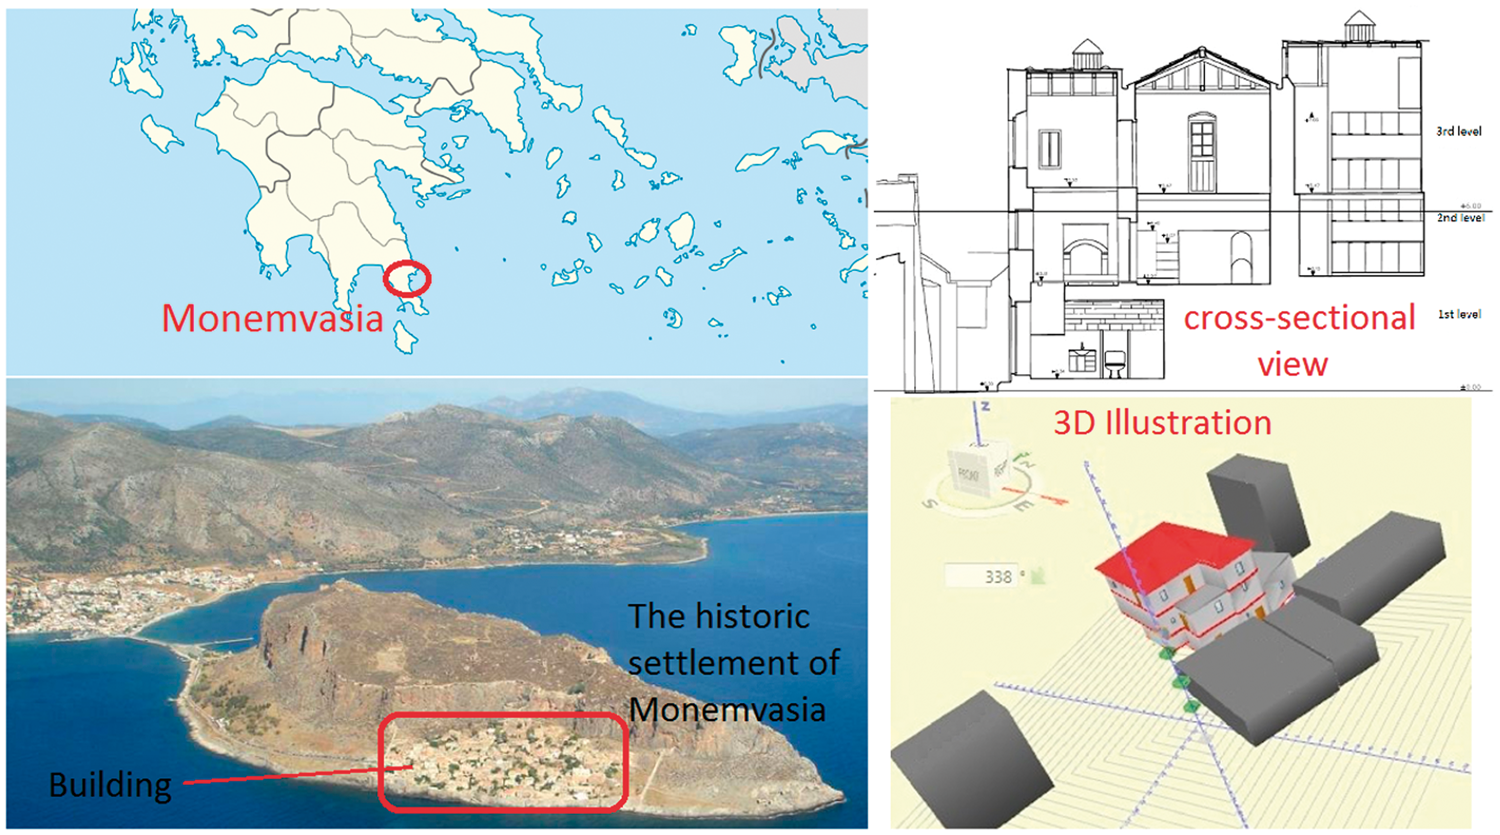
The Monemvasia location and settlement.
TEE-KENAK software tool (more information about the tool is provided in the APPENDIX) has been used to calculate the energy performance of the building. The indicator mostly used, in building simulations is the U-value, or else thermal transmittance (U), is used in the TEE-KENAK tool for assessing the resulting insulation based on the structure of the building, given by


Therefore for the whole building, taking into account all its walls and openings the U-value total (Utot) can be calculated using the following formula

The input parameters are the climate data, the desired indoor environment conditions, the thermal characteristics of the building shell, the building's heating, cooling and ventilation (HVAC) systems, the hot water heating systems, as well as any installed renewable energy supply technologies and power management systems. The heating efficiency (nheat) of the system can be calculated by


The estimated primary energy for heating is 188.1 kWh/m2, for cooling is 43.5 kWh/m2, for hot water is 32 kWh/m2. The calculated total primary energy is 263.6 kWh/m2 (taking into account that most primary energy – even for heating purposes – comes from electricity). The building was ranked into the H category (rated on the nine-grade scale from A+ to H), being at the lowest and less efficient category. Figure 3 presents the monthly energy balance, the heating and cooling demand of the baseline building (current situation). Energy requirements for humidification, hot water and lighting are also shown.
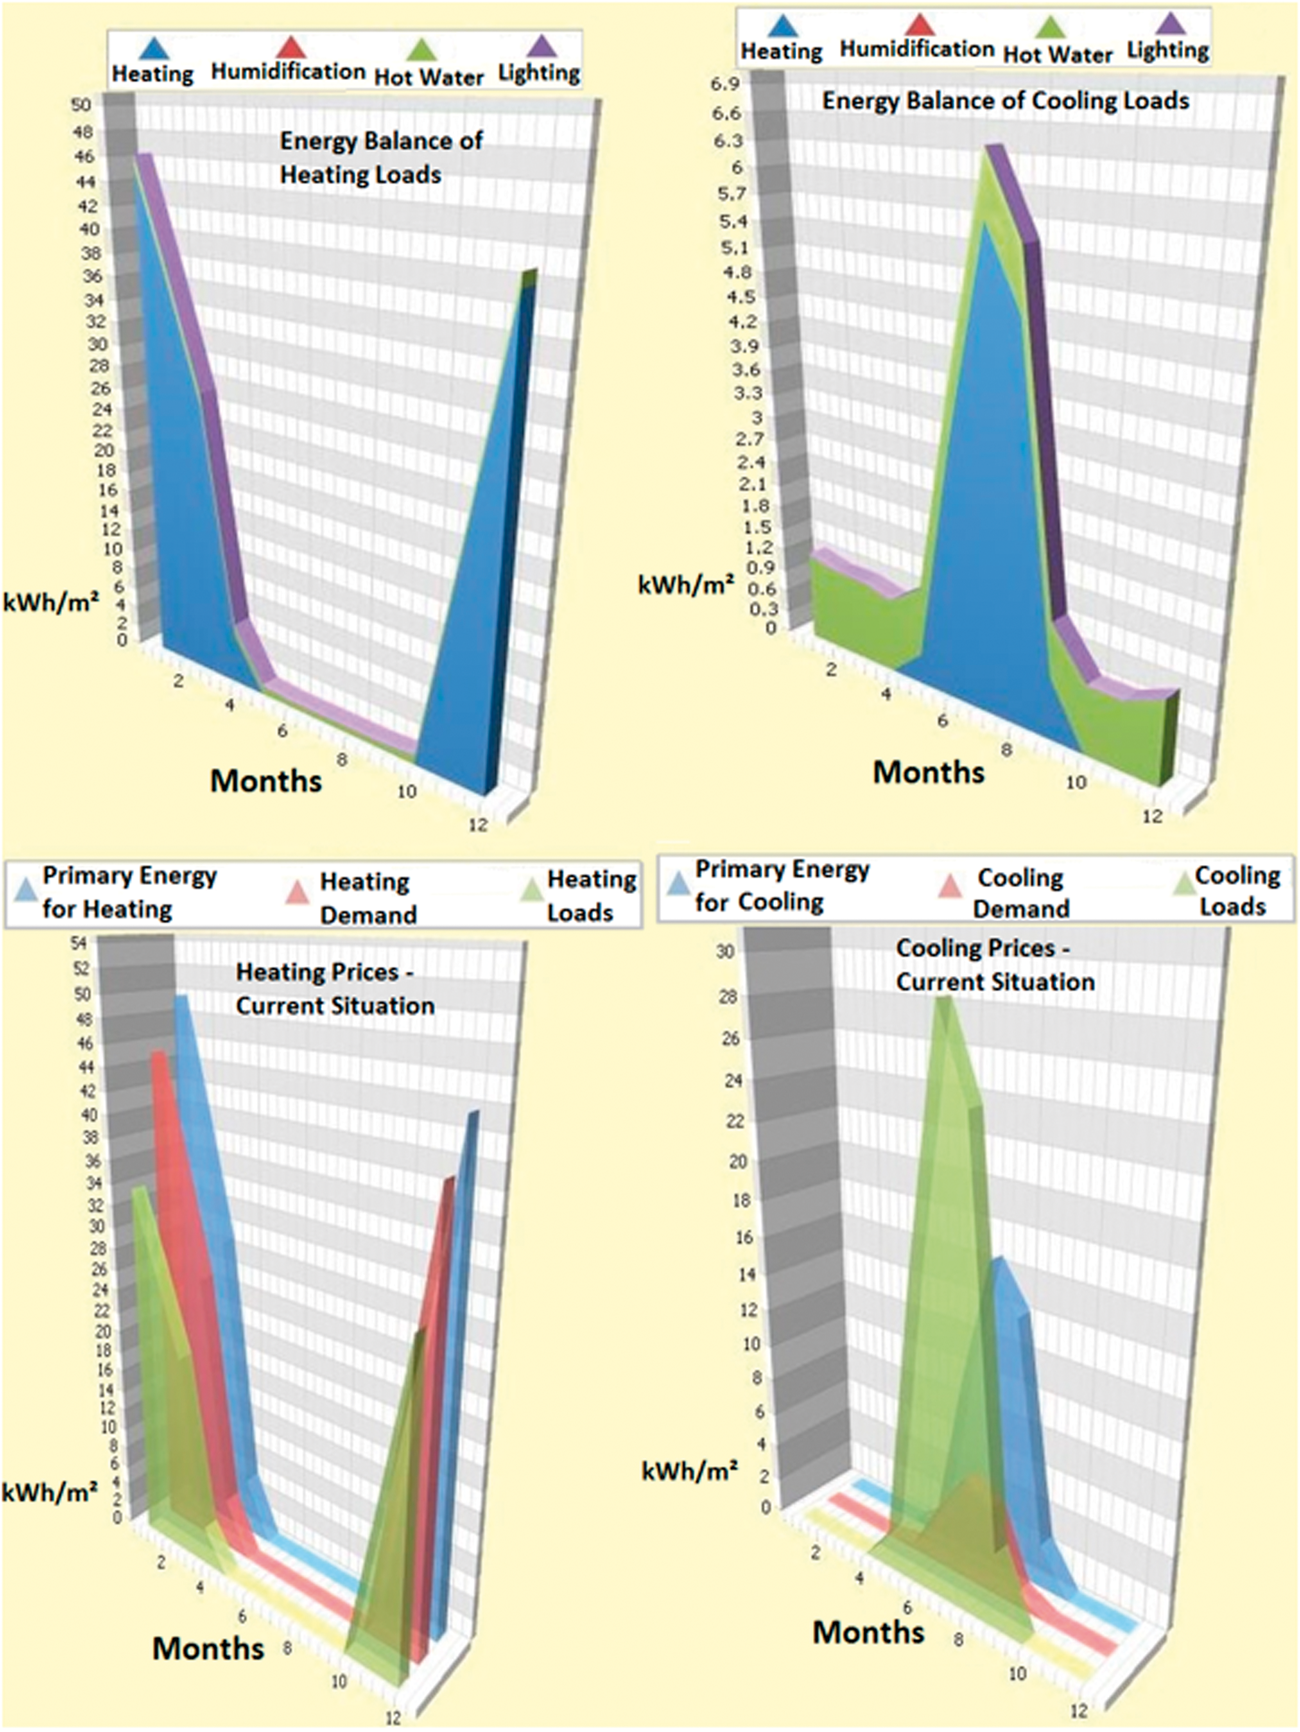
Monthly energy balance, heating and cooling demand of the baseline building.
Four alternative retrofit scenarios were simulated and the annual energy savings of each one is estimated. The examined scenarios are:
Scenario 1. Installing internal insulation Scenario 2. Heat pump installation Scenario 3. Roof insulation Scenario 4. Replacement of doorframes
Based on the four scenarios tested, the total benefit for the building was found. For each case, in practice, the energy savings (primary energy demand), and the CO2 reduction were estimated in order to decide on the preferred retrofit solution. Based on the results of the model building taken as a case in this work, an assumption was done in order to find out if a specific wind farm application could proceed into installation. Based on the needs of the buildings of the apartment – according to different scenarios – how much energy could be saved was investigated and the number of retrofitted houses/apartments (by coupling the energy demand of the whole settlement of Monemvasia) that could be supported. The historic settlement of Monemvasia is full of similar buildings and it was assumed (actually, it is known) that the specific case study is representative for most of the settlement’s buildings. The analysis was done based on the estimated to-be-curtailed power from a wind farm planned in the wider area.
Retrofit results
The total primary energy demand of the baseline building amounts to 263 kWh/m2 (reference B category building taken at 90.9 kWh/m2). Installing internal insulation (scenario 1) the primary energy consumption goes down to 156.6 kWh/m2, while installing a heat pump it decreases to 171.8 kWh/m2. By insulating the roof, the primary energy demand is 213.20 kWh/m2 and by replacement of the doorframes is calculated to 258 kWh/m2. The first two scenarios lead to more energy savings, approaching category B. According to Figure 4, scenario 4 is the preferable one in terms of primary energy demand. In terms of CO2 reduction, scenario 1 also demonstrates better results, making it the preferred retrofit solution.
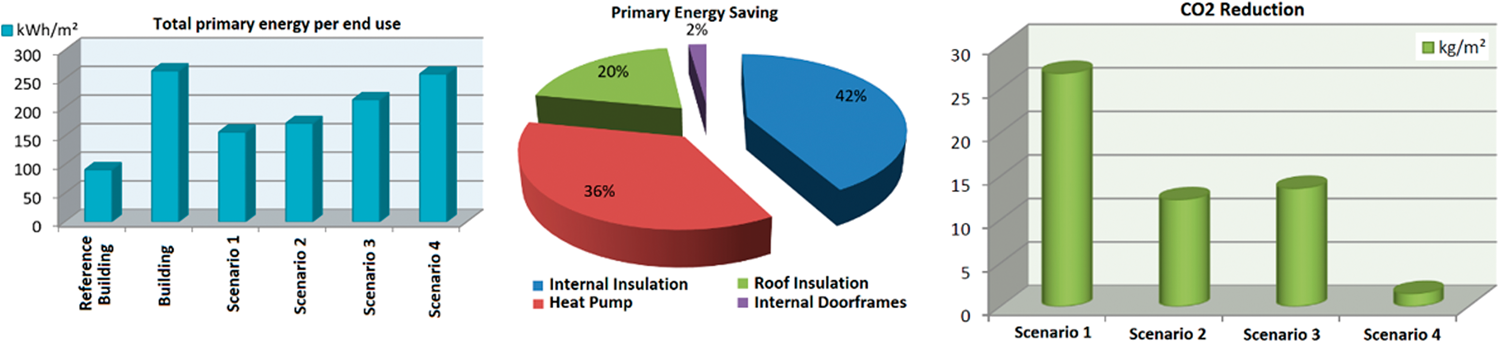
Total primary energy per scenario examined.
However, from a financial point of view, scenario 1 is not the optimal. The installation of a heat pump (scenario 2) has a payback period of 3 years only, which is half the payback period of scenario 1, according to Figure 5. Roof insulation (scenario 3) is also considered as a viable investment, although the primary energy demand results are not optimal. The payback period of scenario 4 is 46 years, a fact that turns it to a non-viable solution. Overall, scenarios 1 and 2 are preferable (with scenario 3 not so worse compared to scenario 1).
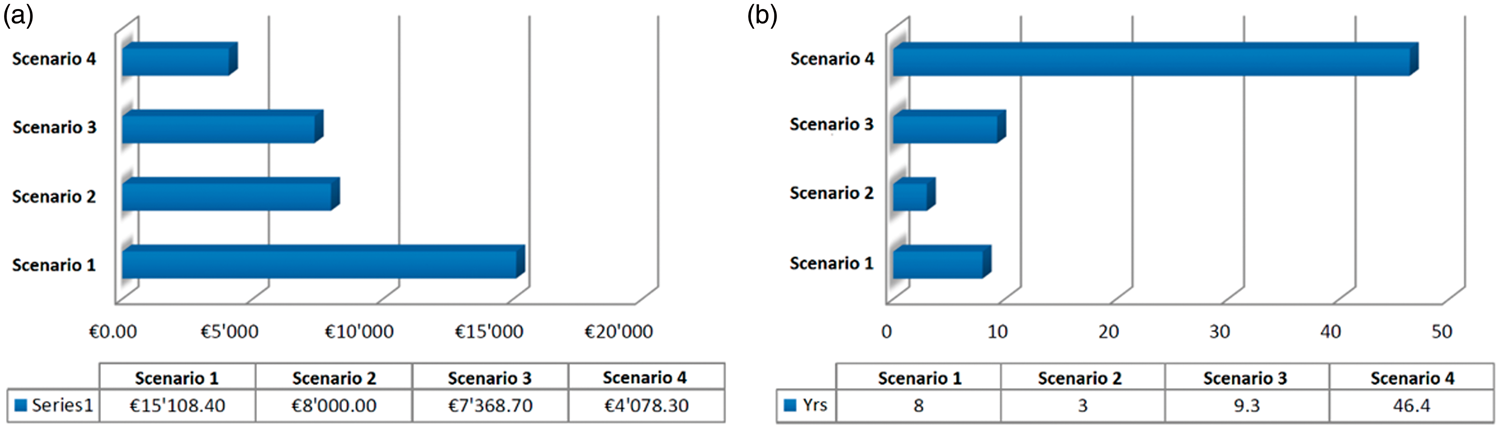
Scenarios’ initial cost and payback period comparison.
Results
A large number of renewable energy sources applications for the development of wind farms have been submitted for the surrounding area of Monemvasia. Being an area of high wind speed in the mainland of Greece has been characterised as a priority area. Due to those characteristics, the number of applications for this area is way greater than for other areas in the Peloponnese (area with wind energy projects applications marked inside a red circle in Figure 6).

The area under investigation and Greek wind priority areas.
The interconnection of the Peloponnese to the main energy demand centres of the country, such as Athens, is weak. Only the last decade, the Peloponnese interconnection was enhanced with new transmission lines. Consequently, when wind production exceeds significant limits, due to congestion, curtailment seems like one of the cheapest solutions. That results in negative prices and energy wasted. In general, curtailments and down-regulation shall continue to occur, as wind energy projects continue to occupy more space in the energy mix (worldwide, not only in this case study). This puts wind energy investments under pressure to the extent that investors and stakeholders are reluctant to invest further in the field.
Fan et al. 23 have presented that in China, as the wind projects increase, the effected curtailment is between 3 and 8%. Only five years ago, the curtailment even surpassed 20% (actually reached almost 25%) in key provinces. Only seven years ago, in 2012, the average curtailment in China reached 26%. 24 The numbers are decreasing, however, the percentage remains to 8–10%. 25 In other countries such as the UK the curtailment percentage is expected to reach almost 4.8%. 26 In Italy and Spain, as well as in many other countries, the curtailment share is laying low, around or even below 2%. However, in a number of western countries where electricity grids are already mature, it is observed that the more the renewables share increase in the energy mix, the higher the curtailment level is. 27 A number of researchers have tried to solve the problem either with energy storage solutions28–30 or via demand response programmes.31–34 Could curtailed energy be stored and delivered to the historic settlement? Moreover, if so, under which circumstances? Is the proposed venture financially viable for the investor and the end-user?
In order to identify the high wind speed sites that are close to Monemvasia settlement from the list of investors’ applications, all environmental-related constraints such as distance from the settlement, other villages, streets, lakes and rivers need to be considered. For that purpose, a Geographic Information Systems (GIS) tool, such as QGIS, has been applied. In addition, the tools WindRose, the Wind Atlas Analysis and Application Program (WAsP) were used for the assessment of the wind on the west side of Monemvasia settlement.
Annual wind measurements were collected under Vector Hellenic Windfarms S.A. lab’s supervision – according to international standards – using a tubular 10 m mast. A data logger was used to store and transmit all information to the certified lab via a subscriber identification module card. Based on the statistical analysis of the yearly wind measurements with data acquired from the installed mast, the mean wind speed was found to be 7.8 m/s. The uncertainty of the wind speed based on the yearly available data was calculated 0.117 m/s, while the max gust recorded is 46 m/s and the max 10-min mean wind velocity is 31.6 m/s. The average turbulence intensity (at 10 m/s) was calculated at 11.3%. The main wind directions are shown in Table 1, where the best sectors in energy contain and in time distribution are shown. Figure 7 shows the Preliminary Wind Farm sitting of the under development proposed project, the wind directions and the average wind speed variations.
Best sectors in energy and time distribution.

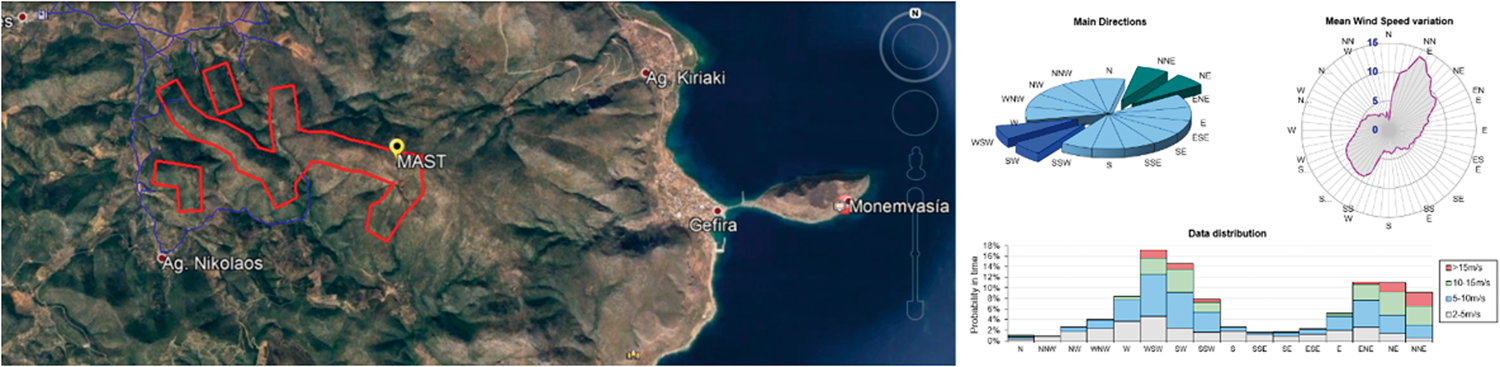
Preliminary wind farm polygon (red) and road constructions (blue) (left) and main wind directions and wind speed variation (right).
Since the terrain is complex in the area, both WindFarm and WAsP tools were used to identify the final sitting of the wind farm. Different roughness levels (grey thick contours, Figure 8) were considered. Figure 8 shows the proposed location of the wind farm. Considering a typical 2.0 MW wind turbine and taking into account the technical availability losses of 5%, the grid connectivity losses of 2%, and some air density losses (at 350 m average height, which is the above sea level of the wider area) around 3% – based on the calculation of losses in mountainous/hilly sites, 35 the total energy output of the 50 MW project was found 139,214 MWh per year.

Final wind farm layout.
Implications
The city of Monemvasia, including Gefyra and Ag. Kyriaki settlements have a local population of approx. 1500 inhabitants. Based on aerial photos, the number of houses is approximately 600. If it is assumed that the annual energy consumption of a 100 m2 house is 10 MWh/a, 36 the total energy demand for the 600 houses of is estimated to be 6000 MWh. However, based on the calculation of the energy demand of the low-performing case study building, which is commonly accepted as a historical buildings, 37 the annual energy demand is 26.36 MWh/a. For the total 600 houses, the annual energy demand is 15,816 MWh/a. Once more, the two preferable scenarios, both from the environmental and financial point of view, are scenarios 1 (internal insulation) and 2 (heat pump installation).
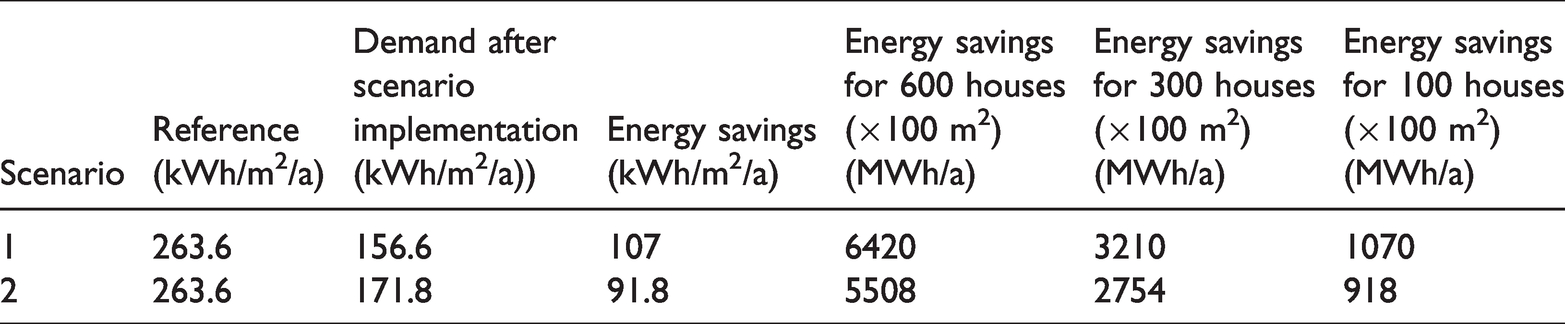
Table 2 presents the energy savings in the selected scenarios 1 and 2 compared to the reference kWh/m2/a. In terms of payback period scenario 3 is not so different compared to scenario 1 (Figure 5), but scenario 4 was the worst of all and therefore excluded. Based on the calculations on energy savings, 107 kWh/m2/a could be saved in case of scenario 1 and 91.8 kWh/m2/a in case of scenario 2 implementation. Therefore, depending on the number of houses that the measure will be implemented, the total energy savings can be between 918 and 6420 MWh/a (Table 2).
Scenario analysis of mass retrofit in Monemvasia settlement.
The total energy output of the proposed wind farm is calculated to be 139,214 MWh/a. Although high shares of wind curtailment (8–10%) is acceptable, in our study we will assume that the curtailment is lower, approximately 2%. That equals to 2784.28 MWh/a. Based on the clean energy transition of the white paper of renewables in the wholesale market of the Clean Energy for All Europeans 38 there will not be any compensation offered to wind farm owners for the annual grid protection driven curtailed power, according to balancing market rules. Therefore, under normal circumstances, all grid required curtailed wind power will be wasted.
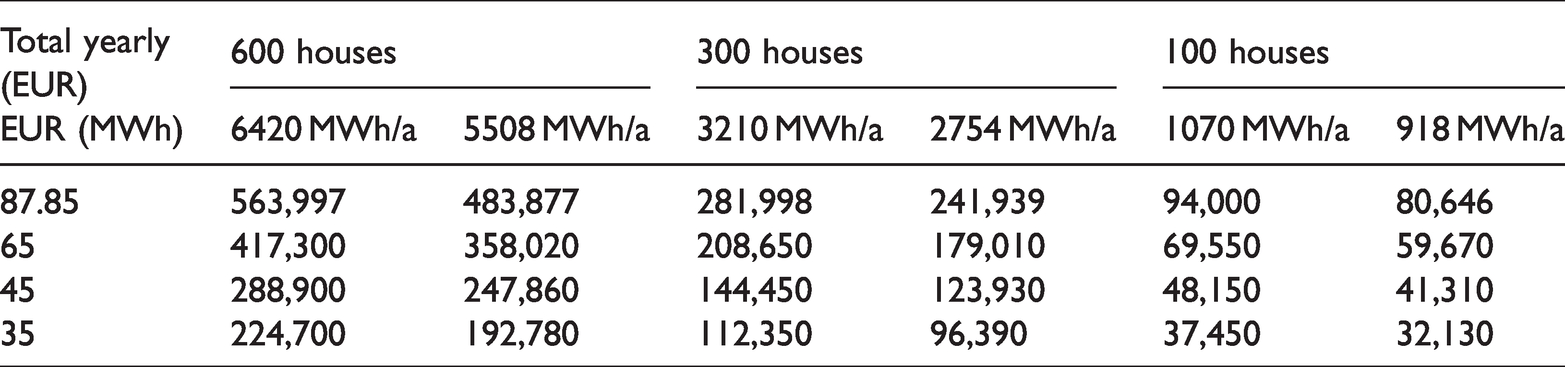
In Greece, until recently the Feed-in-Tariff (FiT) scheme was in action. According to that scheme, the investor was guaranteed to earning 87.85 EUR per produced MWh. However, after 2012, due to the implementation of the “Target Model” (which has been put into force recently – November 2020), there is a dynamic entry of foreign investors in the Greek renewable energy market. Based on the results of the “Regulatory Authority for Energy's” the first competitions for new renewable energy projects offered more competitive prices for both wind (22.7% below the launch price) and solar (20% lower) energy production. For the wind power projects tender, the lowest offer received was EUR 68.18 per MW with a starting price of EUR 90, securing a wind farm project of 44.6 MW. 39 Different earnings scenarios were examined, such as the FiT scheme (EUR 87.85/MWh) and three more with 65, 45, and 35 EUR/MWh in accordance to the integration of the Target Model in the country (November 2020), facilitating the electricity market in EU. The probable earnings variation is shown in Table 3 in the cases of 100, 300, and 600 houses based on the offered curtailed electricity.
Possible profit from the market depending on the EUR/MWh price.
In Greece, the average electricity price for household consumers (taxes included) for 2018 was EUR 0.1866/kWh. 40 Therefore, this is what the energy supplier would charge the customers all around the country. The profit from storing the curtailed energy to large scale battery systems 41 and sell it to 600, 300, and 100 houses if different electricity prices were offered is calculated and presented in Table 4. In such a way the “to-be-curtailed” electricity cannot be wasted.
Possible profits from storing and selling the curtailed electricity at lower electricity prices.
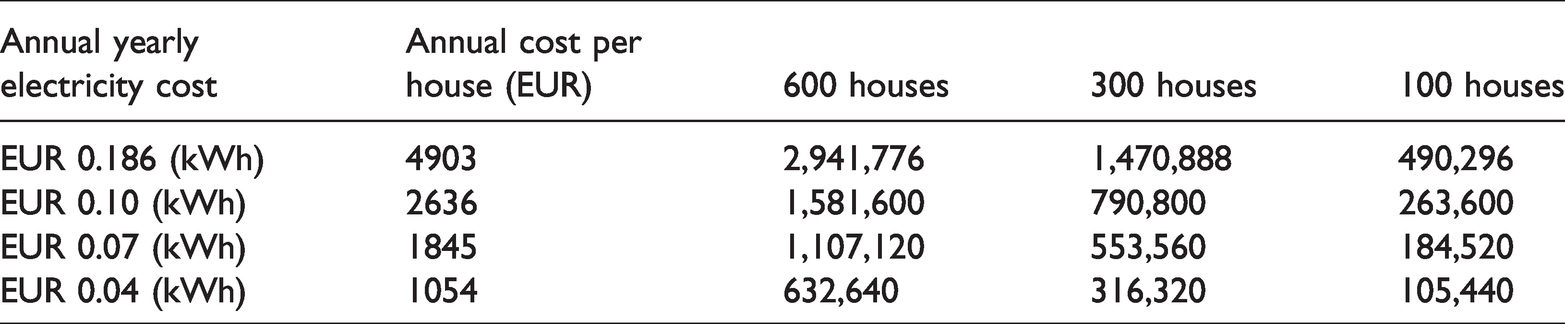
It is estimated that even if the electricity price was offered to the end-users at one-quarter of the electricity price of 2018 (EUR 0.04/kWh which is the electricity price in Ukraine and the cheapest in Europe 40 ) the total profit would be more than the amount that would have been received if there was no curtailment and this 2% was sold to the market at the FiT price. That means that, in areas of high curtailment rates, it would be beneficial for the wind farm investor to install a battery support system and supply the excess energy locally. For such a large project as the one studied (of 50 MW), the profit could be approximately EUR 60,000,000. An investment of a large scale battery system that costs around 3–4 MEUR 41 would have a very short payback period, especially in the case of serving and selling the curtailed wind power to the local community.
Conclusions
After the end of the monopolistic energy companies’ era, now even residential users (and not only large enterprises and businesses) were able to choose which electricity producer to purchase their electricity from based on various price schemes. Since the continuation of wind and solar energy investment is growing, areas historically protected started feeling this pressure, but so far, were not touched. Via this work, a symbiosis model was proposed in an area of historic interest, focusing on the number of retrofitted houses/apartments based on coupling the energy demand of the whole settlement of Monemvasia in correlation with the expected curtailed power from a wind energy project planned in the wider area. Since it has agreed that there will be no compensation to wind farm owners for the power curtailed, the scenarios, presented in this study, focused on how to deliver these amounts of energy in a profitable way for the wind power producers and at the same time offer a competitive electricity price to the historic settlement. It was found that if 300 houses decide to move on, on acquiring their energy from the local wind producer, at an offered price of EUR35/MWh (which is the lowest offered from the scenarios), the possible profit from the market could have been at approximately EUR100,000 per year. This could be generalised and such a business-oriented approach (as in this case) could eventually develop a symbiosis framework, based on each area’s needs ensuring sustainable development of renewable energy sources. Therefore, it is a win–win set-up, since it is not only the investor that is going to have a profit out of such a symbiotic relationship (using some of the amounts of energy that were supposed to-be-curtailed), it is also the end-user who is going to receive much more competitive prices.
Footnotes
Declaration of conflicting interests
The author(s) declared no potential conflicts of interest with respect to the research, authorship, and/or publication of this article.
Funding
The author(s) disclosed receipt of the following financial support for the research, authorship, and/or publication of this article: The preparation of this article would not have been possible without the support of the Certified Laboratory of Wind Measurements of Vector Hellenic Windfarms S.A.
