



Abstract
This study investigated bioethanol production from rice straw (RS) and sugarcane bagasse (SCB) which containing 72.8 and 73.2% holocellulose, 56.8 and 58.6% α-cellulose, and 14.9 and 25.1% lignin for RS and SCB, respectively. To eliminate the lignin content, different pretreatment conditions, such as hot water, dilute acid, and acid-alkali, were designed. Acid-alkali was characterized as the best pretreatment for removing ∼79 and 70% of lignin, α-cellulose increased 91.4 and 91%, and holocellulose reached 90.8 and 90% for RS and SCB, respectively. The results revealed that acid-alkali was highly efficient than other pretreatment used for both RS and SCB. After enzymatic hydrolysis of acid-alkali-treated RS and SCB with cellulase, glucose concentrations reached 45 and 42 g/l, respectively. Pichia occidentalis AS.2 was isolated and identified based on 18S rRNA sequencing as a bioethanol producer. Maximization of bioethanol production by P. occidentalis AS.2 using the resulting glucose as a carbon source from RS and SCB was studied using an experimental design. The pH, incubation period, and inoculum size were optimized using Box-Behnken designs (BBD), the final conditions for bioethanol production used 100 g/l acid-alkali-treated fibers, 10 ml cellulase enzyme at 50°C for 5 days at 75 rpm for enzymatic hydrolysis. After time consumed and adjusting the pH to 6, the mixture was inoculated with 2.5% P. occidentalis AS.2 and incubated at 35°C for 24 h at 200 rpm to increase the bioethanol yield by 1.39-fold to 23.7 and 21.4 g/l compared to initial production (17 and 15.3 g/l) between RS and SCB, respectively.
Introduction
The world's currently increasing population and energy usage almost hit the limit of the Earth's capacity. Consequently, it is time to develop new and sustainable techniques for generating chemicals, energy, and food. 1 Consumption of nonrenewable sources increases daily worldwide, and energy from limited nonrenewable sources cannot fulfill the energy demand in the current situations. 2 The use of renewable biomass resources to generate biofuels, such as bioethanol, offers appealing alternatives to mitigating climate change, decreasing reliance on foreign oils, improving global energy security, strengthening rural and agricultural economies, and growing the global transportation system for sustainable development. 3
The first generation of bioethanol production depends on the fermentation of seeds or crops with a heavy proportion of fermentable sugars, but the production from these types of raw materials has a global competition between food, animal feed, and energy requirements. To overcome this drawback, the second generation of bioethanol is a conventionally attractive and effective alternative approach because there is no competition with the nutrition requirements.1,4 However, feedstocks for bioethanol production should be derived from inedible parts of food crops to avoid direct competition between bioethanol and food production.
Agricultural sources, such as rice straw (RS) and sugarcane bagasse (SCB), are natural lignocellulosic materials that are widely unused, renewable, and abundantly available sources of raw materials for bioethanol production; these materials are also cheaper than the first-generation sources. The second generation of bioethanol production depends on low-cost sources, such as banana peels, 5 corn straw, 6 watermelon waste, 7 and cantaloupe waste. 8 It can be obtained from various resources at low costs, such as forest residues, municipal solid wastes, waste papers, and residue from crops.9,10 Cellulose, hemicellulose, and lignin are the major components of all types of lignocellulosic materials. These components represent ∼90% of the total dry mass and form a complex matrix in the plant cell wall.11,12
RS is a byproduct of the harvest of rice grain. It is the most abundantly available agricultural waste worldwide and has a heterogeneous complex structure consisting of cellulose (28%–36%), hemicellulose (23%–28%), and lignin (15%–23%) and is used as feedstock for bioethanol production. 13 Approximately 731 million tons of RS are produced annually and distributed in Africa, Asia, Europe, and America (20.9, 667.6, 3.9, and 37.2 million tons, respectively). Theoretically, RS can produce 205 billion liters of bioethanol from the above amount annually. 14 SCB is the solid residue from sugarcane (Saccharum officinarum) obtained in high quantities after the extraction of sugarcane juice. It remains one of the most abundant agricultural waste in the world and can be used as a potential substrate for bioethanol production, as it has high sugar content and is a renewable, cheap, and readily available feedstock. 15 SCB consists primarily of cellulose (33%–36%), hemicellulose (28%–30%), and lignin (17%–24%). 16 Approximately 540 million metric tons of SCB are worldwide per year. 17
The bioethanol production process can be divided into four general steps from lignocellulosic materials: pretreatment, hydrolysis, fermentation, and distillation. Each step includes different possible choices, but the overall effect remains the same regardless of the process step.15,18 The pretreatment process is essential for the breakdown of lignin and hemicellulose and the destruction of the crystalline structure of cellulose, allowing the acids or enzymes to have ready access to the cellulose that will hydrolyze into fermentable sugars. 19
A number of chemical, physical, biological, and combined technologies for lignocellulosic material pretreatment are applicable, including hot water, 20 dilute acid, 21 and acid-alkali pretreatment. 1 Hot water is used as an alternative pretreatment process to prevent excess inhibitors for bioethanol production. The disadvantage of pretreatment with hot water is the low sugar yield after enzymatic hydrolysis. 20 Dilute acid is considered an effective pretreatment for biomass, reducing particle size and increasing the accessibility of cellulose to hydrolysis. Moreover, the use of concentrated acid results in sugar loss, inhibitors formation, and corrosion of machinery, increasing operating cost and contributing to environmental challenges. 20 Pretreatment with combined acid-alkali promotes hemicellulose hydrolysis efficiently, removes noncellulosic components, minimizes byproduct formation, such as acetic acid, furfural, and hydroxymethylfurfural in hydrolysate, and ultimately enhances the enzymatic digestibility of pretreated fibers. 22
The hydrolysis process is responsible for the utilization of pretreated fibers to produce fermentable sugars. To generate fermentable sugars from cellulosic biomass, two processing methods are employed: acid and enzymatic hydrolysis. 23 Diluted and concentrated acid hydrolysis was used to hydrolyze lignocellulosic materials for free sugar production. Dilute acid (0.7%–3.0%) hydrolysis was achieved using high operating temperatures (200–240), whereas hydrolysis by concentrated acid was achieved by an amount of high acid and therefore is ineffective, and acid recycling also involves high costs. 24 Enzymatic hydrolysis using cellulases does not generate inhibitor compounds, and the enzymes are very specific for cellulose. Cellulases originating mainly from various types of microorganisms (fungi and bacteria) are a mixture of three distinct enzymes (exoglucanase, endoglucanase, and β-glucosidase). The most effective alternative to diluted or concentrated acid hydrolysis is enzymatic hydrolysis, but it is certainly not a substitution technique. 25
The final step involves microbial fermentation for the conversion of hydrolysate sugars to bioethanol. Various microorganisms can be used for fermentation, such as bacteria, 26 fungi, 23 and yeasts. However, the most frequently fermenting microorganism used include the yeast Saccharomyces cerevisiae NCYC 2826 27 and HAU, 1 Brettanomyces custersii KTCT18154P, 28 and Pichia stipitis. 29 Statistical experimental designs (SED) provide a quick evaluation of large experimental parameters and demonstrate the role of each parameter and their relationship which could be helpful for improving the productivity or yields in most bioprocesses. Thus SED was used recently to evaluate the most relevant variables and its optimal level for bioethanol production. 30
Accordingly, this study aimed to apply a hybrid strategy for the valorization of enriched lignocellulosic agriculture waste (RS and SCB) into fermentable sugar using a new Egyptian yeast isolate for bioethanol production. This study aimed to describe the biorefinery strategic steps to produce bioethanol using some of the available agriculture biomass resistant to degradation and produced in huge amounts. The focus is on the state-of-the-art of bioethanol production, waste simplification for utilization, and bioprocess optimization using an experimental design approach in order to reduce the cost of the production process and obtain the highest possible bioethanol yields.
On this theme, this study was conducted to apply different pretreatment methods for RS and SCB (hot water, dilute acid, and acid-alkali), followed by enzymatic hydrolysis and then fermentation of the liberated glucose using newly isolated yeast Pichia occidentalis strain AS.4 for bioethanol production. The culture conditions affecting the bioethanol production by P. occidentalis AS.4 through SED were carried out and evaluated. Furthermore, the optimal conditions for bioethanol production were investigated using response surface methodology (RSM) based on a three-variable/three-level Box-Behnken design (BBD) that involved temperature, inoculum size, and pH. In brief, this study directed to optimize both of applied waste-pretreatment protocol and fermentation to reduce the cost of the production process and ultimate beneficial utilization of agricultural wastes namely RS and SCB as low-cost substrate through complicated optimization strategies.
Materials and methods
Raw materials
RS and SCB were collected from a local field in Egypt. The raw materials were previously washed with water to remove dust and impurities and then air-dried and ground by a cutter milling into small pieces (2–3 cm). During the experimental period, RS and SCB were stored inside plastic bags at room temperature. The chemical composition of RS and SCB, including moisture, ash, lignin, holocellulose, and α-cellulose, was estimated using standard TAPPI protocols (moisture: TAPPI T208 om-84, 31 ash: TAPPI T211om-93, 32 lignin: TAPPI T222 om-83, 33 holocellulose: TAPPI T257 om-85, 34 and α-cellulose: TAPPI T203 om-83.) 35
Pretreatment
Hot water, dilute acid, and acid-alkali were used for the treatment of RS and SCB. All pretreatment processes were performed in a stainless steel reactor (cubs; 10.8 cm in diameter and 33.7 cm long with a wall thickness of 6.6 mm and a total volume of 3 L) at the National Research Centre, Egypt. After the reaction time of each pretreatment, the pressure was released into the atmosphere, and the pretreated fiber was separated by filtration, extensively washed to neutralize with tap water, air-dried, and preserved for further study. Under each condition, triplicates of the pretreatment processes were conducted.
Hot water treatment
Hot water treatment used a liquor to raw material ratio of 10:1 (ml/g) at 170°C for 2 h. 36
Dilute acid treatment
Raw materials were treated using diluted H2SO4 5% (v/v) and the liquor to raw material ratio was 5:1 (ml: gm) at 170°C for 2 h according to Shuai et al. 37 with slight modification.
Acid-alkali treatment
A 10% (w/w) H2SO4 solution was used, and the liquor to raw material ratio was 10:1 (ml/g) at 170°C for 2 h. The treated fiber was then washed by distilled water until neutral and air-dried, followed by alkali treatment by 10% NaOH (w/w) at the same conditions as above, according to Kaur et al. 1 with slight modification.
Enzymatic hydrolysis
RS and SCB were subjected to enzymatic hydrolysis as raw and pretreated fibers. Cellulase from Trichoderma reesei ATCC 26921 (89.4 FPU/ml; Sigma) was used for enzymatic hydrolysis. Hydrolysis was performed in a 250 ml Erlenmeyer flask at an initial sample concentration of 10% raw and treated fibers of RS and SCB (10 g) suspended in 100 ml sodium acetate buffer (pH 4.7) with the addition of 2 ml cellulase enzyme. The flasks were incubated at 50°C for 5 days at 75 rpm. At interval times, the supernatant was filtered, and glucose concentration was determined using a glucose assay kit (Oxidase). All experiments were performed in triplicate. 38
Enzymatic hydrolysis calculations
The cellulose conversion rate was calculated using the following equation:

The enzymatic hydrolysis rate was calculated using the following equation:

Isolation and screening of bioethanol-producing yeasts
Rotten fruits (apple, banana, orange, and peach), spoiled cheese, and yogurt were used as isolation sources using the pour-plate technique. Isolation was conducted using the glucose-yeast extract-peptone medium (GYP) with the following composition: glucose 10 g/l, yeast extract 10 g/l, and peptone 20 g/l (pH 5.5) and supplemented with antibacterial antibiotics (1000 mg/ml ampicillin) and inoculated with 0.5 g or ml of each isolation source. The flasks were incubated under shaking (200 rpm) at 30°C for 7 days. The samples were withdrawn daily along the incubation time and serially diluted, and 100 µl of the diluted samples (10−6 and 10−8) were spread on ampicillin-containing GYP agar (20 g/l agar) medium. The inoculated plates were incubated at 30°C for 48 h. Based on microscopic examination and the colony color; different purified single colonies were subcultured in a GYP agar slant and incubated at 30°C for 24 h. After incubation, the pure culture was maintained at 4 °C for further study. 39 Quantitative estimation for bioethanol production by isolated yeast cells was performed after growing the tested cells in GYP broth for 72 h and inoculated with 24 h preculture at 0.2% concentration. Bioethanol production in the fermentation medium was monitored daily, where 1 ml sample was taken and centrifuged for 10 min at 11,000 rpm. Quantitative estimation for bioethanol concentration was measured in cell-free supernatants using gas chromatography (GC; Shimadzu GC, model GC-2010 Plus, Japan). Bioethanol production was primarily determined by comparing the retention time of the GC peak to standard ethanol. For an additional study, the most potent isolate was selected based on quantitative estimation. 40
Morphological characterization
The most potent isolate that produced bioethanol was used for further characterization, such as morphological observation by growing vegetative cells on liquid and solid GYP media after incubation at 30°C for 24 h. The appearance of cultures features was recorded, such as color, texture, and surface of colonies when growing cells on a solid medium, whereas the shape and size of cells were determined by a compound microscope and scanning electron microscope (SEM; JEOL JSM 6360 LA, Japan) when growing cells on a liquid medium.
Genetic identification
The bioethanol-producing isolate was identified using partial 18S rRNA sequence analysis. Based on the salting-out method, genomic DNA was isolated from a pure culture. 41 The amplification of the 18 s rRNA gene from the genome of the isolate under investigation was performed using polymerase chain reaction (PCR; MultiGene Optimax, Labnet, USA). 42 Universal fungal primers 18SF 149: 5’-GGAAGGG(G/A)TGTATTATTAG-3’ and 18SR 1709: 5’-TCCTCTAAATGACCAAGTTTG-3’ were used to amplify a partial fragment of ∼1500 bp from DNA of the tested yeast isolate. 43 The amplified PCR product was cleaned to remove unincorporated nucleotides and excess primer using the PCR purification kit (Qiagen PCR Purification Kit). The purified product of 18S rRNA was subjected to sequencing using ABI PRISM model 3730 automated DNA sequencer at Sigma for Scientific Research. The following partial sequence was obtained (∼1500 bps). Subsequently, the partial sequence was deposited in GenBank to obtain an accession number. Using the BioEdit Sequence Alignment Editor Program, the sequences were assembled. 44 Comparative sequence analyses were performed using ClustalW BLAST 45 to evaluate the similarities. The phylogenetic tree was constructed with MEGA version 4.0.2. 46
Fermentation using treated waste
A fermentation experiment was performed to convert the resulting glucose into bioethanol. The selected isolate that showed high potency in bioethanol production was used in the fermentation process. A 50 ml GYP broth medium was inoculated with fresh colony yeast cells and incubated (Brunswick, Innova 42R, USA) at 30 °C for 72 h at 200 rpm. Cells were harvested, centrifuged (BioFuge, D-37520, Germany) under aseptic conditions for 10 min at 11,000 rpm, and resuspended in 2 ml sterilized distilled water. The fermentation processes were performed in a flask containing the following media (50 ml enzyme-hydrolyzed pretreated RS and SCB, 0.5% yeast extract; 5.5 pH) and then inoculated with selected yeast (0.2%) and incubated at 30 °C and for 72 h at 200 rpm. 36 The supernatants were collected after the incubation time and analyzed for bioethanol production and glucose concentration using potassium dichromate 47 and glucose kit, respectively.
Experimental design (RSM; BBD)
RSM was used to define the optimal level of the selected most significant variables using a three-variable/three-level BBD.
48
To determine the optimal level and their interaction for each variable on bioethanol production, BBD was applied. To demonstrate the individual and synergetic influence of pH, temperature, and inoculum size, 13 BBD trials plus 2 extra trials (sum of 15 trials) were used. Three different levels for each variable were used (−1, 0, +1), representing the low, middle, and high values of each variable, respectively, for both RS and SCB, as shown in Table 1. However, the other variables were maintained at a constant ratio (glucose concentration achieved from enzymatic hydrolysis of acid-alkali treatment of RS and SCB, shaking at 200 rpm and medium volume). For both RS and SCB, the 15-run BBD consisted of rows and columns representing experimental and significant variables, respectively, as shown in Table 1. Fifteen runs were performed, and the bioethanol production yield was calculated for each trial. Response (Y) referred to bioethanol production, and independent variables (X) referred to culture conditions. The obtained data were integrated into the following second-order polynomial structured model for three variables:

BBD for three variables with coded values and observed and predicted results for bioethanol production using acid-alkali-treated RS and SCB via enzymatic hydrolysis.

Analytical methods
Estimation of glucose
The glucose kit was purchased from BioSystems Co. The assay was based on the presence of glucose oxidase and peroxidase enzymes. 50 Glucose concentration was estimated spectrophotometrically (Optizen Pop, Mecasys Co., Korea) at 550 nm.
Estimation of bioethanol
Potassium dichromate conditions
The bioethanol assay for collected samples was performed according to Caputi et al. 47 A 1 ml culture supernatant was taken, the volume was completed to 5 ml with distilled water, and 1 ml K2Cr2O7 solution and 4 ml concentrated H2SO4 were added to each tube gently through the walls. All test tubes were kept in ice water for 10 min. The intensity of color was read at 660 nm in an ultraviolet-visible spectrophotometer. Blank (free of ethanol) was prepared in the same way using distilled water. The quantitative estimation for bioethanol concentration can be calculated using a standard curve.
Gc conditions
GC equipped with a capillary column and 1-butanol A383-1 (Fischer) as an internal standard was used for bioethanol quantification under preadjusted ethanol/methanol software conditions. The injection port temperature was set at 200°C, and the flame ionizing detector temperature was set at 200°C. The sample linear velocity through the column was set at 40 cm/s, and 0.5 μL samples were injected at a split ratio of 40:1. All samples were spiked with an internal standard of 1-butanol. A calibration standard curve was developed to calculate the bioethanol concentration in the fermentation samples.
Statistical analysis
Bioethanol production data were subjected to multiple linear regressions using Microsoft Excel 97 to evaluate the P-value, t-value, and confidence level. The significance level (P-value) and Student's t-test were calculated together. The t-test for any particular effect allowed the evaluation of the probability of finding the observed effect purely by chance. If this probability were sufficiently small, the idea that the effect was caused by varying the amount of the variable under test was accepted. The confidence level was an expression of the P-value in percent. The optimal value of activity was evaluated using the solver function of Microsoft Excel tools. The simultaneous effects of the three most significant independent factors on each response were visualized using three-dimensional (3D) graphs (surface plot) generated by Statistica 5.0. Triplicates of all experiments were performed, and data represented average values.
Results and discussion
Analysis of raw and treated RS and SCB
Agriculture waste is considered a second-generation resource for bioethanol production. The unconverted lignin found in such waste is still quite large in most applied bioprocesses. Improving agriculture waste via pretreatment is quite important to facilitate waste enzyme attachment and the constant production and commercialization of bioethanol. Thus, the study proposed valuable insights toward achieving a cost effective bioethanol production technology using lignocellulosic agriculture waste. With this trend, the chemical characterization showed the percentage of such waste, namely, RS and SCB component, as raw materials; their major components, such as lignin, α-cellulose, and holocellulose, were determined at 14.9%, 56.8%, and 72.8% for RS and 25.1%, 58.6%, and 73.2%, respectively, for SCB, as summarized in Table 2. The noticeable variation in the chemical composition of lignocellulosic materials for tested waste compared to others might be related to their cultivation conditions, soil type, diversity, region, agricultural techniques, and other parameters that differed from one place to another. 51 This hypothesis matched with other studies.1,52 The chemical analysis concerning waxes and residual contents for the used RS and SCB was 1.32 and 0.59 g, respectively, after extraction using a mixture of 1:1 benzene/methanol for 6 h. Pretreatment of lignocellulosic biomass should be effective to achieve the following objectives: enhance the hydrolysis of pretreated fibers, avoid carbohydrate degradation, avoid the formation of inhibitor compounds, and achieve cost-effectiveness. 53 Thus, this research focused on the various pretreatment methods, such as hot water, dilute acid, and acid-alkali pretreatment of RS and SCB, where the chemical analysis of pretreated fibers was compared to raw materials, as shown in Table 2. The results revealed that the main components of the pretreated fibers were enhanced compared to the raw materials for both RS and SCB. Also, holocellulose and α-cellulose for the acid-alkali treatment for RS and SCB were higher than those pretreated using hot water and dilute acid. Acid-alkali treatment of RS and SCB increased the α-cellulose content from 56.8% to 91.4% for RS and from 58.6% to 91% for SCB compared to raw materials. The α-cellulose content is the main component for bioethanol production from lignocellulosic materials. In addition, the lignin content in acid-alkali treatment was lower, followed by dilute acid and then hot water pretreatment, for pretreated RS and SCB, in which the lignin is usually dissolved and separated in the resulting black liquor, leading to improved enzymatic hydrolysis of the pretreated fibers. This indicated that the acid-alkali pretreatment method effectively removes lignin and other components that contributed to an increase in the holocellulose and α-cellulose content for RS and SCB. Elimination of lignin from biomass by pretreatment is necessary for efficient bioethanol production from lignocellulose materials by scarification and fermentation. 23 Wang et al. 54 reported that SCB was pretreated with hot water at 200°C for 10 min and showed that lignin content decreased from 19% to 10%, cellulose content increased from 37.4% to 41.7%, and ash content decreased from 3.6% to 2.4%. These results described the low impact of hot water pretreatment on SCB, in disagreement with this study. Other studies described the effect of hot water on RS and observed an increase in cellulose content but a reduction in lignin content. 55 These results were consistent with this study. Dilute H2SO4 enhances the digestibility of lignocellulosic materials mainly by dissolving hemicellulose and partially removing lignin and prehydrolyzing cellulose. 56 Holocellulose and α-cellulose contents in dilute H2SO4 pretreated RS and SCB increased compared to raw materials due to the dissolution of amorphous materials from biomass.22,57 Throughout, dilute H2SO4 pretreatment may be insignificant for the removal of lignin because of its weak hydrolyzed glycosidic bond in hemicellulose and lignin-hemicellulose, in agreement with Manzoor et al. 58 Several combinations of acid-alkali catalysts have been successfully used for the pretreatment of various lignocellulosic biomass, including RS, SCB, and corn stover.1,59 Kaur and Kuhad 1 reported that 55% of the lignin content of RS was removed after treatment with combined 3% H2SO4 and 4% NaOH, whereas this study achieved 79% of lignin removed from RS after treatment with combined 5% H2SO4 and 10% NaOH. Lee et al. 60 reported that 65% of the lignin content as a high amount was removed from corn stover after treatment with combined acid-alkali. Singh et al. 61 reported that the lignin content of RS reached 3.8% after combined H2SO4 and microwave pretreatment. This result was consistent with this study in which the lignin content of RS reached 3.13% when RS was treated with a combined acid-alkali pretreatment. Moreover, Ragab et al. 62 treated RS with Trichoderma viride F94 and Aspergillus terreus F98 and reported that the lignin content reached 7.52% and 6.73%, respectively. These results were higher than in this study concerning the lignin content of RS. As mentioned above, in this study, a mutual treatment (H2SO4-NaOH) was performed where the acid started to delignify and affected the surface area of cellulose fiber and then the alkali completed the delignification to improve the enzymatic hydrolysis trend. In this way, pretreatment could be applied mostly to remove lignin partially and solubilize hemicellulose to increase its accessibility for enzymatic hydrolysis during the next step.
Chemical composition of raw and treated RS and SCB waste residues.

Enzymatic hydrolysis of raw and pretreated RS and SCB
The data presented in Figure 1A and B show the glucose concentration resulting from the enzymatic hydrolysis of raw and pretreated RS and SCB. After the enzymatic hydrolysis time, the glucose concentrations from the raw materials, hot water, dilute acid, and acid-alkali were 14, 26.8, 30, and 45 g/l for RS and 11.2, 23.5, 27.2, and 42 g/l for SCB, respectively. The resulting glucose concentration trended a long time due to the enzyme action on the dual (acid-alkali) pretreated RS and SCB, respectively. It was easily recognized that the recorded glucose concentrations depended on the applied pretreatment method. The highest concentration was recorded for acid-alkali treatment, followed by dilute acid, hot water, and then raw materials of RS and SCB, as shown in Figure 1A and B. This was related to the low amount of lignin and high amount of holocellulose and α-cellulose contents, which promoted the conversion of cellulosic fibers into glucose. In the former graph, the high glucose concentrations (45 and 42 g/l) were produced after 5 days of enzymatic hydrolysis for RS and SCB after pretreatment with acid-alkali, respectively. This could be because RS contains higher levels of holocellulose and α-cellulose and lower lignin content than SCB. Also, the total elimination of lignin may have a positive effect on the enzymatic hydrolysis of cellulose. 63 Data from enzymatic hydrolysis (glucose concentration) indicated that RS and SCB require the same pretreatment methods to produce a higher glucose content. Most previous studies reported that the combined pretreatment of lignocellulosic materials is more efficient than other pretreatment methods for sugar production after enzymatic hydrolysis. Sun et al. 64 used a novel method combining Na2SiO3 and a cheaper ionic liquid for the treatment of willow to obtain 39.5 g/100 g waste after enzymatic hydrolysis. Hong et al. 65 used combined alkaline peroxide and ionic liquid-water mixture pretreatment of RS to obtain 251.6 g/l reducing sugar. Kaur and Kuhad 1 used combined 3% H2SO4 and 4% NaOH pretreatment of RS to obtain 787 mg/g reducing sugar. Sun et al. studied the synergetic effect of dilute H2SO4 and NaOH for the pretreatment of RS to obtain 30.9 g/100 g waste of glucose. 22 Other studies66,67 reported that glucose concentrations of 32 and 38.4 g/l could be obtained when SCB was treated with two stages of 8% H2SO4 and 20% NaOH, whereas a glucose concentration obtained in this study was 42 g/l when SCB was treated with acid-alkali, higher than the above-mentioned study. In addition, enzymatic hydrolysis and cellulose conversion rates were calculated and are summarized in Table 3. A higher enzymatic hydrolysis rate for acid-alkali was obtained, followed by dilute acid, hot water, and then untreated RS and SCB. A fast hydrolysis rate was noticed on the first days and slowed on the last days, where it depended on the conversion of cellulosic sources into glucose by the action of cellulase enzymes. The synergistic activity of cellulase enzymes is typically achieved by the action of three major enzymes: endoglucanases, exoglucanases, and β-glucosidases. Each enzyme performs as endoglucanase acting on the low crystallinity regions and the formation of free chain ends from cellulose fiber. Then, exoglucanases responsible for removing cellobiose units from the free chain ends by breaking down the sugar chain. Finally, β-glucosidase cleaves the formed cellobiose to glucose. 68 In contrast, in Table 3, a higher cellulose conversion rate was obtained for acid-alkali, followed by dilute acid, hot water, and then untreated RS and SCB. The cellulose conversion rate was slow on the first days and then rapid on the last days. Therefore, the enzymatic hydrolysis rate had an inverse relationship with the cellulose conversion rate of untreated and treated RS and SCB.
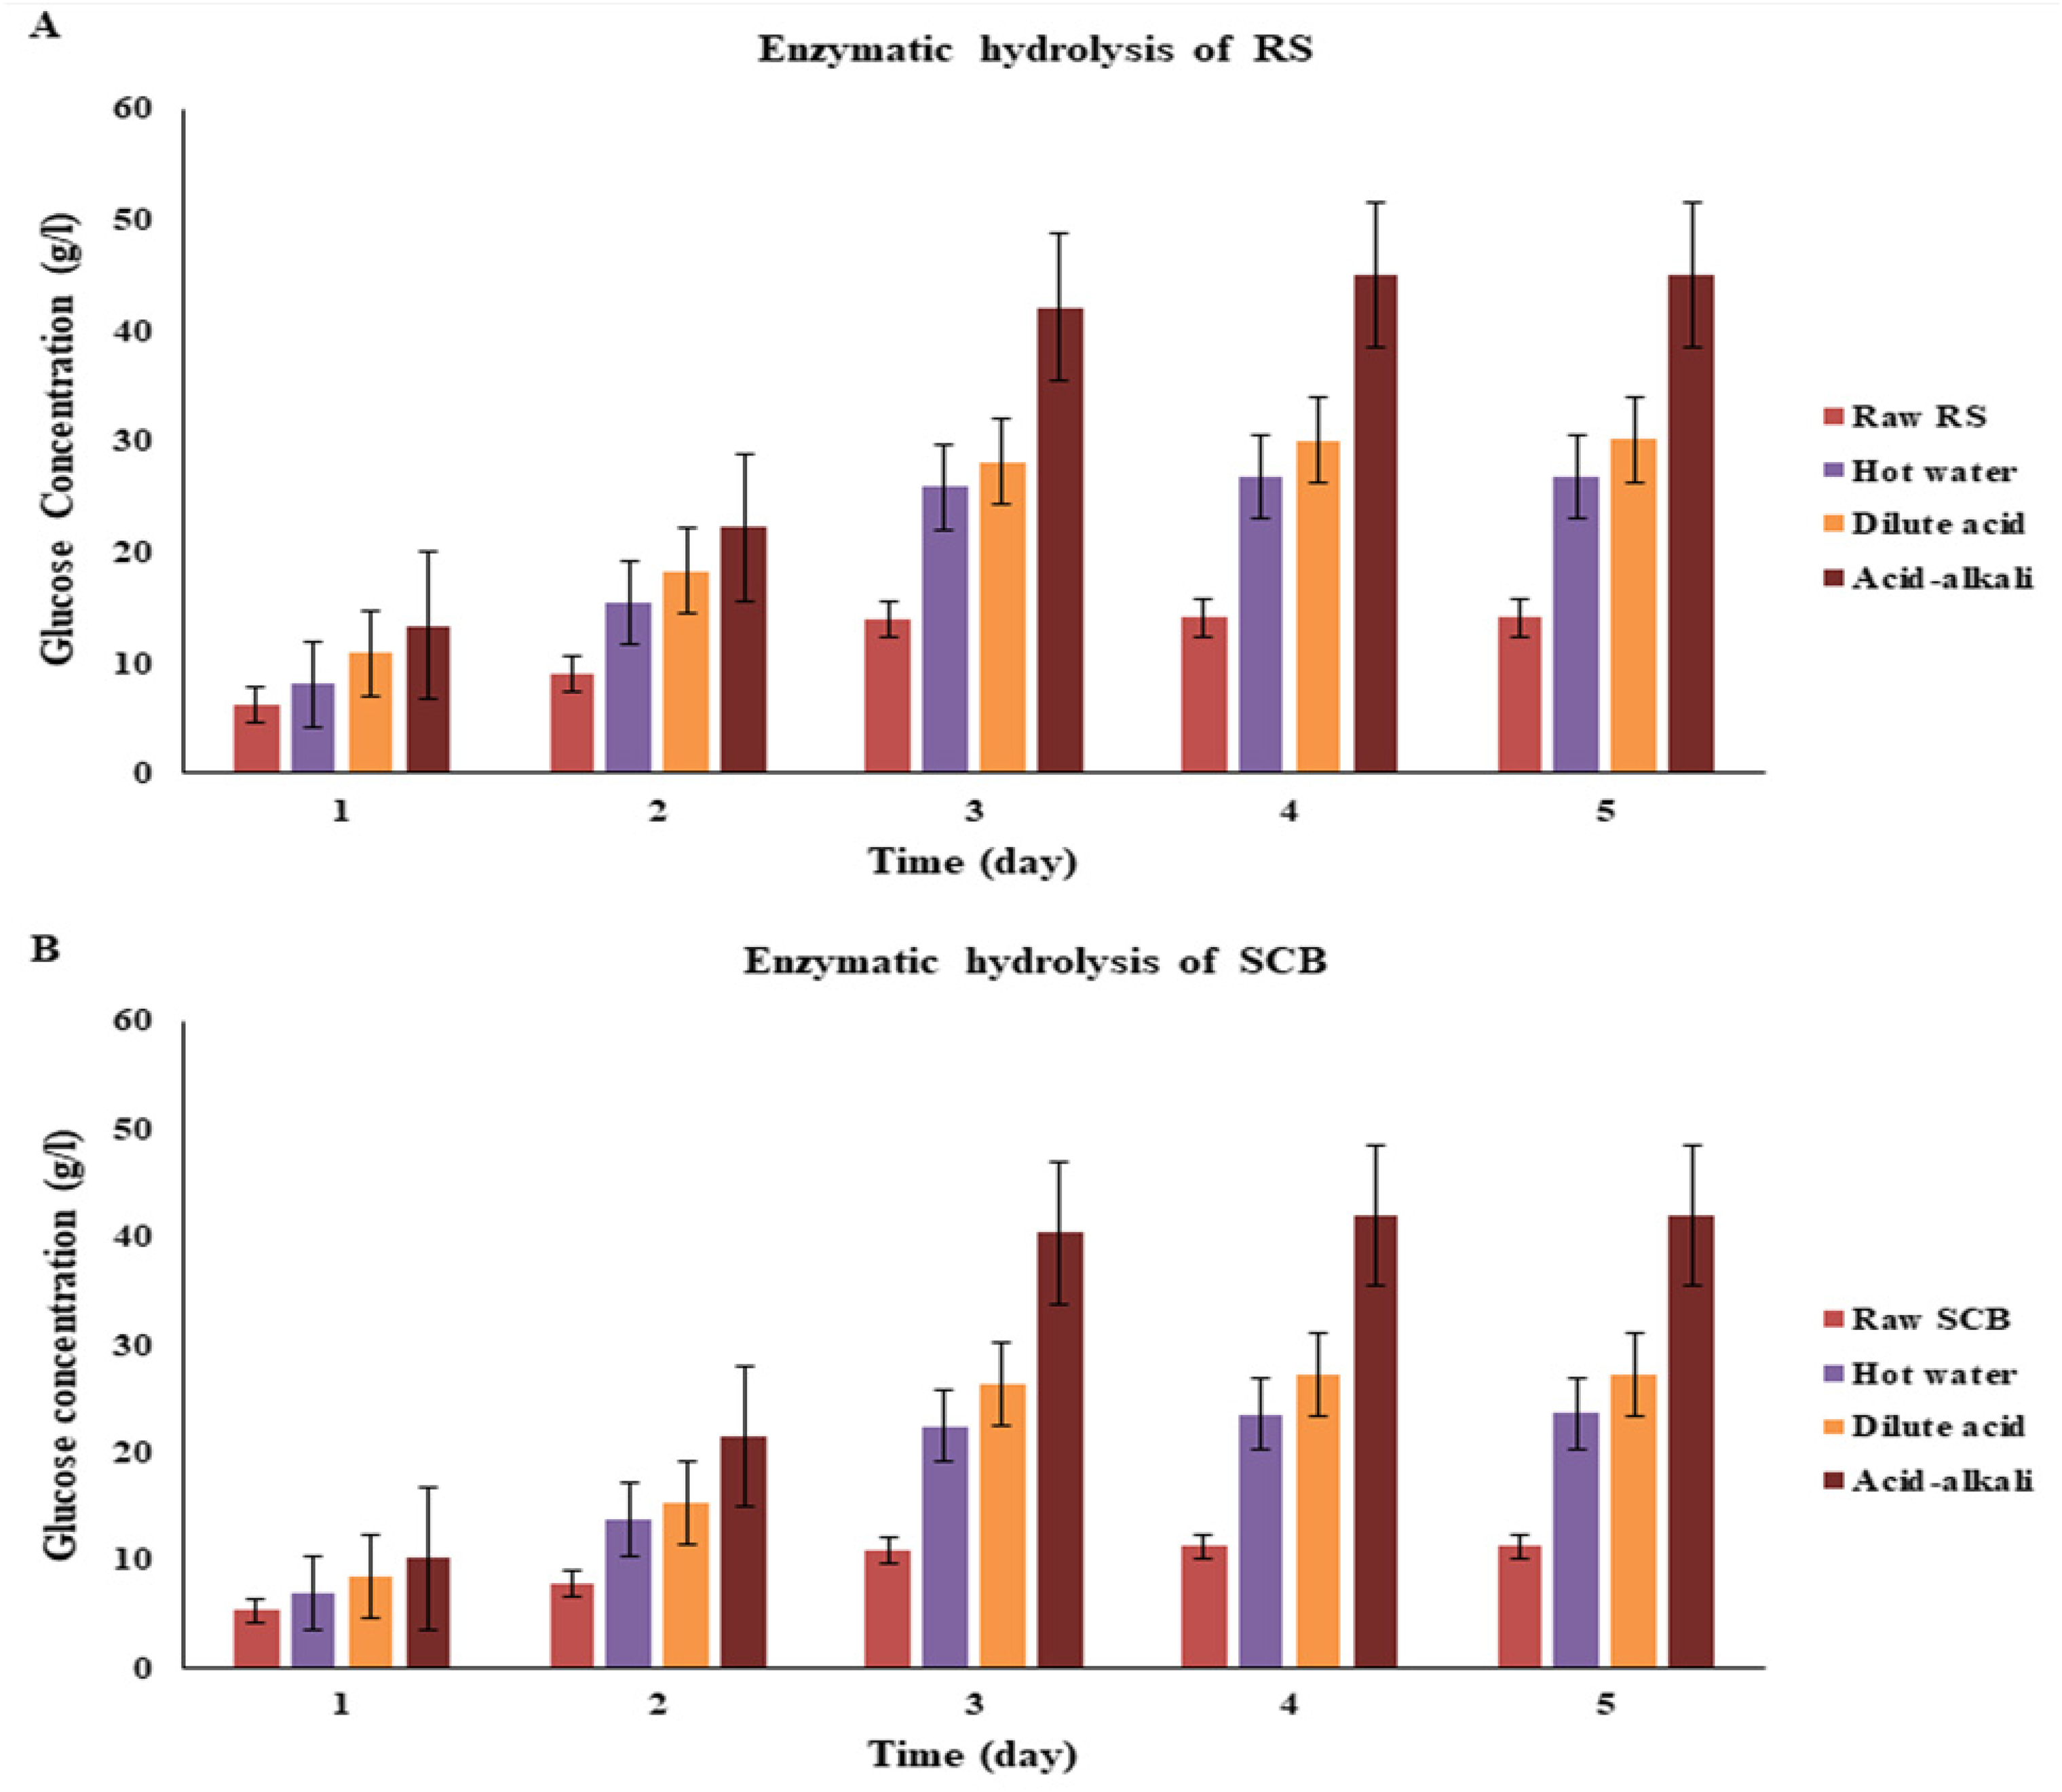
Enzymatic hydrolysis of raw and treated RS (A) and raw and treated SCB (B) for 5 days.
Enzymatic hydrolysis and cellulose conversion rates for RS and SCB waste residues.

Isolation, screening, and identification of the selected most potent yeast
A total of 36 isolates of yeast-like colonies were isolated from different sources, such as rotten apple, banana, orange, and peach, spoilage cheese, and yogurt on a GYP agar medium. All yeast isolates were designated serially from 1, 2, 3, … to 36 isolates. One strain was isolated from rotten peach, 2 from rotten orange, 5 from rotten banana, 5 from rotten apple, 5 from molasses, 7 from spoilage cheese, and 11 from spoilage yogurt. All isolates of yeast-like colonies were assayed for bioethanol production using GC, indicating isolate no. 7 was the best bioethanol producer (94.4%) among all tested isolates from rotten apples. Subsequently, it was selected as a potent isolate for bioethanol production and characterized by morphological and genomic identification. The morphological characterization in Figure 2 presents the appearance of culture when cells were grown in GYP broth and agar. After 1 day of incubation at 30°C, heavy, dry climbing pellicles were formed on the surface of GYP medium. The colonial characteristics were butyreus, round with raised margin, smooth, raised, and light cream color on GYP agar. The selected yeast no. 7 was examined under light microscopy (phase contrast) and SEM, and the micrographs are shown in Figure 2. The test yeast cells appeared singly or in pairs, ovoidal to elongate, with a width of 2.02 to 2.47 µm and height of 4.73 to 8.67 µm at X3000. Budding cells were also recognized, with a width of 1.37 to 1.85 µm and a height of 1.92 to 2.89 µm at X5000. Moreover, identification of the selected isolate was executed through molecular identification. Analysis of 18S rRNA depending on the partial sequence revealed that the selected isolate (no. 7) showed 99% similarity to the P. occidentalis sequence using BLAST The 18S rRNA gene sequence of P. occidentalis was deposited in GenBank and is available under accession number KM 516764. Subsequently, the isolate was designated as P. occidentalis AS.2. A phylogenetic tree was designed using ClustalX program (Figure 3) and showed that isolate AS.2 was more related to P. occidentalis. Generally, different yeasts from many sources can be used as a source of bioethanol, including S. cerevisiae, Lachancea fermentati, Pichia kudriavzevii, Shizosaccharomyces pombe, Candida tropicalis, Zygosaccharomyces rouxii, Saccharomycodes ludwigii, Hanseniaspora guilliermondii, and Wickerhamomyces anomalus isolated from coconut inflorescence sap in Thailand, 69 P. kudriavzevii and Candida tropicalis from pineapple and mango, respectively, 70 Kluyveromyces marxianus from biscuit factories, 40 and P. kudriavzevii from milk whey. 39
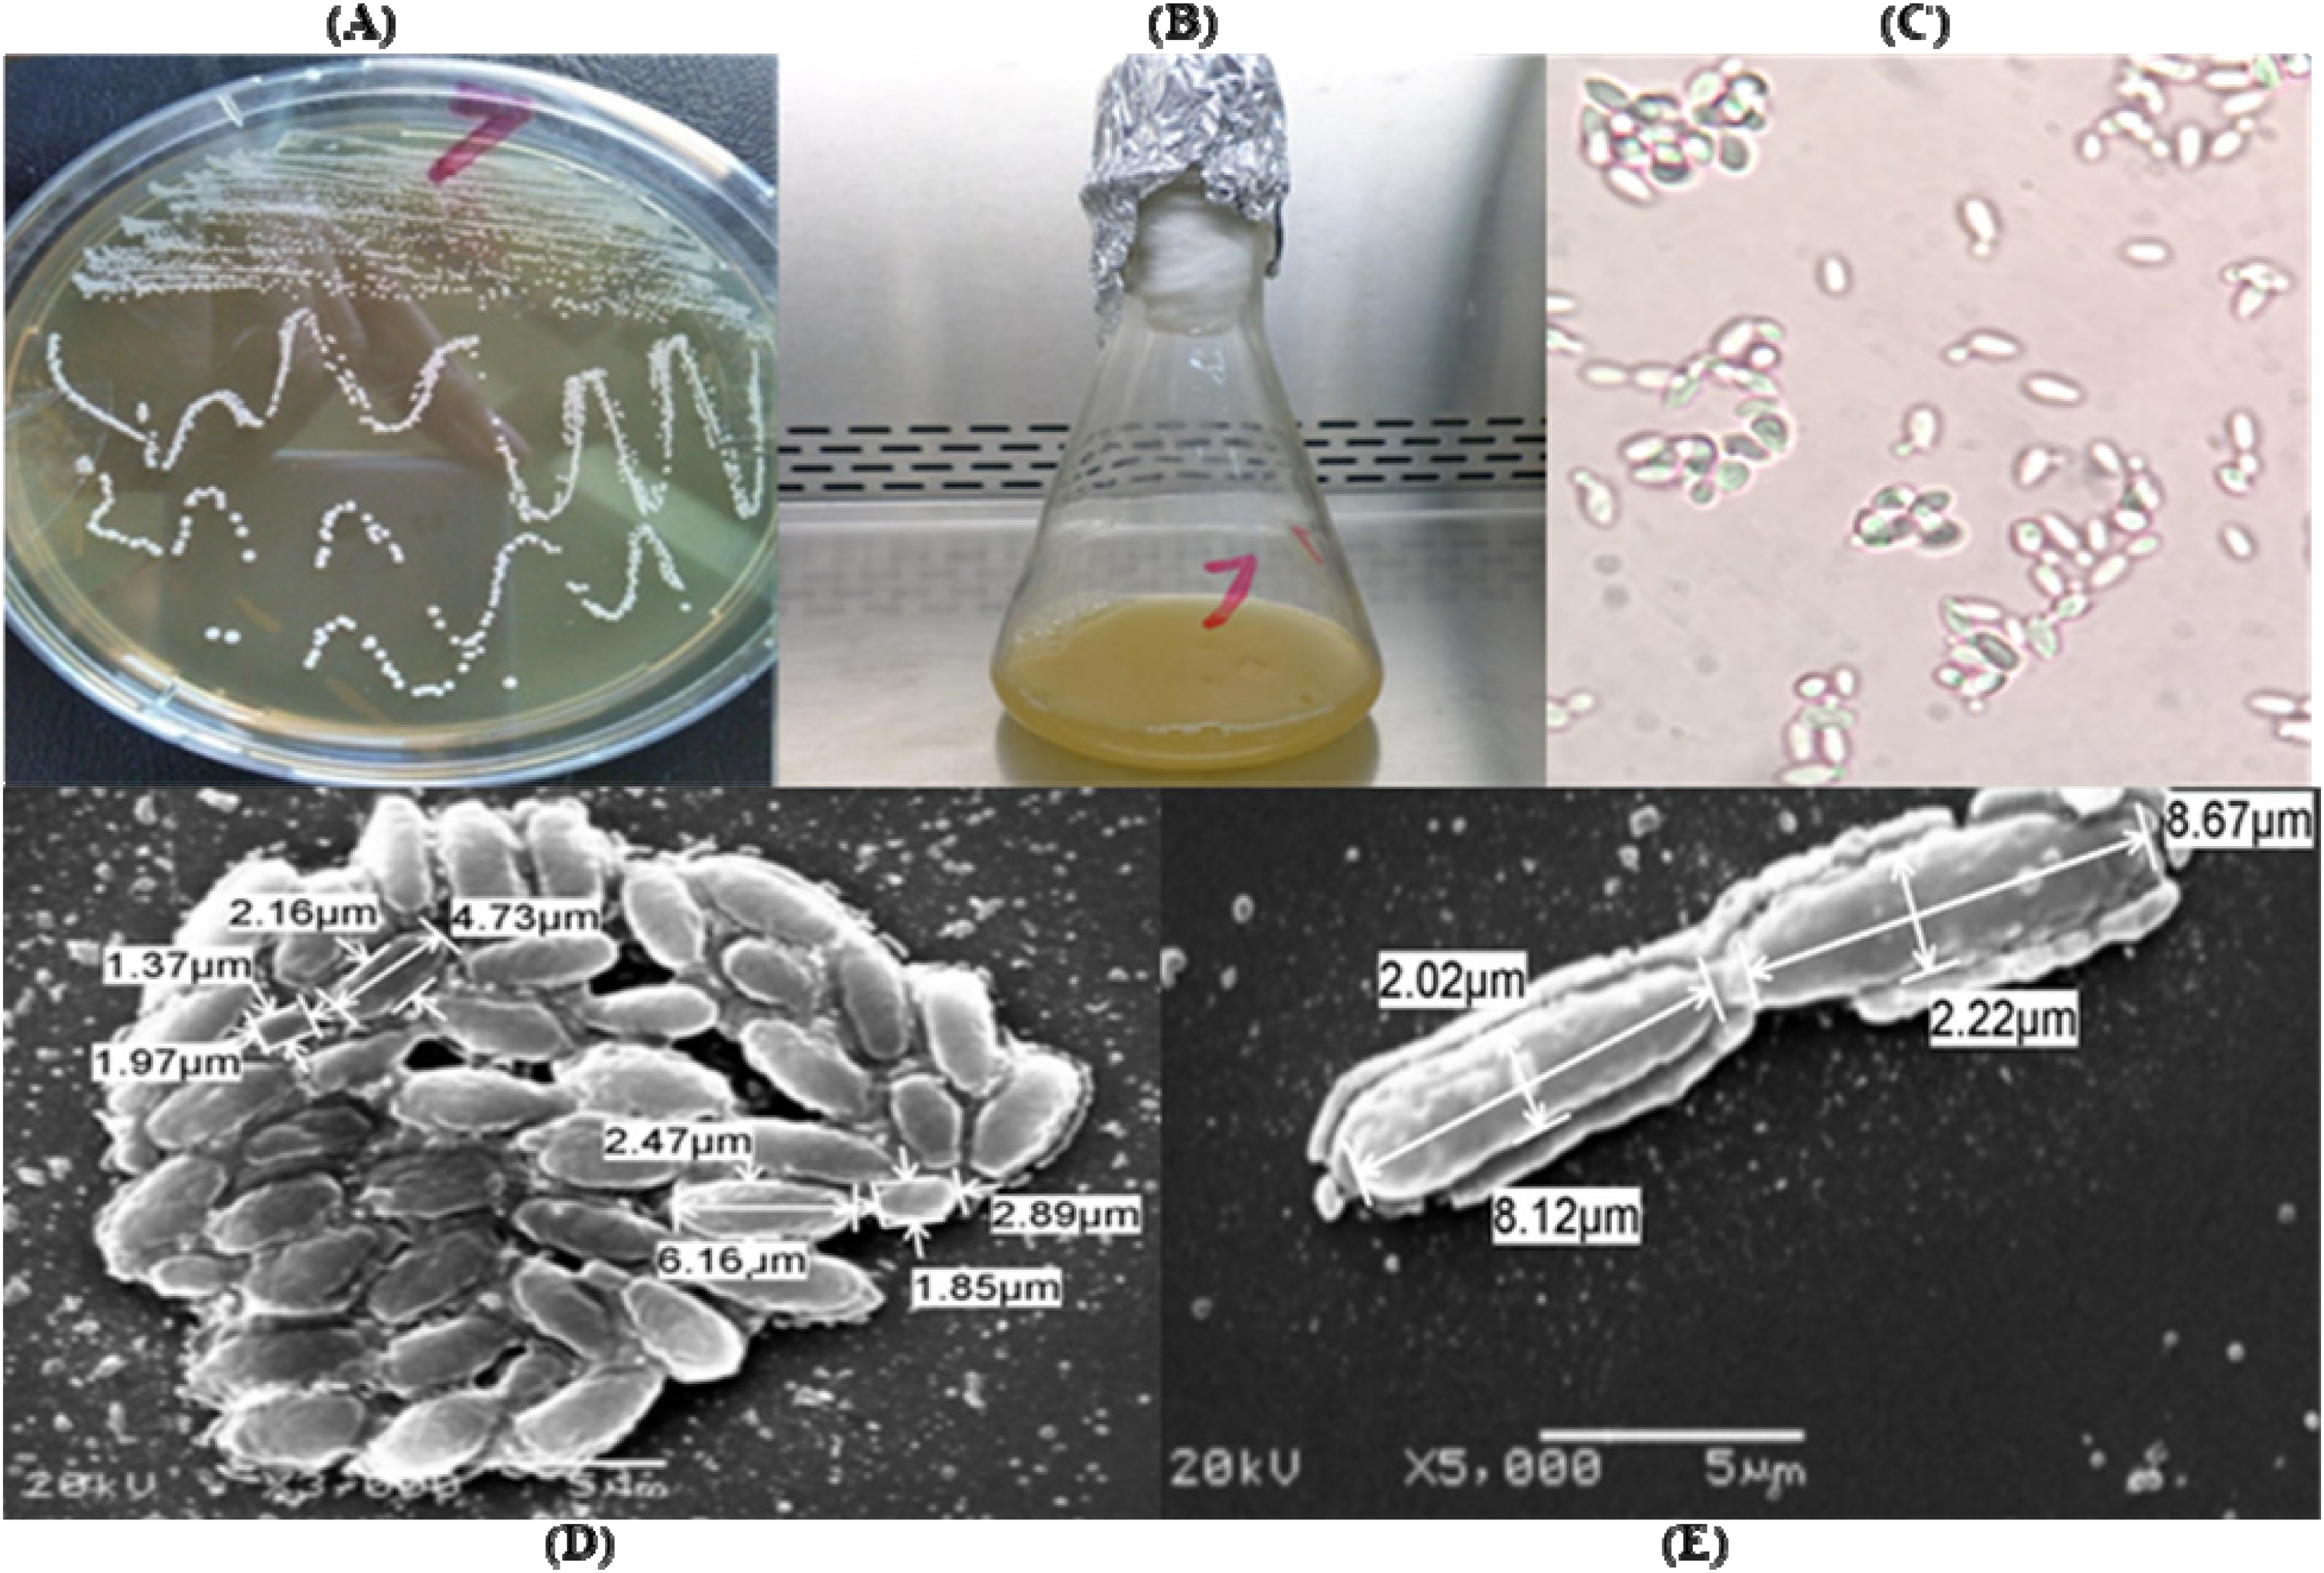
Growth of yeast isolate no. 7 in YPG broth (A) and agar (B). (C) Budding cells under a compound microscope (X1000). (D) SEM of vegetative and budding cells after incubation at 30°C for 24 h.

A phylogenetic tree of the selected yeast strain (P. occidentalis AS.2) with respect to reference strains based on the 18S rRNA sequences.
Fermentation
Initial fermentation using acid-alkali-treated RS and SCB
P. occidentalis strain AS.2 was tested for bioethanol production from the enzymatic hydrolysate of acid-alkali-treated RS and SCB. Bioethanol production was monitored every 12 h for 3 days, as shown in Figure 4. Bioethanol production from acid-alkali-treated RS and SCB using isolated P. occidentalis AS.2 was successfully performed and measured after 12 h. High bioethanol yield was obtained in both treated RS and SCB (17 and 15.3 g/l, respectively) after 24 h and without the optimization of culture conditions, and the amount of produced bioethanol was determined by the potassium dichromate method. Therefore, the highest bioethanol production was obtained from RS than SCB. This was due to the higher glucose concentration in the enzymatic hydrolysate of acid-alkali-treated RS than SCB. Osazuwa et al. 71 reported that the highest bioethanol yield of 16.21 g/100 g was obtained from RS using T. viride as a cellulose-hydrolyzing agent, nearly in agreement with this study for hydrolyzing acid-alkali-treated RS by cellulase from T. reesei ATCC 26921. Silva et al. 72 achieved a maximum amount of bioethanol (15.6 g/l) with the hydrolysis of treated SCB by an enzyme cocktail (cellulase and β-glucosidase) and then fermentation by S. cerevisiae, also in agreement with acid-alkali-treated SCB in this study.
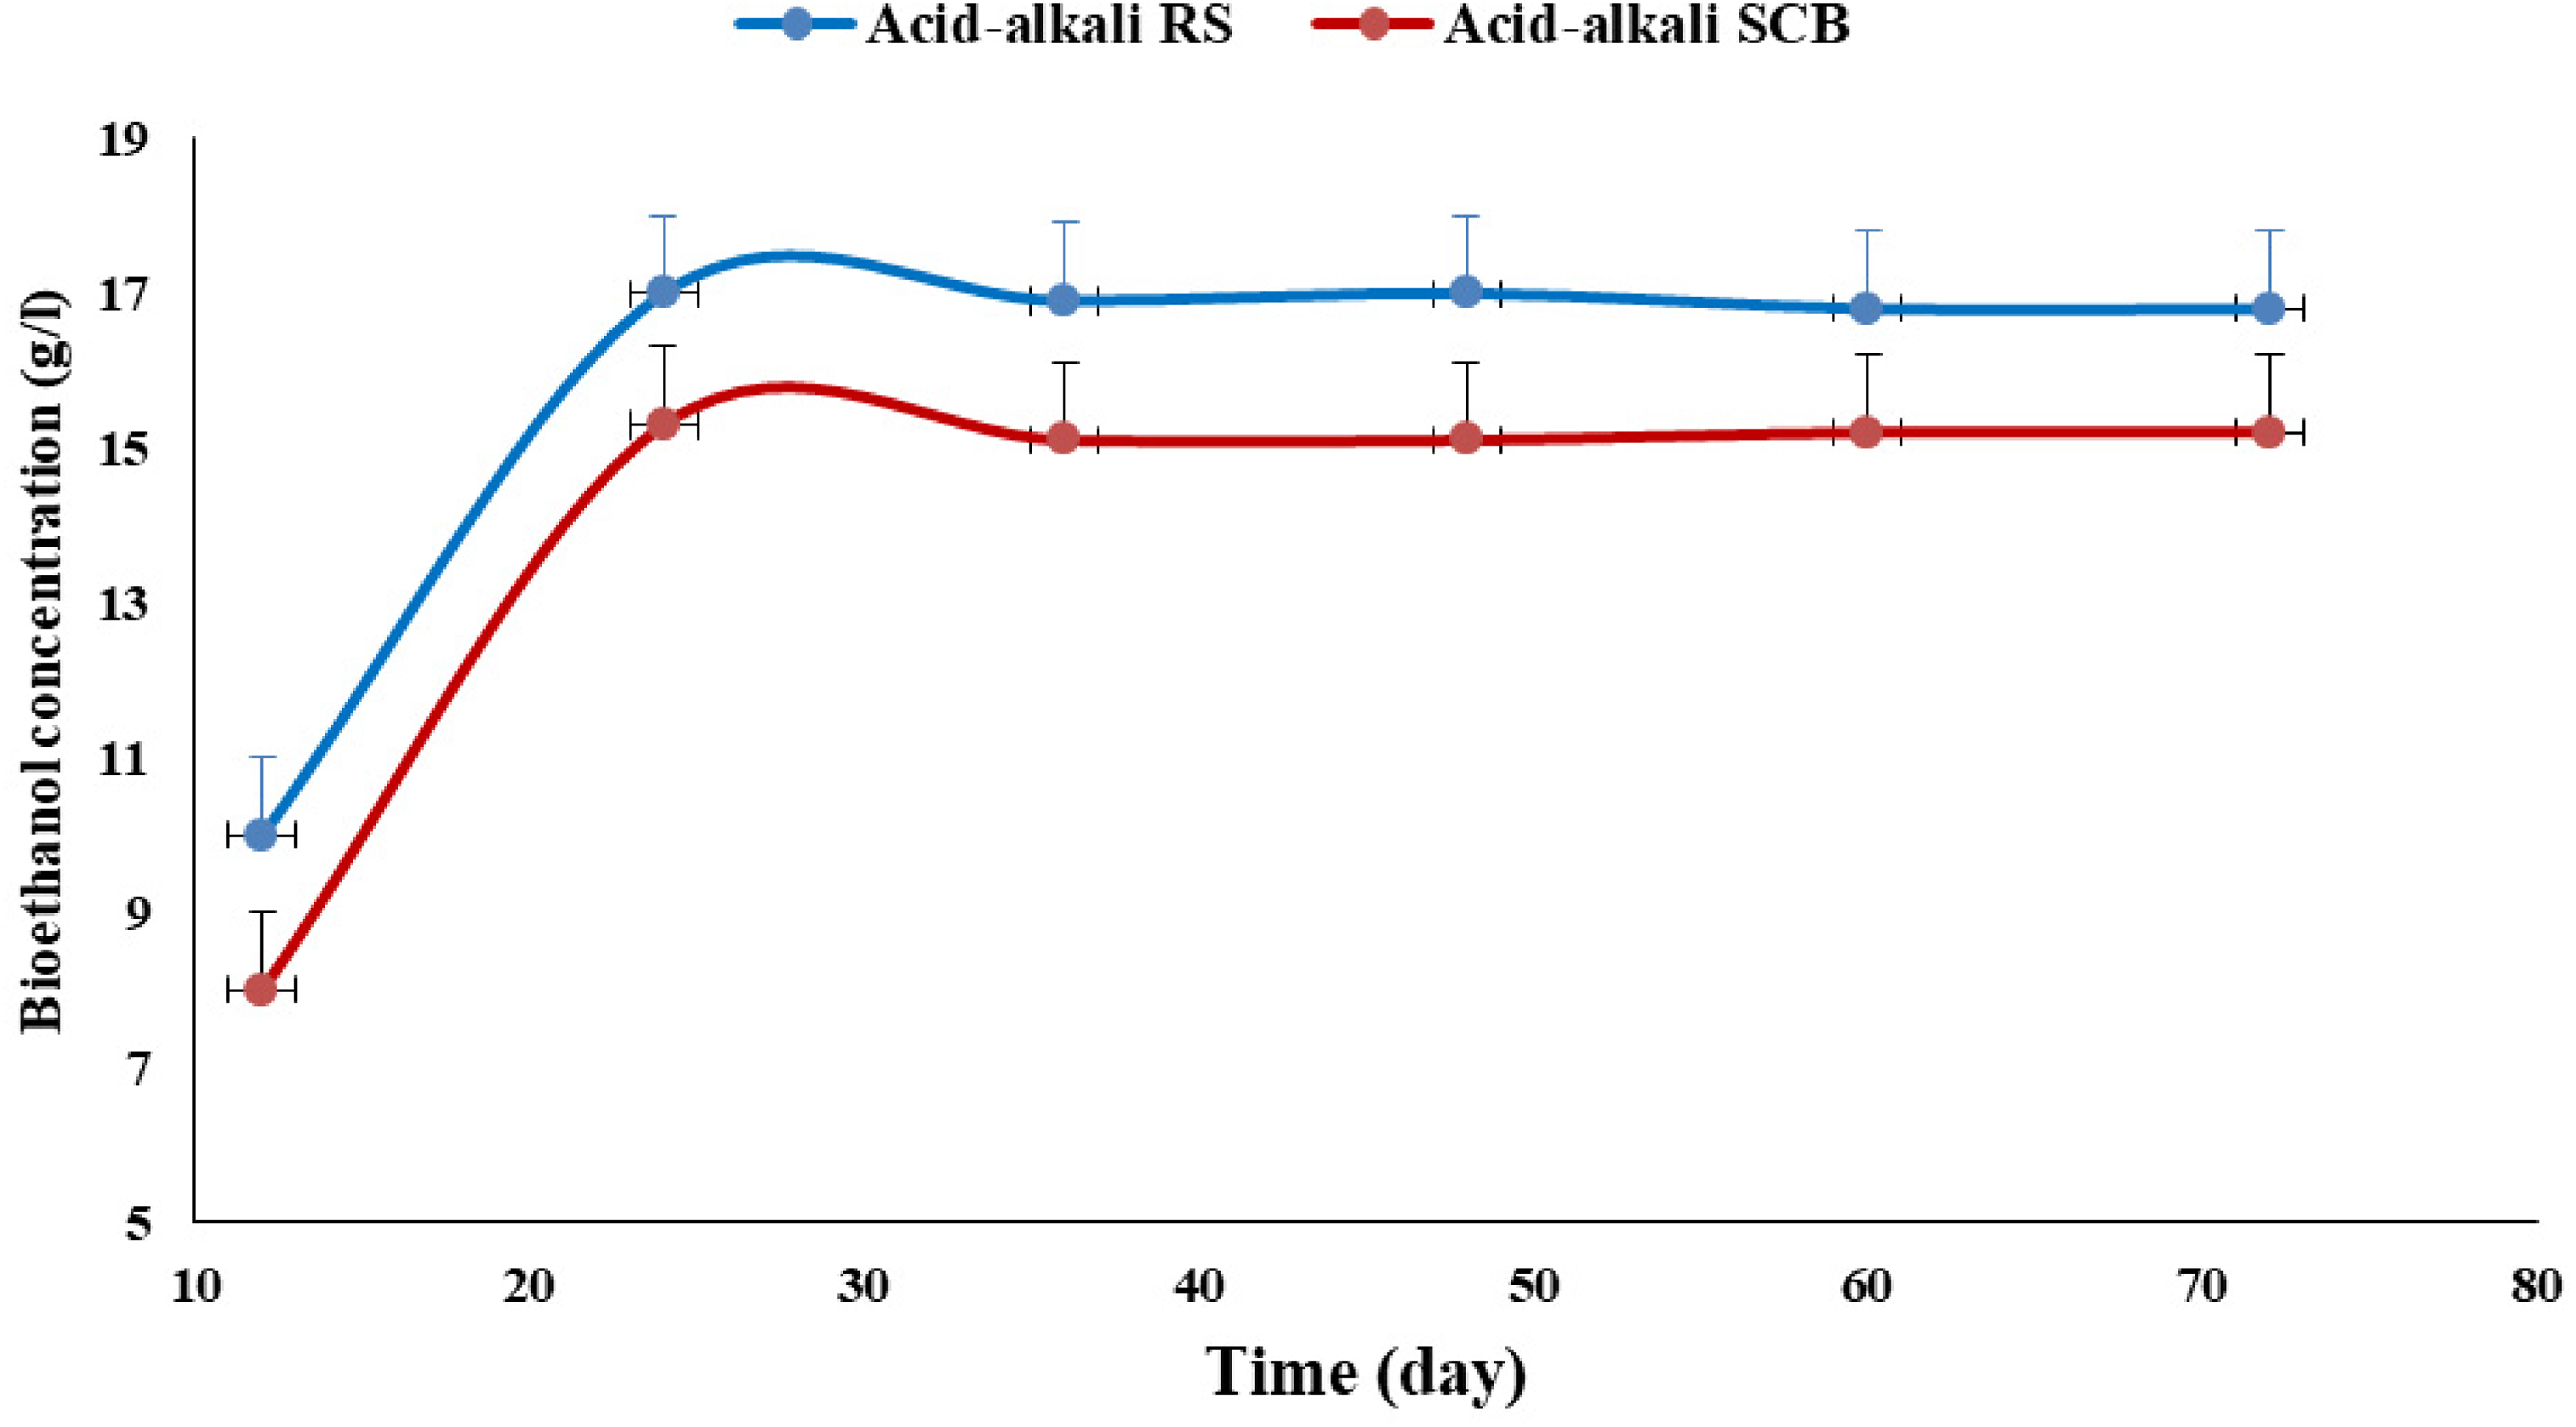
Monitoring of bioethanol production by P. occidentalis AS.2 using enzymatically hydrolyzed RS and SCB for 3 days.
Fermentation using an experimental design
To find the optimal level of each selected variable, a second multifactorial BBD (RSM) was used to achieve the maximum bioethanol production using the enzymatic hydrolysate of acid-alkali-treated RS and SCB as a carbon source and fermentation by P. occidentalis AS.2. The selected variables were pH (X1), temperature (X2), and inoculum size (X3) at three varying levels (−1, 0, and +1), as shown in Table 1. The design matrix of the 15 different examined combinations with the experimental results of the bioethanol production is presented in Table 1 for RS and SCB. All cultures were carried out in triplicate, and the average was used. Data (Table 1) indicated variation in the amount of bioethanol resulting from different trials from 0.09 to 21.5 g/l for RS and 0.07 to 19.4 g/l for SCB. Variation thus had a direct impact of the optimization process on the bioethanol results. The optimal level of each variable was determined, and the effects of their correlations on bioethanol production were visualized by 3D surface plotting curves against any two independent variables while maintaining other variables at the middle levels (Figure 5). These graphs indicated that higher levels of pH promoted high bioethanol production levels. In contrast, higher bioethanol levels were achieved with decreasing inoculum size, especially when temperature and pH levels were higher for RS and SCB. A second-order polynomial equation was fitted to the experimental results of bioethanol production to evaluate the optimal point within experimental constraints, as represented in Equation (4) and (5) for RS and SCB, respectively:
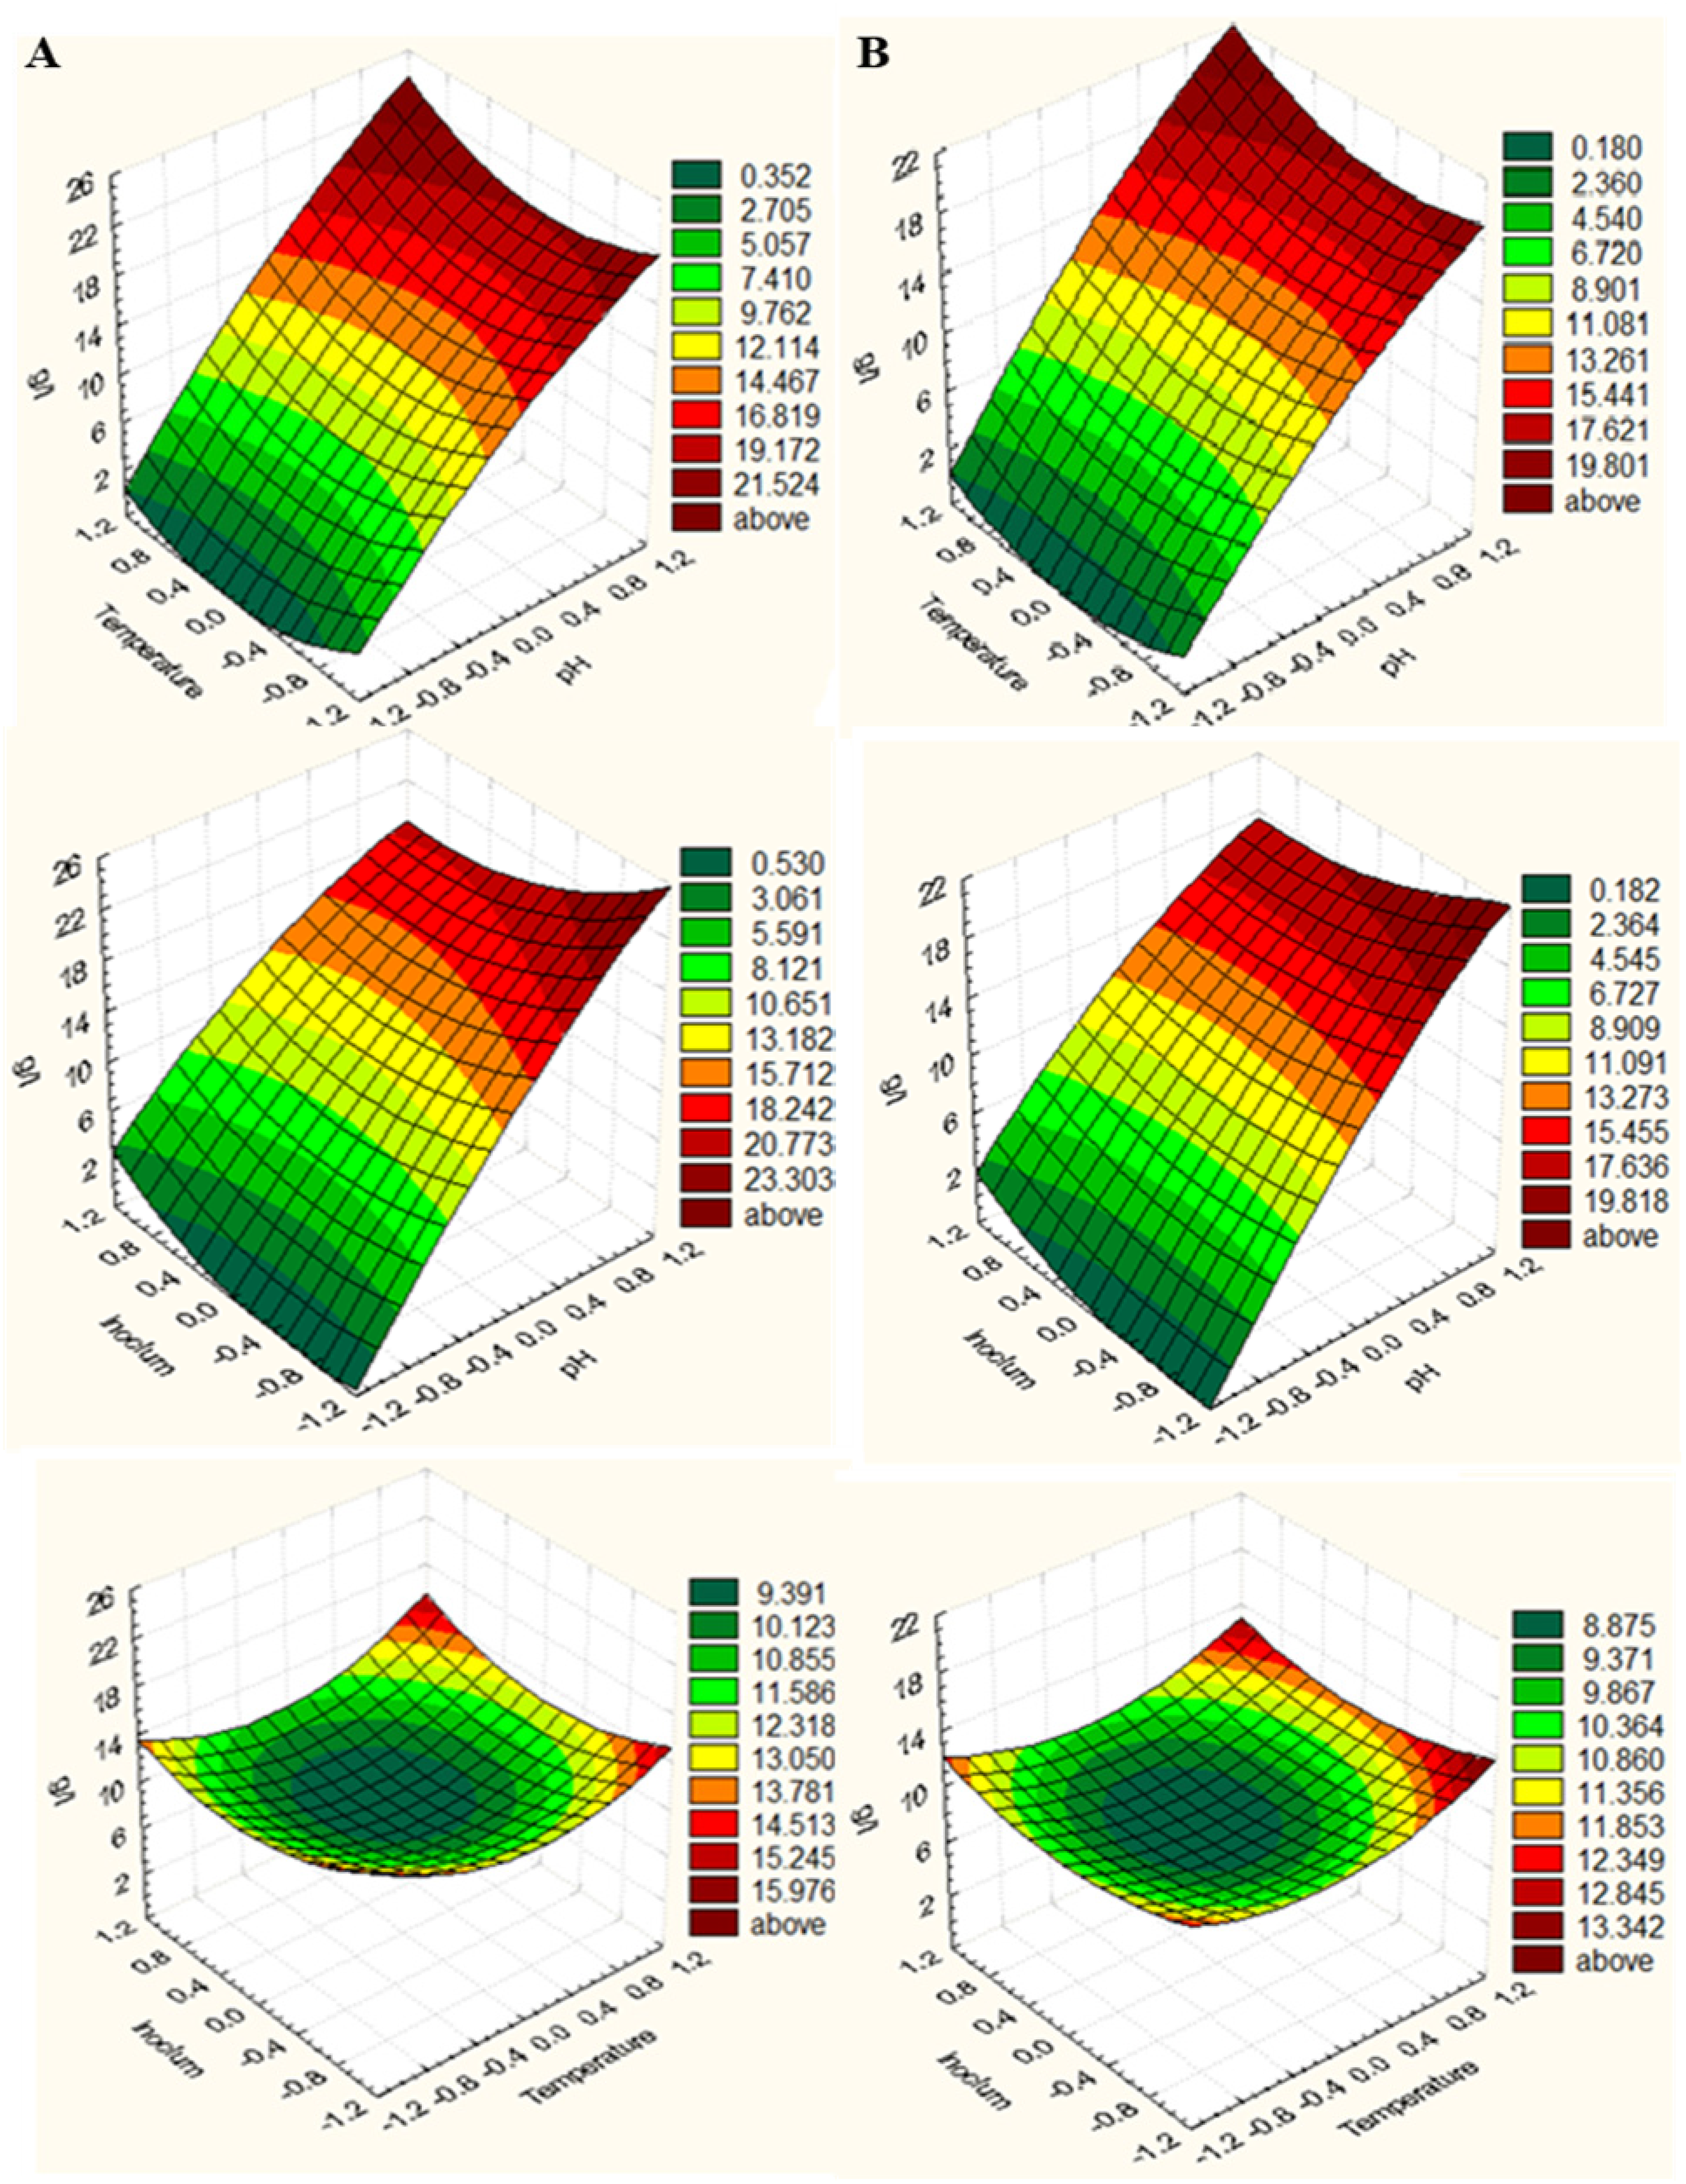
3D Response surfaces representing bioethanol production by P. occidentalis AS.2 as affected by culture conditions for acid-alkali RS (A) and SCB (B).
Equation (4): Polynomial equation for acid-alkali RS

ANOVA for BBD analysis to maximize bioethanol production from RS and SCB.

Model verification
A verification experiment was performed to determine the accuracy of the quadratic polynomial under predicted optimal conditions for evaluating bioethanol production in the optimized medium. After 24 h of incubation time, the estimated bioethanol concentrations were 23.7 and 21.3 g/l for pretreated RS and SCB, respectively. The estimated bioethanol production was 23.7 and 21.3 g/l, where the predicted value from the polynomial model was 24.34 and 22.17 g/l for pretreated RS and SCB, respectively. Thereby, these results mentioned a high degree of accuracy of 97.30% and 96.40% for pretreated RS and SCB, respectively, clear evidence of model validation. The final conditions for bioethanol production used 100 g/l acid-alkali-treated fibers with sodium acetate buffer, sterilization by autoclaving after coiling, with the addition of 10 ml cellulase enzyme at 50 °C for 5 days at 75 rpm to enhance the enzymatic hydrolysis process. After the reaction time and adjusting the pH to 6, the mixture was inoculated with 2.5% P. occidentalis AS.2 at 35 °C for 24 h at 200 rpm to obtain bioethanol. The formula of the optimized medium is as follows: 100 g/l waste, 10 ml cellulase enzyme, 1000 ml sodium acetate buffer (pH 4.7), hydrolyzed at 50°C for 5 days at 75 rpm, inoculum size 2.5%, pH 6, temperature 35°C, 24 h incubation time, and 200 rpm. In addition, bioethanol yield increased by 1.39-fold compared to initial production from both treated RS and SCB. Thontowi et al. 75 reported that bioethanol production from treated SCB was 2.43 g/l after optimization conditions were slightly higher than the predicted value of 2.21 g/l, also much lower than that achieved in this study for SCB. Other studies reported that bioethanol production obtained after optimization-treated grass increased by 1.3-fold than unoptimized production, in agreement with this study. 76 Suriyachai et al. 77 reported a bioethanol concentration of 23.5 g/l from treated RS and fermented by coculture of S. cerevisiae and S. stipitis after optimization depending on RSM, in agreement with this study when treated RS was optimized. Das et al. 78 reported a bioethanol concentration of 40 g/l from RS hydrolyzed by a multizyme complex of fungal origin and optimized by RSM and fermentation was performed by coculture of S. cerevisiae MTCC 173 and Zymomonas mobilis MTCC 2428, higher than that obtained in this study, because the only cellulase enzyme used and the amount of sugar became low compared to a previous study in which fermentation was completed using only yeast P. occidentalis AS.2. Bioethanol production from the optimized medium was higher than the unoptimized medium using the same lignocellulosic materials. This study reported that bioethanol from the final optimized medium (23.7 and 21.4 g/l) was higher than the initial production medium (17 and 15.3 g/l) for both RS and SCB, respectively, in agreement with other studies.27,79,80 Thus, the amount of bioethanol production depends not only on the substrate used but also on the other parameters, such as type of pretreatment, hydrolysis method, and the type of strain responsible for fermentation.
Conclusion
As general knowledge, the traditional pretreatment of lignocellulosic materials is time-consuming, produces inhibitors, and suffers from sugar degradation. In this study, RS and SCB were treated with a combined treatment of acid-alkali and compared to hot water and dilute acid as a conventional pretreatment. The results revealed a very effective and efficient lignin removal process by increasing the α-cellulose and holocellulose contents for both RS and SCB using acid-alkali compared to the other pretreatment used. The successful exploitation of acid-alkali as the best treatment was achieved again by saccharification of pretreated biomass using cellulases. The results showed that the glucose concentration from acid-alkali treatment increased to 68.8%, 40.5%, and 33% for RS and 73.3%, 44%, and 35.2% for SCB compared to raw materials, hot water, and dilute acid treatment, respectively; acid-alkali treatment greatly enhanced the enzymatic digestibility via the structural modification of the biomass. For bioethanol production, P. occidentalis AS.2 was isolated from rotten apple and identified as a bioethanol producer. BBD was applied for both RS and SCB to enhance the fermentation process and increase the bioethanol yield using the recommended treated RS and SCB, where the fold increased 1.39 times compared to the basal condition. To conquer a successful production of bioethanol an availability of a sustainable supply of agrocellulosic biomasses as well as active strain for fermentation are equally important. Inclusive, the current results showed that acid-alkali pretreatment for lignocellulosic material provides a significant production of fermentable sugars during the pretreatment step and that the bioethanol production process depends on the strain type and optimization conditions by statistical designs. So, the final recovered ethanol after fermentation reached to approximately 24% and 21% by weight of the dried RS and SCB, respectively.
Footnotes
Acknowledgements
The author thank the Academy of Scientific Research and Technology for supporting and funding the scholarship entitled “Bioethanol Production, Field: Energy (No. 7), Cycle 3.” The authors also thank Dr Doaa A. Goda and Rania S. Ahmed for the molecular identification and phylogeny of the working isolate and their help in performing the design matrix and data analysis.
Declaration of Conflicting Interests
The author declared no potential conflicts of interest with respect to the research, authorship, and/or publication of this article.
Funding
The author received no financial support for the research, authorship and/or publication of this article.
