



Abstract
The evaluation of reanalysis and analysis data (estimated data) against in-situ measured data is essential to find uncertainties before its use for wind resource assessment. The performance evaluation of four different generations reanalysis datasets (NCEP-CFSR, NCEP-DOE, NCEP-NCAR and JRA-55) and two analysis datasets (NCEP-FNL and NCEP-GFS) was done against measured data for six sites using statistical analysis. A comparison of monthly mean time-series, Weibull probability distribution function and wind rose diagram of measured and estimated data was performed. The MBE and RMSE for wind speed range from −2.18 to 2.01 m/s and 1.34 to 3.00 m/s respectively; whereas MBE and RMSE for wind direction range from −34.34° to 13.90° and 40.58° to 71.28° respectively for six sites using all datasets. NCEP-CFSR data show promising results for most of the sites with the lowest errors and better correlation coefficients. NCEP-CFSR data being the new generation reanalysis having higher spatial resolution show better results compared to other reanalyses and analyses. The reanalysis and analysis wind data can be used as alternative to measured data to assess wind energy potential.
Introduction
Energy is the most important source required for many activities associated with economic growth and development. Fossil fuels are main source of energy to meet electricity demand globally. The major concerns of fossil fuels sustainability are dwindling of resources, fuel price fluctuation and environmental pollution. One of major sources of global warming is CO2 emissions from burning of fossil fuels which contributes towards climate change. The use of clean energy from renewable and sustainable sources is gaining attention globally to cope with environmental issues. 1
The United Nations (UN) General Assembly developed sustainable development goals (SDGs) with the aim to bring a sustainable future for everyone by the end of the year 2030. 2 Two (SDG7 and SDG13) out of 17 SDGs are focused on availability and usage of clean energy from sustainable resources. SDG 7 aims to ensure access to sustainable, reliable, affordable and modern energy for everyone; and to raise the proportion of clean energy resources globally. Target 7.A aims to promote research activities, technology improvements and investments in renewable energy technologies. Target 7.B aims to increase energy services, particularly for developing countries. SDG 13 aims to take urgent actions for regulations of emission control policies and promote renewable energy projects to mitigate climate change impacts.
To achieve SDGs, the use of renewable energy is gaining importance globally. The use of modern renewable energy (solar and wind) is increasing in developed countries whereas developing countries have less focus on it. The global share of renewable energy in 2021 was approximately 30%, the share of European countries is 22%. 3 The share of renewable energy in Asia, particularly South Asian countries, is very low compared to global mean. The global weighted mean Levelized Cost Of Electricity (LCOE) of different renewable sources is presented in Figure 1. Wind is cheapest source of energy among renewable energy resources, the LCOE of onshore wind is lowest among all renewables and is decreased by 56% during last decade. 4 Wind energy is most economical and abundant resource; hence, it is a sustainable and clean energy resource for electricity generation. Wind power projects are sustainable, not only for economic benefits but also for environmental benefits. The onshore wind power has lowest environmental impacts according to quantification criteria of Life Cycle Assessment, hence, the development and installation of onshore wind projects have higher acceptance rates. 5 The energy policy and planning for onshore wind projects have a direct influence on local and regional environmental impacts.
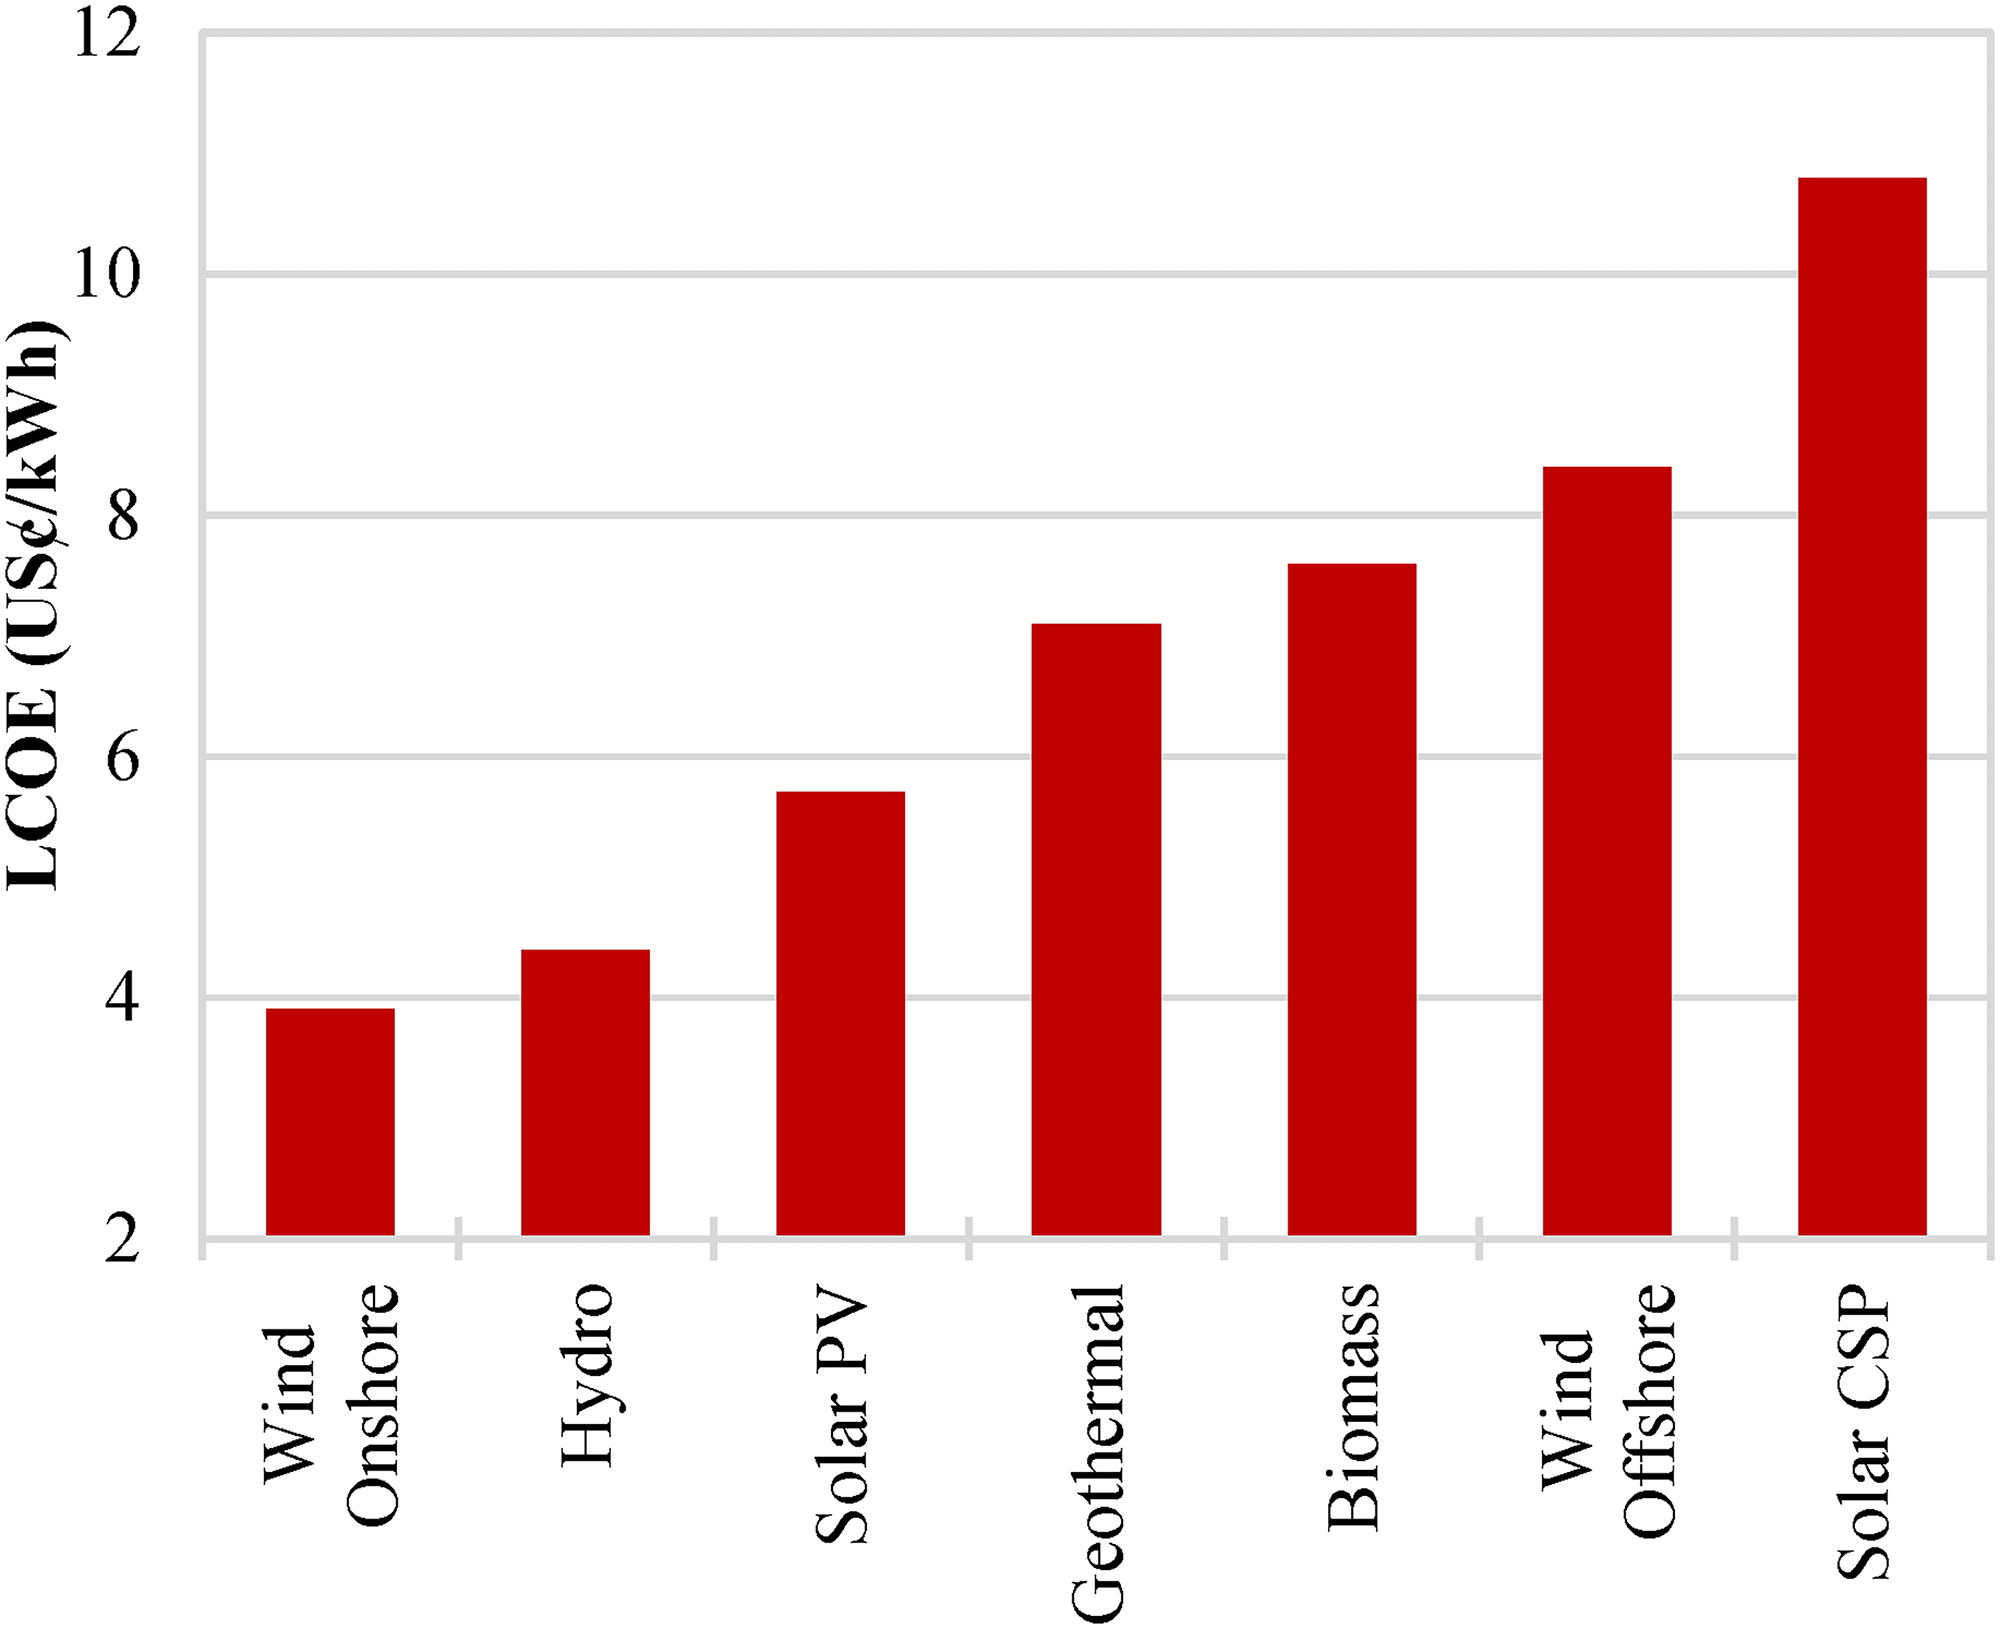
The global weighted LCOE of different energy resources by the end of 2020. 4
Wind energy is pivotal for sustainable and economical energy generation, being abundantly available in most regions. Due to high resource availability and technology maturity, wind energy is an important renewable to fulfil commitments of the Kyoto Protocol. 6 Climate change, energy security and energy access make persuasive cases for utilizing readily available wind energy globally. Wind variation at different places and times (annual, seasonal, monthly and diurnal basis) signifies the need to assess wind power potential for a region and power generation capacity at available time step. 7 Minor inaccuracies in wind speed could cause large deviations in power output due to the cubic bond association of these parameters. 7 Precise assessment of wind potential at any location is foremost important to investigate the installation of wind energy technologies suitable for the respective region.
Multi-decadal data is required for wind resource assessment as underlying meteorological potential does not remain constant over time. 8 The most reliable source of data is accurate ground measurements which is collected by installing a wind mast. Measured wind data collection is a costly process due to the increasing height of meteorological masts (onshore and offshore), its planning, installation and maintenance issues; consequently, long-term wind measurements are usually unavailable for most of the potential sites. The in-situ measurements available for a site are variable both in time and space that may not be representative of regional wind regime. 9 The average cost of in-situ measured wind data for one location in Pakistan was approximately USD 40,000 per year for a recent project by the Energy Sector Management Assistance Program (ESMAP) of the World Bank. 10 There is a chance of large amount of investment irreversibly being lost if mast measured data reveal a low wind potential at a site.
The preliminary resource assessment of a potential site using other sources of wind data (preferably free-of-cost) is necessary before the installation of a wind measurement mast. These alternative sources include data by numerical weather predictions (NWP), satellite, analysis and reanalysis data. Satellite-derived wind data offer high spatial and temporal resolution, but data is costly and not available globally. NWP models, in the particular region provide relatively lower spatial and temporal resolution data, however, the NWP modelled data show non-negligible errors in estimations. Reanalysis and analysis datasets combine observations with NWP data, providing a homogenous synthesis of wind observations assimilated in physical scheme. Reanalysis and analysis datasets provide free-of-cost long-term wind data globally which can be used for preliminary resource assessment of a potential site without installation of meteorological mast. This fact signifies the importance to explore and validate alternative wind data sources providing long-term data globally.
Reanalysis and analysis datasets are the combination of data obtained from the Global Circulation Model (GCM) with observations assimilated into continuous and coherent physical model. 11 The NCEP (National Centers for Environmental Prediction), JMA (Japan Meteorological Agency), NASA (National Aeronautics and Space Administration) and ECMWF (European Center for Medium-Range Weather Forecasts) are organizations that provide long term reanalysis and analysis wind data. All global datasets assimilate large number of meteorological measurements usually required for a complete physical model. However, these datasets have some discrepancies related to low spatial resolution, inaccurately characterized local wind potential and sometimes fail to represent complete meteorological features (medium and small scale). Inaccuracies in reanalysis and analysis products can result in erroneous power output estimations. Hence, it is essential to evaluate the accuracy of these datasets allowing their use in future applications in those regions where no surface measured data exists.
Three global reanalysis datasets are produced by NCEP in collaboration with other organizations in USA; National Centre for Atmospheric Research (NCAR) and Department of Energy (DOE).12,13 The reanalysis datasets by NCEP are NCEP-CFSR (third generation), NCEP-DOE (second generation) and NCEP-NCAR (first generation). The JRA-55 is newer version of reanalysis by JMA. 14 Two analysis datasets are produced by NCEP which are NCEP-GFS and NCEP-FNL. The datasets use observations in their NWP models, these observations are recorded worldwide by different organizations, the availability and accuracy of these observations determine the accuracy of reanalysis or analysis product for a specific region. The performance evaluation of different metrological products by these datasets in different regions of the world has been reported in the literature. 15
The comparison of the datasets with surface measured wind data offers a broad reference for the performance of the datasets. Such evaluations have been reported in the literature based on sub-daily data. Smith et al. 16 reported evaluation of NCEP-NCAR for eight different vessels for wind speed. An analysis of NCEP-NCAR sub-daily data has been reported at four different sites in the Mediterranean basin by Ruti et al. 17 Gholami et al. 18 evaluated NCEP-DOE and NCEP-FNL data over the Persian Gulf for 23 weather stations at 10 m height. Carvalho et al. 19 evaluated two of the concerned datasets (NCEP-DOE and NCEP-CFSR) for the region along the Iberian Peninsula coast using sub-daily statistical analysis and probability distribution curves. The same error metrics have been reported for the performance evaluation and comparison of satellite-retrieved, analysis and reanalysis datasets against surface measured data for the Iberian Peninsula coast, using NCEP-CFSR, NCEP-DOE, NCEP-FNL and NCEP-GFS. 20 In another study, Carvalho et al. 21 discussed the evaluation of NCEP-CFSR, NCEP-DOE, NCEP-FNL and NCEP-GFS for different locations in the Portugal region. Abdurrahim et al. 22 performed the comparison for NCEP-NCAR at five different sites of France using sub-daily wind speed data at 10 m height. Miao et al. 23 evaluated NCEP-CFSR and JRA-55 for the northern hemisphere. NCEP-CFSR and JRA-55 were evaluated for four sites in the Amundsen Sea Embayment, Antarctica by Jones et al. 24
The performance of analysis or reanalysis datasets varies from location to location due to the availability of observational data used in assimilation systems as reported in previous studies. 21 Datasets performing good in European conditions may not perform equally good for the South Asian region, the observations assimilated in Numerical Weather Prediction (NWP) models are usually unavailable for South Asia, this signifies the need to evaluate reanalysis and analysis products for respective regions. The electricity generation from renewable sources of South Asian countries is very low and one of the reasons is the unavailability of bankable data. Most developing countries are at the initial stages to exploit wind energy potential and the availability of long-term measured wind data is hindered for the development of wind energy projects. The information about the uncertainty of free-of-cost wind data is helpful for researchers and experts to use it for initial wind resource assessment for potential sites which is also an aim of SDGs.
The evaluation of analyses and reanalyses data using measured data for wind resource assessment has not been reported extensively for South Asia, except for few regions in India. 25 No study was found objectively assessing the global analyses and reanalyses data to evaluate which is suitable alternative to measured data for Pakistan. This study evaluates six global datasets, four reanalyses (NCEP-CFSR, NCEP-DOE, NCEP-NCAR and JRA-55) and two analyses (NCEP-FNL and NCEP-GFS) for six sites in the Gharo-Keti Bandar wind corridor and Jhimpir region of Sindh province of Pakistan using high-quality mast measured data. The evaluation is performed on six-hourly data (wind speed and direction) using statistical parameters. The measured wind speed data is compared with estimated data (analysis and reanalysis) using monthly mean time-series and Weibull probability distribution function. A comparison of estimated wind direction along wind speed using wind rose was performed against measured data. The suitability of reanalysis or reanalysis wind data is determined for potential sites near the coastal line of Pakistan (with diverse terrain) using the extensive methodology. This study will be a contribution towards the wind resource assessment for the potential regions in Pakistan using reanalysis or analysis data, that has not been investigated previously. The objectives of this study are linked with the UN's SDGs to promote usage of renewable energy resources, and to provide clean, economical and sustainable electricity to all. The methods proposed in this study can be used by researchers for initial resource assessment. Moreover, the preliminary resource assessment using best dataset with known uncertainty can be used to identify potential sites to save the cost of wind data measurement and time.
Wind data
Global datasets
Four global reanalysis datasets (NCEP-CFSR, NCEP-DOE, NCEP-NCAR and JRA-55), and two analysis datasets (NCEP-FNL and NCEP-GFS) were evaluated. These datasets have different temporal resolution, spatial resolution and data assimilation systems. Five datasets are produced by NCEP in collaboration with other organizations, whereas one dataset is produced by JRA. The wind data from these datasets are available for different pressure levels but wind data at 10 m height was used in this study. The details of these datasets, temporal resolution and spatial resolution (latitude° × longitude°) of wind data are presented in Table 1.
Details of reanalysis and analysis datasets.

NCEP-NCAR reanalysis (also known as R-1) is the first-generation global reanalysis dataset released in 1995 by the NCEP in collaboration with the NCAR. This dataset features 3-D variational assimilation process and observational coverage importantly based on rawinsonde observations than surface observations, more details about this dataset are presented in Refs.12,32 A substantial number of errors reported in this reanalysis affected its usability in climatic analysis. These inevitable errors were related to variation in observing system, model representation, human errors, and data assimilation system. This data is used for wind resource assessments due to its global availability since it is available. 33 The wind data is available at 17 pressure levels, 10 m height plus other surfaces and layers. Foussekis and Garakis 34 used this dataset at a surface pressure of 99.5% for standard atmospheric conditions and at the height of 42 m and 10 m.
NCEP-DOE reanalysis (also known as R-2) is the second-generation global reanalysis dataset released in 2001 by the NCEP in collaboration with the DOE, USA. NCEP-DOE is an improved version of NCEP-NCAR reanalysis.12,32 NCEP-DOE uses updated data assimilation system with an improved version of the General Circulation Model (GCM) with most of the identified errors fixed and providing better assimilation of the observational data. This version includes updated forecast model with new model parameterization, more details in Ref. 35 The wind data is available at 17 pressure levels, 10 m height plus other surfaces and layers.
NCEP-CFSR (Climate Forecast System Reanalysis) is the third-generation reanalysis dataset by NCEP released in 2009. This is improved version by NCEP with higher resolution, improved assimilation systems and atmosphere-sea-ocean-land-ice coupling scheme. NCEP-CFSR has the highest spatial resolution of all reanalysis products by NCEP, other exclusive feature of this dataset is use of variational bias correction technique employed for the enhancement and adjustment of biases relevant to the reanalysis wind data. The first version of this dataset was for duration of 31 years from 1979 to 2009 extended to March 2011, whereas its second version (CFSv2), was put into operation in March 2011. 36 The wind data is available at 40 pressure levels, 10 m height plus other surfaces and layers.
NCEP-GFS (Global Forecast System) is global numerical weather forecast system produced by NCEP, released in 2004, the operation model consists of forecast and analysis. This model runs four times every day and produces forecast up to 16 days in advance. This prediction scheme uses coupling of land, atmosphere, ice, and ocean models for better prediction of weather parameters. Despite the fact of fast availability of this analysis, it assimilates less data as compared to a reanalysis. The wind data is available at 26 pressure levels, some sigma levels, 10 m height plus other surfaces and layers.
NCEP-FNL (Final) is an operational global analysis by NCEP released in 2000, this product is from the Global Data Assimilation System (GDAS) that collects data from GTS (Global Telecommunication System) and other sources. The FNL is produced using same model used by NCEP for GFS but the difference is that NCEP-FNL runs three hours past NCEP-GFS so more observational data available to include. NCEP-FNL can be considered a valid option in case of real-time applications in mesoscale models because of its quicker availability. 20 The wind data is available at 26 pressure levels, some sigma levels, 10 m height plus other surfaces and layers.
The JMA produced JRA-55 (Japanese 55 years Reanalysis), is third-generation and the longest-running reanalysis with full observing system after finding many deficiencies in its first project JRA-25. The data assimilation system used for JRA-55 production is more advanced (4-DVAR vs. 3-DVAR) operational system, December 2009 version of JMA with increased model resolution. 37 Its data assimilation process was initiated in 2010 and completed in early 2013 and subsequently, it is continued as a new JCDAS (JMA Climate Data Assimilation System) on a real-time basis. The wind data is available at different pressure levels and 10 m height.
Measured data
The mast measured wind data used in this study was taken from six wind measurement masts in the high wind potential region of Pakistan. Three masts were installed at commercial wind power plants; Foundation Wind Energy–II Limited (FWE), Younus Energy Limited (YE) and Fauji Fertilizer Company Energy Limited (FFC). Three masts were installed at potential sites by the Alternative Energy Development Board (AEDB) of Pakistan in collaboration with the United Nations Development Programme (UNDP); Keti Bander (KB), Hawkesbay (HB) and Baburband (BB). The geographical locations of these masts are presented in Figure 2. The geographical coordinates, data measurement duration, mean wind data (speed and direction) at height of 10 m for the sites is presented in Table 2. The details about data measurement and site specifications are presented in Ref. 38
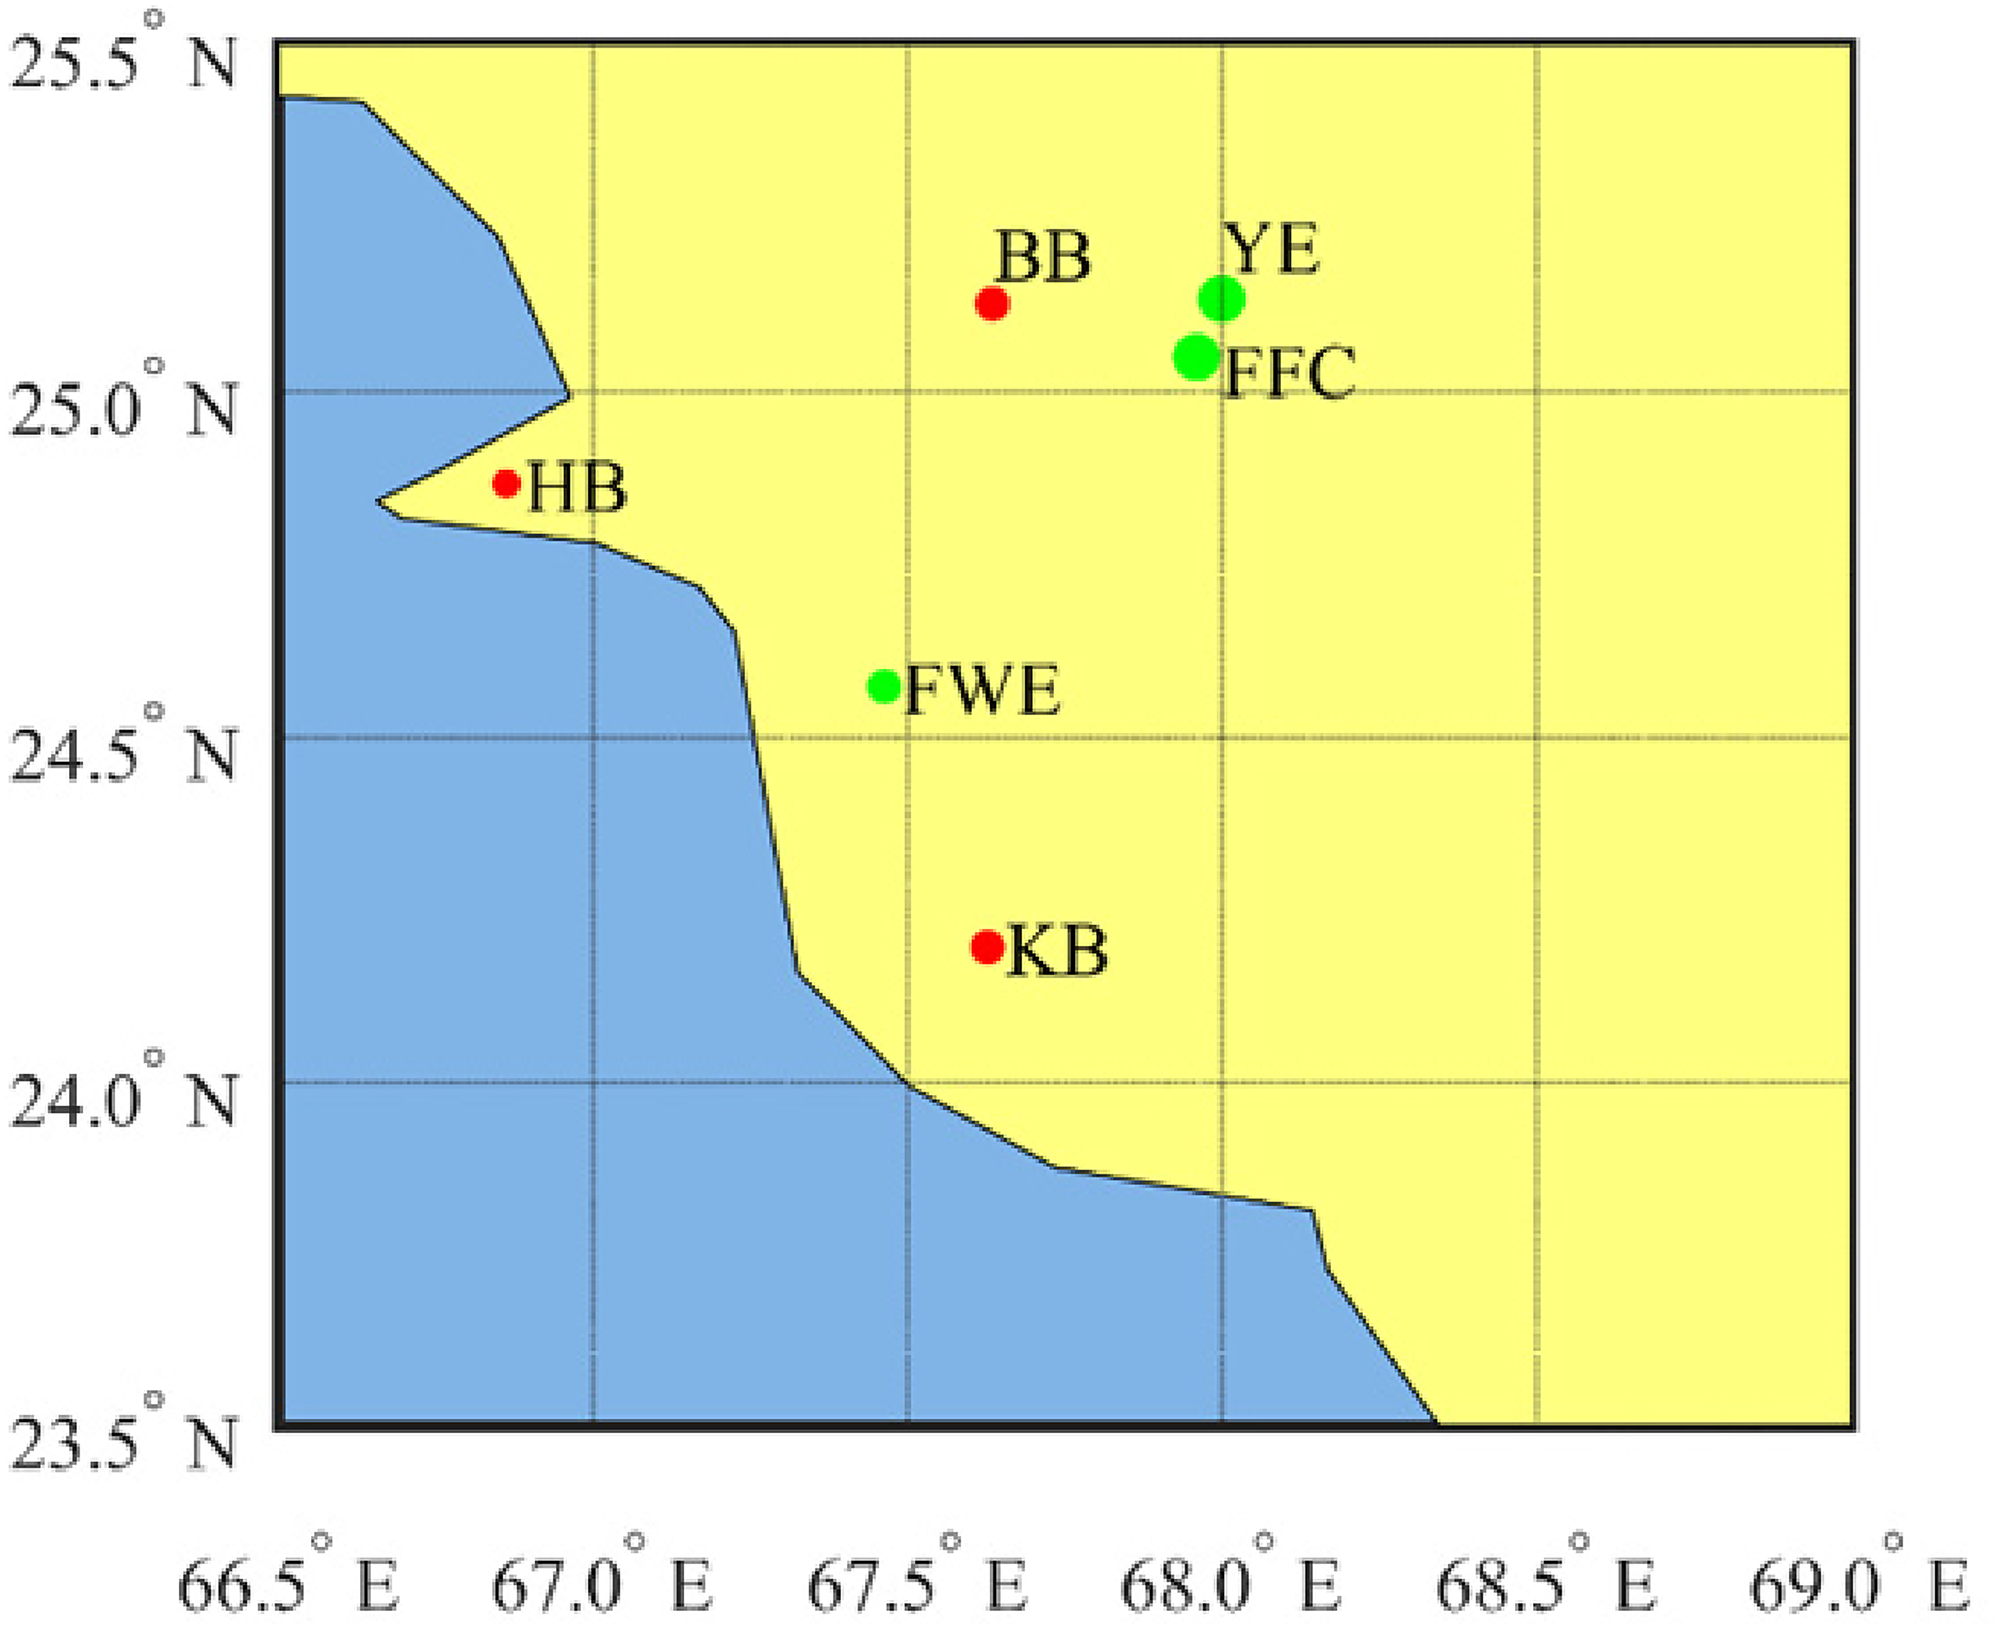
Geographic locations of wind measurement masts.
Geographical location, details of wind data duration and wind data characteristics of six sites.
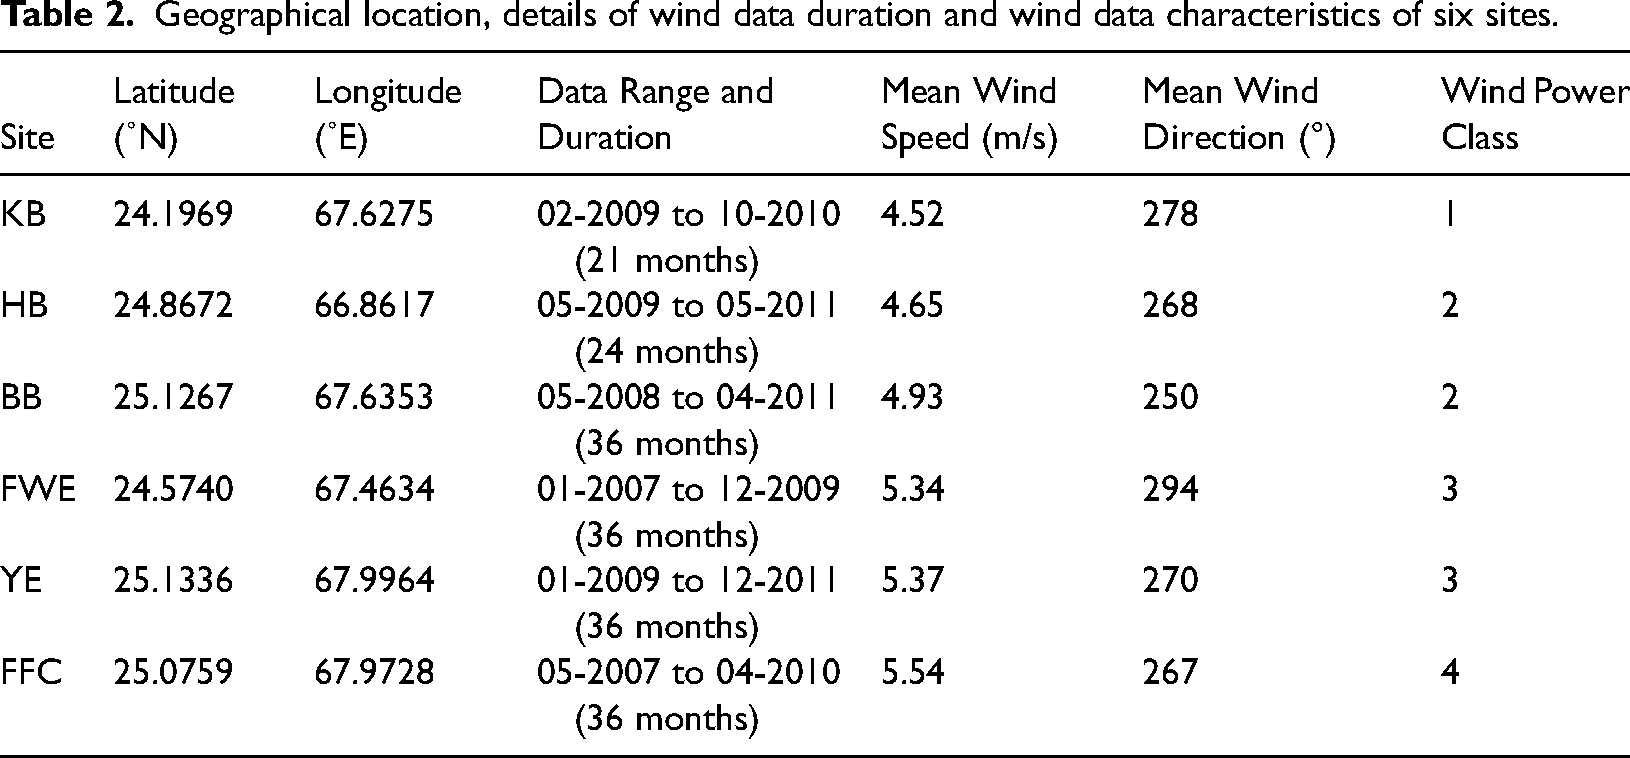
The wind resource of a site is dependent on geographical conditions and is classified in terms of wind power classes based on annual mean wind power density or annual mean wind speed. The wind power classes defined on basis of annual mean wind speed at 10 m height by the National Renewable Energy Laboratory (NREL) of the USA are Superb (Class 7), Outstanding (Class 6), Excellent (Class 5), Good (Class 4), Fair (Class 3), Marginal (Class 2) and Poor (Class 1) for wind speed range of 7.0−9.4, 6.4−7.0, 6.0−6.4, 5.6−6.0, 5.1−5.6, 4.4−5.1 and 0−4.4 m/s respectively. 39 The wind power class of the sites is presented in Table 2.
Methodology
The evaluation of analysis and reanalysis (estimated) wind data was performed against measured data using statistical analysis and comparison of Weibull probability density function, monthly mean time-series and wind rose diagram. The temporal resolution of estimated data is same (six hours) whereas spatial resolution is different. The temporal resolution of the measured data was 10-min which was averaged to six-hourly data for comparison with estimated data.
The wind data from reanalyses and analyses datasets is available as u-component (northward) and v-component (eastward) of wind speed time-series. The wind data at 10 m height was downloaded from the webpages mentioned in Table 1 as netCDF file format for grid points covering all sites. The u-component and v-component were computed at mast location (latitude and longitude) using inverse weighted-distance bilinear interpolation technique using four closest grid points.17,20 The wind data time-series was converted from Cartesian form (u-component and v-component) to Polar form (wind speed and wind direction).
The statistical analysis has been commonly employed for the comparison of estimated wind data with measured wind data.15,19,20,23,40 The statistical parameters for wind data (speed and direction) are; mean bias error (MBE), mean absolute error (MAE), root mean square error (RMSE), standard deviation error (STDE) and correlation coefficient (R). Same parameters have also been reported by Mahmoodi et al., 41 Nagababu et al. 42 and Tahir et al. 43 These parameters for wind speed were calculated using Equation (1) through Equation (4) respectively, where Ue,i and Um,i are measured and estimated wind speed respectively.
The wind direction is a circular variable, the difference of estimated and measured wind direction must not be more than ± 180°. A positive bias represents deviation in clockwise and negative bias represents deviation in anti-clockwise of estimated wind direction against measured wind direction. The expressions to calculate statistical parameters for wind direction are different,44,45 so the difference of wind direction should lie in range of ± 180°. The MBE, MAE and RMSE for wind direction were calculated using Eq. (5) through Eq. (7) respectively, where θ
e,i
and θ
m,i
are measured and estimated wind direction respectively.






The Weibull Probability Density Functions (PDFs) are widely used to show wind speed distributions based on their accuracy to fit measured data, simplicity, and flexibility.
19
The probability density function, f(v), given as Equation (8) is quantified in terms of two parameters to fit the wind speed data; k as shape parameter and A as the scale parameter. The scale factor (A) is most probable wind speed and shows how windy a site is. The shape factor (k) is a dimensionless quantity and shows the wideness of wind distribution and can be interpreted as the standard deviation of wind speed.
54
There are several approaches to estimate parameter k and parameter A; graphical method, least square method, maximum-likelihood method and Wind Atlas Analysis and Application Program (WAsP) algorithm. The maximum likelihood method was used in this study, this method was widely reported in the literature related to wind resource assessment.55–57 The PDF of measured wind speed and estimated wind speed for a site was plotted and compared. The peak of PDF curve of estimated data to the left of measured data shows underestimation and vice versa.
The wind direction at a site is an important factor for the layout of wind turbines for commercial applications. Wind direction fluctuations at a site are caused by atmospheric circulation and geographical features. Wind direction and wind speed frequency are usually represented on single plot as wind rose diagram. Wind direction and wind speed can be presented on the wind rose diagram by several methods, commonly used is wind direction versus wind speed frequency using suitable number of sectors (usually 12 sectors for wind direction). The wind rose for measured and estimated data using 12 sectors of wind direction were plotted to visualize deviation of estimated wind data compared to measured data.
Results
Statistical analysis
The statistical parameters for wind data (speed and direction) between estimated datasets and measured data are presented in this section. These parameters for six sites using six datasets are presented in Table 3, the best values are highlighted as bold (lower errors and higher correlation coefficient).
Statistical parameters for wind speed and wind direction using six-hourly data.

The MBE, MAE, RMSE and STDE values of NCEP-NCAR wind speed for all six sites range from −1.61 to 0.7 m/s, 1.35 to 1.98 m/s, 1.71 to 2.45 m/s and 1.68 to 1.85 m/s respectively. The performance of NCEP-NCAR is best for FWE among all datasets. The dataset shows the lowest RMSE of wind speed for site FWE which is indicative of effective incorporation of large errors by the reanalysis dataset. The MBE, MAE, RMSE and STDE values for wind direction range from −34.34° to 4.34°, 36.83° to 56.15°, 49.54° to 71.28° and 39.21° to 66.41° respectively. The value of R for wind speed and wind direction is in the range of 0.70 to 0.72 and 0.24 to 0.53 respectively. The estimated wind speed was underestimated for all sites except KB and wind direction showed clockwise deviation for BB only. Among all sites, the performance of NCEP-NCAR is best for HB whereas worst for FFC site. Based on statistical analysis NCEP-NCAR does not show promising results among all datasets, both for wind speed and wind direction.
The MBE, MAE, RMSE and STDE values of NCEP-DOE wind speed range from −0.34 to 2.01 m/s, 1.48 to 2.5 m/s, 1.94 to 3.0 m/s and 1.91 to 2.23 m/s respectively for all sites. NCEP-DOE gives the lowest MBE for BB, FFC, FWE and YE while for KB it shows largest MBE among all the datasets. The difference between MBE and MAE values is large which shows that there is both underestimation and overestimation in different seasons. The MBE, MAE, RMSE and STDE values for wind direction range from −31.22° to 6.45°, 35.67° to 53.80°, 47.52° to 69.02° and 38.25° to 65.01° respectively. NCEP-DOE shows the worst results after NCEP-NCAR for wind direction based on all statistical error metrics. The value of R for wind speed and wind direction ranges from 0.70 to 0.76 and 0.21 to 0.48 respectively. For both wind speed and direction, the results of NCEP-DOE and NCEP-NCAR are close except the values of MBE and R. NCEP-DOE shows promising results for sites FFC and YE based on statistical parameters. Among all datasets, the performance of NCEP-DOE is best for FFC and worst for KB site.
The values of MBE, MAE, RMSE and STDE for NCEP-CFSR wind speed range from −1.53 to 0.51 m/s, 1.02 to 1.83 m/s, 1.34 to 2.28 m/s and 1.34 to 1.77 m/s respectively. NCEP-CFSR shows minimum MBE for HB as compared to other sites. The STDE is minimum for site HB and KB shows that NCEP-CFSR gives less dispersion of error among other datasets for these sites. NCEP-CFSR wind data shows the best values of statistical parameters (least errors) for sites HB and KB. The MBE, MAE, RMSE and STDE values for wind direction range from −21.29° to 13.90°, 26.88° to 48.54°, 40.58° to 65.06° and 34.70° to 62.32° respectively. NCEP-CFSR wind direction data provides the best results for sites HB, KB, FFC and YE based on statistical errors. The value of R for wind speed and wind direction ranges from 0.68 to 0.79 and 0.49 to 0.72 respectively. NCEP-CFSR wind speed data shows highest value of R for site HB while for direction the results for FFC site are relatively good. For both wind speed and wind direction, NCEP-CFSR shows promising results for two sites, HB and KB compared to all datasets. The model of NCEP-CFSR includes an exclusive feature of variational bias correction technique with high-resolution model, so the errors are relatively low compared to other datasets.
The values of MBE, MAE, RMSE and STDE for NCEP-GFS wind speed range from −2.13 to −0.01 m/s, 1.28 to 2.36 m/s, 1.61 to 2.93 m/s and 1.61 to 2.01 m/s respectively. Overall results of NCEP-GFS are not quite promising except MBE (−0.01 m/s) at the site KB which is least among all other datasets and sites. Compared to NCEP-FNL, NCEP-GFS shows slightly better results based on all statistical error metrics, while results are worst compared to all other datasets. The MBE, MAE, RMSE and STDE values for wind direction range from-22.00° to 6.55°, 26.76° to 50.61°, 42.02° to 66.19°and 36.94° to 62.62° respectively. For wind direction, NCEP-GFS shows second-best results compared to all the datasets. The value of R for wind speed and wind direction of NCEP-GFS ranges from 0.58 to 0.68 and 0.53 to 0.67 respectively. The best correlation is observed for site BB both for wind speed and wind direction. NCEP-GFS does not show many promising results compared to other datasets.
The values of MBE, MAE, RMSE and STDE for NCEP-FNL wind data range from −2.18 to 0.17 m/s, 1.30 to 2.40 m/s, 1.64 to 2.98 m/s and 1.63 to 2.03 m/s respectively. The MBE, MAE, RMSE and STDE for wind direction range from −23. 28° to 3.46°, 25.71° to 50.57°, 41.39° to 65.84° and 36.49° to 61.59°respectively. The value of R for wind speed and wind direction is in the range from 0.59 to 0.70 and 0.53 to 0.69 respectively. For wind speed, NCEP-FNL shows the highest value of R for site FWE while for other sites it shows similar correlation as NCEP-GFS does. The overall results of NCEP-FNL are similar to NCEP-GFS except for site BB where the performance of NCEP-FNL is best among all datasets for wind direction.
The values of MBE, MAE, RMSE and STDE for JRA-55 wind speed range from −1.87 to −0.28 m/s, 1.18 to 2.01 m/s, 1.50 to 2.42 m/s and 1.33 to 1.62 m/s respectively. The STDE values are least for JRA-55 which shows the existence of constant error for most of the sites. For all the six sites under study, the values of MBE, MAE, RMSE and STDE for wind direction range from −20.89° to 3.72°, 26.59° to 51.00°, 42.12° to 65.93° and 36.58° to 63.48° respectively. JRA-55 shows the least MBE value for the sites of KB and FWE compared to the rest of the datasets. The value of R for wind speed and direction ranges from 0.72 to 0.84 and 0.14 to 0.62 respectively. JRA-55 data is in good agreement with measured data of wind direction.
The datasets show an underestimation of wind speed for most of the sites except NCEP-DOE which shows overestimation. NCEP-NCAR, NCEP-CFSR and NCEP-FNL show overestimation for site KB. For wind direction, all datasets show the tendency of an anti-clockwise deviation relative to the surface measured data for all sites except BB. Based on statistical analysis overall performance of NCEP-CFSR is better for six sites, followed by JRA-55. The overall difference of MBE and MAE for datasets shows both underestimation and overestimation for whole duration of data. This signifies need of assessment of datasets on monthly basis to understand climatic irregularities which play considerable role in the performance of datasets during different seasons.
Monthly mean time-series comparison
The wind speed and direction vary with time due to changes in climate conditions (variation in air temperature, humidity and pressure), so the wind resource does not remain the same throughout the year for a specific location. The monthly time-series analysis is an effective way to analyze the effects of seasonal changes in climatic conditions. The comparison on monthly basis was performed to quantify the performance of reanalysis datasets due to seasonal changes over the year. The energy demand for a region also changes throughout the year according to weather conditions. The dataset providing accurate prediction of monthly and seasonal wind potential can improve the estimation of wind power generation and allow the electric grid to manage demand and resources appropriately.
The monthly mean daily and annual mean daily wind speed were calculated from 10-min data using Windographer software. The annual mean daily wind speed for KB, HB, BB, FWE, YE and FFC is 4.31, 4.65, 4.97, 5.40, 5.36 and 5.62 m/s respectively. The monthly mean daily wind speed for KB, HB, BB, FWE, YE and FFC ranges from 3.08 to 6.09, 3.32 to 6.14, 3.43 to 7.23, 3.53 to 7.76, 3.74 to 7.79 and 3.68 to 8.57 m/s respectively. The monthly mean time-series for six sites at 10 m height for the duration mentioned in Table 2 is shown in Figure 3. The monthly mean time-series are frequently used for the preliminary assessment of potential sites. Air temperature changes from season to season generally affect the wind speed and wind direction. The monsoon season in Pakistan (from June to September) brings strong wind system. Tropical storms are from late April to June in summer and then September to November which affect the coastal areas of Pakistan. The seasonal variation affects the time-series for measured data. Cloud cover estimation by models is different in summer and winter seasons which has a substantial effect on maximum daily temperature. 19 For all six sites, highest wind speed is observed in May and least in October with few exceptions.

Monthly mean time-series (a) KB, (b) HB, (c) BB, (d) FWE, (e) YE, (f) FFC.
The mean wind speed from NCEP-CFSR, NCEP-DOE, NCEP-NCAR, JRA-55, NCEP-FNL and NCEP-GFS for BB site is 3.98, 5.33, 4.07, 3.60, 3.19 and 3.41 m/s respectively. Except for NCEP-DOE, all other datasets show overall underestimation in different months throughout the year. NCEP-DOE shows overestimation for most of the months except for winter season (December to February) and the last month of autumn (November). The range of bias for NCEP-CFSR, NCEP-DOE, NCEP-NCAR, JRA-55, NCEP-FNL and NCEP-GFS is from −1.8 to −0.4, −0.6 to 1.1, −1.4 to −0.2, −2.1 to −0.7, −3.1 to −1.0 and −3.0 to −0.8 respectively. The estimations of NCEP-DOE are best for BB site on the basis of monthly mean time-series, NCEP-DOE closely follows the trend and biases are relatively less compared to other datasets.
The wind speed for HB ranges from 3.32 to 6.14 m/s with minimum and maximum average wind speed observed in winter and summer respectively. The mean wind speed from NCEP-CFSR, NCEP-DOE, NCEP-NCAR, JRA-55, NCEP-FNL and NCEP-GFS for HB site is 4.54, 5.52, 4.37, 4.21, 3.82 and 4.05 m/s respectively. Except for NCEP-DOE all other datasets show overall underestimation in different months throughout the year, NCEP-DOE shows overestimation for most of the months except the winter season (December to February). The range of bias for NCEP-CFSR, NCEP-DOE, NCEP-NCAR, JRA-55, NCEP-FNL and NCEP-GFS is from −0.4 to 0.1, −0.1 to 2.2, −0.6 to 0, −0.7 to −0.1, −1.4 to −0.4 and −1.1 to −0.2 respectively. The best estimations are of NCEP-CFSR for HB site, the dataset closely follows the trend and has low bias in most months.
The mean wind speed from NCEP-CFSR, NCEP-DOE, NCEP-NCAR, JRA-55, NCEP-FNL and NCEP-GFS for KB site is 4.82, 6.10, 4.90, 4.00, 4.52 and 4.38 m/s respectively. The range of bias for NCEP-CFSR, NCEP-DOE, NCEP-NCAR, JRA-55, NCEP-FNL and NCEP-GFS is from 0.0 to 1.0, 0.4 to 3.5, −0.4 to 1.4, −0.6 to 0.0, −0.4 to 0.6 and −0.6 to 0.7 respectively. Most of the datasets mostly overestimate except JRA-55 which shows underestimation in most of the months throughout the year, best estimations are of NCEP-FNL for KB site.
The mean wind speed from NCEP-CFSR, NCEP-DOE, NCEP-NCAR, JRA-55, NCEP-FNL and NCEP-GFS for FFC site is 4.06, 5.28, 3.98, 3.73, 3.39 and 3.44 m/s respectively. The range of bias for NCEP-CFSR, NCEP-DOE, NCEP-NCAR, JRA-55, NCEP-FNL and NCEP-GFS is from −2.8 to −0.6, −1.0 to 0.3, −2.6 to −0.9, −2.6 to −1.3, −4.1 to −1.0 and −4.0 to −1.0 respectively. All datasets underestimate except for NCEP-DOE in April, best estimations are of NCEP-DOE for FFC site which closely follows the measured time-series trend.
The mean wind speed from NCEP-CFSR, NCEP-DOE, NCEP-NCAR, JRA-55, NCEP-FNL and NCEP-GFS for FWE site is 4.30, 5.88, 4.63, 4.06, 3.93 and 3.70 m/s respectively. The range of bias for NCEP-CFSR, NCEP-DOE, NCEP-NCAR, JRA-55, NCEP-FNL and NCEP-GFS is from −2.1 to −0.3, −0.1 to 1.4, −1.1 to −0.5, −2.0 to −0.7, −2.8 to −0.6 and −3.1 to −0.7 respectively. All datasets underestimate while NCEP-DOE overestimates throughout the year. Out of all the datasets, monthly estimates of NCEP-NCAR are close to measured time-series. NCEP-DOE estimation is best among all datasets except summer months where high overestimation is observed.
The mean wind speed from NCEP-CFSR, NCEP-DOE, NCEP-NCAR, JRA-55, NCEP-FNL and NCEP-GFS for YE site is 3.92, 5.06, 3.84, 3.49, 3.63 and 3.76 m/s respectively. The range of bias for NCEP-CFSR, NCEP-DOE, NCEP-NCAR, JRA-55, NCEP-FNL and NCEP-GFS is from −2.4 to −0.9, −1.3 to 0.4, −2.2 to −0.9, −2.4 to −1.3, −2.9 to −0.9 and −2.7 to −0.8 respectively. All datasets mainly underestimate except NCEP-DOE, monthly estimates of NCEP-DOE are best which closely follow trend of measured time-series with an exception in winter months where no dataset has good estimates.
The NCEP-DOE estimates are better for BB, FFC, FWE and YE sites followed by NCEP-NCAR based on comparison of monthly mean time-series. Moreover, NCEP-DOE shows comparatively closet agreement with measured data at FFC than other sites. The NCEP-CFSR performs better for HB and NCEP-FNL performs better for KB. Overall, NCEP-DOE dataset is recommended as an alternative to measured data on the basis of monthly mean time-series analysis to estimate wind power potential for most of these sites.
Weibull PDF comparison
Weibull PDFs are used to assess the performance of reanalysis datasets for wind speed distribution. Accurate assessment of wind speed distribution of each dataset is important for both onshore and offshore wind energy potential assessment. Probability distribution functions (PDFs) are shown in Figure 4 for six sites representing the Weibull distribution of global datasets and measured wind speeds. The PDF curves of reanalysis datasets are positively skewed relative to the measured wind speed for five sites (HB, BB, FWE, YE and FFC) whereas negatively skewed for one site (KB). The frequencies of the lower wind speed are overestimated while strong winds are underestimated by the reanalysis datasets, resulting in overall underestimation of wind speed. The Weibull parameters k and A along with the mean wind speed for the measured and the global reanalysis datasets and their percentage errors are given in Table 4.
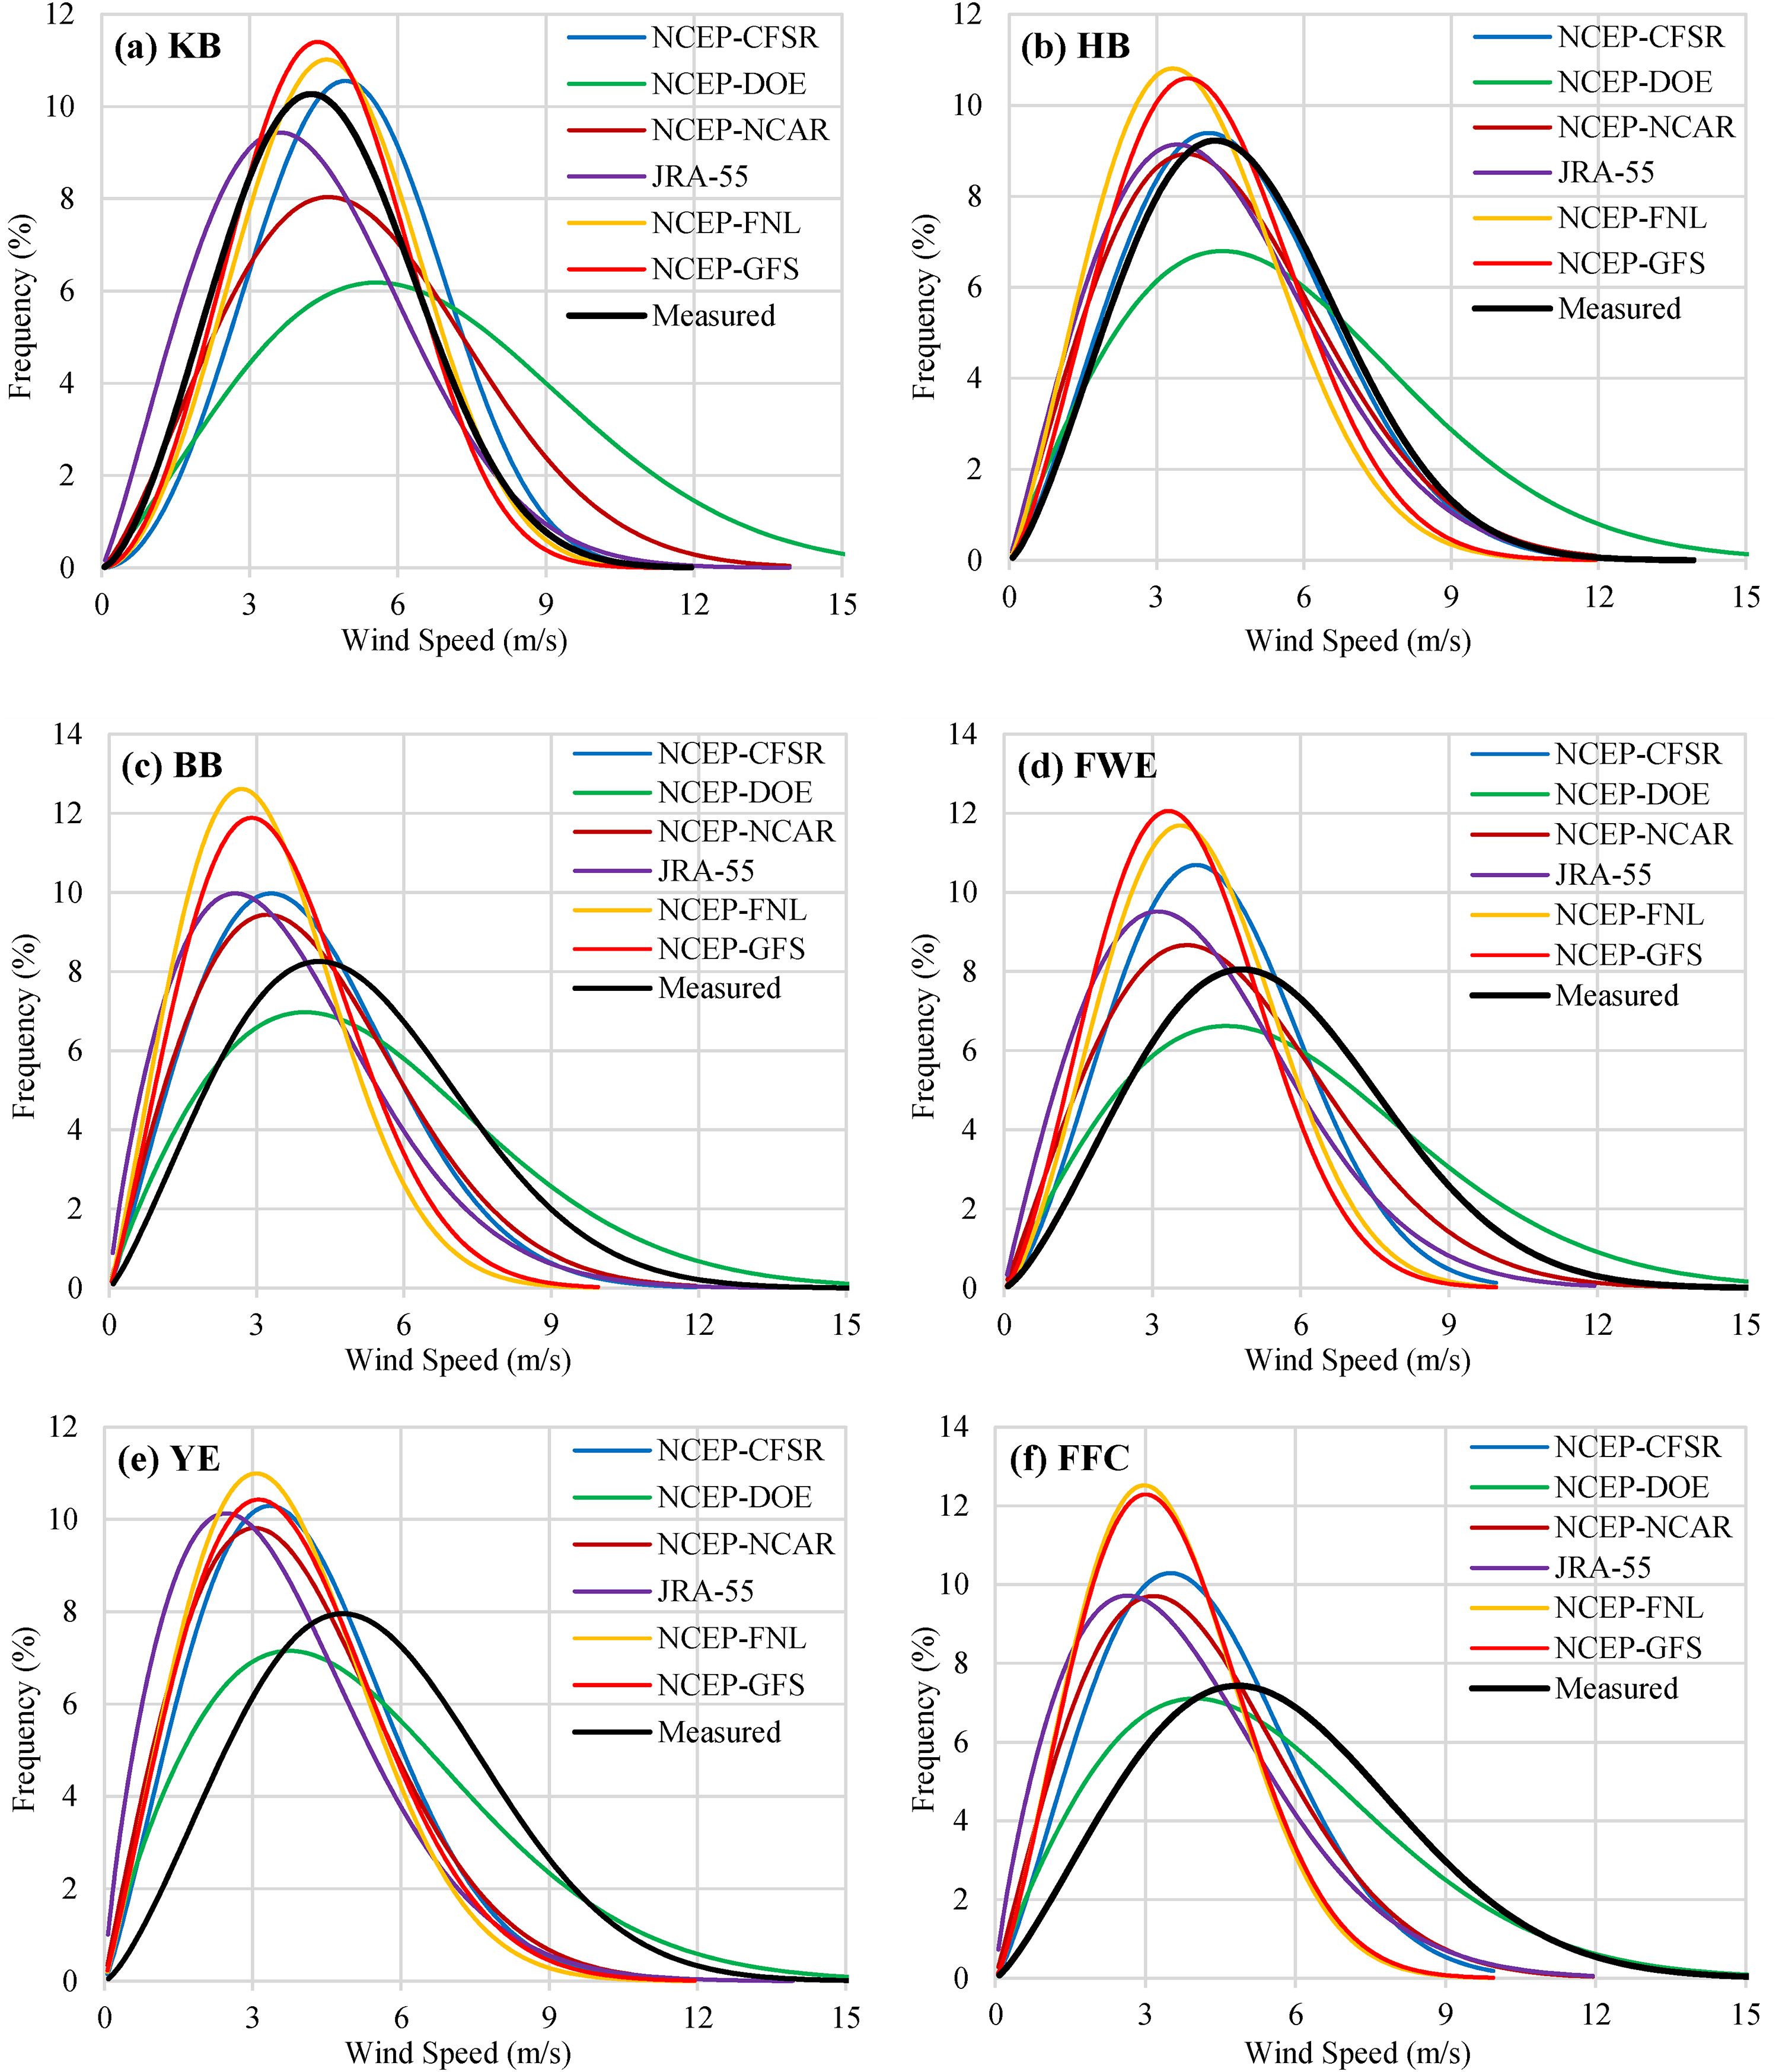
Weibull distribution functions (a) KB, (b) HB, (c) BB, (d) FWE, (e) YE, (f) FFC.
Statistics of the comparison between measured and reanalysis six-hourly mean wind data.

For site BB, reanalysis datasets underestimate the mean wind speed except for NCEP-DOE which shows overestimation, yet the pattern is close to measured wind speed with the least percentage error of 6.42%. NCEP-FNL shows a high deviation with a percentage error of −35.84%. The value of scale factor for NCEP-DOE is 5.94 m/s showing high spread of data compared to other datasets with the least percentage error of 6.21% while NCEP-FNL shows the highest scale factor percentage error of −35.84%. NCEP-GFS shows the least shape factor percentage error of −1.67% while JRA-55 has the highest shape factor percentage error of −19.17% among all the datasets.
Reanalysis datasets exhibit an overall underestimation of mean wind speed for HB site. NCEP-CFSR shows quite similar pattern to the measured wind dataset with least percentage error of −2.70%. The trends of NCEP-FNL and NCEP-DOE are showing high deviation from the measured mean wind speed. NCEP-DOE shows the same trend for scale factor and shape factor with highest percentage errors within 18%. NCEP-CFSR wind speed data is in good agreement with measured data and shows the least scale factor percentage error of −2.67% and NCEP-GFS shows the least shape factor percentage error of −0.50%.
The PDFs of datasets for site KB are somewhat negatively skewed concerning measured PDF except JRA-55, this implies that frequencies of lower wind speed are underestimated while frequencies of higher wind speeds are overestimated. NCEP-GFS shows similar pattern to the measured wind data with the lowest percentage error of −0.66%. NCEP-DOE shows the highest percentage error in terms of mean wind speed and scale factor around 45% which shows its high deviation and spread of data while NCEP-GFS has the least percentage error in terms of scale factor and shape factor with values of −1.06% and 11.84% respectively showing good agreement with measured data.
For site FFC, PDF plots of all datasets are dominantly positively skewed for lower wind speeds and show overall underestimation of mean wind speed. NCEP-DOE presents the trend close to the surface measured wind data with the least percentage errors in terms of mean wind speed and scale factor around −6.5%. NCEP-CFSR presents the same spread of the wind data as that of measured data based on shape factor with the least percentage error of 0.09%.
Reanalysis datasets for site FWE show underestimation of mean wind speed. NCEP-DOE shows percentage error within 6.29% both for mean wind speed and scale factor. NCEP-NCAR and NCEP-CFSR overestimate the lower wind speeds to the approximately same level which is midway between surface measured data and NCEP-GFS but results of NCEP-NCAR are better than NCEP-CFSR. NCEP-DOE and JRA-55 have the highest shape factor within −17.5%.
For site YE, PDF plots of NCEP-NCAR and NCEP-CFSR show almost a similar trend on the distribution curves. NCEP-DOE shows the least percentage errors in terms of mean wind speed and scale factor around −6%. The shape factor for NCEP-CFSR is close to measured data and gives the least percentage error of −7.61%.
For sites BB, FFC, FWE and YE, NCEP-DOE exhibit similar pattern to the measured wind speed with the least percentage error within 6.42%, the similar behaviour is for scale factor with error within 6.55%. For site HB, PDF plot of NCEP-CFSR is close to the measured data with the least percentage error of −2.70%. The PDF of NCEP-GFS for site KB shows similar pattern to the measured wind data with the least percentage error of −0.66%. NCEP-GFS shows the least percentage error in terms of shape factor within 11.84% for sites KB, HB, BB and FWE whereas NCEP-CFSR shows the least errors in shape factor for sites FFC and YE. The datasets overestimating wind frequencies more for higher wind speed show overall overestimation. Lower wind speed frequencies are generally overestimated and vice versa, for overall wind speed frequencies opposite is also true but less pronounced. NCEP-DOE shows overall promising results followed by NCEP-GFS and NCEP-CFSR.
Wind rose
Wind direction analysis is important for wind resource assessment as it provides the prevailing wind direction from which energy can be extracted. 58 A wind rose diagram is a circular representation of wind direction and wind speed frequency. Windographer software was used to plot wind rose diagram in this study. Each wind rose consists of 12 sectors with an arc of 30°, Figure 5 shows the wind rose diagrams at a height of 10 m for six selected sites. The dominant wind direction for KB, HB, BB, FWE, YE and FFC is northwest to west (46% at 270°), southwest to the west (35% at 270°), southwest (48% at 240°), northwest to west (20% at 270°), southwest to west (28% at 270°) and west to the southwest (32% at 240°) respectively. For respective dominant wind directions KB, HB, BB, FWE, YE and FFC receive wind occurrence of 71, 56, 59, 35, 54 and 57% respectively. The dominant wind direction for all sites is from west to southwest and the wind speed associated with the dominant direction ranged between 10 and 15 m/s for all sites.

Wind rose diagram (a) KB, (b) HB, (c) BB, (d) FWE, (e) YE, (f) FFC.
The wind direction frequency of NCEP-CFSR is closely related to measured data among all datasets for KB site, the wind direction of datasets has more rotation towards anticlockwise direction as shown in Figure 5(a). NCEP-CFSR, NCEP-GFS and NCEP-FNL are in close agreement with measured data for HB site in terms of wind direction frequency. The wind rose in Figure 5(b) for site HB shows that JRA-55 has the highest anticlockwise rotation compared to other datasets.
The wind direction frequency for JRA-55 is closely related to measured data among all datasets for BB site. NCEP-NCAR and NCEP-DOE show more anticlockwise rotation whereas NCEP-CFSR, NCEP-GFS, NCEP-FNL and JRA-55 show less anticlockwise rotation as shown in Figure 5(c) for site BB. All datasets show deviation of wind direction towards the anticlockwise direction with almost equal tendency as given in Figure 5(d) for FWE site. The wind direction frequency for JRA-55 is in close agreement with measured data for this site.
NCEP-CFSR, NCEP-GFS, NCEP-FNL and JRA-55 have more rotation in the anticlockwise direction as shown in Figure 5(e) for YE site, the NCEP-CFSR wind direction frequency data is closely related to measured data. The wind direction frequency of NCEP-GFS and NCEP-FNL are closely related to measured data for FFC site, however, NCEP-NCAR and NCEP-DOE have high anticlockwise rotation compared to other datasets as shown in Figure 5(f).
Overall performance of NCEP-CFSR and JRA-55 is better for six sites, they show close agreement with measured wind direction frequency. NCEP-CFSR and JRA-55 show less bias in the anticlockwise direction, whereas NCEP-NCAR and NCEP-DOE show more bias.
Discussion
The behaviour of wind data for six different sites was assessed using statistical parameters. The performance of reanalysis and analysis products varies across different regions, the datasets perform differently under various climatic conditions. Datasets performing good in European conditions might not perform equally good for the South Asian region, the observations assimilated in Numerical Weather Prediction (NWP) models are usually unavailable for South Asia, significant biases in estimations were observed, this signifies the need to evaluate reanalysis and analysis products for respective regions. The comparison of the datasets with surface measured wind data offers a broad reference for the performance of the datasets. This evaluation can be used for the selection of estimated wind data for site assessment, which is helpful in the selection of potential locations for future wind farm development.
The annual mean daily wind speed for six sites ranges from 4.31 to 5.62 m/s, FFC and KB show maximum and minimum wind potential respectively. The maximum and minimum average wind speed is observed in summer and winter respectively for all six sites. A comparison of performance of dataset reveals that most of the datasets do not perform well in the summer months, worst underestimations are in summer especially July when the monsoon brings strong winds that are not estimated well by the reanalysis products. Based on the monthly mean time-series, the estimations of NCEP-DOE are better for most of the sites followed by NCEP-NCAR. For HB site and KB site the performance of NCEP-DOE is poor, NCEP-DOE shows large overestimation for these two sites.
The comparison of PDFs of measured data and estimated data reveals NCEP-DOE shows overall promising results followed by NCEP-GFS and NCEP-CFSR. NCEP-DOE shows PDF patterns similar to measured data with least percentage error of scale factor for BB, FFC, FWE and YE sites. The PDFs of NCEP-CFSR and NCEP-GFS show a close agreement to measured data with least percentage error of scale factor for HB site and KB site respectively.
NCEP-NCAR data do not show promising results among all datasets and mostly underestimate wind speed. Similar results of wind speed underestimation by NCEP-NACR using sub-daily data were reported by Abderrahim et al., 22 MBE and RMSE for wind speed ranging from −0.62 to −0.08 m/s and 1.49 to 2.54 m/s respectively, and MBE and STDE for wind direction ranging from −8° to 0° and 21° to 48° were reported. Smith et al. 16 reported evaluation of NCEP-NCAR for eight different vessels for wind speed and reported values of MBE and RMSE for wind speed ranging from −1.4 to −0.1 m/s and 2.0 to 3.9 m/s respectively. Ruti et al. 17 evaluated NCEP-NCAR six-hourly wind speed data at four different sites of the Mediterranean basin, the values of MBE and RMSE range from −2.68 to −0.41 m/s and 2.90 to 4.56 m/s were reported. The MBE and RMSE of NCEP-NCAR for all six stations in the present study using six-hourly data at 10 m were ranging between −1.61 to 0.7 m/s and 1.71 to 2.45 m/s respectively. The errors of the present study are high compared to those reported by Abderrahim et al. 22 and low compared to those reported in studies by Smith et al. 16 and Ruti et al. 17 The MBE and RMSE values of wind direction in the current study are from −34.34° to 4.34° and 49.54° to 71.28° respectively; the errors of the present study are higher compared to errors reported by Abderrahim et al.. 22
NCEP-DOE data show both underestimation and overestimation but overestimation is dominant, similar behaviour was reported in previous studies.19,51 The MBE and RMSE for wind speed ranged from −0.05 to 0.63 m/s and 2.28 to 2.53 m/s respectively, whereas for wind direction MBE and RMSE values ranged from 3.32° to 9.65° and 39.32° to 54.66° respectively in a similar study by Carvalho et al. 51 for five offshore sites. Carvalho et al. 19 evaluated NCEP-DOE for five stations along the Iberian Peninsula coast at 10 m height, MBE and RMSE for wind speed ranged from 0.03 to 0.70 m/s and 2.28 to 2.62 m/s whereas for wind direction the values for MBE and RMSE ranged from 3.70° to 8.04° and 39.54° to 53.55° respectively. Gholami et al. 18 evaluated NCEP-DOE data over the Persian Gulf for 23 weather stations at 10 m height and reported high overestimation with MBE and RMSE for wind speed ranging from 2.26 to 3.23 m/s and 3.23 to 3.72 m/s respectively whereas MBE and RMSE for wind direction ranged from −3.97° to 3.63° and 49.11° to 60.34° respectively. The errors of NCEP-DOE of the present study are comparable with the errors reported by Carvalho et al.19,51 and lower than Gholami et al. 18 with MBE and RMSE values of wind speed ranging from −0.34 to 2.01 m/s and 1.94 to 3.0 m/s respectively. The MBE and RMSE values for wind direction were ranging from −31.22° to 6.45° and 47.52° to 69.02° respectively; the errors are higher than those reported by Carvalho et al. and Gholami et al..18,19,51
NCEP-CFSR data show the best results among all datasets for six sites of the present study based on MBE and RMSE. NCEP-NCAR, NCEP-DOE and NCEP-CFSR were projects of the same organization, yet the performance of NCEP-CFSR data have shown significant improvement due to higher temporal resolution and model with biases removed by variational bias technique and use of coupled atmosphere model. The MBE and RMSE for NCEP-CFSR ranged from 0.38 to 0.82 m/s and 1.77 to 2.33 m/s respectively using six-hourly data for five locations in the Iberian Peninsula as reported by Carvalho et al. 19 whereas MBE and RMSE for direction data ranged from −2.25° to 6.24° and 31.47° to 49.62° respectively. The MBE and RMSE for wind direction ranging from −0.28 to 0.16 m/s and 1.62 to 2.07 m/s respectively for five buoys along the Iberian Peninsula coast were reported by Carvalho et al. 20 whereas MBE and RMSE for wind direction ranged from −6.83° to 3.40° and 34.59° to 49.26° respectively. Miao et al. 23 evaluated NCEP-CFSR for the northern hemisphere and reported the MBE and RMSE values for wind speed as 0.197 m/s and 0.217 m/s respectively. The MBE and RMSE of wind speed for the present study are ranging from −1.53 to 0.51 m/s and 1.34 to 2.28 m/s whereas for wind direction range from −21.29° to 13.90° and 40.58° to 65.06° respectively. The errors of the present study are high compared to those reported by Carvalho et al.19,20 and comparable to those reported by Miao et al. 23 A comparison of results reported in the literature and present study affirms that the performance of NCEP-CFSR in Europe is better than in Pakistan.
Carvalho et al. 20 evaluated NCEP-GFS for five sites along the Iberian Peninsula coast in the European region at a height of 10 m where MBE and RMSE ranged from −0.19 to 0.4 m/s and 1.65 to 2.26 m/s for wind speed and from −5.86° to 3.86° and 35.91° to 48.77° respectively for wind direction. The MBE and RMSE ranging from 0.30 to 0.73 m/s and 1.73 to 2.24 m/s respectively for five off-shore sites in the Iberian Peninsula coast at 10 m height were reported by Carvalho et al.20,51 whereas for wind direction the values for MBE and RMSE ranged from −2.24° to 7.11° and 31.50° to 50.17° respectively. The wind speed results for all sites in the present study are comparable with reported literature as the MBE and RMSE is ranging from −2.13 to −0.01 m/s and 1.61 to 2.93 m/s for wind speed while from −22.00° to 6.55° and 42.02° to 66.19° respectively for wind direction; wind direction errors are more compared to studies by Carvalho et al..20,51
NCEP-FNL data have shown the worst results among all datasets. Gholami et al. 18 evaluated NCEP-FNL at 10 m height over the Persian Gulf for 23 different locations, the MBE and RMSE ranged from 1.84 to 1.93 m/s and 2.22 to 2.44 m/s respectively whereas for wind direction ranged from 0.75° to 5.6° and 35.44° to 38.84° respectively. Carvalho et al. 20 evaluated NCEP-FNL for five sites along the Iberian Peninsula coast in the European region, MBE and RMSE for wind speed ranged from −2.02 to 1.27 m/s and 1.82 to 3.07 m/s respectively, whereas MBE and RMSE for wind direction ranged from −6.04° to 11.14° and 33.85° to 49.03° respectively. The range of MBE and RMSE of NCEP-FNL was reported as 0.24 to 0.82 m/s and 1.70 to 2.24 m/s respectively for five offshore sites in the Iberian Peninsula by Carvalho et al. 51 whereas for wind direction these errors ranged from −2.02° to 8.14° and 30.72° to 50.04° respectively. The MBE and RMSE values for the present study are ranging between −2.18 to 0.17 m/s and 1.64 to 2.98 m/s respectively, the errors of NCEP-FNL wind speed of the present study are similar to previous similar studies. The MBE and RMSE values for wind direction for the present study ranging from −23.28° to 3.46° and 41.39° to 65.84° respectively; the wind direction errors of the present study are higher compared to errors reported by Carvalho et al.20,51
The performance of JRA-55 data is second-best among all datasets after NCEP-CFSR. The MBE and RMSE of JRA-55 were reported as −0.58 and 5.31 m/s respectively for four sites in the Amundsen Sea Embayment, Antarctica by Jones et al.. 24 Miao et al. 23 evaluated JRA-55 data for 1038 stations in the northern hemisphere and reported the MBE and RMSE values −0.340 and 0.349 m/s respectively. The results of present study are better than those by Jones et al. 24 and are comparable to the study by Miao et al. 23 with MBE and RMSE ranging from −1.87 to −0.28 m/s and 1.50 to 2.42 m/s respectively. The reason for the good performance compared to other datasets is due to its new generation and incorporation of the 4D-Var assimilation method.
The performance of estimated wind data by different datasets varies from location to location as reported in similar previous studies for other regions of the World.19,20,59 Carvalho et al. 19 compared NCEP-DOE and NCEP-CFSR wind data for five stations in the Iberian Peninsula and reported that NCEP-DOE shows better performance at all sites with weighted mean percentage difference of 5.9% for mean wind speed on basis of PDF criterion. Carvalho et al. 20 evaluated reanalysis (NCEP-CFSR, NCEP-DOE) and analysis (NCEP-GFS, NCEP-FNL) datasets against measured data at five stations and reported that NCEP-CFSR shows better performance with weighted mean percentage difference of 4.1% for both scale factor and wind speed. Carvalho et al. 59 compared different datasets (NCEP-DOE, NCEP-CFSR, NCEP-FNL, NCEP-GFS) at five stations in Iberian Peninsula and reported that NCEP-DOE performs better with least weighted mean percentage difference of 5.7% for scale factor and 5.5% for mean wind speed. The results of this study show that performance of NCEP-DOE reanalysis dataset is better among other datasets for all sites except KB with mean percentage difference of 3.75% for wind speed and −0.56% for scale factor. The results comparison of PDFs are similar with results reported in the aforementioned literature for other regions.
The dominant wind direction for all sites is west to southwest and wind speed associated with dominant direction range from 10 and 15 m/s for all sites. NCEP-CFSR and JRA-55 show less bias whereas NCEP-NCAR and NCEP-DOE show more bias in anticlockwise direction. The wind rose diagrams at each site shows similar dominant wind direction with minor differences. Overall performance of NCEP-CFSR and JRA-55 is better for all sites and show close agreement with measured wind direction frequency.
The overall performance of NCEP-CFSR is better followed by JRA-55 based on statistical analysis of six-hourly wind speed and wind direction. The overall performance of NCEP-DOE is good based on comparison of time-series using monthly mean daily wind speed data. NCEP-DOE gives overall better performance followed by NCEP-GFS and NCEP-CFSR based on comparison of PDFs. A comparison of wind rose diagrams of measured and estimated data shows NCEP-CFSR and JRA-55 perform well, and show close agreement with measured wind direction. Overall results show that NCEP-CFSR six-hourly wind data can be used for preliminary wind resource assessment and wind power exploitation followed by JRA-55.
The reanalysis and analysis wind data show overestimation and underestimation, these errors cannot be regarded as wind speed change because they are highly dependent on the region under study. An alternate justification, which is considered as the main source of the changes in wind speed, is regarding the changes in large-scale circulation.60–64 Torralba et al. 65 observed a strong resemblance between the trends in 850 hPa and 10 m levels, which demonstrates that most of the wind speed trends in wind at 10 m, can be credited to the atmospheric circulation change, particularly the current growth of Walker circulation. Mis-representation of terrain height and complexity induce both overestimation and underestimation in the wind speed. Overestimations of site height induced an overestimation of wind speed while an underestimation of wind speed is due to underestimation of site height. The performance of datasets under study is different compared to other regions of the world reported in the literature. The performance of the assimilation system cannot be viewed likewise for other regions as it is for Europe and the USA, hence, cannot be blindly used without any prior evaluations.
The accuracy and reliability of wind data for estimation of power potential of a particular site is a key factor for successful operation of a commercial wind power project. 5 The cost of measurement of wind data on a site for one year is several thousand USD, there is a possibility of loss of investment if the site is not feasible for commercial wind power projects. This risk can be avoided using reanalysis or analysis wind data by performing preliminary resource assessment. The percentage difference of wind speed by best datasets for different sites are in the acceptable range (around 5%) so the best datasets are alternatives to measured data. NCEP-CFSR and JRA-55 can be used for preliminary resource assessment with known uncertainty in the nearby region by saving the cost of measurements. The results of the present study may help policy-makers to perform wind resource assessment of nearby regions with known uncertainty and to attract investors to plan for commercial wind power projects with lower risk involvement.
Conclusion
The wind project produces clean electricity, potentially reducing the impact on climate and problems to human health, maintaining quality of ecosystems, compared to issues associated with producing electricity by fossil fuels. The electricity generation from renewables is gaining importance to achieve United Nations’ Sustainable Development Goals (SDGs). The global weighted mean levelized cost of electricity of onshore wind is the lowest among all renewable resources. The electricity generation from wind is sustainable, economical and environment friendly.
The evaluation of four reanalyses (NCEP-CFSR, NCEP-DOE, NCEP-NCAR, JRA-55) and two analyses (NCEP-FNL, NCEP-GFS) was performed using measured data; in terms of statistical analysis, monthly mean time-series, probability density function (PDF) and wind rose diagrams. The six potential sites near the coastal region of Pakistan were selected for performance assessment of reanalyses and analyses datasets. This is the first-ever study of its kind for evaluation of the global reanalysis and analysis datasets to find an alternative to in-situ mast measurements.
The range of MBE (RMSE) of wind speed for NCEP-CFSR, NCEP-DOE, NCEP-NCAR, JRA-55, NCEP-FNL and NCEP-GFS using six-hourly data is −1.53–0.51 (1.34–2.28), −0.34–2.01 (1.94–3.0), −1.61–0.7 (1.71–2.45), −1.87 – −0.28 (1.50–2.42), −2.18–0.17 (1.64–2.98) and −2.13 – −0.01 m/s (1.61–2.93 m/s) respectively using six-hourly data. The range of MBE (RMSE) of wind direction for NCEP-CFSR, NCEP-DOE, NCEP-NCAR, JRA-55, NCEP-FNL and NCEP-GFS using six-hourly data is −21.29°–13.90° (40.58°–65.06°), −31.22°–6.45° (47.52°–69.02°), −34.34°–4.34° (49.54°–71.28°), −20.89°–3.72° (42.12°–65.93°), −23.28°–3.46° (41.39°–65.84°) and −22.0°–6.55° (42.02°–66.19°) respectively. The NCEP-CFSR performs better compared to other datasets followed by JRA-55 for most of the sites based on statistical analysis.
Monthly mean time-series analysis shows range of mean bias for wind speed of NCEP-CFSR, NCEP-DOE, NCEP-NCAR, JRA-55, NCEP-FNL and NCEP-GFS is −2.8 to 1.0, −1.3 to 3.5, −2.6 to 1.4, −2.6 to 0.0, −4.1 to 0.6 and −4.0 to 0.7 m/s respectively. Most datasets do not perform well in late spring (May) and summer (June and July) when monsoon brings strong winds which are not estimated well by these datasets. The overall performance of NCEP-DOE is better using monthly mean data.
The Weibull PDF comparison of six-hourly data shows that for most sites, NCEP-DOE exhibits a similar pattern to the measured wind speed with the least percentage error of wind speed within 6.42% and scale factor within 6.55%. The comparison of PDF for measured data and estimated data reveals that NCEP-DOE performs better among all datasets followed by NCEP-GFS and NCEP-CFSR.
The wind rose diagrams were used to determine dominant wind direction. Overall, the wind direction remains the same for all sites with minor discrepancies, dominant wind direction is southwest with up to 71% occurrence for all sites. The range of mean wind speed and mean wind direction is 4.52−5.54 m/s and 250°−294° respectively for all sites. The maximum and minimum mean wind speed (wind direction) is observed at FFC (FWE) and KB (BB) respectively.
The overall performance of NCEP-CFSR shows promising results (for both speed and direction) due to its finer spatial resolution. NCEP-CFSR wind data can be used as an alternative to measured data for preliminary resource assessment due to its long-term availability. This research work is a contribution towards wind resource assessment for potential sites in the region using reanalysis or analysis data, that has not been investigated previously. The findings of this study will help policy-makers to achieve sustainable development goals for sustainable and clean energy generation. The results of this study can be used for preliminary wind resource assessment for commercial wind farms by avoiding meteorological mast measurement costs.
Footnotes
Declaration of conflicting interests
The author(s) declared no potential conflicts of interest with respect to the research, authorship, and/or publication of this article.
Funding
The author(s) received no financial support for the research, authorship, and/or publication of this article.
