
Abstract
The activities of humans on Earth have increased the global concern for climate change, ecological distortions, and environmental deterioration. These concerns have warranted regulations that relate to environmental preservation and sustainability. However, the efficiency of such regulations in emerging economies is yet to be ascertained as conclusions from various findings still remain murky. We explore how environmental regulations affects ecological footprint (EFP) using the cross-sectionally augmented autoregressive distributed lag (CS-ARDL) model, augmented mean group (AMG), and the common correlated effects mean group estimators (CCEMG) in the eleven fastest emerging economies (N11). The findings reveal that environmental regulations are not efficient in abating environmental deterioration. Economic growth, trade, and energy consumption invigorate the EFP. The country-specific findings confirm that energy consumption and economic growth promote environmental degradation in all the N11 countries, and the outcome was consistent across all estimators. Finally, policy directions are discussed along with the limitations of the study.
Introduction
Environmental regulation is increasingly seen as an efficient economic tool to create incentives for cleaner production and consumption habits. Unpleasant concerns about environmental problems including health, climate change, and resources consumption have fostered the adoption of environmental regulation (ER) across different regions and economies on several areas. Besides, earlier studies have highlighted the benefits it (ER) represents over similar economic tools like tradable permit systems, payments for environmental services, etc. ER has become necessary with the rise in environmental degradations in recent decades.1,2
Factors that degrade the environment are well echoed in the literature, but human-related factors like trade and energy consumption contribute more in this regard.3,4 Energy demand is currently increasing in all emerging economies (N11 inclusive) 5 The consumption of energy ease production and the accomplishment of basic needs, create jobs, complements labor and capital, promotes manufacturing, and serve as a fulcrum for economic progress.6,7 Energy consumption, especially when it is nonrenewable, hurts the environment.
Environmental regulations (ERs) are introduced to curb or ameliorate the devastating impacts of energy consumption, trade, economic growth, and other potential drivers of environmental degradation. However, weak ERs may intensify energy consumption (especially fossil fuels) which could, in turn, harm the environment. More so, weak regulations can compromise energy efficiency policies. When ERs are weak, corruption and rent-seeking become inevitable. 8 Inefficient ERs encourage the importation of dirty technologies in the form of FDI from the advanced countries to the developing or emerging economies. 9 Ecological distortion is an outcome of undesired by-products of the consumption and production process that requires restriction in the form of ERs. 10 The strengthening of economic prosperity which is currently witnessed in the N11 countries warrants the focus on environmental quality as an important component of any policy design as growth can only be sustained when the environment is ‘clean’.11–13
Economic growth and a reduction in fossil fuels consumption may not be potent enough to curb environmental degradation, but coupled with ERs could give a desirable outcome.9,14 Defective ERs in the form of lax policy enforcement or a strict carbon tax would only motivate resource owners to increase extractions which could amount to “green paradox”. 15 In such a case, emissions will rise. Therefore, lax ERs executed by emerging economies prompt multinational companies to import and invest in high polluting sectors thereby transferring their dirty technologies and pollution-intensive goods to developing countries. 16 Against this backdrop, it is important for policymakers in emerging economies to enforce ERs implementation to investors. As the economy keeps expanding, the enforcement of proper ERs will help mitigate any market failure responsible for environmental deterioration.
There are still lingering questions on how ERs mitigate pollution. Sequel to this, many questions come to mind: Are ERs efficient in abating environmental deterioration? What are the environmental implications of energy consumption in N11 countries? Can the environmental Kuznets curve (EKC) hypothesis be validated for the N11 countries? What role does trade play in the preservation of the environment in N11 countries? However, due to the complexity and peculiarity in different economies/regions, arriving at a consensus has not been possible. More so, studies like17,18 have affirmed that ERs mitigates environmental degradation, while Nathaniel et al. 19 argued that ERs is not relevance in abating environmental degradation. These serve as a motivation for this study. This study considered the N11 countries because of their openness to trade, technological progression, challenges in maintaining environmental quality, rising energy consumption, and their ever-increasing EFP.
Since these countries now occupy an ecological deficit territory (see Table 1), this study is super useful as the outcome is expected to yield relevant policy directions that might help these countries overcome their environmental woes.
Earth versus EFP in N11 countries.
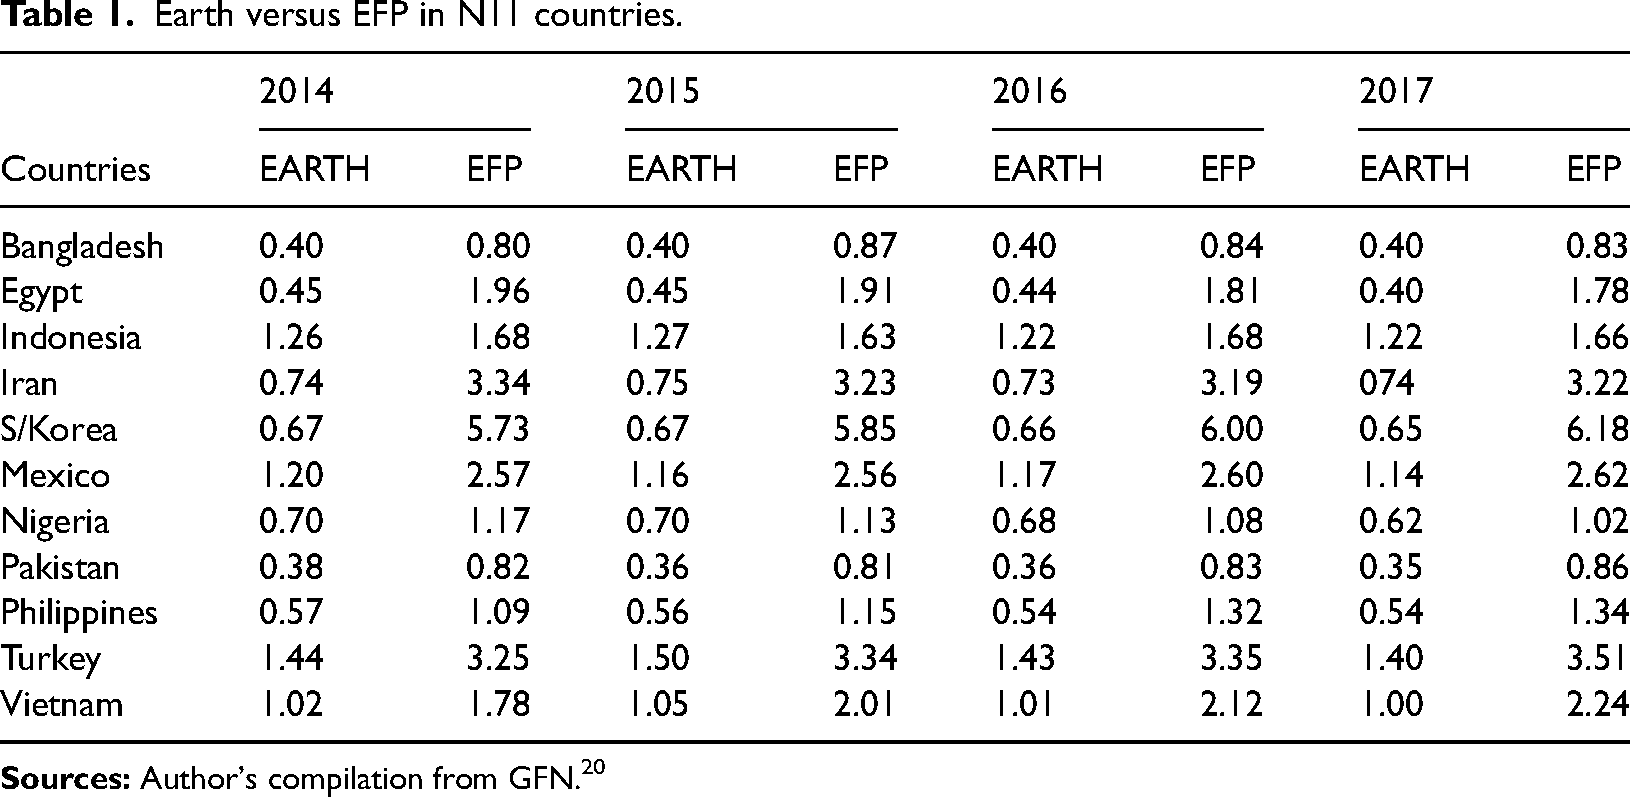
Ecological deficit exists when the number of Earth (that is, biocapacity) is less than the EFP.21,22 The N11 countries also face challenges that are frustrating their growth trajectory. Nigeria, for instance, is making frenetic efforts to curb corruption; Turkey is still looking for a pathway into the European Union (EU); while Pakistan has been involved in taxation and banking sector reforms. Environmental degradation is still a serious issue in N11 countries. Indonesia's EFP is already below the world's average (1.7 gha) biocapacity per person. In 2016 alone, the energy sector added about 86.1% to Turkey's total CO2 emissions. 23 Some N11 countries (especially Mexico and Nigeria) have made efforts to reduce the negative effects of environmental degradation through an improvement in energy intensity, but energy alone cannot overwhelm the menace. Brazil, Russia, India, China, and South Africa (BRICS) and N11 countries contribute more to CO2 emissions than any other emerging economic region in the world. 24
The contribution of the study to the current literature is provided by the country group used, environmental quality indicator, and the econometric method. (i) this study analyzes the efficiency level of ERs of N11 countries; therefore, it will guide and provide better and informed policy guidelines to N11 countries. (ii) previous studies on ERs and environmental degradation nexus used a negative indicator (CO2 emissions) to proxy environmental degradation (see, for instance, Haldar & Sethi 25 ; Ampofo et al. 2021 26 ). However, CO2 emissions is not a comprehensive indicator.18,27,28 The EFP is a positive indicator. It (EFP) captures the bio-productive land needed for sustaining a population. The use of EFP is justified on the ground that the N11 countries have attained growth resulting from production and consumption activities. Now, the EFP is super useful since it reveals the environmental implications of both production and consumption of goods. (iii) this study is the first to explore the nexus between ERs and EFP for this set of countries. This study applies advance econometric techniques, including the CS-ARDL modeling technique, the AMG and CCEMG estimators that accommodate endogeneity, heterogeneity, and cross-sectional dependence (CD), to make the study accurate for policy guidelines. With these econometric methods, both panel and country-based results can be obtained.
Literature review
Theoretical background
The literature is awash with studies on energy consumption and ecological footprint (EF) nexus.4,27,29–35 Trade and ERs have also been linked to environmental degradation. 36 –38 The empirical analysis of this study follows the EKC hypothesis. According to the EKC, economic growth is hypothesized to initially deteriorate the environment while improving it beyond a threshold level of growth. 33 Grossman and Krueger 39 pioneered studies on the EKC hypothesis in the context of Mexico. They went further to quantify pollution in terms of smoke and sulfur dioxide emissions but could not statistically establish the EKC in Mexico.
The IPCC (2014) report also noted that the issues of increasing CO2 emissions and bio-capacity loss can truncate the economic growth trajectory in developing economies. 40 As such, it becomes pertinent to explore the interaction between economic expansion and environmental quality, revealed by the EKC hypothesis. Proposed by Simon Kuznets in 1955, the EKC displaces an inverted U-shaped relationship between inequality and income. Afterwards, a similar trend was discovered between environmental degradation and economic growth in Grossman and Krueger 39 study of the environmental impact of economic growth on environmental degradation in North American Free Trade Agreement (NAFTA). However, given the growth prospect and economic expansion, the energy-growth-environment interaction might become sacrosanct for the emerging economies across the globe, including the N11 countries. The Goldman Sachs investment bank introduced the term N11 countries in 2005 to represent a group of emerging industrialized economies, expected to dominate growth in the 21st century. As of 2017, N11 and BRICS countries accounted for thirty per cent of global per capita gross domestic product growth (GDP) and had about sixty-four per cent of the world's population.41 Previous studies11,12,24,26,40,42,43 have investigated a similar relationship for the N11 countries in the past
In the next section, we present our literature review in two parts. The first part considers the impact of ERs and trade on EFP. The second part focuses on the effects of energy consumption and economic growth on EFP.
Environmental regulations (ERs), trade, and environmental quality
Studies have associated ERs with the level of pollution. Most of the studies have confirmed that ERs can actually abate pollution. For instance, Ulucak et al. 36 used the pooled mean group (PMG), CCEMG, and fully modified ordinary least square (FMOLS) to explore the effect of ERs on CO2 emissions for BRICS countries from 1995–2016. They confirmed the EKC for all the countries and discovered that ERs successfully mitigates CO2 emissions, while trade exacts an increasing influence on CO2 emissions. World Bank41 investigated the effects of technical efficiency and ERs on CO2 emissions in Chinese provinces. From their findings, ERs reduces CO2 emissions. Technical efficiency exacted a partial mediating role in the relationship between CO2 emissions and ERs.
Hashmi & Alam 44 used the fixed effect (FE), generalised method of moments (GMM), and DK to investigate the effects of innovation and ERs on environmental quality in the OECD countries. In line with previous studies, including those of World Bank, 41 Cheng et al., 45 and Chen et al., 46 ERs enhanced environmental wellbeing. Ouyang et al. 47 also considered the effect of ERs and service sector expansion on air pollution in OECD-30 within a non-linear framework. Their findings showed that both variables mitigate pollution. Albulescu et al. 48 used the GMM techniques to examine the factors responsible for a decline in CO2 emissions in the EU countries. Renewable energy was one of the culprits, but the impact of ERs was unclear. Wang et al. 49 investigated the effect of ERs in mitigating pollution in China. They discovered that regional characteristics and peculiarities can render ERs inefficient. Also, ERs have different impacts on pollutants.
Zhang et al. 50 discovered that industrialization worsens pollution, but ERs have successfully contributed to the mitigation of pollution in 30 Chinese provinces. Wenbo & Yan 51 used the GMM and Tapio decoupling model to explore the impact of ERs on pollution mitigation in 30 Chinese provinces from 2004 to 2015. Findings suggested that strong ERs have declined the consumption of fossil fuels. Also, China is expected to attain its CO2 emissions peak by 2030. Ahmed et al. 52 examined the effects of economic growth, ERs, and democracy on the EFP in G7 countries from 1985 to 2017. The continuously updated fully modified (CUP-FM) and continuously updated bias-corrected (CUP-BC) results showed that economic growth increases the EFP while ERs and democracy reduce the EFP. Also, democracy Granger causes EFP and renewable energy consumption. Murshed et al. 53 evaluated the effect of ERs, non-renewable energy, FDI, and renewable energy on the EFP in South Asian countries: India, Sri Lanka, Pakistan, India, and Bangladesh. From the findings, ERs reduces the EF, directly and indirectly. On the other hand, renewable and non-renewable energy consumptions are found to decrease and increase the EFP, respectively. Furthermore, the country-specific effects of ERs on the EFP were found to be more or less homogeneous to the corresponding panel estimates. Aşıcı & Acar 54 investigated how the location of non-carbon EFP (home or abroad) changes as a result of ERs in 87 countries from 2004 to 2010. They discovered that economic growth has differs effects on the location of non-carbon and carbon dimensions of EFP. Also, ERs push the economic structure towards a cleaner transformation by which resources can be exploited more effectively.
Energy consumption, economic growth and EFP
As earlier noted, energy consumption has lots of benefits. It is pivotal for economic expansion, but could as be detrimental especially when it is nonrenewable. As such, studies explored the effects of energy consumption on EFP. For instance, Liu et al. 55 explored the energy consumption, travel and tourism, trade, economic growth, and EFP in Pakistan via the Bayer and Hanck and ARDL bounds test Their findings showed that travel and tourism, energy use, and trade increase the EFP. Besides, the findings suggest a unidirectional causality from trade and energy use to EFP. Gupta et al. 56 examined the determinants of EFP and P.M2.5 in Bangladesh. They discovered that urbanization and economic growth are EFP and PM2.5. Also, natural resources and technological innovation add to environmental quality by reducing the EFP. Jahanger et al. 57 investigated whether or not, natural resource consumption, globalization, economic growth, and financial development, human capital development, economic growth, globalization, natural resource consumption, and technological innovation influence the EFP in 73 developing countries from 1990 to 2016. The findings showed that economic growth, financial development, and natural resources consumption increase the EFP.
Dogan et al. 58 examined the drivers of EFP in Mexico, Indonesia, Nigeria, and Turkey (MINT) countries for the period 1971–2013. They discovered that energy consumption and economic growth increase EFP. Alola et al. 59 discovered that energy consumption, economic growth, and trade add to the EFP in Europe. Studies like60– 63 have affirmed that nonrenewable energy increases the EFP. Table 2 presents a summary of recent studies on the impact of energy consumption, economic growth and EFP.
Studies on energy consumption, economic growth, and EFP.

Methodology, model and data
Method
This section proceeds with the CD and slope homogeneity tests because they guide the econometric procedures to adopt.
Slope homogeneity and cross-sectional dependence
Though developed by Swamy,
77
Pesaran and Yamagata (PY)
78
popularized the test and introduced two statistics from it: 
Unit root
If CD is confirmed, then the covariate augmented Dickey-Fuller (CADF) and cross-sectional augmented Im, Pesaran and Shin (CIPS) tests of Pesaran
81
are appropriate to check for unit root since they account for heterogeneity and CD.
82
The CADF is specified as:
Cointegration
The Westerlund
83
test is applied to check for cointegration. The test accounts for CD and endogeneity by adopting a bootstrap approach.
32
Westerlund
83
constructed four statistics including the group mean statistics given in Eq. (3), and the panel mean tests in Eq. (4).

Parameter estimation
Westerlund
83
points out that the ARDL approach is relevant when the time period is quite larger than the cross-sections 
Causality
The aforementioned estimators do not give information on causality, and causality is necessary for policy direction. We applied the Dumitrescu and Hurlin (DH)
88
test to ascertain the direction of causality. Its equation is given as:
Data and model
Informed by data availability, the study data spans 1990–2017 for N11 countries (see Table 1 for a list of countries). EFP is the dependent variable obtained from
20
. Trade, energy consumption, economic growth, and ERs (patents on environment technologies) are the independent variables. The first three variables are obtained from89 while ERs data is derived from OECD.
90
We specified the model as:
Results and discussion
Table 3 reports the descriptive statistics and correlation. EUS has the highest average while ERs has the least ERs has a minimum value of 0.139.
Descriptive statistic and correlation.
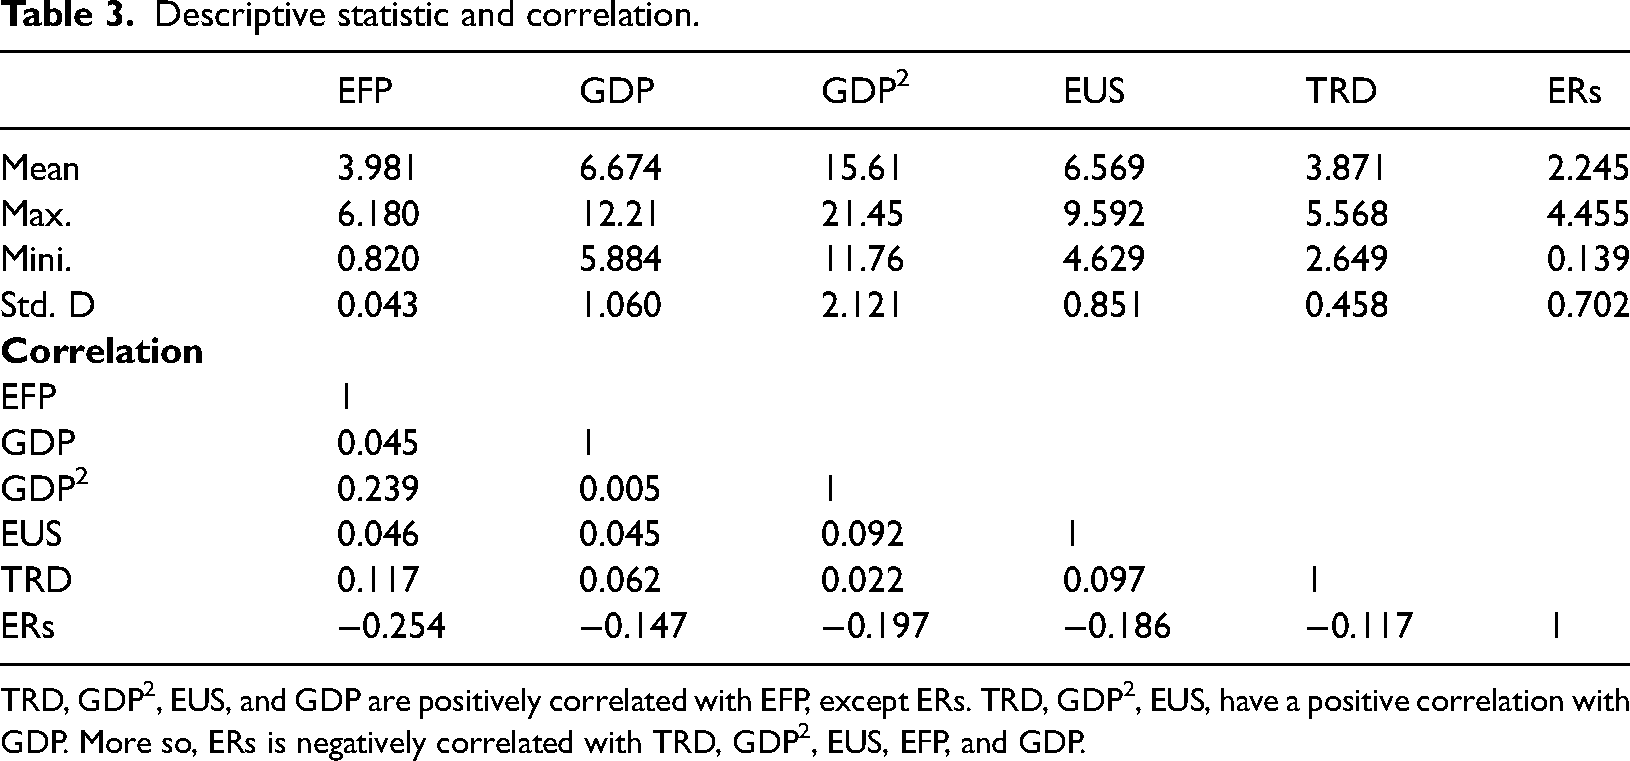
TRD, GDP2, EUS, and GDP are positively correlated with EFP, except ERs. TRD, GDP2, EUS, have a positive correlation with GDP. More so, ERs is negatively correlated with TRD, GDP2, EUS, EFP, and GDP.
The PY (2008) test affirmed the presence of heterogeneity. The results in Table 4 further confirmed CD. The N11 countries are closely knitted by virtue of their membership in international organizations and executing environmental laws like the Paris Agreement. With this outcome, the subsequent analysis would take cognizance of CD so as to ensure efficiency and robustness of the estimators. The unit root tests in Table 5 are consistent with CD. From the results, the variables are I(1).
CD results.
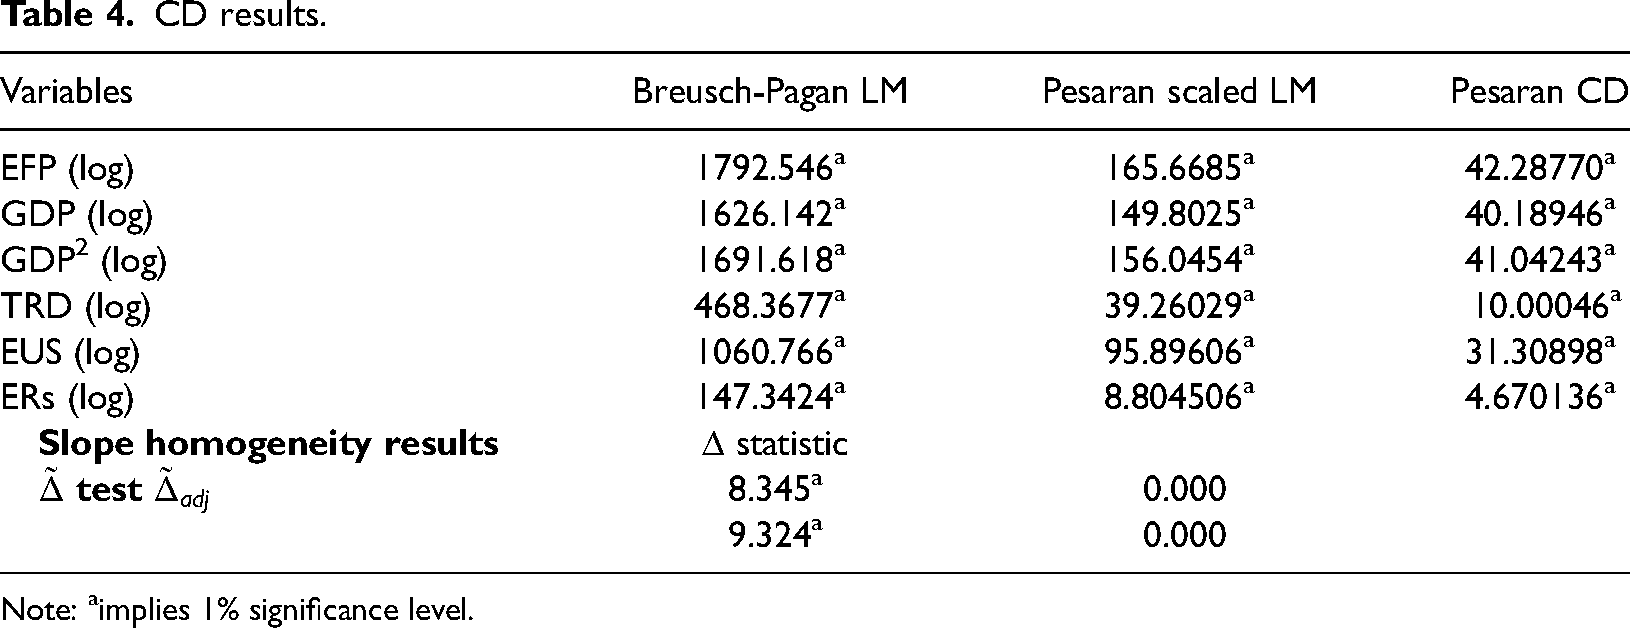
Note: aimplies 1% significance level.
Panel unit root tests.

Note: a implies statistical significance at the 1% level.
The presence of I(1) variables call for a cointegration test The Westerlund 83 test in Table 6 affirmed cointegration as the Gt and Pt statistic have probability values that are less than five per cent. Therefore, there is a need to investigate the long-run impact of the variables.
Westerlund cointegration results.
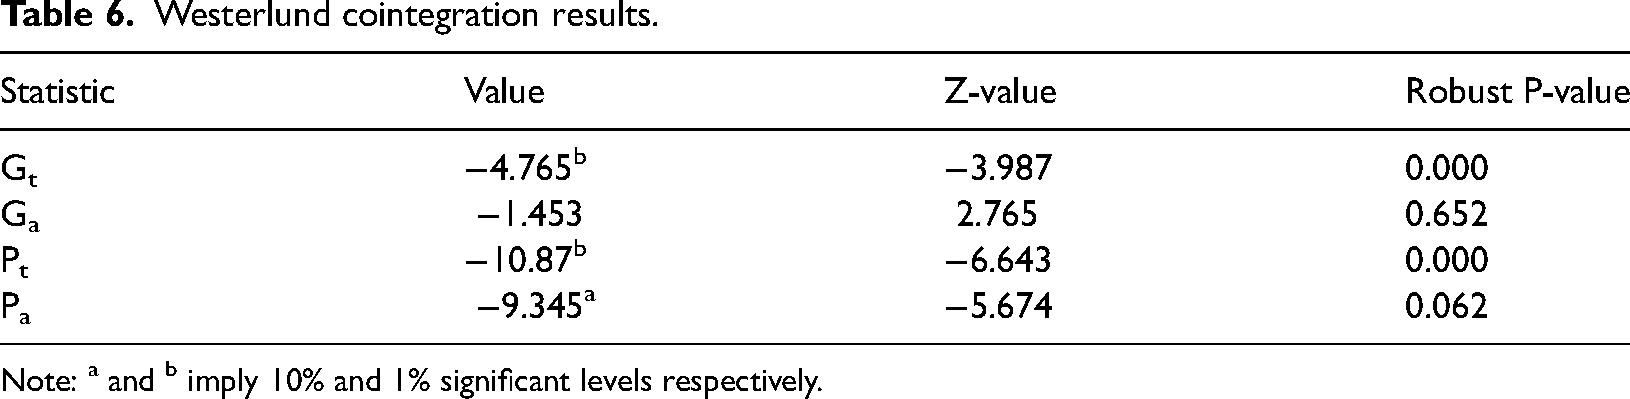
Note: a and b imply 10% and 1% significant levels respectively.
In Table 7, the three estimators confirmed the EKC hypothesis in N11 countries with the significant positive/negative coefficients of GDP/GDP2. With these results, we cannot deny that economic growth has not been consistent with environmental wellness in the N11 countries. Simply put, there is a trade-off between economic growth and EFP. Economic growth is associated with EFP increases. This complements the recent findings of Nathaniel et al., 66 Ahmed et al., 35 Ansari et al., 31 Pata & Aydin, 64 Nathaniel, 3 and Danish et al.8,91 for Middle East and Northern Africa (MENA), G7, Asia, six countries, Indonesia, and BRICS respectively. This outcome is not strange because emerging economies (typical of N11 countries) focus on achieving growth at their early phase of development, hence leaving the quality of the environment to dwindle. Analogous to economic growth, trade increases the EFP in N11 countries, and this outcome is consistent across the three estimators. This shows that N11 countries have not been engaged in sustainable trade. They indulge in trading activities that deteriorate environmental quality.
CS-ARDL, CCEMG and AMG results.
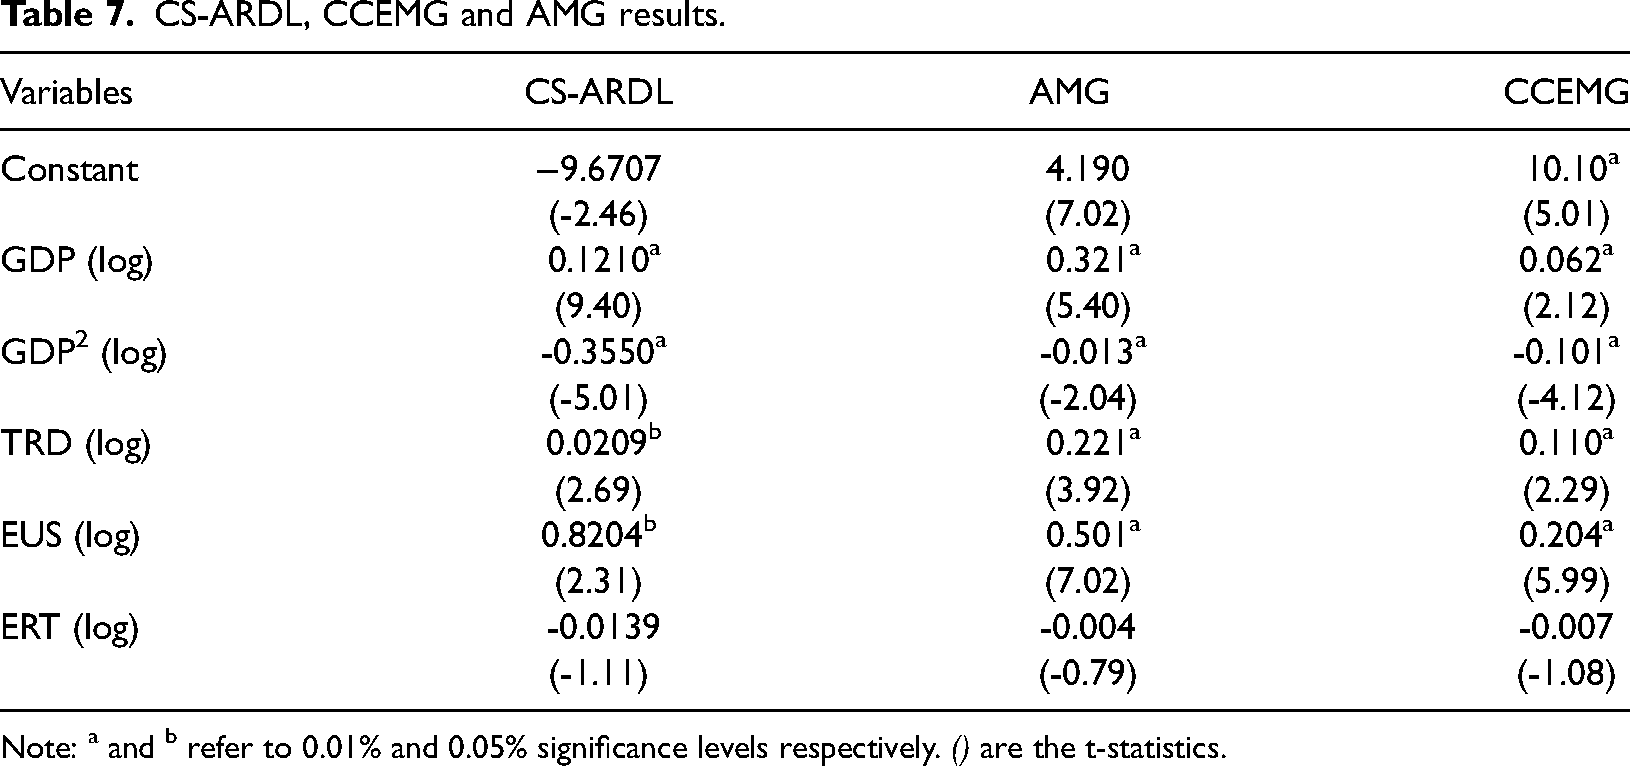
Note: a and b refer to 0.01% and 0.05% significance levels respectively. () are the t-statistics.
Trade could be detrimental to the environment especially when the import is dominated by high polluting technology and investment are concentrated in sectors that are notorious for pollution, especially mining. Unclean technology transfer which emanates from trade expansion can severely hurt the environment. Apart from economic growth and trade, energy consumption also increase the EFP. The nonrenewable energies (NRE) (like coal, fossil fuels, etc.) are the main energy source in the N11 countries. NRE is not only finite, they are pollutants, and notoriously unreliable for environmental sustainability. The recent studies of9,30,31,65,92 have all confirmed how NRE increases the EFP.
Interestingly, ERs reduces the EFP insignificant across all estimators. This suggests that ERs cannot efficiently decline environmental degradation. Simply put, ERs are weak in N11 countries. A weak ERs encourages the importation of harmful products, especially those who drive pollution.
Another look at Table 7 suggests that economic growth and energy consumption have higher coefficients compared to ERs. The intuition here is clear. The additive effects of economic growth and energy consumption supersede the negative effect of ERs. This further shows that N11 countries have weak ERs. This study supports the strengthening of ERs in the N11 countries amidst rising trade to avoid been considered a pollution haven. The earlier studies including those of Ulucak et al., 36 Cheng et al., 93 Wang et al., 49 Hashmi & Alam, 44 World Bank,41 Ouyang et al., 47 and Li and Ramanathan 94 supported the mitigating role of ERs on environmental degradation. (Tables 8 and 9)
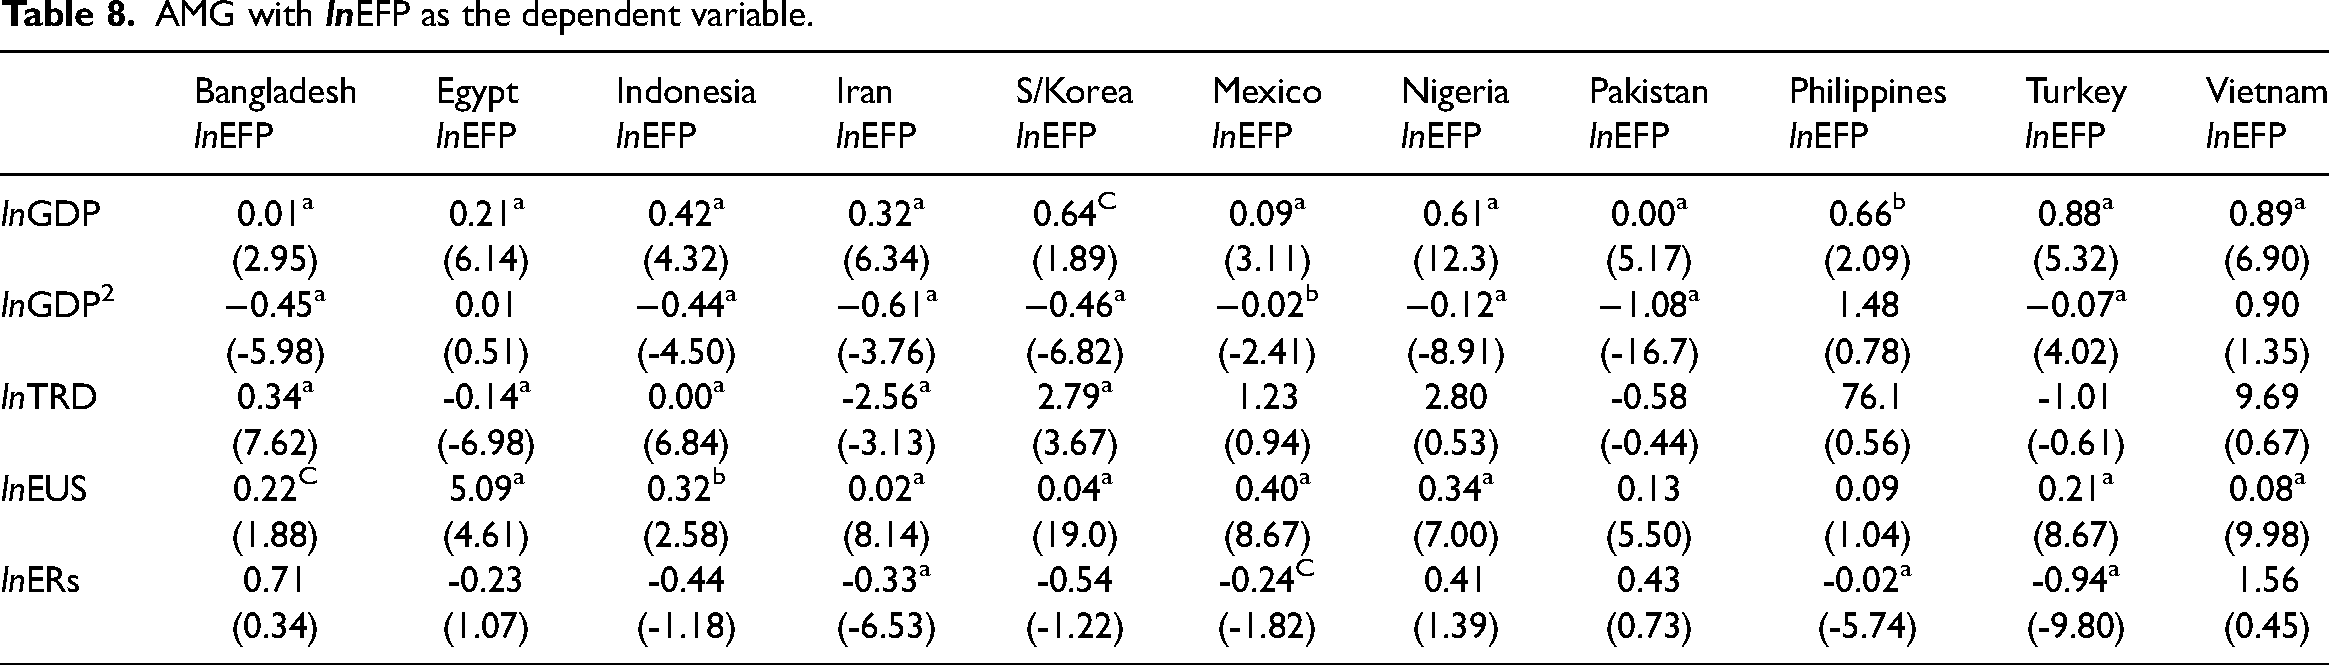
AMG with
FMOLS Results with lnEFP as the dependent variable
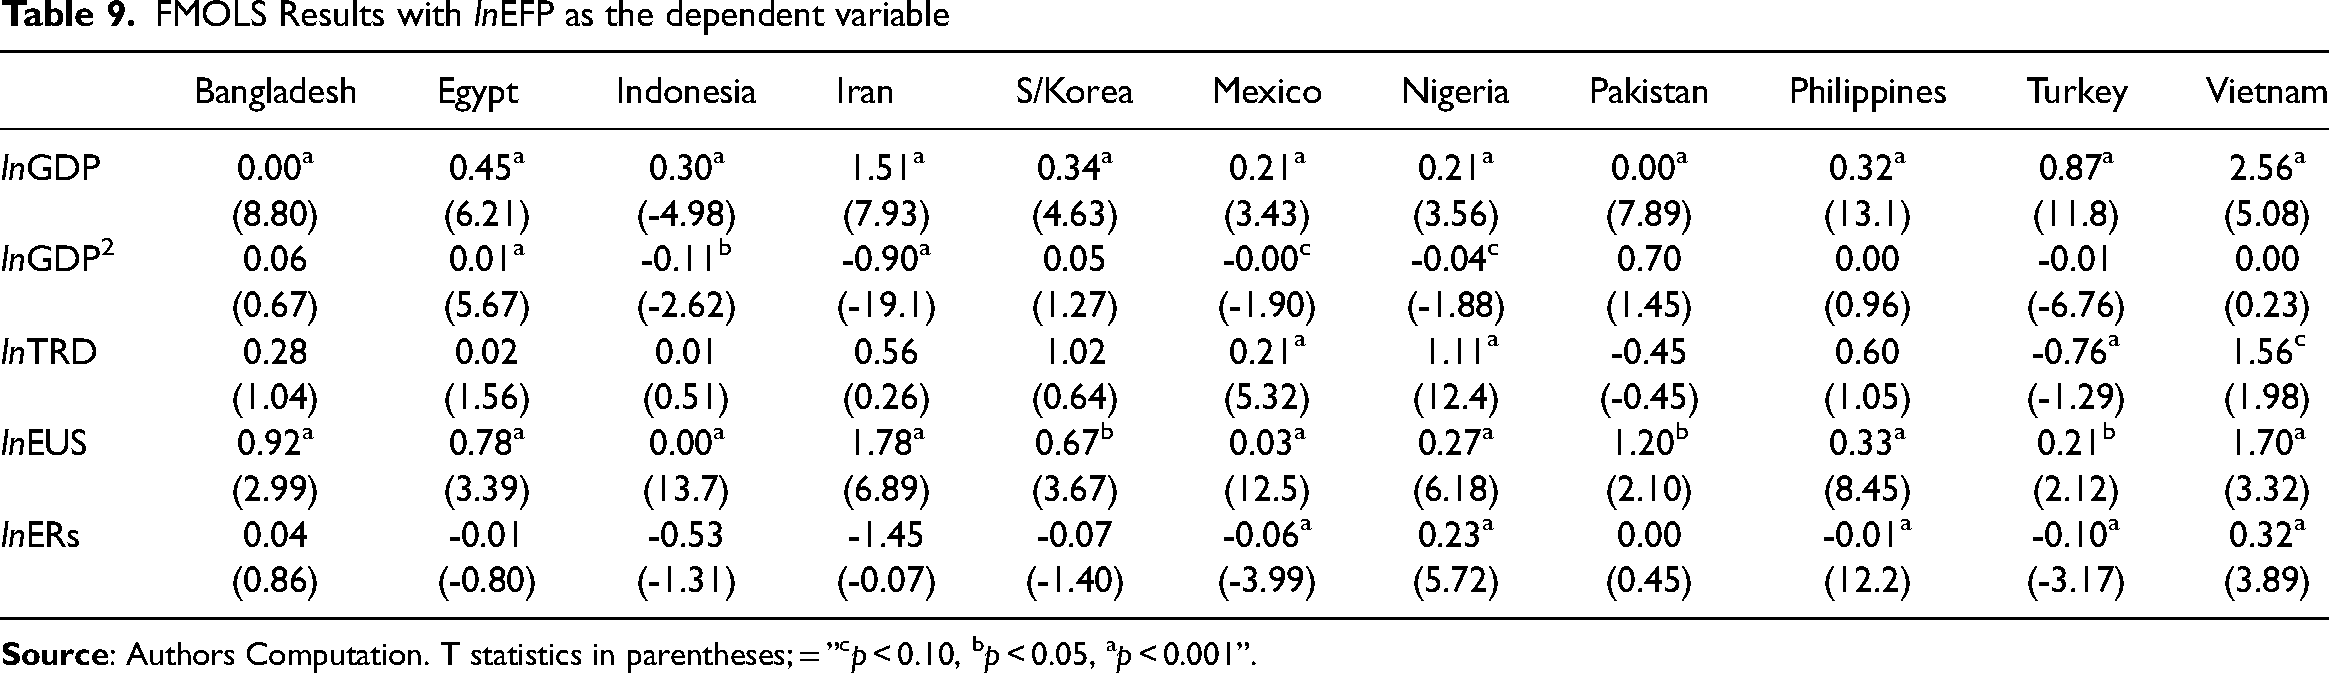
The AMG estimator and the FMOLS were applied to estimate the country-wise results. The AMG confirmed a trade-off between growth and EFP. The situation was found to be more critical in Vietnam and Turkey. The EKC hypothesis exists in all the countries, except in Egypt, Vietnam, and the Philippines. The impact of trade is mixed, while energy consumption increases the EFP in the sampled countries. As earlier mentioned, coal and fossil fuels are not environmentally friendly. They exercibates pollution, hence increases the EFP.
ERs mitigates environmental degradation significantly in Iran, Mexico, Turkey, and the Philippines, but insignificantly in Egypt, Indonesia, and S/Korea. Worthy of note is the fact that weak institutional framework and corruption could frustrate the efficiency and effectiveness of ERs in ensuring environmental preservation, but rather worsen environmental degradation.
The causality results in Table 10 affirmed that economic growth drives the EFP. Energy use Granger causes economic growth, while ERs drives the EFP, and a feedback causality is witnessed between EFP and trade, and between EFP and energy use.
DH Causality Results.
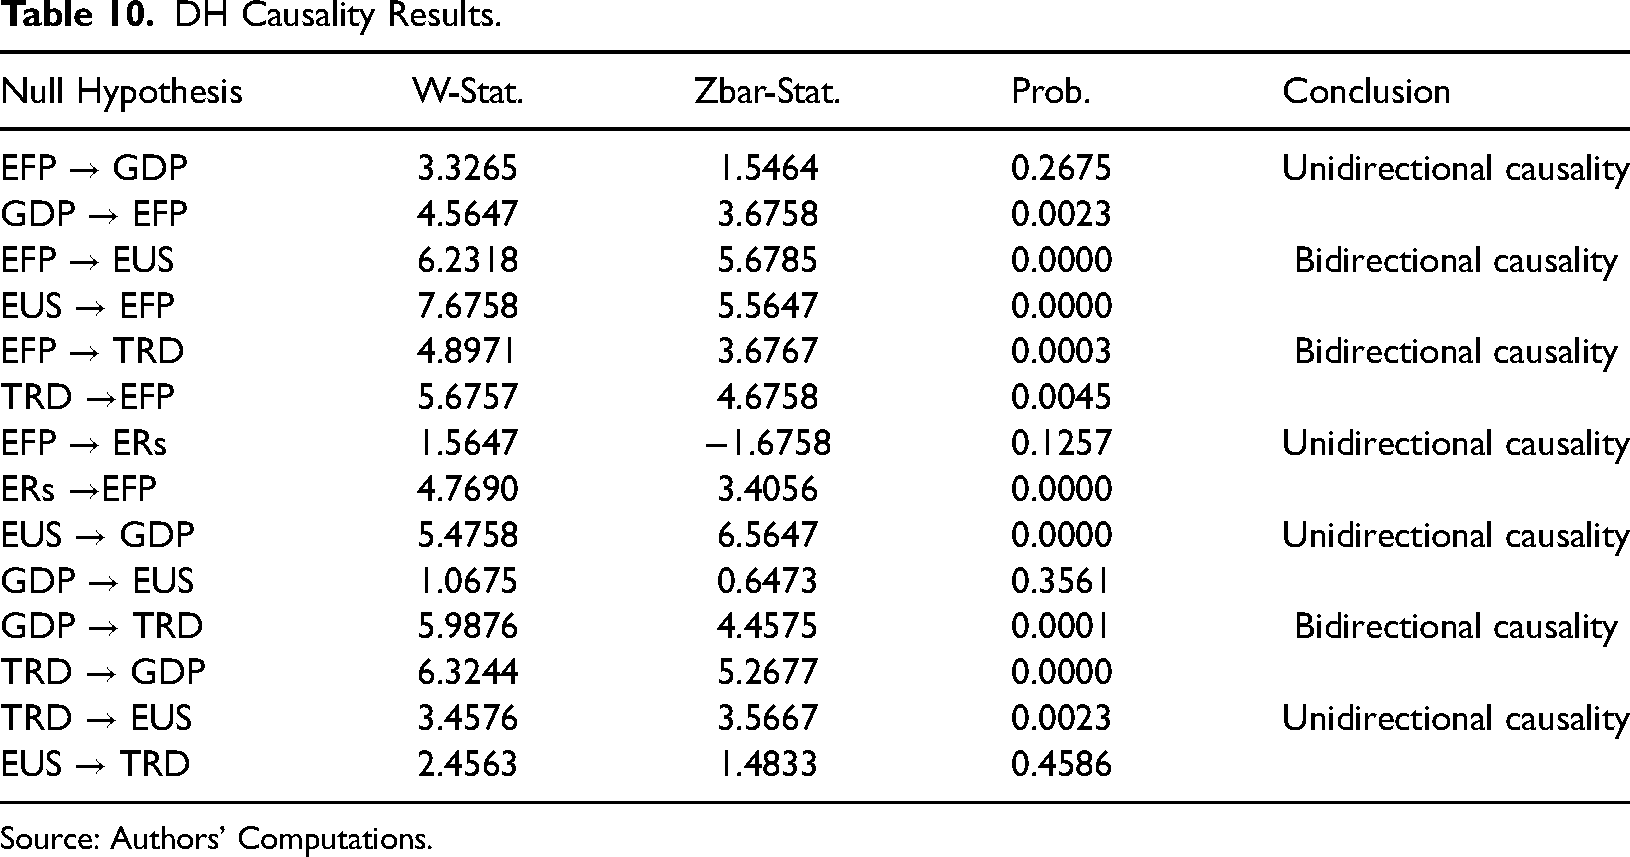
Source: Authors’ Computations.
Conclusion
We examined the ERs-EFP nexus for the N11 countries amidst trade, energy consumption, and GDP for the period 1990 to 2017. The existence of CD led to the adoption of second-generation unit root, cointegration, and causality tests. The AMG estimator suggests that ERs decreases the EFP insignificantly, while GDP, trade, and energy consumption add to the EFP. The individual country results confirmed that GDP and energy consumption increase EFP in all the countries, and the findings were consistent across all estimators. With these results, relevant policies are clearly warranted. Policymakers should endeavor to strengthen the existing ERs and ensure strict compliance so as to mitigate environmental degradation and ease the pathway to attaining the Sustainable development goals (SDGs) by 2030. Furthermore, it is ideal for these countries to invest aggressively in projects that can promote environmental innovations. In this regard, the government of these countries should incentivize the private sector to investments required for discovering technologies that can reduce environmental degradation. Simultaneously, it is also idea that the existing environmental protection laws in the N11 countries are strengthened and better implemented to enhance the achievement of the environmental sustainability objectives. Furthermore, the introduction of environmental pollution taxes can also encourage the stringency of the ERs and restore environmental welfare within the shortest period of time. More so, monetary incentives required to carry out environmental protection activities can also be provided to the associated stakeholders
Trade is not always a win-win situation. The N11 countries need to engage in ‘green’ trade by importing less polluting technology. Besides, they should also consider the various dimensions of trade (finance, import, transport, export, migration etc.) when enacting legislation that relates to environmental preservation. All the N11 countries now occupy an ecological deficit territory with non-renewable energy (NREN) being a major culprit to this quagmire. Nigeria, Indonesia, Iran, and Turkey are among the world's leading consumers of NREN. The N11 countries should transit to the consumption of renewables (like wind, solar, geothermal, hydropower, etc.) that are low in emissions. The consumption of renewables will ensure the attainment of SDGs-6 (clean water and sanitation) and SDGs-7 (Affordable and Clean Energy). Hence, societies and communities will become sustainable (SDGs-11). Another relevant way to ensure environmental quality is to make the high polluting firms pay more environmental taxes due to the negative externalities they create. This will serve as an incentive for cleaner production, and more than a palliative to the cleaner industries. The N11 countries aiming at creating a double dividend should design environmental regulation policies that are in line with their economic structure. They should also take into account successful examples.
Globalization, monetary policy, and other variables that could impact the EFP were not considered owing to the inadequate and inconsistent dataset. A comparative study that brings in human capital into the picture while addresses the nexus between ERs and EFP for different income groups may yield interesting outcomes. There is a dire need to carry out a comparative study between countries in sub-Saharan Africa and other countries with stricter environmental ERs to show the actual impact of ERs on the EFP. These are pointers for future research.
Footnotes
Declaration of conflicting interests
The author(s) declared no potential conflicts of interest with respect to the research, authorship, and/or publication of this article.
Funding
The author(s) disclosed receipt of the following financial support for the research, authorship, and/or publication of this article: This work was supported by the University of Economics Ho Chi Minh City, Vietnam., (grant number IBR_RF261).
Appendix
Variance Inflation Factor (VIF) Results
Carbon Emissions
Variable
VIF
1/VIF
GDP per capita
2.47
0.404858
Energy Use per capita, log
2.25
0.444444
Environmental regulation
1.44
0.694444
GDP per capita squared
1.57
0.636942
Trade
1.26
0.793650
Mean VIF