



Abstract
Today, pressing environmental concerns such as addressing climate change and countering global warming have taken center stage among policymakers and diverse organizations. The 2016 Paris Agreement underscores the urgency of decarbonization and the criticality of reducing CO2 emissions for fostering sustainable development. Given that environmental policies can yield diverse impacts across short-, medium-, and long-term periods, it becomes pivotal for policymakers to grasp the underlying causes of ecological footprint by scrutinizing their effects across these different timeframes and periods. Consequently, our investigation delved into the correlation and lead/lag interrelationship between ecological footprint, financial globalization, urbanization, eco-innovation, and economic growth in China spanning from 1985q1 to 2022q4. Leveraging on series of wavelet tools, our study aimed at formulating precise policies. The economic perspective derived from the wavelet analysis indicated a negative correlation between urbanization and eco-innovation with the ecological footprint, whereas economic growth and financial globalization exhibited a positive correlation with the ecological footprint. Consequently, we advocate for the implementation of appropriate policy measures to ensure that the Chinese economy charts a course toward sustainability.
Introduction
A fundamental shift from environmentally impactful sources to an emphasis on services and information has the potential to reduce overall environmental consequences, affecting both developed and emerging nations. 1 In developed and advancing economies like China, eco-innovation, the forces of globalization, and the implementation of stringent environmental regulations have played a pivotal role in significantly diminishing greenhouse gas emissions associated with energy.2,3 However, the shift in waste composition represents a significant environmental transformation, moving focus from greenhouse gas emissions to managing solid waste and effluents. 4 Despite this change, environmental pollution remains substantial, urging consideration of reforms aligning with specific sustainable development goals. Notably, SDG-7 (Sustainable Development Goal 7; affordable and renewable energy) and related objectives in SDG-8, 10, and 13, as emphasized by Ofori et al., 5 underscore the multifaceted approach needed for comprehensive environmental sustainability policies.
Moreover, Ofori et al. 5 have devised a comprehensive SDG framework designed to augment transparency within financial mechanisms. This approach leverages innovation, intending to facilitate the realization of SDG-8, specifically focusing on the promotion of decent work and economic growth. Furthermore, the integration of innovations within industrial practices emerges as a pivotal strategy. This not only fosters a reduction in ecological footprints (EFs) but also actively contributes to advancing the objectives outlined in SDG-7, emphasizing the importance of clean and affordable energy. The synergistic relationship between innovation and sustainable development goals underscores a multifaceted approach toward fostering positive economic and environmental outcomes.6,7 In alignment with this viewpoint, Ramzan et al. 8 suggest that countries with the capacity to fulfill SDG-7 are prompted to actively pursue the realization of SDG-13. To put it differently, the shift from reliance on fossil-based energy to technologies emphasizing energy efficiency will be achieved through inventive strategies aimed at mitigating environmental degradation, fostering the generation of environmentally sustainable employment, and elevating the overall quality of the environment.9,10
Several strategies are at our disposal to uphold sustainable environmental goals and mitigate ecological risks. Concurrently, advanced nations worldwide acknowledge that the most effective avenue for enhancing the environment lies in the realm of green innovations. Despite this consensus, the discourse on green innovation, also known as eco-innovation, remains a topic of debate within academic circles. Scholars continue to explore and analyze its various facets and implications.11,12 Green innovation is the intentional or unintentional creation or significant improvement of a company's goods, marketing strategies, processes, institutional arrangements, and organizational structures. It aims to contribute to resource conservation and environmental improvement by reducing risks, emission levels, and negative impacts associated with energy and resource consumption.8,12,13
Eco-innovation involves technological advancements in energy efficiency, pollution prevention, green product development, waste recycling, and corporate environmental conservation. It reduces environmental risks, optimizes resource use, encourages innovative eco-friendly practices, and includes hardware/software advancements. This comprehensive approach aids in pollution reduction, promotes energy conservation and recycling, provides a competitive edge, and enhances overall ecological efficiency. 14 Academic perspectives diverge on the association between eco-innovation and carbon emissions, reflecting ongoing debates and varied interpretations within the scholarly community. Researchers, focusing on entire economies and nations, suggest that eco-innovation reduces environmental pollution. Yet, diverse sample sets complicate this perspective, leading to conflicting outcomes and highlighting the need for further research to understand the intricate relationship between eco-innovations and EF.15,16
A prominent theme in recent literature discussions revolves around the influence of globalization, 17 particularly financial globalization, in rejuvenating environmental quality. Despite this focus, the literature's findings on this matter remain varied and inconclusive.9,18 For instance, the escalating global financial integration provides firms with the opportunity to achieve economies of scale in the production process. Consequently, this can foster the development of technology aimed at reducing pollution.19,20 Urbanization, a complex interplay of economic and environmental processes crucial for regional sustainable development, 21 involves the horizontal expansion of cities, indicating increased urban built-up areas. A recent study predicts that 68% of the global population will be in urban areas by 2050. Moreover, the urbanization rate in China has notably surged from 17.92% to 52.5% in recent decades.22,23 This undeniable demographic shift, coupled with the substantial rural-to-urban migration, is expected to trigger a parallel increase in demand for urban built-up areas, stimulating the growth of regional economies. The expected population growth and rural-to-urban migration are likely to drive an increased demand for urban built-up areas, promoting regional economic development. However, the rapid urbanization in China unveils spatial disparities influenced by diverse social and economic trajectories and distinct land policies.4,11 Amidst rapid urbanization, obtaining precise spatial economic information is essential to explore the diverse relationships between urban greenery and economic growth. However, traditional statistics lack the capability to identify the spatial characteristics of economic growth in various urban areas.
Aims and contribution of the study
To date, no studies in the existing literature have delved into the research objective and question; what is the combined impact of eco-innovation and financial globalization on ecological quality in China, and how can a wavelet analysis provide insights into the temporal and frequency dynamics of these variables?, within the realm of China. This gap in the literature pertains specifically to understanding the synchronized impacts of green innovation, financial globalization, economic growth levels, and urbanization. Additionally, a notable gap in the existing literature is the scarcity of studies that concurrently consider EF to comprehensively assess ecological quality in the context of China. Furthermore, from an experimental standpoint, few prior studies have explored the role of eco-innovation, financial globalization, and urbanization within the country's framework to understand their collective influence on ecological quality. This research, therefore, serves the purpose of filling and addressing these gaps in the current research landscape.
The study adds significant value to the current literature in the following key aspects:
By centering on China, the study provides unique insights into the intricate dynamics among eco-innovation, financial globalization, and ecological quality in a rapidly developing and environmentally significant nation. The use of wavelet analysis is a methodological innovation that introduces a nuanced approach to examining the temporal and frequency dynamics of the variables under scrutiny. This enhances the precision and depth of the study's findings. The study's results are poised to provide practical guidance for policymakers in shaping strategies that advance sustainable development and ecological wellbeing within the evolving landscape of eco-innovation and financial globalization in China.
Subsequently, the article is divided into four sections: the second section delve into the overview of the literature, the third section outlines the data and methods adopted, the fourth section presents the empirical results and discussion, and the fifth section concludes with policy inferences.
Overview of the literature
After delineating specific observed trends pertinent to the subject of investigation, the study proceeds to delineate the existing corpus of scholarly works investigating the interactions between eco-innovation, economic growth, financial globalization, urbanization, and EF employing diverse indicators as proxies for ecological qualify.12,24,25 Conversely, numerous research endeavors have utilized CO2 and EF as a metric for assessing ecological degradation, generating varied outcomes that, in turn, contribute to valuable policy inferences. 19
Eco-innovation—ecological footprint nexus
In the face of the imminent Fourth Industrial Revolution, there is a widely held belief that the achievement of the SDGs primarily hinges on technological innovation. 26 In the given framework, it is foreseeable that technological innovations will impact not only various environmental attributes but also contribute to their transformation. 24 Crucially, there is a prevalent hypothesis suggesting that eco-innovation holds the key to mitigating and addressing the myriad environmental challenges encountered on a global scale.25,27 In previous research, conventional approaches have relied on utilizing carbon dioxide (CO2) emissions as an indicator of environmental decline when examining the interconnection between eco-innovation and environmental quality. For instance, examining data from China, Li et al. 12 investigate the correlation between eco-innovation and (CO2) emissions within the framework of the Environmental Kuznets Curve (EKC). The study's findings consistently indicate a significant negative impact of eco-innovations on CO2 emissions across a broad range of quantiles, from 0.05 to 0.90.
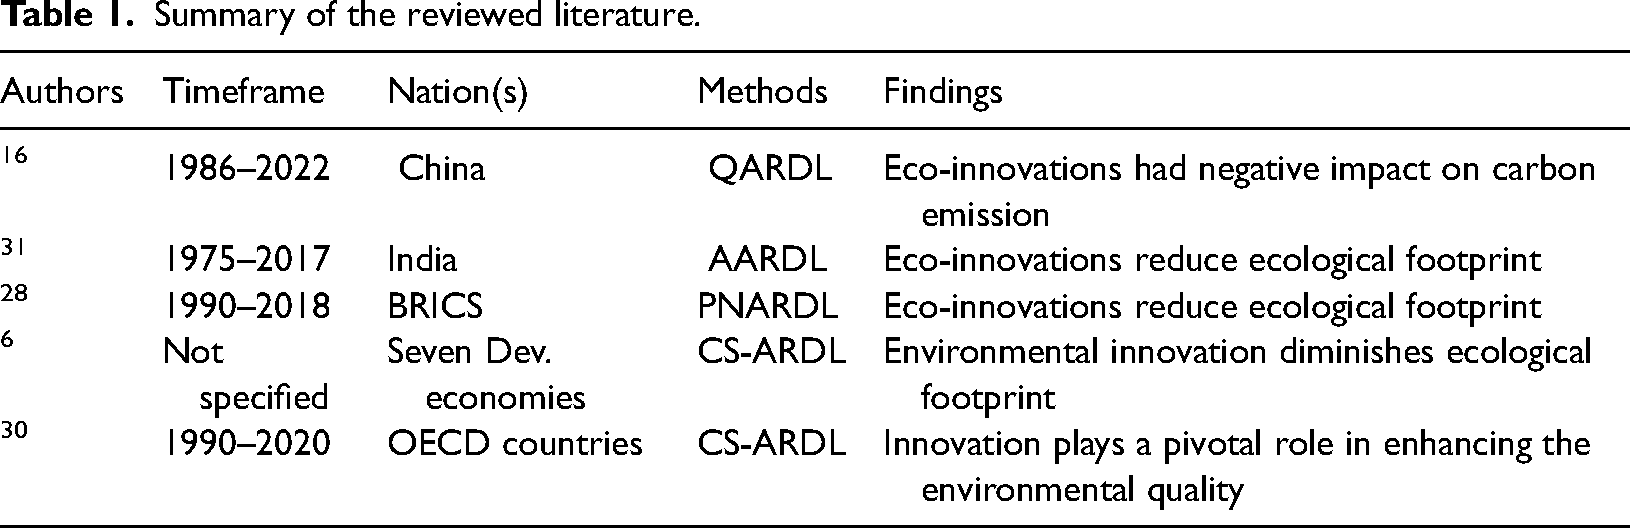
Conversely, Wang et al. 27 refer eco-innovation as a potential approach to address climate change applying the AARDL methodology; this research explores the co-integration relationship among the variables within the EKC framework for India over the period from 1975 to 2017. The findings indicate that eco-innovation has the potential to alleviate climate change by diminishing the EF. Ojekemi and Ağa’s 28 study explores the effects on eco-innovation on ecological employing PNARDL technique. The outcome of the study reveals that an increase in eco-innovation is linked to a reduction in the EF and also revealed the existence of co-integration among the variables specified. 29 carried out a study in seven developed economies utilizing CS-ARDL technique within 26 years. The outcome of the study revealed that EF is reduced through environmental innovation. Furthermore, in the context of developed economies, however, the long-term trajectory involves a decrease in EF through initiatives of environmental innovation. Appiah et al.’s 30 study revealed environmental quality of OECD countries sees improvement through the implementation and advancement of innovation. The research findings unveil a two-way causation relationship between EF and eco-innovation. Based on the reviewed literature, there is no existing study linking eco-innovation and ecological using wavelet coherence as a technique which serves as the literature gap the study intends to fill. Table 1 shows summary of the finding.
Summary of the reviewed literature.
Financial globalization—ecological footprint nexus
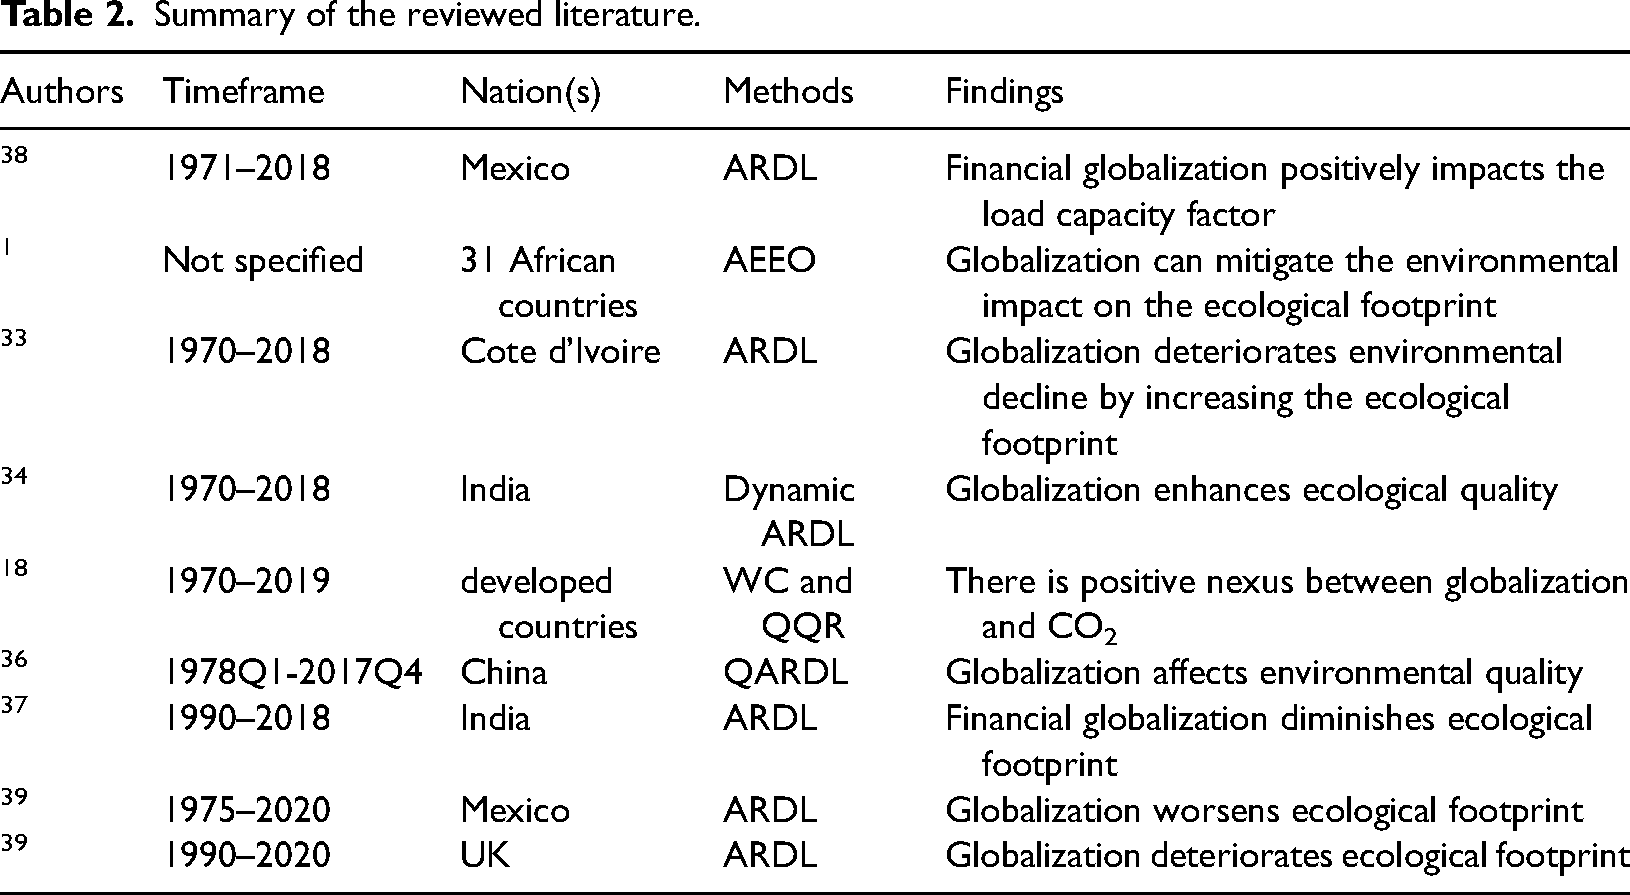
In recent years, there has been a growing interest in examining the impact of globalization on environmental deterioration. However, studies exploring this theme present varied and mixed findings.9,32 For instance, globalization is recognized for its role in decreasing the EF through improvements in environmental quality. 1 On the flip side, globalization is noted for elevating the EF by generating adverse externalities on environmental wellbeing.33,34 In recent studies, a positive correlation between globalization and CO2 emissions has been observed, as documented by Huo et al. 18 and Xia. 35 Examining the interrelation between financial globalization and the adoption of renewable energy, Raihan et al. 38 delve into their combined impact on Mexico’s load capacity factor. The study employs the load capacity factor as a unique metric to assess ecological health, providing a comprehensive evaluation of the ecosystem by sequentially appraising both biocapacity and ecological effects. They found that financial globalization demonstrates positive effects on the load capacity factor in both the short and long term.
As indicated by Sharif et al., 36 globalization is recognized as a potential mechanism affecting environmental quality, particularly within the context of policymaking. In their study on China, the researchers employed QARDL analysis to uncover a negative impact of globalization on environmental externalities. Their article suggests the importance of aligning energy and other policies with the trajectory of globalization, asserting that such synchronization could transform the globalization process into an effective tool for fostering sustainable development. The majority of discussions focus on the interaction between global forces and the environment using a broad indicator of globalization. However, a limited but expanding body of literature has recently begun to investigate this relationship by analyzing specific components within the broader concept of globalization. As an illustration, research indicates that financial globalization diminishes the EF by enhancing environmental wellbeing. 37 Table 2 shows summary of the finding.
Summary of the reviewed literature.
Urbanization, economic growth—ecological footprint nexus
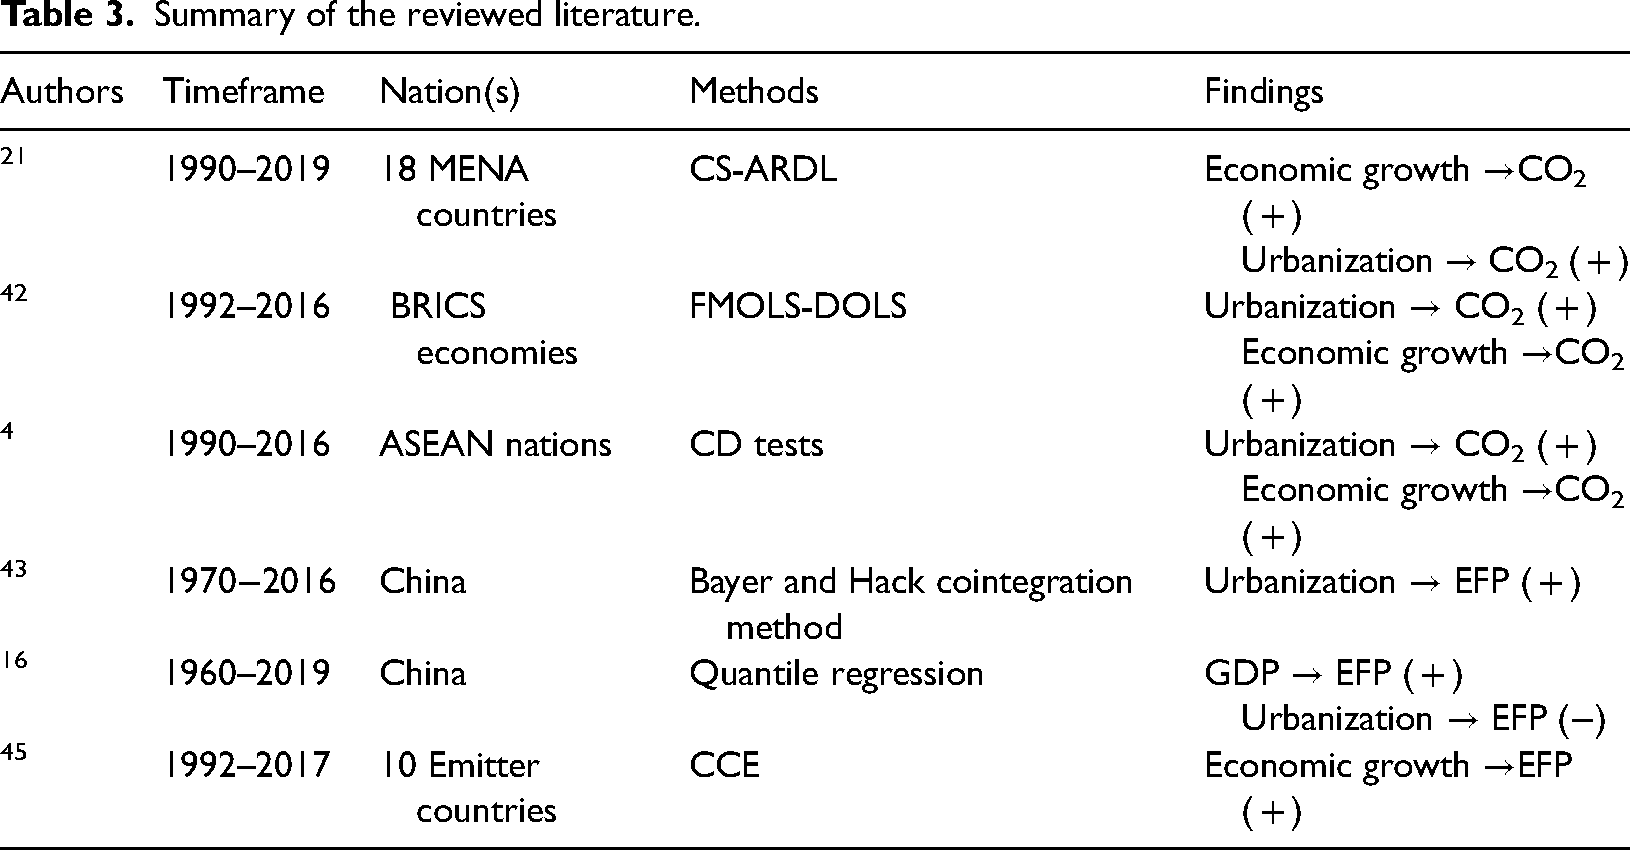
The current body of literature examining the connection between urbanization and EF reflects diverse viewpoints. Multiple studies, such as those conducted by Parikh and Shukla 40 and Cole and Neumayer, 41 propose that the rise in urbanization leads to increased energy usage, harmful emissions, and a subsequent decline in environmental sustainability. On the contrary, findings from research, exemplified by Chen et al., 22 suggest that the advancement of urbanization contributes to increased energy efficiency. This, in turn, leads to a reduction in energy consumption and a favorable enhancement of ecological conditions. In their investigation of the EF within BRICS economies, Danish et al. 42 explored the influence of urbanization. Utilizing the FMOLS and DOLS models, their findings suggest that urbanization plays a role in diminishing the EF and promoting improved environmental sustainability. Satari Yuzbashkandi et al. 21 examined the interconnections between economic expansion, urbanization, and energy efficiency on CO2. Their findings indicate varying significance of explanatory variables across regional panel clusters, with long-term CO2 showing a significantly positive impact from economic growth. Their study refutes the validation of the EKC hypothesis and underscores the significance of energy efficiency in improving environmental quality over both short and long periods.
In a divergence from previous studies, Nathaniel and Khan 4 delved into the intricate relationship between urbanization and the EF within ASEAN nations over the period from 1990 to 2016. Their comprehensive analysis suggested that urbanization played a pivotal role in amplifying the EF during the study duration. In a parallel context, Ahmed et al. 43 provided additional support to this perspective by confirming that the process of urbanization in China negatively affects environmental sustainability, contributing to a discernible rise in China's EF. The interconnection between economic growth and CO2 is vital for ensuring sustainable progress. Since every economic activity relies on energy, the GDP exerts a considerable influence on environmental pollution. 44 The concept of the EKC offers a framework for examining the interplay between GDP and environmental wellbeing.
Magazzino 16 investigates the impact of various factors on the environment. According to the results obtained through Quantile Regression estimates, increased electricity consumption and real GDP are associated with EF increase. Conversely, trade and urbanization are found to be linked with a reduction in EF, contributing to an enhanced environmental quality. Shahbaz et al. 45 employed annual data from 1992 to 2017 for the top 10 countries with the highest EF. The Panel LM bootstrap test confirms cointegration among variables. Results from the CCE coefficient estimator reveal economic growth negatively impact environmental quality, leading to an increased EF. Table 3 shows summary of the finding.
Summary of the reviewed literature.
Evaluation of the literature
The analysis of the literature mentioned above indicates that most studies explore interrelationships using a linear framework. Moreover, empirical findings suggest that the association between urbanization, economic growth, and the environment lacks a clear consensus. However, the prevailing literature consistently supports the negative impact of energy on the environment. Earlier studies have predominantly employed carbon emissions or similar pollutants as metrics for gauging ecological dilapidation. In contrast, contemporary research has embraced the EF as a more comprehensive indicator of environmental quality, capturing the overall extent of environmental deterioration. It is noteworthy that, as of now, there is an unaddressed gap in the existing literature, with no prior investigations examining the impact of eco-innovation, financial globalization, economic growth, and urbanization on ecological quality in China using a wavelet coherence framework. Furthermore, no prior study has investigated the evolving determinants of ecological quality in China, which is crucial given the country’s pressing environmental concerns, including a growing EF and substantial energy consumption. The present research endeavors to comprehensively address these lacunae in the literature.
Data and methods
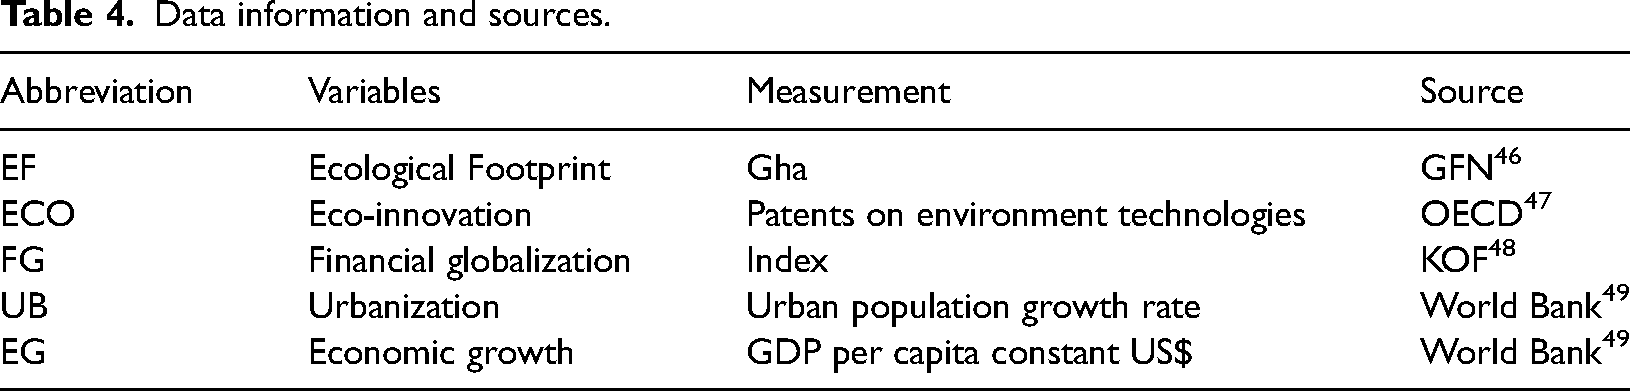
The study encompasses the period between 1985Q1 and 2022Q4, concentrating on China with a high frequency dataset. Data were sourced differently (see Table 4). The selection of these variables is driven by their relevance and importance in comprehensively exploring the various facets of the study’s emphasis on China. Each variable offers a distinct viewpoint, contributing to a thorough analysis of the factors that shape the impact of eco-innovation and financial globalization on ecological quality in the Chinese context.
Data information and sources.
Descriptive statistics.

ECO: eco-innovation; EF: ecological footprint; EG: economic growth; FG: financial globalization; UB: urbanization.
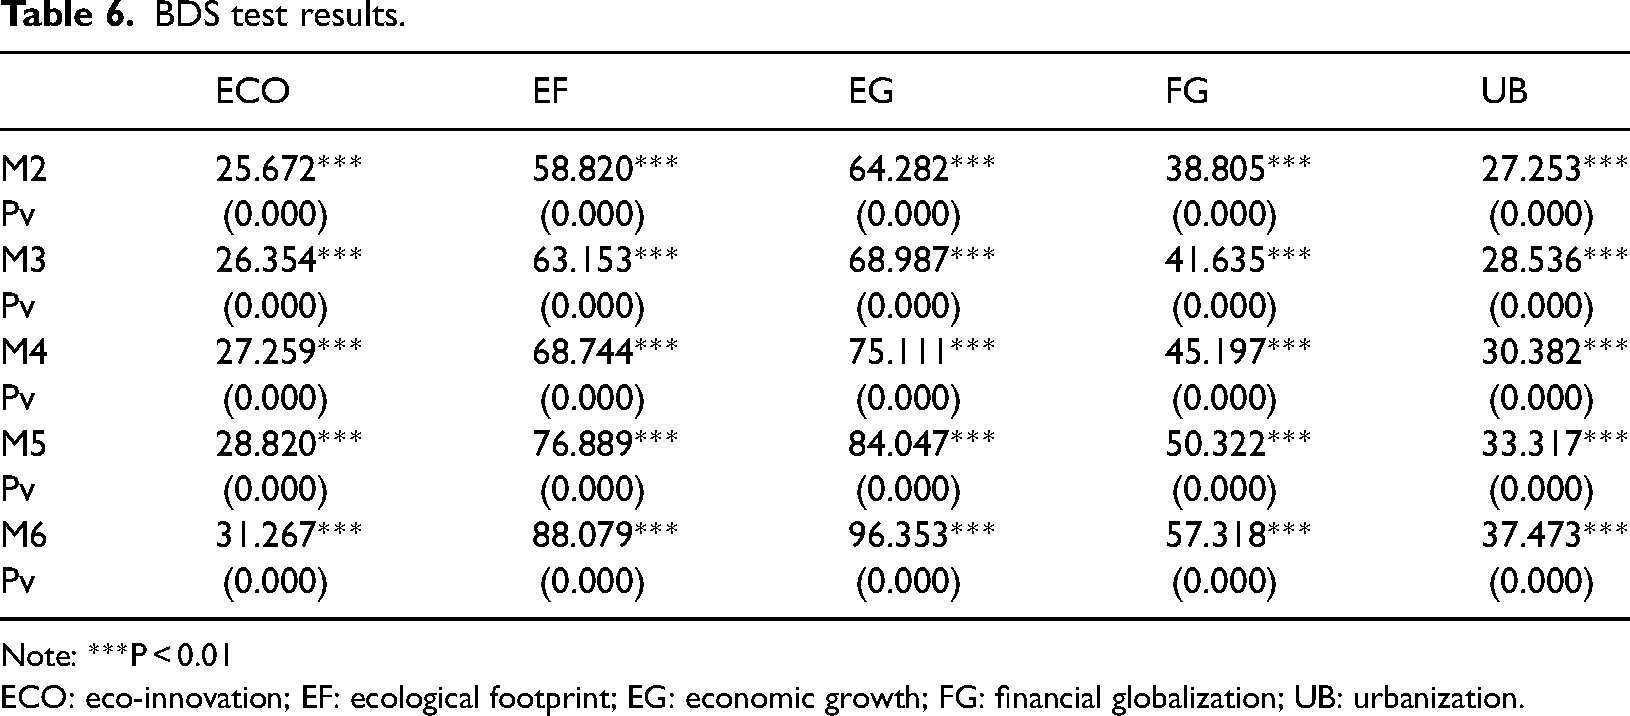
BDS test results.
Note: ***P < 0.01
ECO: eco-innovation; EF: ecological footprint; EG: economic growth; FG: financial globalization; UB: urbanization.
According to Dar et al., 50 the genuine economic connections between variables are anticipated to be apparent at a more detailed (scale) level rather than the typical level of aggregation. Therefore, our approach in the time-frequency domain (TFD) method enables us to observe not only the evolution of the relationship between eco-innovation and the ecological quality over time but also how this interaction fluctuates across different frequencies. These dimensions hold significance for economic and environmental policies as this perspective provides valuable strategic insights into the necessary policy adjustments during specific economic contexts. Grinsted et al. 51 wavelet stands out as a highly effective tool in the time-frequency domain, addressing the aforementioned aspects. In wavelet analysis, the initial step involves selecting a wavelet function with zero mean and finite energy. We choose the Morlet wavelet initiated by Goupillaud et al. 52 due to its balanced compromise between time and frequency localization.
We assume the time-series (xn), where n = 0… N − 1, with 
Wavelet coherency
According to Aguiar-Conraria et al.,
53
the wavelet coherency (WTC) provides insight into the local correlation between two time series by evaluating the ratio of their cross-spectrum to the product of their individual spectra. Essentially, it allows us to examine how correlated the two series are at different time points and frequency levels, offering a nuanced understanding of their relationship in both time and frequency domains.
Wavelet cohesion
Rua
54
initiated the wavelet cohesion (WC), which is built on
55
groundwork and extending WTC, overcomes limitations in noisy time series. Rua
54
devised a co-movement measure 
Partial wavelet coherence
Partial wavelet coherence (PWC) shares similarities with partial coherence. Analyzing PWC involves using the wavelet transformation method, which isolates the wavelet coherence (WTC) for the 






Multiple wavelet coherence
The multiple wavelet coherence (MWC) methodology is suitable for appraising the coherence among various indicators with an additional control indicator. The representation for the MWC is articulated in the equation provided below:
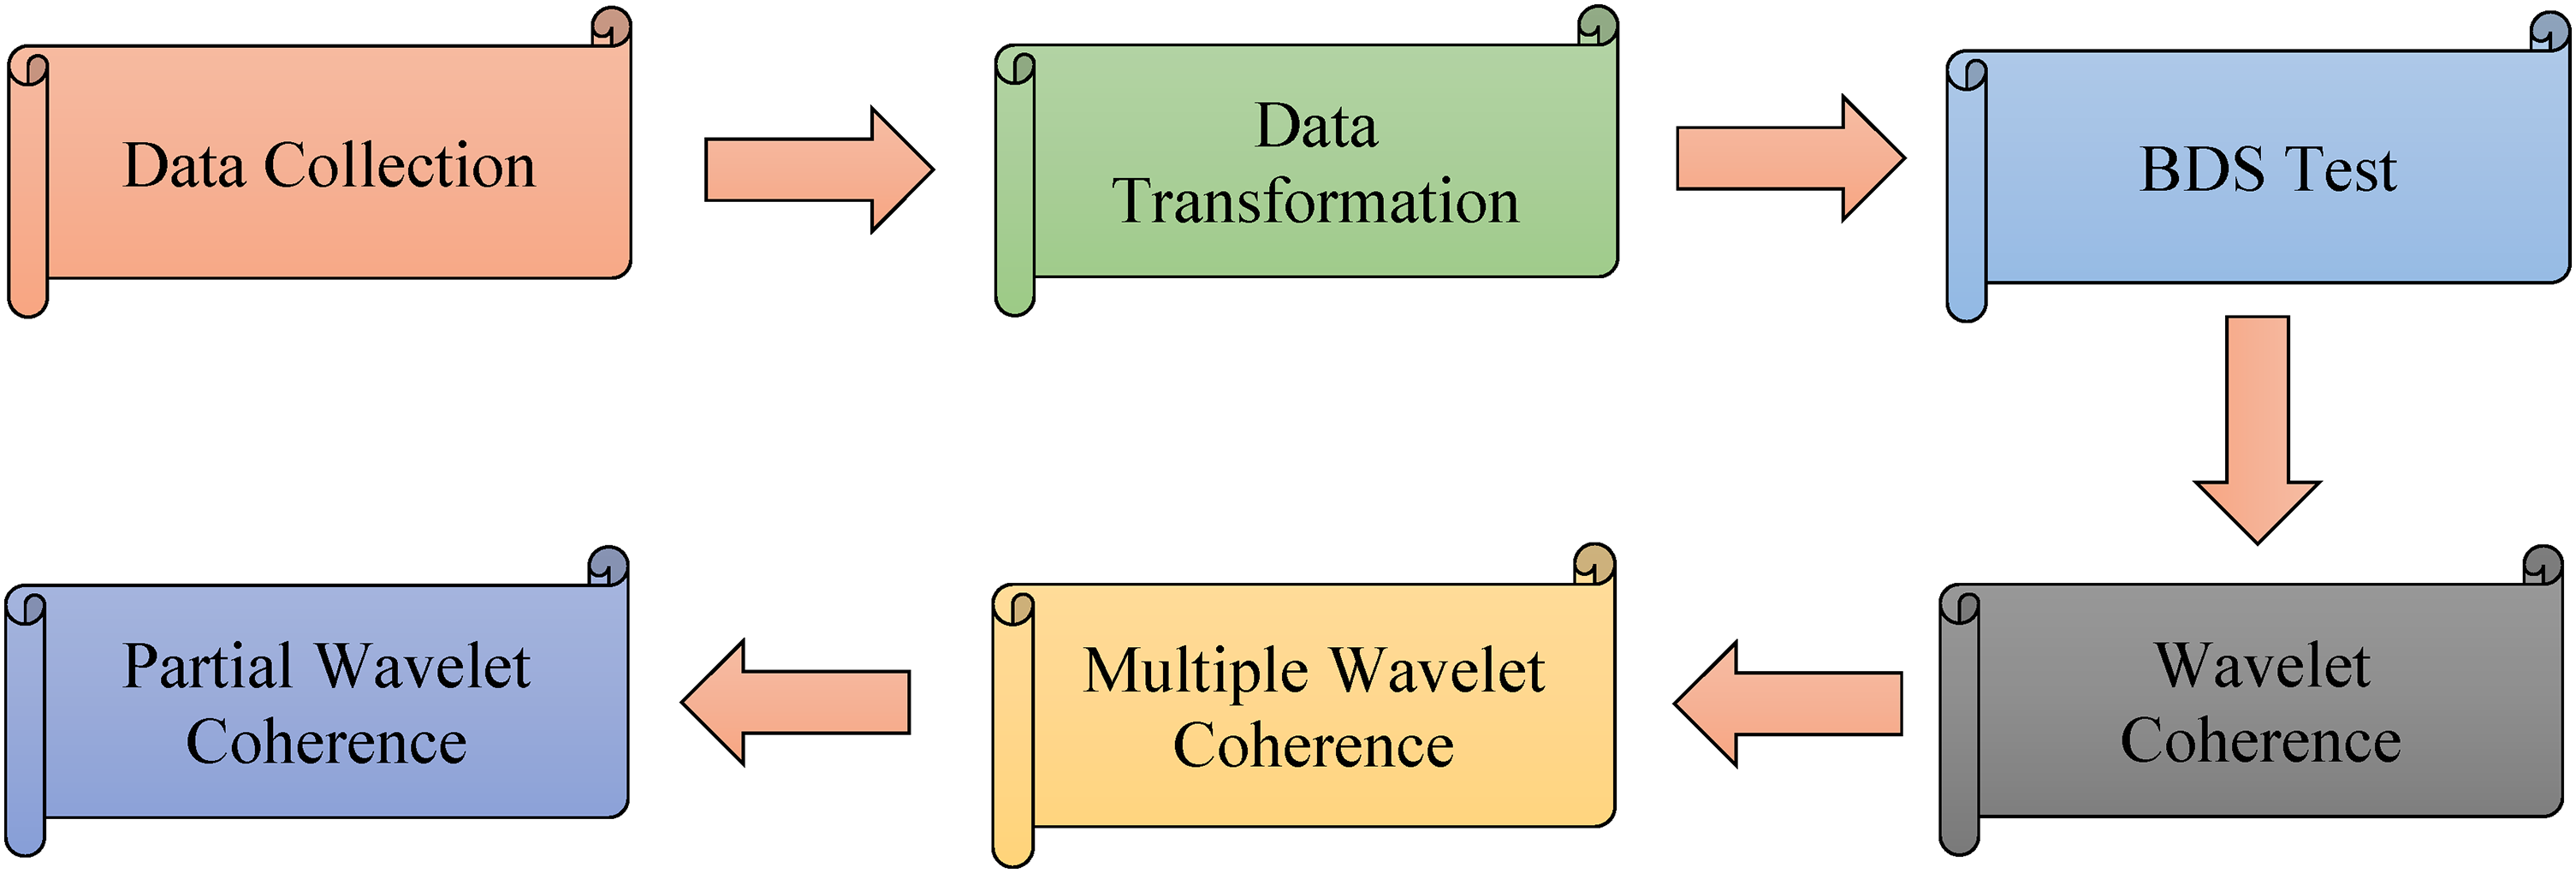
Analysis flowchart.
Findings and discussions
Description of data
The analysis initiated with an exploration of the dataset’s statistical characteristics. Table 5 provides a comprehensive overview of the descriptive statistics of the data. The variables under study, namely ECO (eco-innovation), EF, EG (eco-innovation), FG (financial globalization), and UB (urbanization), exhibit distinct measures: their respective means are 2.1521, 0.7773, 8.0042, 3.9395, and 1.2456. Delving into the range of values, it becomes apparent that ECO spans from 1.304 to 2.576, EF ranges from 0.215 to 1.296, EG extends between 6.482 and 9.357, FG varies from 3.410 to 4.174, and UB fluctuates from 0.463 to 1.531. Of note, EF emerges as the most volatile variable, showcasing a volatility measure of 0.904, whereas ECO displays the lowest volatility at a value of 0.2304. Furthermore, the skewness analysis indicates a negative skew for all variables—ECO, EF, EG, FG, and UB. Moreover, while ECO and UB demonstrate leptokurtic tendencies, EF, EG, and FG exhibit platykurtic characteristics, as observed from their respective kurtosis values. A critical assessment using the Jarque-Bera test reveals that none of the study variables conform to a normal distribution, as indicated by the associated probability values, signifying deviations from the normality assumption in the dataset's distribution patterns.
Nonlinearity test result
Subsequently, we proceeded to assess the linearity of the variables under scrutiny. To investigate potential nonlinearities within the series, we employed the BDS test method proposed by Broock et al. 57 The results of the BDS test, outlined in Table 6, indicate a presence of nonlinearity across the series encompassing ECO, EF, EG, FG, and UB. Notably, these findings align with the outcomes derived from the Jarque-Bera test, reinforcing the indication of nonlinear characteristics within the dataset. It is imperative to underscore that these outcomes highlight the potential pitfalls associated with employing linear methodologies in this investigation. The presence of nonlinearity within the variables suggests that employing linear approaches could yield misleading or inaccurate results. Hence, in response to the inherent nonlinearity observed and with a strong commitment to strengthening the credibility of our analysis, a conscious decision was made to depart from the traditional methodologies commonly employed in prior studies. Instead, this study opts for the utilization of wavelet tools, marking an unconventional approach. By doing so, we align our investigative strategies with the methodologies elucidated in the studies conducted by Alola et al. 58 and Pata et al. 59 These studies offer a structured framework for exploring the determinants influencing the EF in China. This approach is particularly well-suited to accommodate the nonlinear characteristics inherent in the variables under scrutiny. This departure from established methodologies is aimed at enhancing the accuracy and relevance of our findings, specifically in grasping the factors that exert significant influence on the EF within the Chinese context.
Wavelet coherence results
Next, the wavelet coherence (WTC) is used in determining the co-movement between EF and its drivers including financial globalization, urbanization, economic growth, and eco-innovation in China. The results of the WTC are shown in Figure 2. Figure 2(a) visually illustrates the correlation in movement between EF and EG. Across diverse time periods and frequencies spanning from 1985 to 2022, specifically within the quarterly scale range of 1 to 32, the arrows consistently point toward the right. This directional alignment signifies an in-phase connection between the variables, indicating a positive correlation between EG and EF throughout the entire study period. Additionally, the arrows pointing right-up and right-down indicate a lead-lag interrelationship between both series. This intriguing finding suggests that both EG and EF have the capability to forecast or predict each other’s movements across various frequencies and time periods.
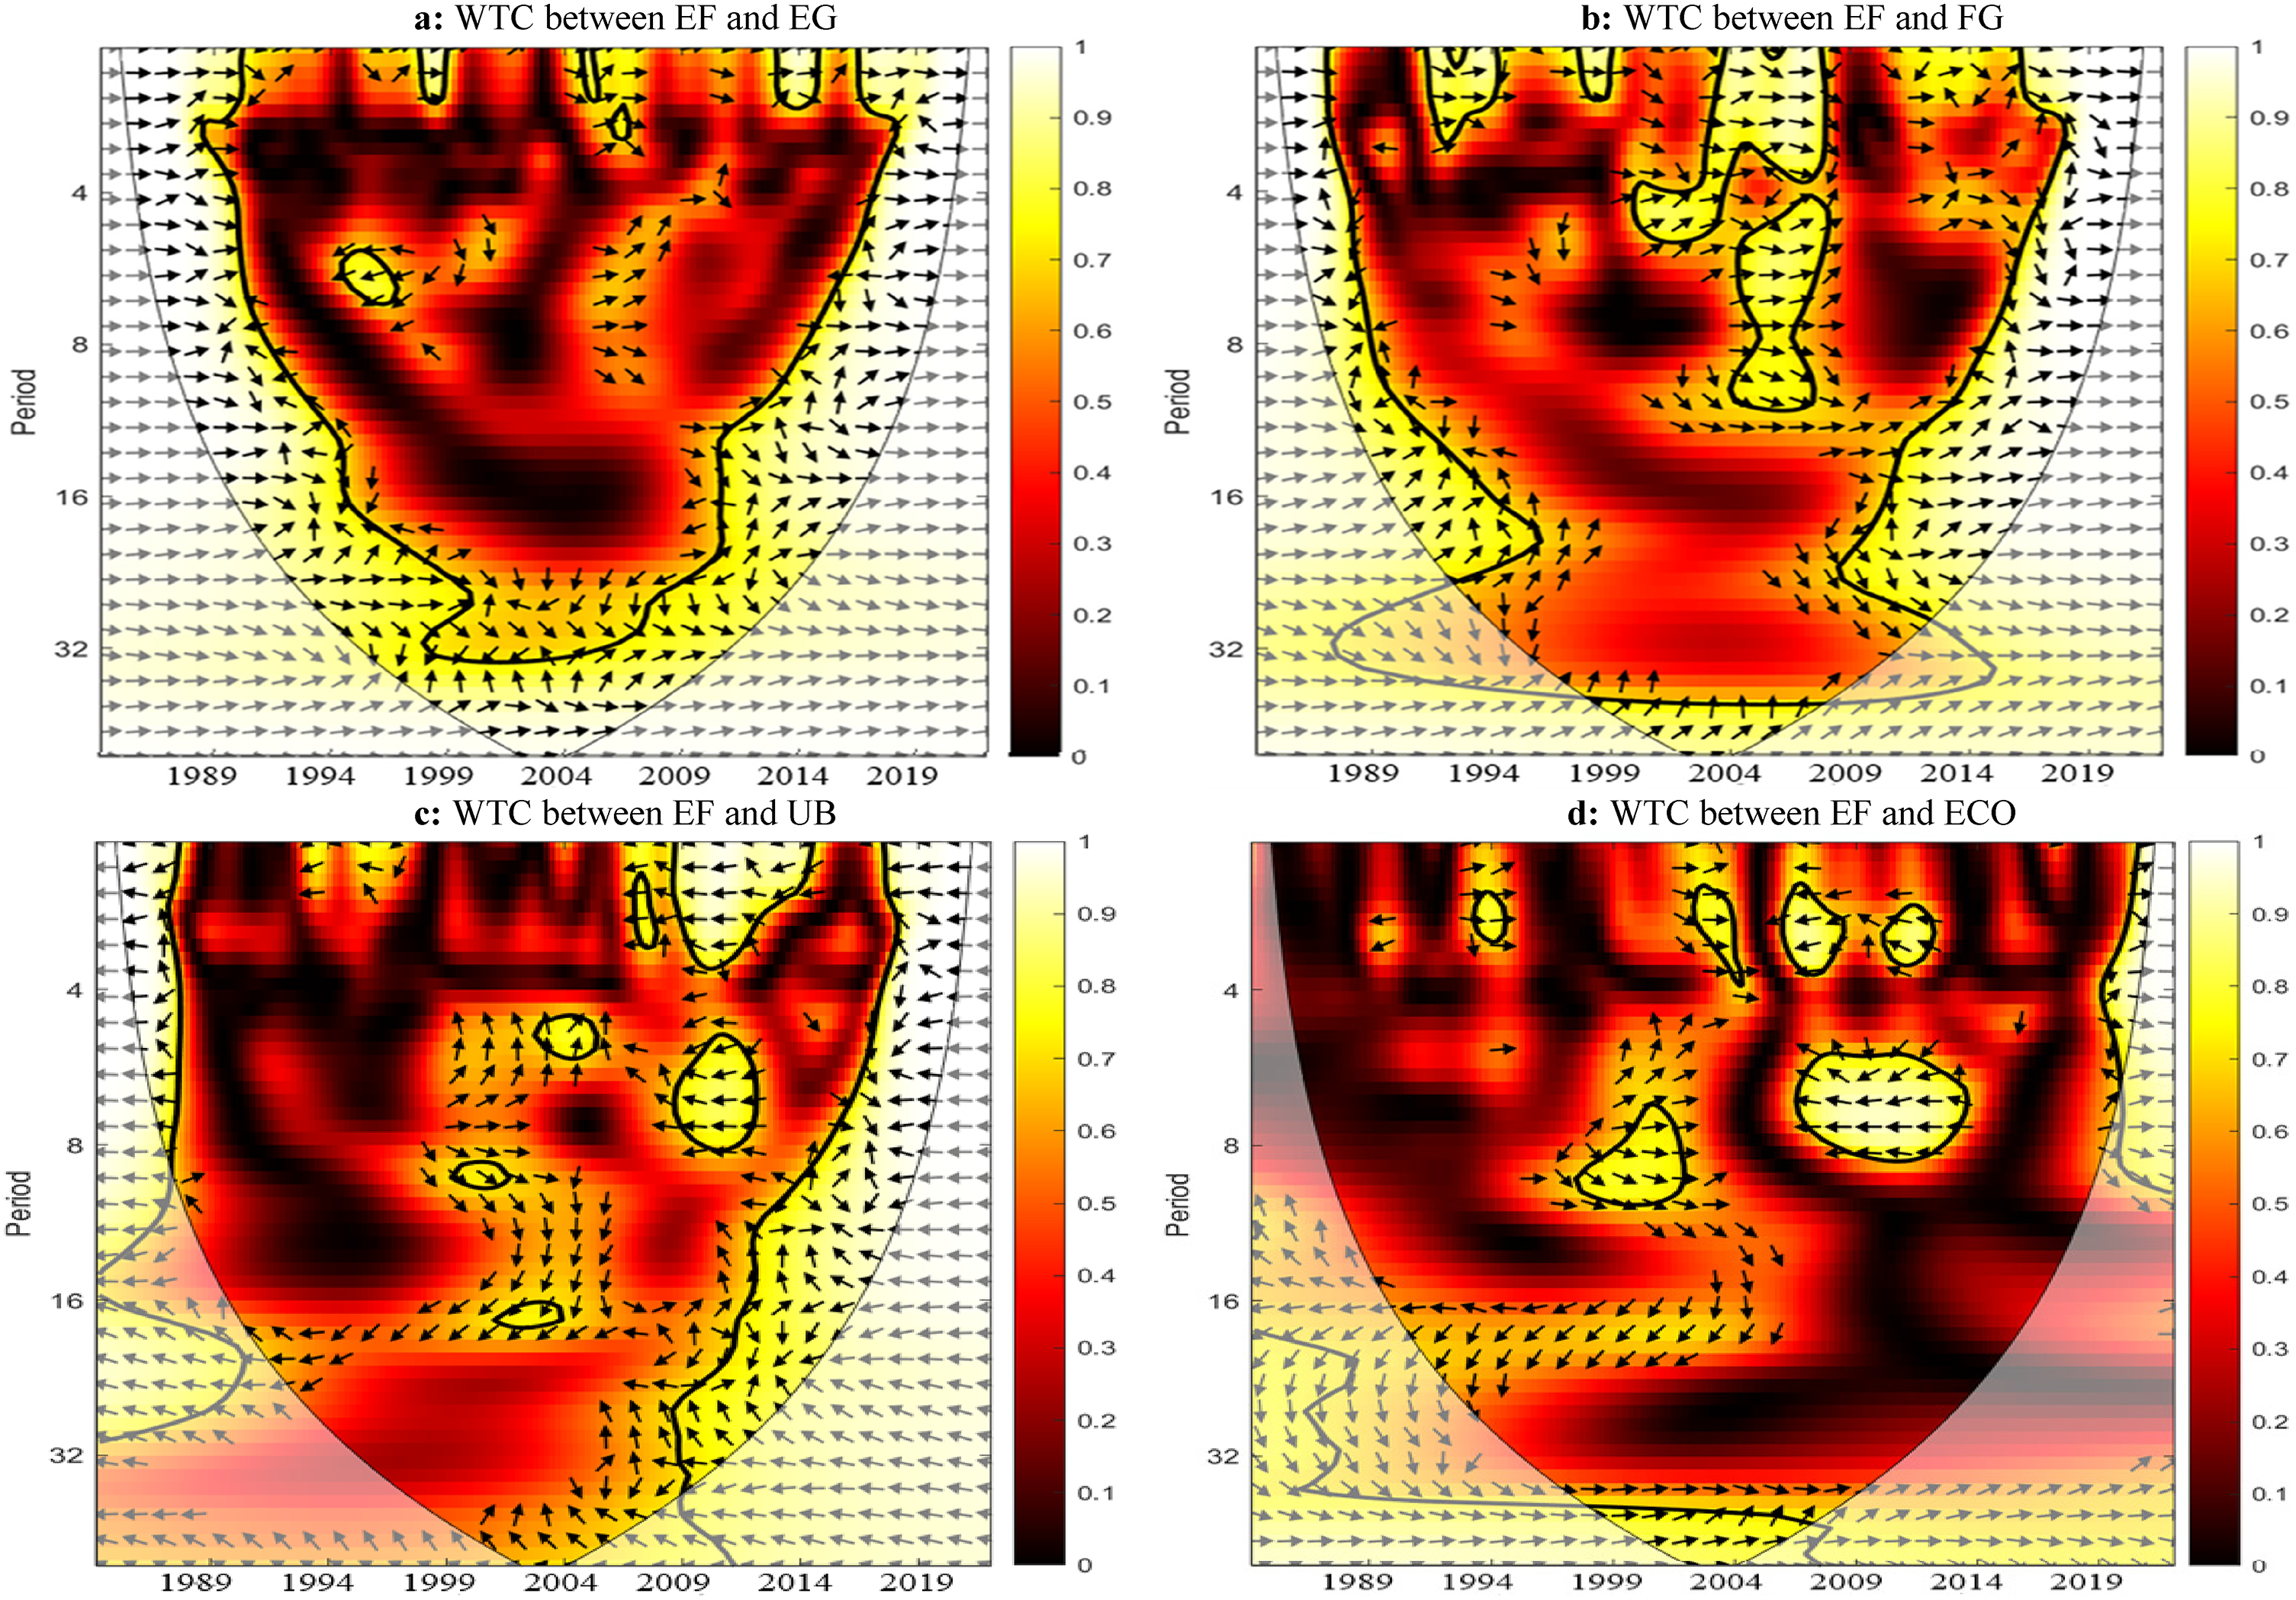
(a) WTC between EF and EG, (b) WTC between EF and FG, (c) WTC between EF and UB, and (d) WTC between EF and ECO. WTC of the pair Y & X. Note: (1) The bold black contour represents the 5% significance level derived from Monte Carlo simulations using phase randomized surrogate series. The “cone of influence” (COI), depicted as a shaded area, accounts for potential distortions caused by edge effects. (2) The power ranges are color-coded from red, indicating low power, to yellow, representing high power. (3) The phase difference between the two series are shown by the arrows. When the arrows point to the right, it signifies that the variables are in phase, indicating a positive interrelationship. When the arrows are pointing to the right and up, it indicates that the second variable is leading. Conversely, if the arrows point to the right and down, it implies that the first variable is leading. (4) The series are out of phase when the arrows point to the left, indicating a negative interrelationship between them. The series are in phase when the arrows point to the right, indicating a positive interrelationship between them. (5) The X-axis represents the time period under study, while the Y-axis designate the frequency. ECO: eco-innovation; EF: ecological footprint; EG: economic growth; FG: financial globalization; UB: urbanization; WTC: wavelet coherency.
Figure 2(b) depicts the WTC analysis between EF and FG in China. Over different periods and frequencies, specific patterns emerge from 1985 to 1994, where the arrows consistently point rightward, indicating a positive co-movement between EF and FG within the quarterly scale range of 1 to 32. Moreover, during the period spanning from 2000 to 2004, the arrows continue to face in the right direction at the quarterly scale of 1 to 8, suggesting an in-phase connection between EF and FG. Additionally, a similar pattern is observed from 2009 to 2021, at period of scale 1 to 32 with the arrows maintaining a right-oriented direction, highlighting an in-phase relationship between EF and FG. These observations signify a positive correlation between EF and FG throughout various time intervals. Furthermore, the predominant rightward and upward-facing arrows imply that FG leads EF, indicating a predictive interrelationship wherein FG tends to precede movements in EF within the examined time frames and periods.
Figure 2(c) presents the WTC analysis between EF and UB in China spanning the period from 1985 to 2022. Notably, within the quarterly scale range of 1 to 32, a consistent pattern emerges wherein the arrows exhibit a leftward orientation from 1985 to 1989. Similarly, from 2009 to 2022, the arrows maintain a leftward direction, indicating an out-of-phase interrelationship between EF and UB across these time intervals. This observation suggests a negative correlation between EF and UB. Furthermore, the consistent leftward and downward orientation of the arrows implies that UB leads EF. In essence, this WTC analysis indicates negative movement pattern between EF and UB, where changes in UB tend to precede or lead to subsequent changes in EF across time and frequencies.
Figure 2(d) exhibits the wavelet coherence (WTC) analysis between EF and ECO in China over the period spanning from 1985 to 2022. Notably, within the quarterly scale range of 7 to 10, a consistent pattern emerges between 1997 and 2002, where the arrows consistently point toward the right. This indicates an in-phase connection between EF and ECO during this specific time interval. Additionally, the right-down orientation of the arrows suggests that EF leads ECO within this period in China. However, when observing the scale range of 4 to 8 quarterly, particularly in the short and medium term, a different pattern emerges. The arrows consistently exhibit a leftward orientation, indicating an out-of-phase connection between EF and ECO within this time frame. This observation suggests a negative correlation between EF and ECO in the short and medium term. Moreover, the left-down orientation of the arrows during this period implies that ECO tends to lead EF, signifying that changes in ECO may precede or influence subsequent changes in EF in the short and medium term.
Robustness check (wavelet cohesion)
The research implemented 60 suggested WC as a robustness check for the WTC analysis. This method offers a localized perspective on the connections between variables across both frequency and time domains. It facilitates the identification of particular time periods and frequencies where the interrelationships between variables exhibit weakness or strength. Figure 3 illustrates the outcomes of the WC analysis concerning the co-movement between EF and FG, ECO, UB, and EG. In Figure 3(a), the WC analysis between EF and EG in China, spanning from 1985 to 2022, reveals pronounced positive co-movements across the 1–32 quarterly band of scale, representing the short to long term. Throughout this period, a strong positive association between the variables is evident. Additionally, intermittent periods of weak negative co-movements are observed, notably between 1990–1992 and 1992–2000, within the 1–8 quarterly band of scale, signifying short- and medium-term interrelationships. In essence, the analysis underscores the prevalence of a predominantly strong positive co-movement between EF and EG, confirming and reinforcing the findings derived from the WTC results.

(a) WC between EF and EG, (b) WC between EF and FG, (c) WC between EF and UB, (d) WC between EF and ECO. WC of the pair Y & X. (1) The color code indicates the strength of correlations, ranging from yellow (positive correlation) to red (negative correlation) and (2) the horizontal axis represents the analyzed time period, while the vertical axis indicates the frequency. ECO: eco-innovation; EF: ecological footprint; EG: economic growth; FG: financial globalization; UB: urbanization; WC: wavelet cohesion.
Figure 3(b) illustrates the WC analysis between EF and FG in China, focusing specifically on the period from 1985 to 2022. Consistent with the outcomes from the WTC, the analysis reaffirms the presence of a significant and robust positive co-movement between EF and FG. This strong positive association persists across the 1–32 quarterly band of scale, representing the short to long term. The findings suggest that FG plays a substantial role in positively influencing EF within the context of China. This indicates that an increase in EF can be attributed to the upsurge in FG across all frequencies, highlighting FG's effective stimulation of EF in the region. Ultimately, this analysis emphasizes the prevailing and robust nature of the positive co-movement between EF and FG, providing further validation and reinforcement of the conclusions drawn from the wavelet coherence outcomes. Figure 3(c) showcases the co-movement between EF and UB in China, specifically from 1985 to 2022. In line with the findings derived from the WTC, this analysis reconfirms the presence of a substantial and persistent negative co-movement between EF and UB. This strong negative association remains consistent across the 1–32 quarterly band of scale, encompassing the short to long term. The results imply that UB significantly contributes to exerting a negative influence on EF within the Chinese context. This suggests that a decline in EF can be attributed to an increase in UB across all frequencies, highlighting the effective role of UB in diminishing EF in China.
Finally, Figure 3(d) presents the WC analysis depicting the relationship between EF and ECO. During the period from 1990 to 1992, notably within the 1–8 quarterly band of scale (indicating high frequency or short term), intensive negative co-movements between EF and ECO are observed. However, spanning from 1993 to 2002, within the 1–16 quarterly band scale representing the short and medium term, EF and ECO display a positive connection. This indicates that an increase in ECO corresponds to an increase in EF during this period. Moreover, significant and robust negative co-movements are identified from 2005 to 2014 within the 1–16 quarterly band scale (short and medium term), aligning with the outcomes derived from the wavelet coherence analysis.
Partial wavelet coherence
Next, we employed the PWC which is statistical within the realm of wavelet analysis, to measure and examine the associations between two time variables while accounting for the impact of the third variable. Figure 4 shows the results of the PWC. Figure 4(a) and (b) display the PWC analysis between EF and ECO after excluding the influences of EG and FG, respectively. Notably, upon removing the impact of EG, there is apparent short-term co-movement observed between EF and ECO from 1994 to 2020. Similarly, Figure 4(b) indicates coherence between EF and ECO, particularly in the short and medium terms from 1999 to 2014, after eliminating the effect of FG. In contrast, Figure 4(c) illustrates weak coherence between EF and ECO when disregarding the influence of UB from 1999 to 2014, primarily in the short and medium terms. Furthermore, Figure 4(d) reveals the PWC between EF and EG with FD influence omitted, indicating significant coherence across all periods between EF and EG while excluding the effect of FG from 1986 to 2021. Additionally, there is significant coherence between EF and EF across all periods from 1986 to 1999 when considering the impact of UB (see Figure 4(e)).

(a) PWC EF versus ECO and EG, (b) PWC EF versus ECO and FG, (c) PWC EF versus ECO and UB, (d) PWC EF versus EG and FG, (e) PWC EF versus EG and UB, (f) PWC EF versus EG and FG, (g) PWC EF versus FG and ECO, (h) PWC EF versus FG and EG, (i) PWC EF versus FG and UB, (j) PWC EF versus UB and ECO, (k) PWC EF versus UB and EG, and (l) PWC EF versus UB and FG. The PWC of the Y versus X1 after removal of X2. Note: (1) The color code indicates the strength of correlations, ranging from red (low correlation) to red (strong correlation) and (2) the horizontal axis represents the analyzed time period, while the vertical axis indicates the frequency. ECO: eco-innovation; EF: ecological footprint; EG: economic growth; FG: financial globalization; PWC: partial wavelet coherence; UB: urbanization.
Likewise, Figure 4(f) demonstrates the influence of EG on EF with FG's effect dismissed, showing strong coherence between EF and EG from 1986 to 1994 without considering FG's influence. Moreover, Figure 4(g) highlights EF’s effect on FG without considering ECO’s influence in China, indicating strong coherence between EF and FG from 1986 to 1995 and from 2009 to 2021, when neglecting the effect of ECO. Additionally, Figure 4(h) presents the PWC between EF and FG while excluding EG's effect, revealing strong co-movement in the short term from 1986 to 1994, 1999 to 2004, and 2018 to 2021, without considering EG's role. Similarly, neglecting UB's role shows strong coherence between EF and FG from 1986 to 2021, particularly in the short and medium terms. Regarding Figure 4(j), weak coherence is observed between EF and UB when ECO's influence is not considered from 1986 to 1994, 2003, and 2009, mainly in the short and medium terms. Conversely, from 2009 to 2021, strong co-movement between EF and UB is evident from 1986 to 1989 and from 2009 to 2021, with the impact of EG nullified (see Figure 4(k)).
Multiple wavelet coherence
MWC expands the conventional wavelet coherence analysis, allowing simultaneous exploration of interrelationships among multiple variables. By involving more than two variables, MWC enables a thorough examination of the complex connections within the studied variables. In Figure 5(a), substantial coherence between EF and EG persists from 1985 to 2021 across all periods, considering the significance of ECO's role. Additionally, when accounting for FG’s influence (Figure 5(b)), significant coherence is observed between EF and EF from 1986 to 2021 across all periods. Moreover, the impact of EG on EF remains significant across all periods from 1986 to 2021, considering UB’s influence (Figure 5(c)). When ECO's role is factored in Figure 5(d), strong coherence exists between EF and FG across all studied periods. Furthermore, considering UB's role (Figure 5(e)), the effect of FG on PWC remains robust across the studied timeframes and periods. Finally, Figure 5(f) demonstrates significant coherence between UB and EF, accounting for ECO's effect.
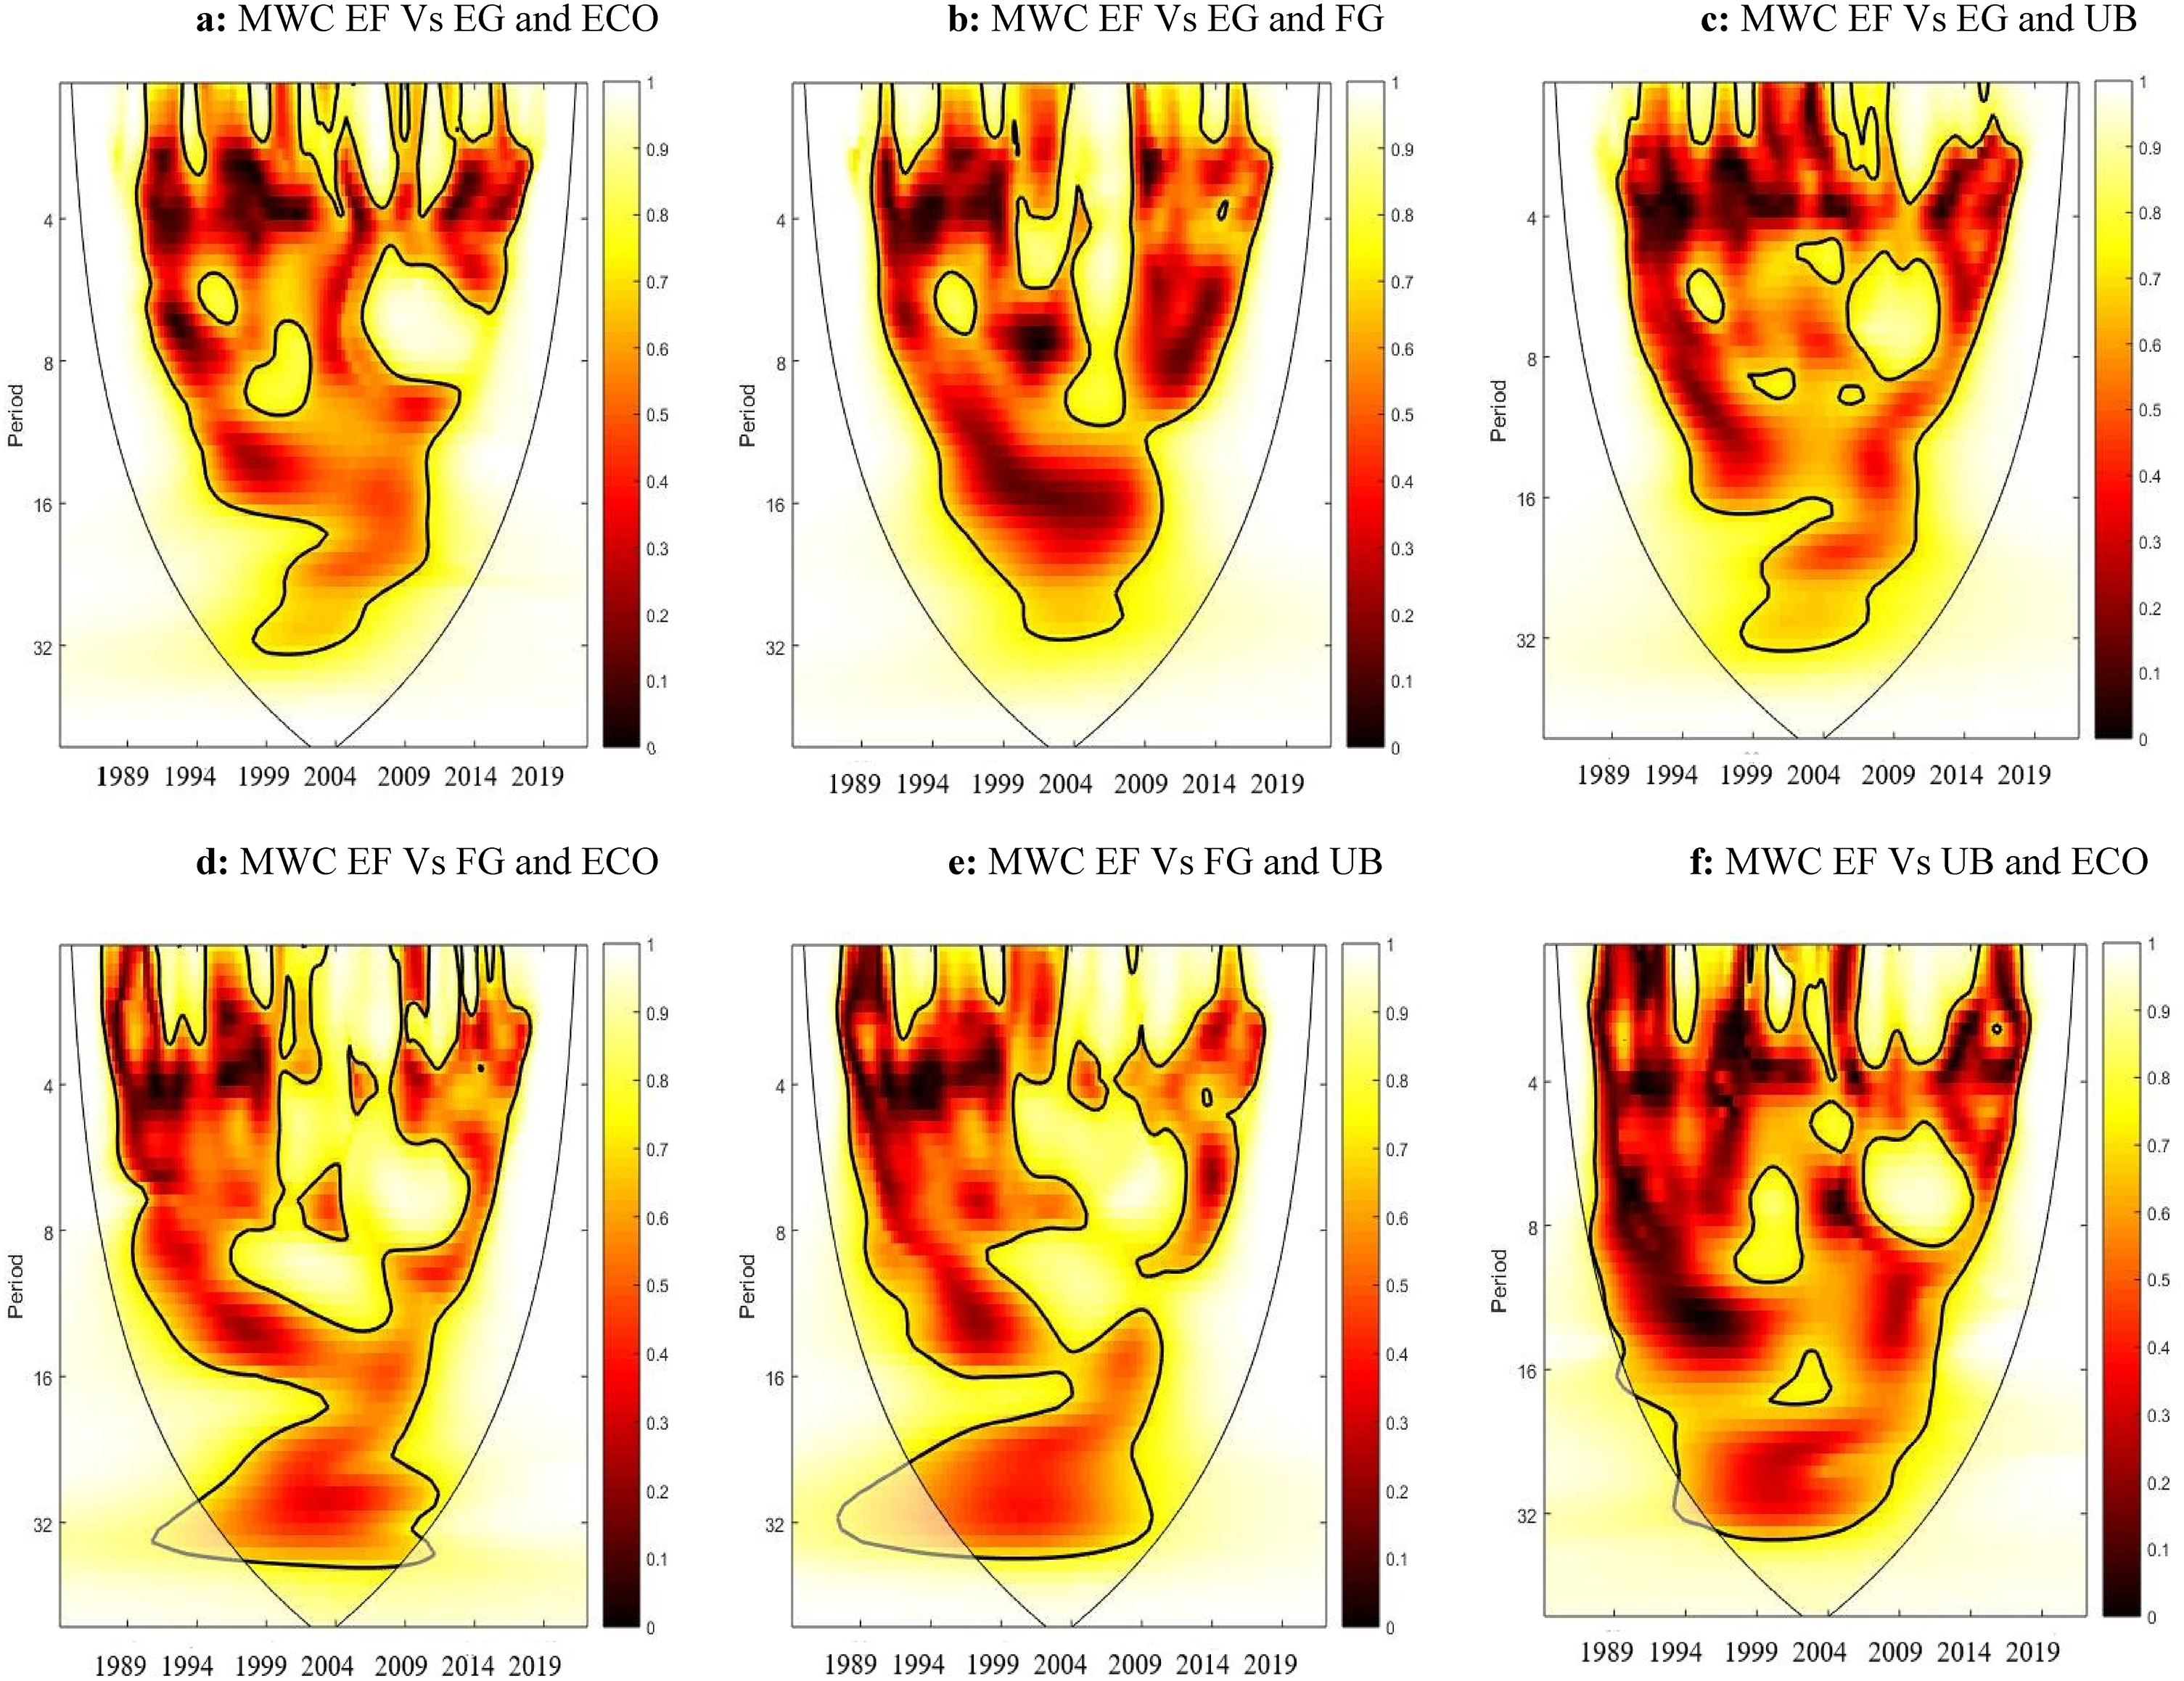
(a) MWC EF versus EG and ECO, (b) MWC EF versus EG and FG, (c) MWC EF versus EG and UB, (d) MWC EF versus FG and ECO, (e) MWC EF versus FG and UB, and (f) MWC EF versus UB and ECO. MWC of the Y versus X1 and X2. Note: (1) The color code indicates the strength of correlations, ranging from red (low correlation) to red (strong correlation) and (2) the horizontal axis represents the analyzed time period, while the vertical axis indicates the frequency. ECO: eco-innovation; EF: ecological footprint; EG: economic growth; FG: financial globalization; MWC: multiple wavelet coherence; UB: urbanization.
Discussion of findings
The findings of the analysis highlight a consistent and positive correlation between EF and EG across various time periods and frequencies. This suggests that EG has played an effective role in contributing to the advancement of EF in China. These results align closely with the discoveries made by Eweade et al., 61 Al-Mulali et al., 62 and Haseeb et al., 17 all of whom affirmed the positive link between EF and growth. This pattern confirms expectations and indicates that the current EG in China relies on unsustainable energy sources. This reaffirms the prevailing pro-growth agenda seen in many Asian nations, where economic expansion takes precedence over ecological sustainability. The implications are significant, signaling a need for China to reconsider its growth strategies. It’s imperative for the nation to realign its growth objectives by integrating SDGs into its agenda. Policymakers and the government need to actively encourage and incentivize the adoption of clean energy sources as a means to attain sustainable growth. This shift toward cleaner energy alternatives is crucial in balancing economic development with ecological preservation, ensuring a more sustainable and resilient future for China and the worldwide environment.
We also discovered that from short to long-term, EF and FG are positively connected. This discovery is in compliance with the perspective of Jahanger et al. 63 and Miao et al. 64 who reported the damaging role of FG on the ecosystem; however, our discovering contradicts the perspective put forward by Ahmad et al. 11 and Akpan et al. 65 who confirm the effective role of FG in improving ecological integrity; thus, limiting EF. As anticipated, FG typically results in intensified economic activities, expanded trade, and increased investment. This surge in economic engagements tends to elevate consumption levels, thereby escalating the demand for various services and goods. Consequently, this increasing demand often translates into, intensified production, amplified resource extraction, and additional waste generation which in turn promote EF. Furthermore, FG may exert market pressures that prioritize immediate profit gains over long-term sustainability goals. This dynamic can result to decision-making processes that prioritize short-term economic benefits while potentially sidelining ecological reflections.
Moreover, we found support for the negative co-movement between EF and UB across the periods; suggesting that in the short to long term, UB contribute to the decrease in EF in China. Our study findings coincide with the studies by Ngoc et al. 66 and Wang et al., 67 both of whom supported the idea that urbanization, particularly when coupled with effective consumption and production practices, has the potential to contribute to a decrease in CO2. Urban areas frequently demonstrate improved resource efficiency as a result of economies of scale. This efficiency stems from centralized infrastructure, improved transportation systems, and the utilization of shared resources. These factors have the possibility to curtail per capita energy usage and curb waste generation. Moreover, individuals in urban settings typically enjoy superior access to essential services such as healthcare, education, and public transportation. 68 This accessibility diminishes individual resource demands and boost the mitigation in EF. Furthermore, urban populations residing in the region that is densely populated necessitate less land per person compared to rural counterparts. 69 Besides, the compact living arrangements predominant in urban settings aid in conserving natural habitats by curtailing encroachment into pristine natural areas and curbing urban sprawl.
Lastly, in the short and medium term, ECO lessen EF; thus, boosting ecological excellence in China. This result complies with the studies of Abbasi et al. 70 and Acheampong et al. 71 who reported negative effect of ECO on EF; thus, improving ecological excellence. Implementing ECO within industries can result in the establishment of cleaner production methods, decreased emissions, and the embrace of ecofriendly measures. These measures curb EF and overall impact of production and manufacturing sectors. This result as expected given the fact that China investment in ecofriendly investment has increased drastically. China spent $546 billion in 2022 on investments that included solar and wind energy, electric vehicles, and batteries. That is nearly four times the amount of U.S. investments, which totaled $141 billion. 72 The European Union was second to China with $180 billion in clean energy investments. China also dominated in low-carbon manufacturing, accounting for more than 90% of the $79 billion invested in that sector last year. 72
Conclusion and policy directions
Conclusion
Recently, the global economy has grappled with diverse ecological issues, urging the internalization of environmental damage and the promotion of ecological sustainability. Addressing these concerns, reducing dependence on fossil-based energy sources emerges as a crucial measure to tackle these challenges effectively. Using the wavelet tool, the study delves into the causal relationships and directionality between the EF and its drivers—financial globalization, urbanization, economic growth, and eco-innovation—specifically examining the case of France spanning the period from 1985 to 2022. This investigation provides a comprehensive view of their interactions across various frequencies and subperiods, unveiling the lead-lag relationships among variables and their anticyclical and cyclical effects. The findings reveal that, across all frequencies examined, financial globalization and economic growth exhibit a negative influence on the EF. Simultaneously, urbanization and eco-innovation also demonstrate negative impacts on the EF across all frequencies studied.
Policy inferences
In terms of policy inferences, policymakers should reflect three primary factors: the economic characteristics within the targeted time frame, the sustainability of its impact and the intervention's time horizon. Irrespective of the economic context across all frequency spectrums, policy interventions are crucial due to the observed sensitivity of EG to EF and vice versa. This highlights that policies solely focusing on EG might not effectively reduce EF in China over the short to long term. Hence, achieving a harmonious equilibrium between economic growth and ecological preservation necessitates a comprehensive approach. This approach should seamlessly integrate environmental considerations into economic policies and decision-making processes across all tiers of governance. To facilitate this integration, the Chinese government and policymakers should consider offering financial incentives. These could include subsidies, tax breaks, or grants to businesses embracing sustainable practices, investing in green technologies, or complying with stringent ecological standards.
Moreover, policy interventions are crucial across all frequency spectrums since FG displays sensitivity to EF, regardless of the economic context. This underscores the inadequacy of FG policies alone in mitigating ecological decline over both short- and long-term periods. As a result, policymakers and the Chinese government should prioritize the implementation of regulations concerning foreign investments and stringent environmental standards. This entails mandating compliance with eco-friendly initiatives, emission mitigation goals, and clean production techniques as prerequisites for investment endorsement. Additionally, it is imperative to establish guidelines and frameworks to assist investors in prioritizing and evaluating investments based on their ecological impact.
In the short, medium, and long terms, policy interventions are crucial as urbanization proves sensitive in mitigating EF, regardless of the economic context. This underscores the appropriateness of urbanization policies in reducing EF across short-, medium-, and long-term periods. Therefore, we recommend that policymakers and the Chinese government prioritize measures to promote the upkeep and creation of green spaces, urban forests and parks within cities. This entails implementing policies aimed at augmenting tree cover, establishing urban gardens, and fostering green roofs to combat heat island effects, bolster biodiversity, and enhance air quality. Additionally, it is imperative to enforce regulations that incentivize industries situated in urban areas to embrace clean technologies, uphold stringent ecological standards, and curtail emissions. Furthermore, providing incentives to encourage the adoption of eco-friendly production methods and the mitigation of contamination becomes paramount in achieving sustainable urban development.
Footnotes
Declaration of conflicting interests
The author(s) declared no potential conflicts of interest with respect to the research, authorship, and/or publication of this article.
Funding
The author(s) disclosed receipt of the following financial support for the research, authorship, and/or publication of this article: The Soft Science Research Projects Funded by Science and Technology Department of Shaanxi Provincial Government: The Linkage and Development Study between Xi’an National Independent Innovation Demonstration Zone and Shaanxi Free-trade Zone (2019KRM031). The project of ‘The Belt and Road’ International Inland Port Logistics Joint Study Center of Shaanxi Province: (GH202304). International Technology Cooperation Project in 2023: the Joint Study of Operation and Management Innovation of China Railway Express under the Framework of ‘The Belt and Road’ 2023-GHYB-10.Scientific Research Program Funded by Education Department of Shaanxi Provincial Government: the Study of the Deep Integration between Digital Economy and Real Economy in Shaanxi Province (Program No.23JK0199).
