



Abstract
Developing countries are facing many electricity crises such as low production, worst power outages, blackouts, and poor inadequate supplies. Most of their rural areas have no basic power infrastructure as it requires long transmission lines, which causes high installation, operation, maintenance costs and line losses issues. The people of these unconnected rural areas belong to low-income families and use kerosene oil, candles, small solar panels, and batteries to meet their basic electricity needs. As an alternative, renewable-based hybrid energy systems have enormous potential. It is also environmentally friendly and low-cost, sustainable, and promising solution to electrify rural off-grid areas. This research work focuses on the economic and optimal design of a renewable-based hybrid energy system for the rural off-grid area of Pakistan. HOMER (Hybrid Optimization of Multiple Energy Resources) software is used to perform techno-economic and environmental analysis. The optimization results show that the most economical and optimal configuration is PV/diesel generator with batteries having lower harmful emissions. Furthermore, the sensitivity analysis is performed to refine the results which show that the most optimal system will remain sustainable if variations occur in the sensitivity variables in the future. Moreover, the results and findings of this study can help the government to make effective policies and planning to provide reliable and affordable electricity to the off-grid areas, to improve the electrification rate in the country.
Introduction
The global population living without access to electrical energy was 10% in 2018, i.e., 789 million people were deprived of basic electricity needs. Significant differences in access to electricity are also evident between urban and rural areas. In 2018, the global urban and rural electrification was 97% and 80% respectively. In many countries, rural electrification access is improved by the expanded off-grid solutions. The renewable based off-grid systems were used globally in 2018 to supply below Tier 1 electricity to 136 million people as compared to 1 million people in 2010. These were provided through mini-grids such as standalone home systems and solar lighting systems. 1 World electrical energy demand is increasing rapidly which is causing rapid depletion of fossil fuel reservoirs. Fossil fuels are the conventional sources for the generation of electrical energy which has a high electric energy production cost and creates serious environmental issues such as climate change, global warming, and greenhouse gases. 2 The percentage of world electrical energy production by fossil fuel is 73% while by renewable energy sources is 27%. 3 The world annual electric energy demand growth rate is 2.7%. 4 The developed countries are now focusing and investing in renewable energy technology to protect the environment and to maintain sustainable development. 5
Developing countries face many electricity crises due to various reasons such as lack of proper planning and policies, political controversy, low institutional capacity and growing economies and industries. 6 In Pakistan, electrification rate of urban areas is 90% while in rural areas is 63% and 26% population live without access to electricity. 7 As compared to the urban areas, rural electrification is lower and require long transmission lines which cause high installation, operation and maintenance cost and line losses issues.6, 8 Many people of rural off-grid areas, belong to low-income families who are not able to afford the high cost of electricity and they use kerosene oil, candles, small solar plates and batteries for lighting etc. 9 Pakistan also has some of the worst power outages, blackouts and poor inadequate supplies. There are 16 h of blackouts on daily basis during summer and 12 h during winter. 10 The total installed generation capacity in Pakistan is 38,719 MW in the year 2020 and the total electricity generation is 134,745.70 GWh during 2019-20. 11 The generation growth rate is 6% while the demand growth rate is 10% which is a large gap to fill. 6 As an alternative, Pakistan has huge potential for renewable energy resources such as solar, wind, hydro and biomass. 12 The overall hydroelectric potential is 60,000 MW while only 7228 MW of power is produced. 13 The average solar irradiance is 5.5-6 kWh/m2/day and 1800–2200 kWh/m2/year. The estimated solar power capacity of Pakistan is almost 50,000 MW. The wind power potential is more than 3,000,000 MW.3 The total estimated potential of biomass is 50,000 GWh/year which can contribute up to 36% of the total generation. 14 Hybrid renewable energy resources are the promising solution that decreases harmful emissions and produces low cost clean and sustainable energy. 15
Different studies are reported on the micro-grids and renewable energy systems for rural electrification and various software has been used by researchers for modelling micro-grids such as HOMER Pro (Hybrid Optimization of Multiple Energy Resources), OPAL-RT (Real Time Simulation Laboratory), MAT-Lab/Simulink and RETScreen (Renewable Energy Technology). Some of the studies are briefly reviewed in this paper. M. Rezkallah et al. 16 discussed different configurations, control strategies and applications of micro-grid by using PV, wind, micro-hydro, diesel generator as a sources and batteries as storage. The different configurations are considered based on the number of sources used along with the control strategies and variable speed generators. The selection criteria of these configurations with the required control strategy for the various conditions are presented. The mathematical results are verified by simulations using MATLab/Simulink along with hardware prototype.
F. Valencia et al. 17 looked at the long-term viability of micro-grids by evaluating at their resilience. An integrated framework was created in this regard, merging socio-technical transformations with socio-ecological resilience ideas. This allows to focus on two aspects of micro-grid sustainability at the same time: 1). The micro-grid ability to efficaciously transmute the correlation between community, energy, and territory in order to make it more viable in financial, social, and ecologic terms. 2). The micro-grid ability to withstand, adapt, and retrieve from changes in contextual factors that may limit its operability over time.
J. Isgiyarta et al. 18 perform a technical, financial, investment risk, social, and environmental impact assessment of power plants in Indonesia. The plant is run by biomass i.e., oil palm trees trash to reduce the dependency on fossil fuel and to produces environmentally friendly energy. 10 kW power plant was up-scaled to 100 kW for testing. The findings revealed that it is both technically and financially feasible to implement. The cost analysis shows that the Net present cost (NPC) of the system will be $48,846, the Internal rate of return (IRR) will be 9.72 percent and benefit to cost ratio will be 1.16. The risk assessment anticipated that the NPC would be 49.94 percent higher than the base case. According to the social aspects, the development of power plants has a significantly positive influence on the community, in the form of higher community income and the growth of new economic sectors.
S. Sharma et al. 19 modelled the grid connected hybrid system consist of PV, wind, hydro and battery. HOMER software is used for the techno-economic and sensitivity analysis for remote territory of India. Twelve feasible configurations are analyzed based on the Cost of Energy (COE) and NPC. It is suggested that the grid connected hybrid system is the most feasible and optimal system due to the sale of extra energy to the grid. The COE of grid connected system is 0.056 $/kWh, which was observed to be 2.88 times lower than the stand-alone systems. The sensitivity analysis shows that the as the wind speed, solar radiation and water flow increases, the COE and NPC are decreases while the most sensitive variable is wind speed. Furthermore, the COE and NPC is varied with the variations occurred in the load, if the load is increased both costs will be increased.
L. Olatomiwa et al. 20 identified the crises of modern electricity supply to the rural areas of Nigeria, which is a key impediment to a small hospital's proper functioning and provision of services, resulting in higher mother and child death rates. The renewable based hybrid micro-grid is designed using HOMER software for the six different rural areas. The results show that for some areas the PV/wind/diesel/battery system is suitable while for some the PV/diesel/battery is suitable depending upon the potential of the available sources in the concerned areas. This study suggested that there is a huge aptitude for renewable energy sources in the country thus it can be used to design optimal and economical hybrid energy systems for rural areas to improve healthcare facilities and delivery.
F. Ali et al. 21 accomplish the technical and economical scrutiny of the hybrid energy system using HOMER software for the Mandhra Saidan village of district Dera Ismail Khan, Pakistan. Both islanded and grid-tied systems are considered and a total of four feasible and optimal configurations are described. The four configurations are PV/batteries (C1), PV/diesel generator/batteries (C2), PV/diesel generator/batteries with grid (C3) and PV/batteries with grid (C4). The results indicate that in terms of off-grid system the C2 is more economical than C1 because of diesel generator, as more PV panels and batteries are required in C1 system which increases the NPC and COE of the system. In terms of grid connected system, C3 is more economical than C4 system. Overall comparison shows that the system C3 and C4 (grid connected systems) are most suitable configurations for the site because of low NPC, operation and maintenance (O&M) cost and COE while off-grid systems require large number of solar panels and larger diesel generator which increases the capital cost resulting the higher NPC, O&M cost and COE but still it is feasible and optimal solution if the grid access is technically unfeasible or expensive due to infrastructural barriers. The results show that the most economical and optimal system is C3.
J. Ahmad et al. 22 perform optimization and sensitivity scrutiny of grid connected PV/wind/biomass hybrid renewable energy system using HOMER software for Kallar Kahar town of district Chakwal, Pakistan. The results show that the PV/biomass/wind with grid and PV/biomass with grid are the two suitable configurations. Moreover, the most economical and optimal system is PV/biomass/wind with grid system that can generate more than 50 MW with an annual grid sell energy of 31,547,291 kWh. The optimal hybrid system required 1500 kW solar system, 500 kW wind turbine system, 20,000 kW biogas generator and 1500 kW converter. The COE is 0.05744 $/kWh which is based on peak load and is considered for both commercial and residential sectors while the cost for the peak load of 73.6 MW is $180.2million.
M. K. Shahzad et al. 23 assess the technical and financial viability using HOMER of a PV/biomass islanded renewable energy system for a small village with residential and irrigation load in the Punjab area of Pakistan. The analysis shows that an 8.0 kW biogas fuelled generator, 32 storage batteries, 12 kW converter and 10 kW PV system, is the optimal combination with an initial capital cost of PKR 2.64M and the TNPC of PKR 4.48M. The COE is 5.51 PKR/kWh which saves about 4.84 PKR/kWh because the COE from the grid is 10.35 PKR/kWh for agricultural purposes. The total generation in this system is 65,593 kWh/year with an excess generation of 3221 kWh/year and the estimated payback period is 9.5 years.
In addition, the techno-economic and environmental analysis of the hybrid micro-grid has been discussed for a remote community in south India, which satisfied the sustainable development goal (SDG7). The aim of SDG 7 is to ensure affordable, reliable, sustainable and modern energy access all over the world. The results shows that the PV/diesel/battery based system is the most cost effective, reliable and sustainable system. 24
These existing literature studies provide relevant information and background for the current research work especially on the design, sizing, economic and technical analysis of the proposed electric power system. This paper presents the socio-economic, technical and environmental analysis of islanded hybrid Micro-grid for rural off-grid area of Pakistan. HOMER software is used for simulation, optimization and sensitivity analysis to model economical, reliable and environmentally friendly electric power system.
Study background
Location information of the study area
For the case study, the rural off-grid village of Pakistan is selected. It is situated in province Khyber-Pakhtunkhwa, district South Waziristan, Tehsil Sararogha, village Umar-raghzai. The coordinates are 32° 26.2’ North and 69° 57.8’ East The approximate population of the village is 2387 and the area is 8.79km2. The rural village and the entire district are not connected to the national grid and the people belong to poor families which use kerosene oil, candles, small solar plates, batteries and wood to meet their basic electricity needs. Also, there is a problem of access to clean water for drinking and irrigation purposes. Implementation of hybrid micro-grid technology for this region will be more economical and reliable as compared to the national grid that require long transmission lines having technical unfeasibility and expensive infrastructure issues. Reliable and affordable electricity access for these regions is necessary to improve the social and economic lives of the people. It will enhance education, health and other developmental growth along with job opportunities.
Load profile of the study area
The electric load data of the village is collected by conducting estimations and questionnaire. The collected estimated load data include the appliances that are currently used and the appliances such as electric room heater, electric water heaters, electric stoves and washing machine, etc. that will be used by the peoples in near future when the village is electrified properly. Currently, most of the electric load used in the village such as refrigerators, fans and bulbs etc. is DC and is operated using small solar plates. There are an estimated 146 houses, 28 shops, 4 mosques, 3 dispensaries, 1 school and 4 tube wells in the village. The seasonal impacts and the random variability are also considered in the load profile. The time step and day-day variability are considered 3%. The weekday's load and the weekend load are considered separately to obtain more accurate load patterns.
The D map (also called data map) in Figure 1 shows the daily and seasonal load variations. The D map shows that the load is higher between morning and evening while minimum in the mid night. The complete load profile for one year is shown in Figure 2. The monthly average load data is shown in Figure 3 e.g., in January the maximum load is 415.65 kW, the minimum load is 23.57 kW, the average load is 286 kW, and the daily average maximum and minimum load is 388.05 kW and 61.75 kW. The graphical representation of daily load data is shown in Figure 4. The average daily energy consumption by the consumer is 5898.8 kWh/day. The annual total average load and the total peak load are 245.78 kW and 433.83 kW.
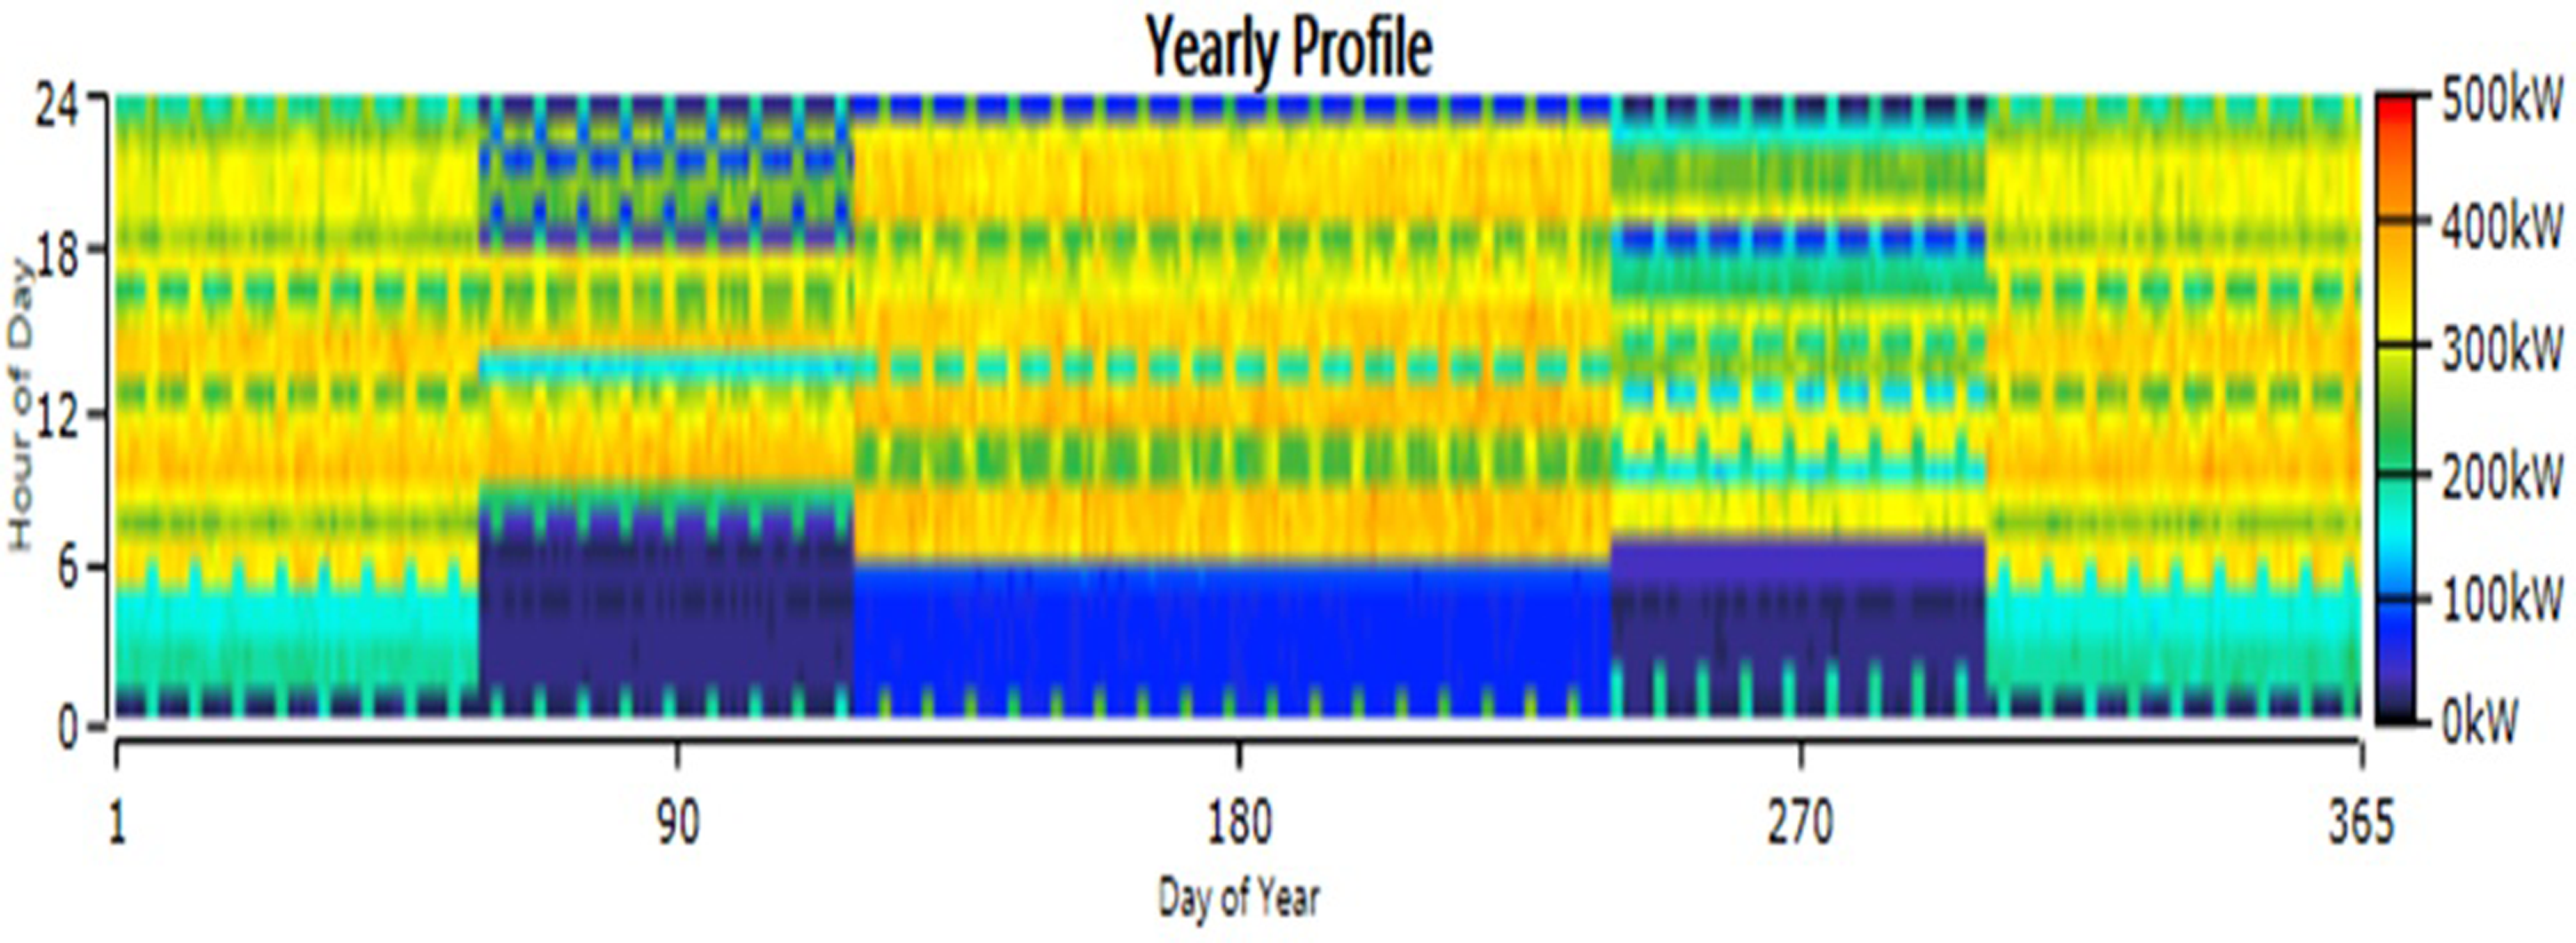
Seasonal electric load variations.
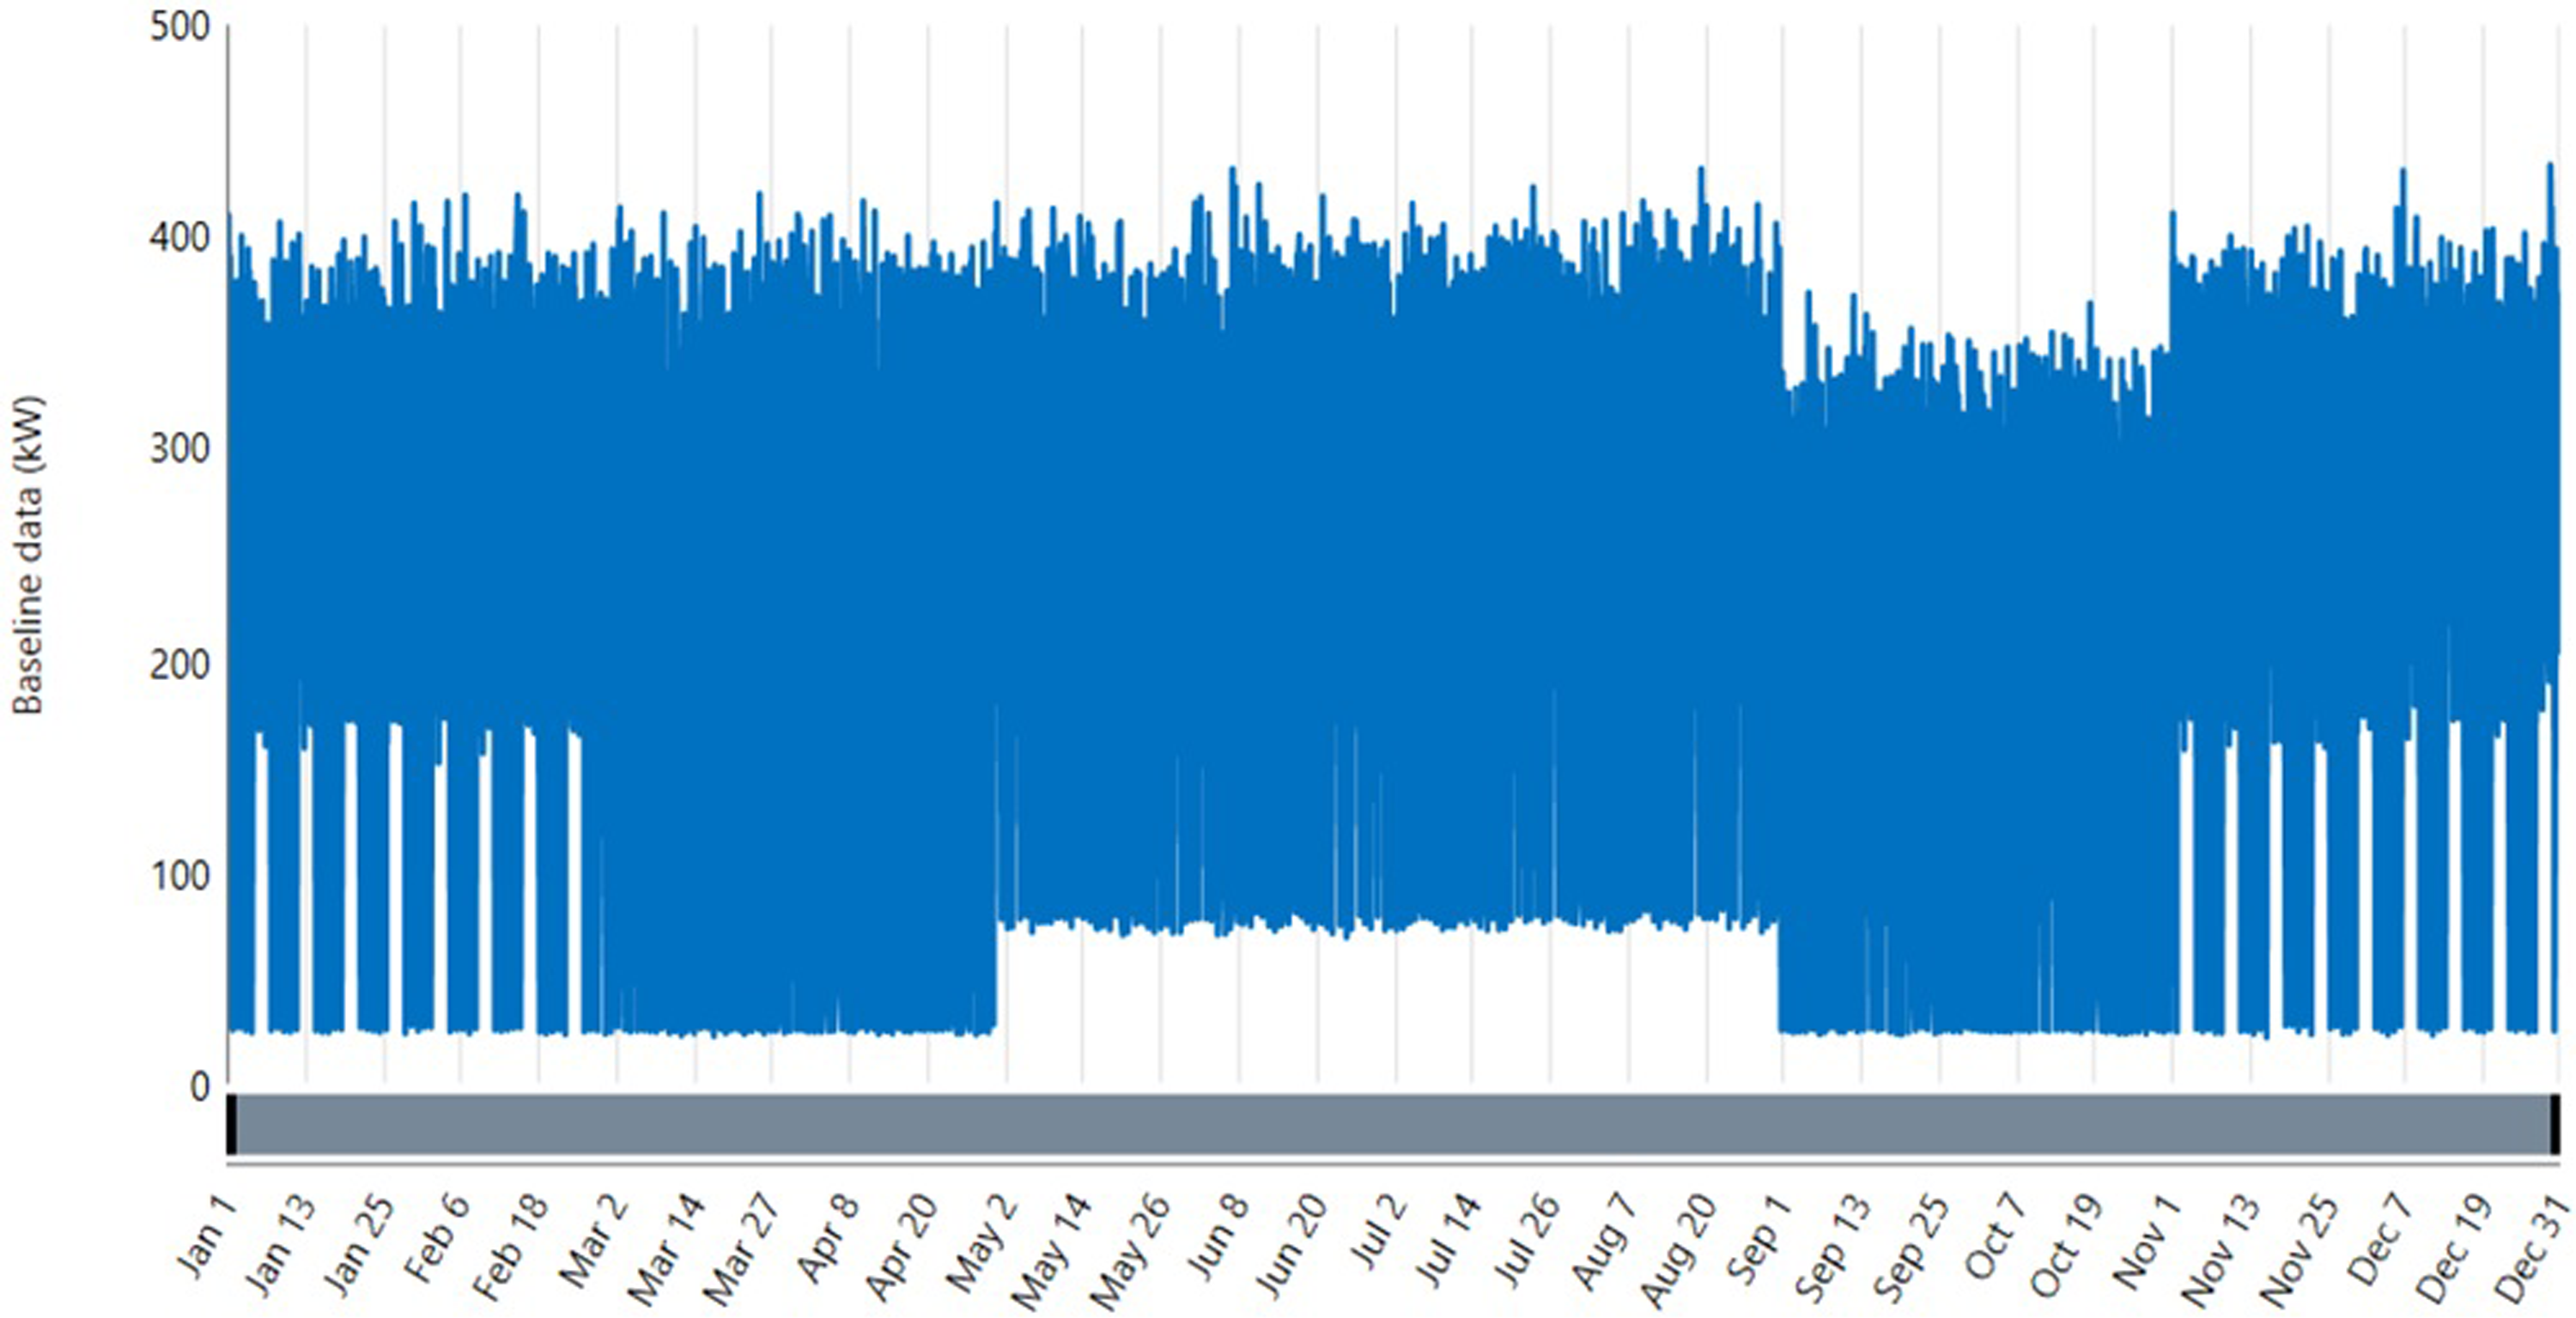
Electric load graph for a complete year.
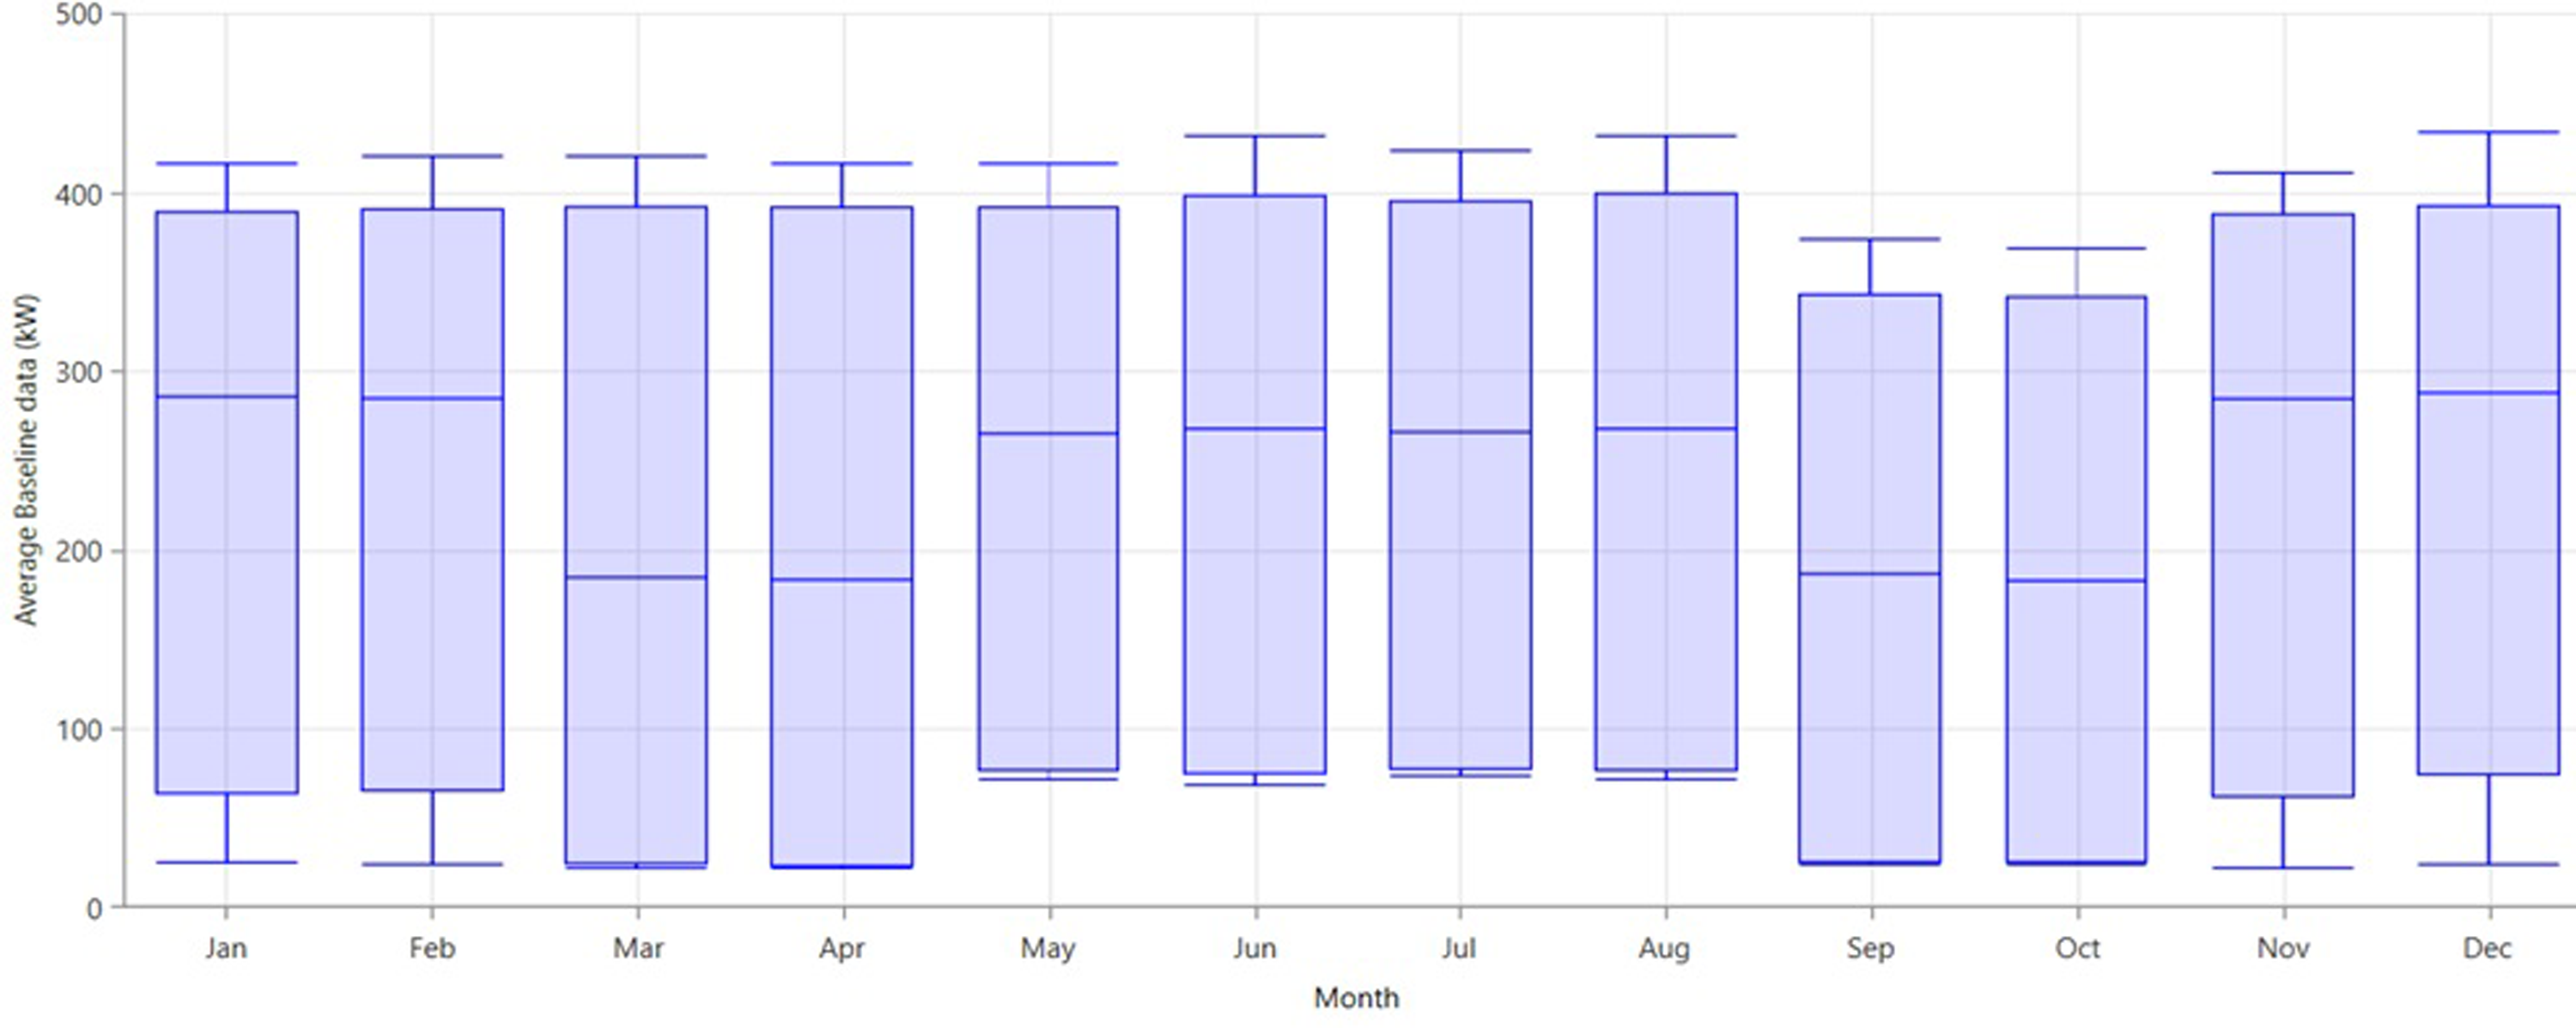
Monthly average electric load data.
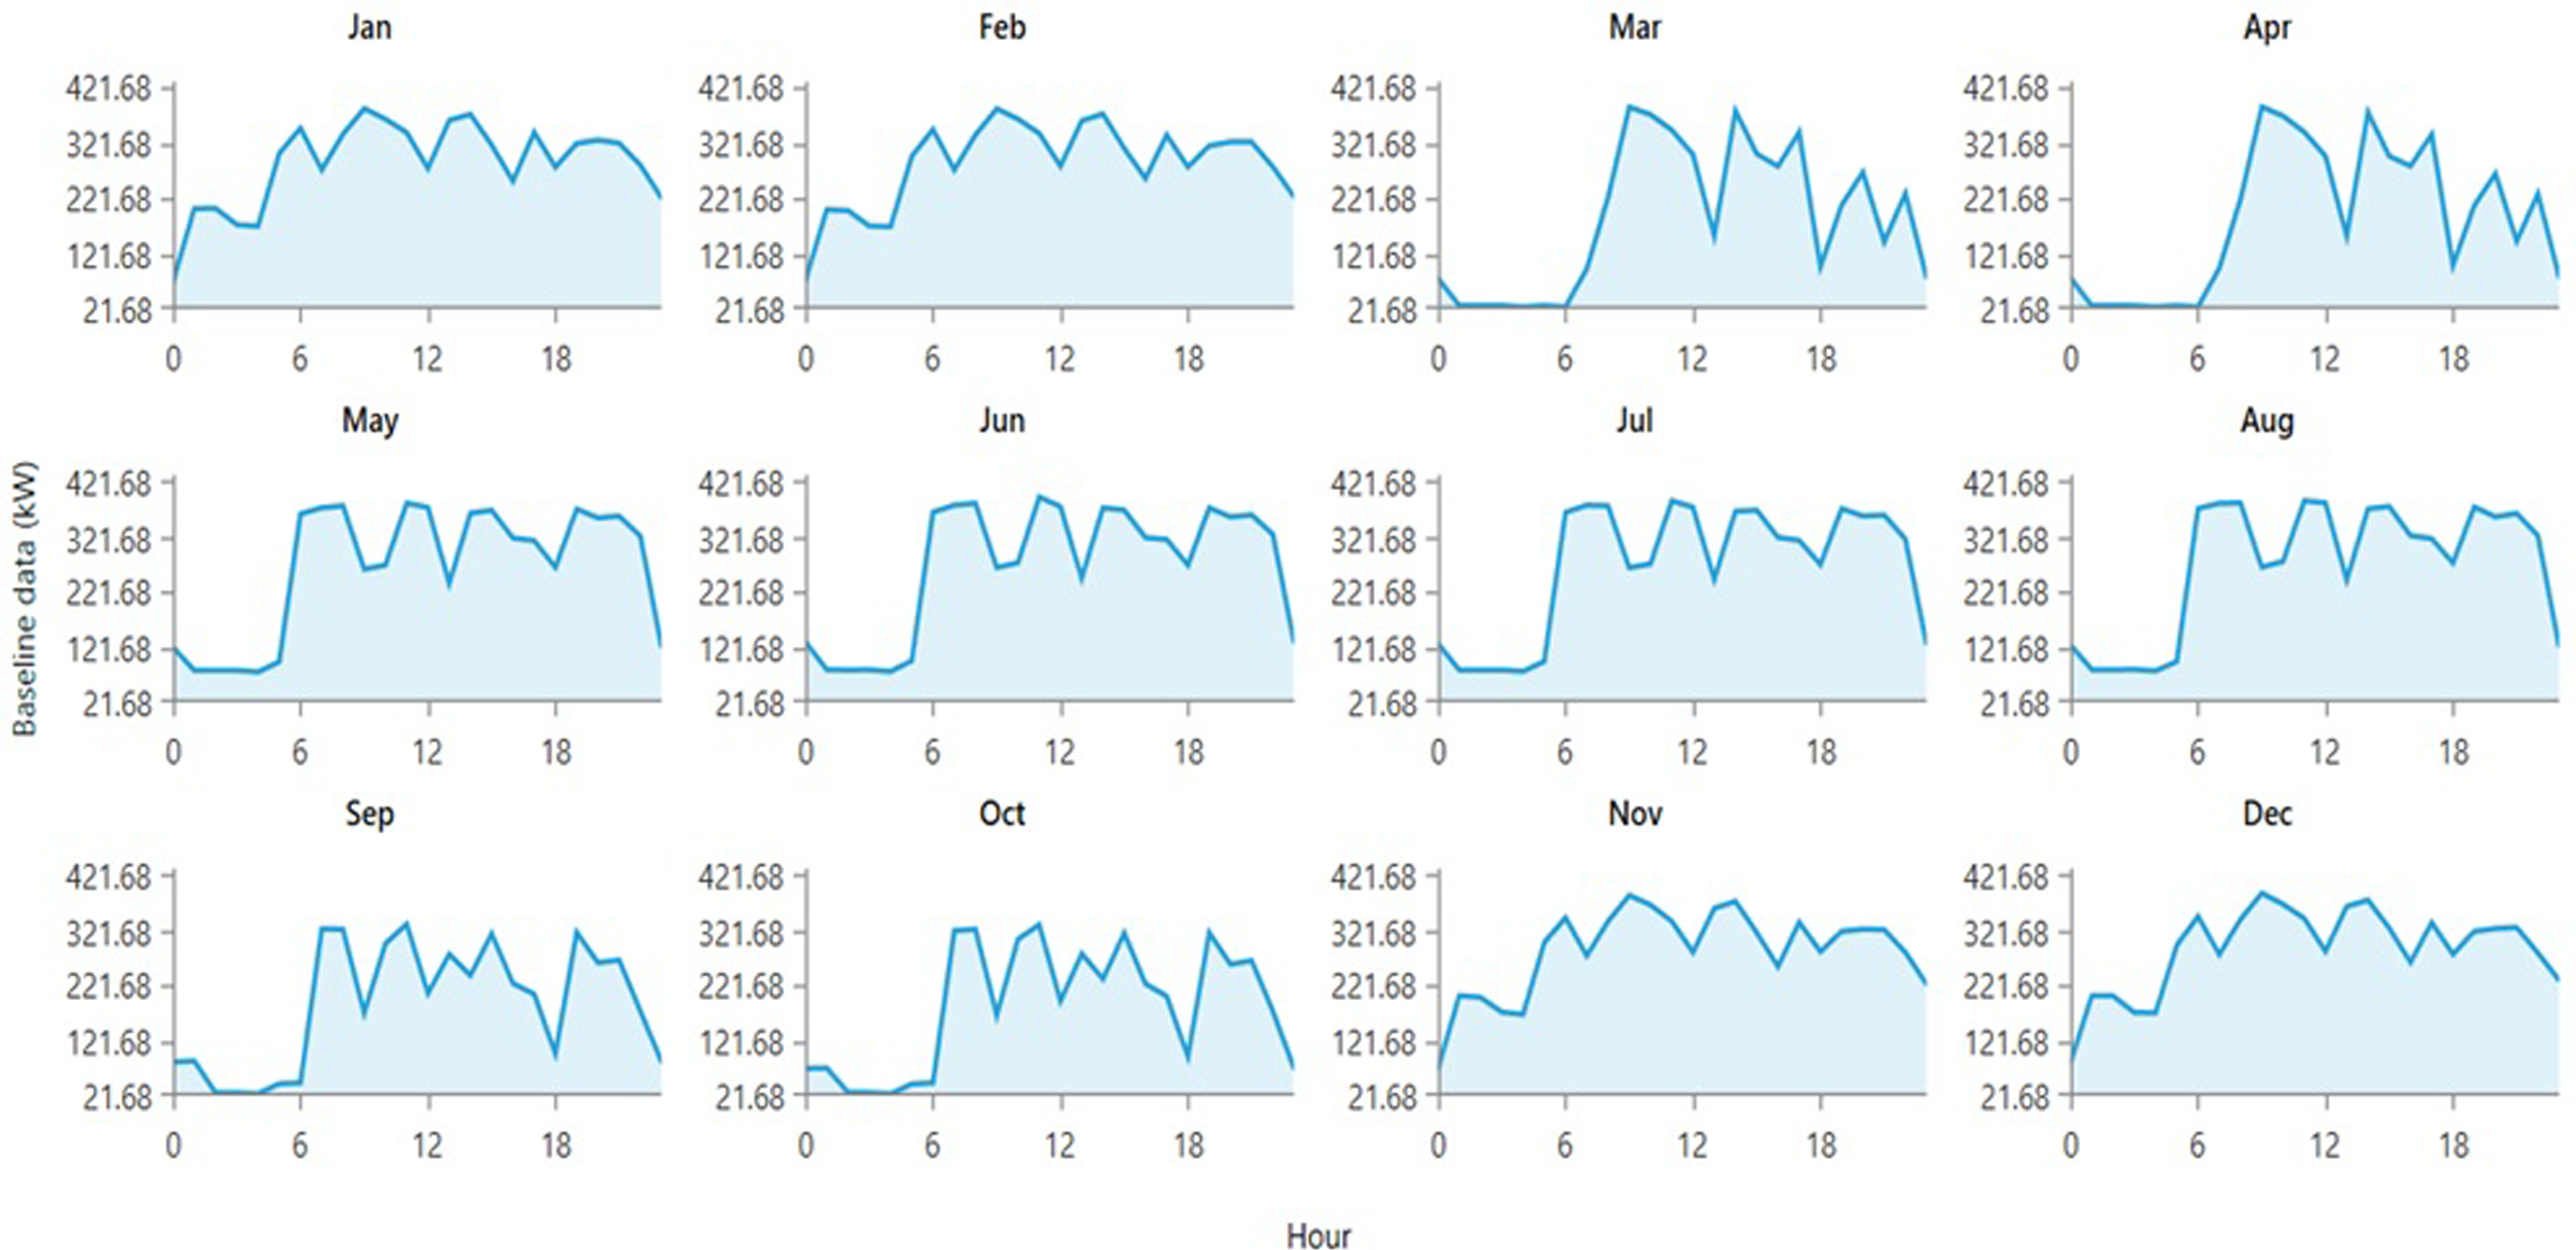
Daily electric load variations.
Solar potential of the study area
The monthly average solar radiation data with clearness index listed in Table 1 is obtained from the National Aeronautics and Space Administration (NASA) and their graphical representation is shown in Figure 5. The obtained data is the average of 22 year's period. The annual average solar radiation is 5.33 kWh/m2/day. The clearness index is given by Equation (1).
25
Gavg = Average monthly solar radiation on the horizontal surface of the earth (kWh/m2/day). Go,avg = Average monthly solar radiation on the horizontal surface at the top of the earth's atmosphere (kWh/m2/day).

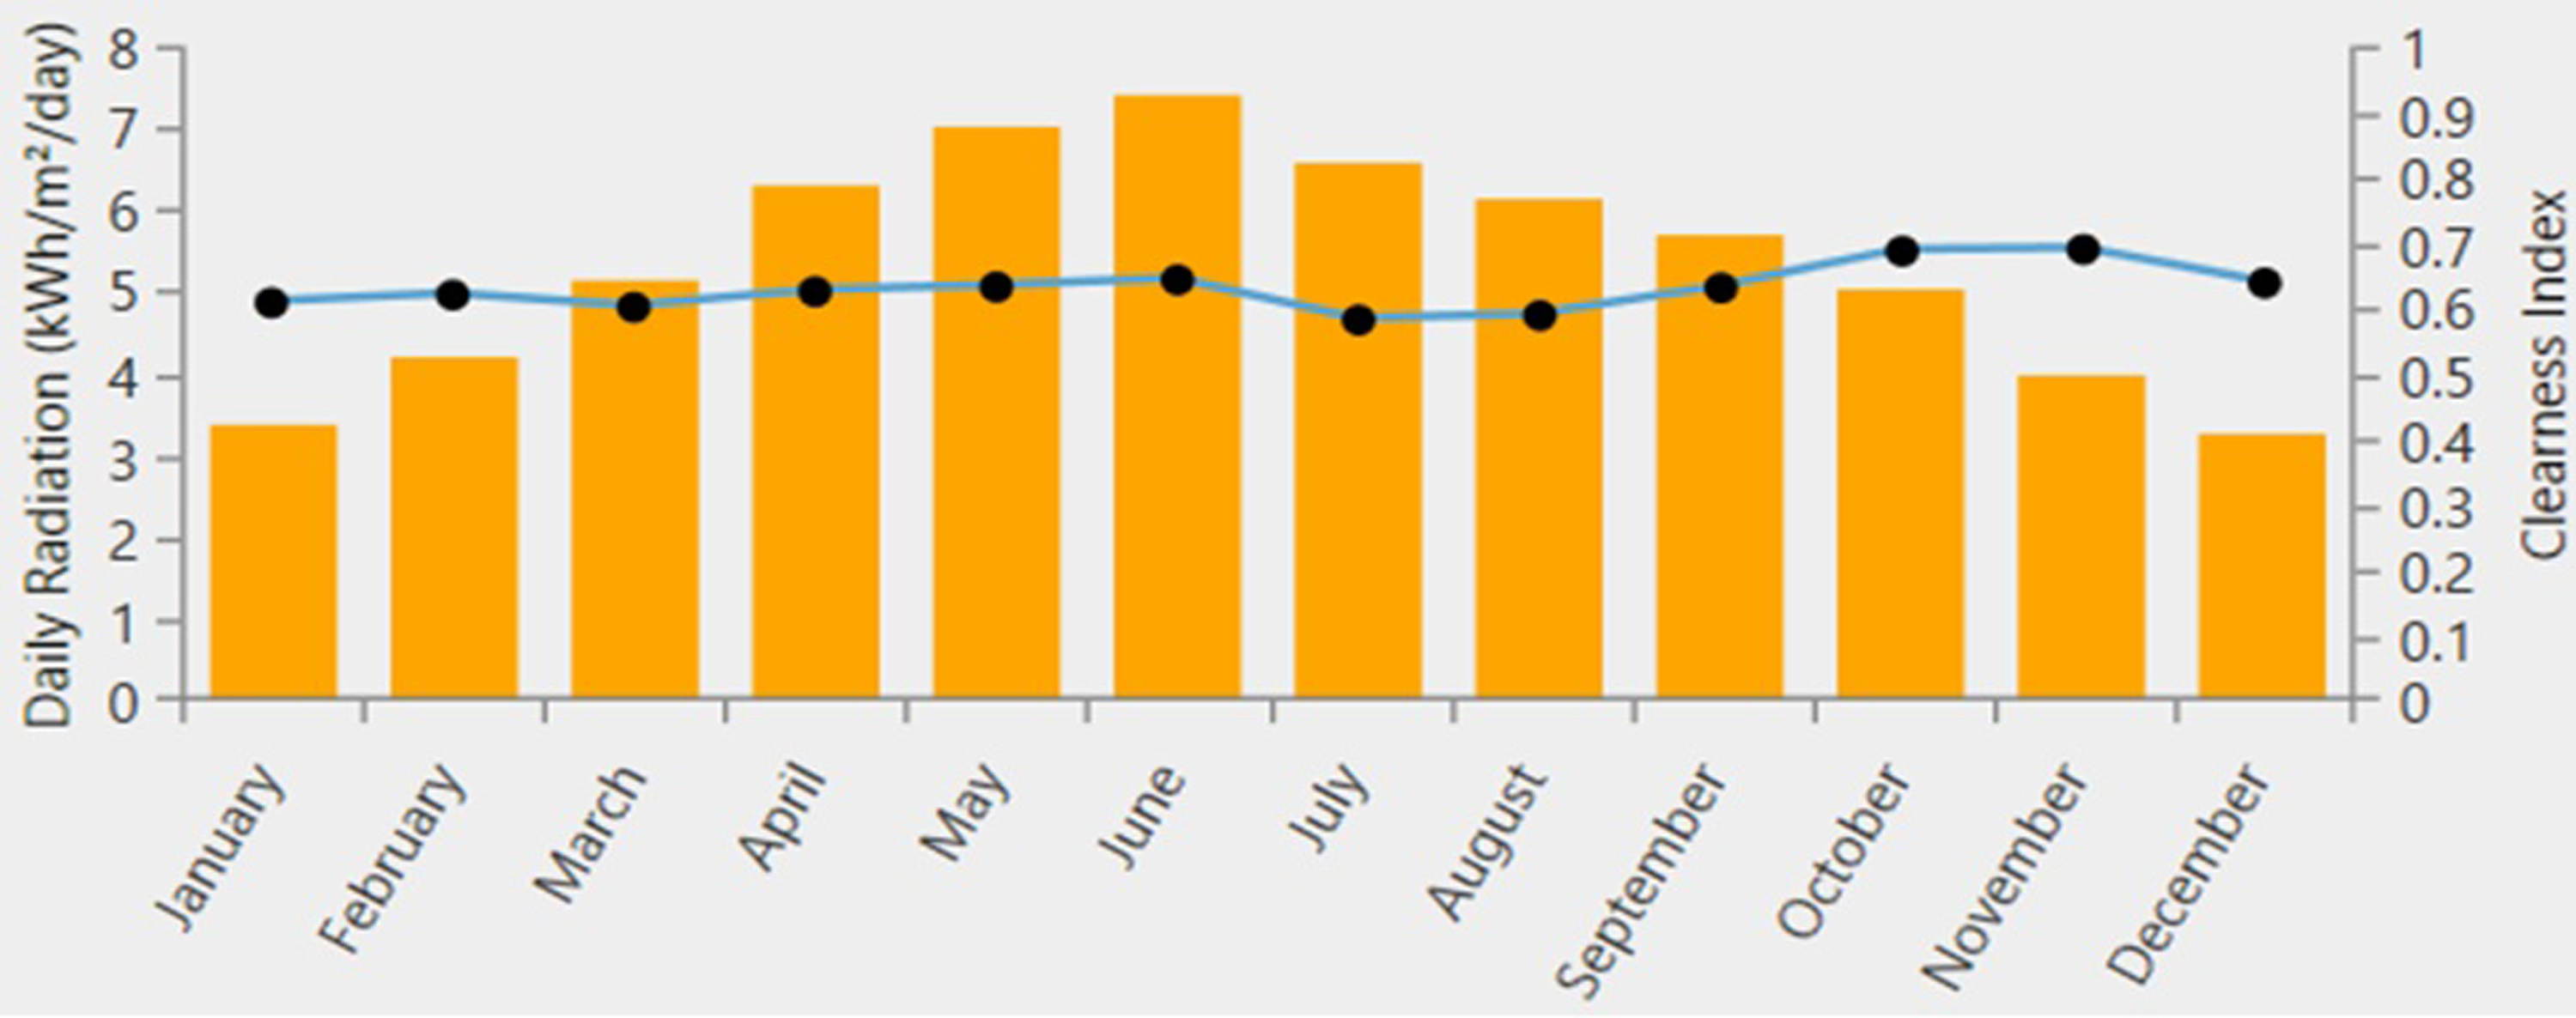
Graphical representation of monthly average solar radiation with clearness index of the study area.
Atmospheric parameters of the study area.

Wind potential of the study area
The monthly average wind data listed in Table 1 is obtained from the NASA and their graphical representation is shown in Figure 6. The obtained data is the average of 10 year's period. The annual average wind speed is 5.76 m/s. The monthly average temperature of the study area is shown in Table 1 and the annual average temperature is 16.54 °C.
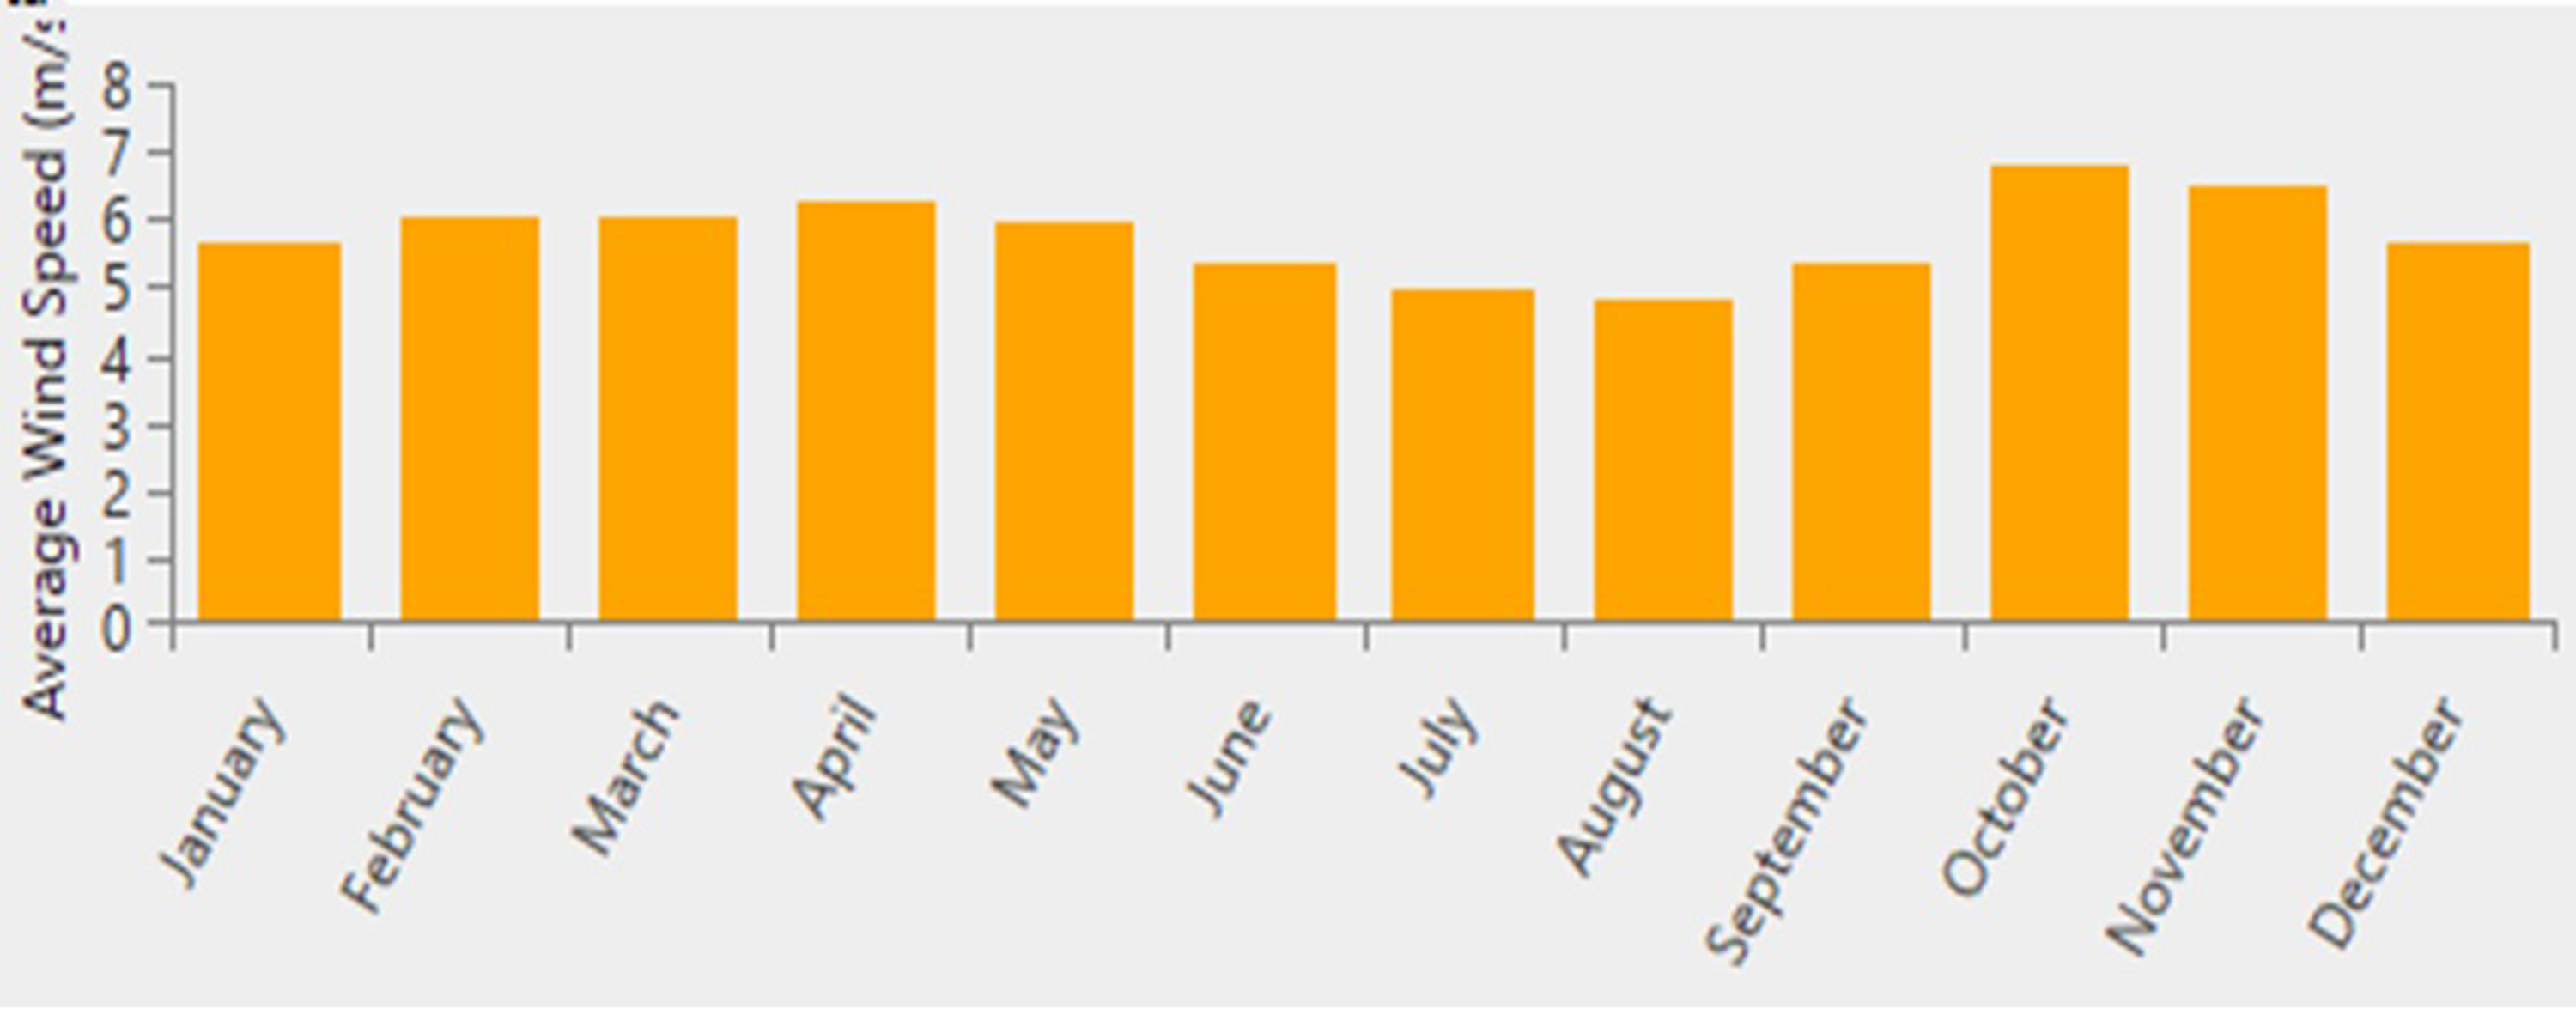
Graphical representation of monthly average wind speed of the study area.
System description
In this paper, six different feasible hybrid energy systems based on the available renewable energy resources are designed and compared. The five main components in the design of the system are photovoltaic (PV) panels, wind turbines, diesel generators, converters and storage batteries. The specifications of the components used in the hybrid system are discussed below a .
HOMER software
HOMER is a well-known software, which is developed by National Renewable Energy Laboratory (NREL) and is used in various research studies for the design, sizing, techno-economic and environmental analysis of hybrid renewable energy system. HOMER software navigates the complexities of building cost effective and reliable hybrid micro-grid and grid-connected systems that combine traditionally generated and renewable power, storage and load management. HOMER uses three steps, simulation, optimization and sensitivity analysis. In simulation energy balance calculations are performed for each interval of time. These calculations evaluate the energy supplied and load available at that interval of time and also the energy flows between the components of the system. Simulation determine the feasibility of the various possible systems. Optimization provides a list of the topmost optimal systems based on the NPC and technical evaluation. Sensitivity analysis is performed to analyze the sustainability of the most optimal system by varying certain input variables. It shows that how much the optimal system is sensitive to the input variables and whether the optimal system will remain optimal and reliable if variations occur in the input variables.
Solar Pv modules
Polycrystalline Trina Tall Max PV module is selected in this study. The maximum rated power of the module is 335 W. The temperature effect on the output power of PV is also considered in the simulations. The maintenance cost is normally 1% of the initial capital cost.
26
The complete details and specifications of the PV module are listed in Table 2. The output power of PV array is given by Equation (2).
24
Pmax = Rated capacity of PV array under standard test conditions (kW). DPV = Derating factor of PV. A = Incident of solar radiation on the PV array in the current time step (kW/m2). ASTC = Solar incident radiations at standard test conditions (1 kW/m2). T = PV cell temperature in the current time step (°C). TSTC = PV cell temperature at standard test conditions (25 °C).
Technical parameters and specifications of solar PV module.

Wind turbines
Hummer H3.1-1000W horizontal axis wind turbine is selected in this study. The maintenance and operation cost is normally 2% of the initial capital cost.
27
The temperature effect on the output power of wind turbine is also considered in simulations. The output power curve of the wind turbine is shown in Figure 7. The details and specifications of wind turbine are listed in Table 3. The output power versus wind speed data is taken from the datasheet of wind turbine and is incorporated in HOMER software. Three steps process is used to calculate the output power of wind turbine. First the wind speed is calculated at hub height of wind turbine using Equation (3),
28
then the output power value is calculated at that wind speed at standard air density using power curve of wind turbine. Whub = Wind speed at hub height of wind turbine (m/s). Wanem = Wind speed at anemometer height (m/s). Hhub = Hub height of wind turbine (m). Hanem = Anemometer height (m). S = Surface roughness length (m).
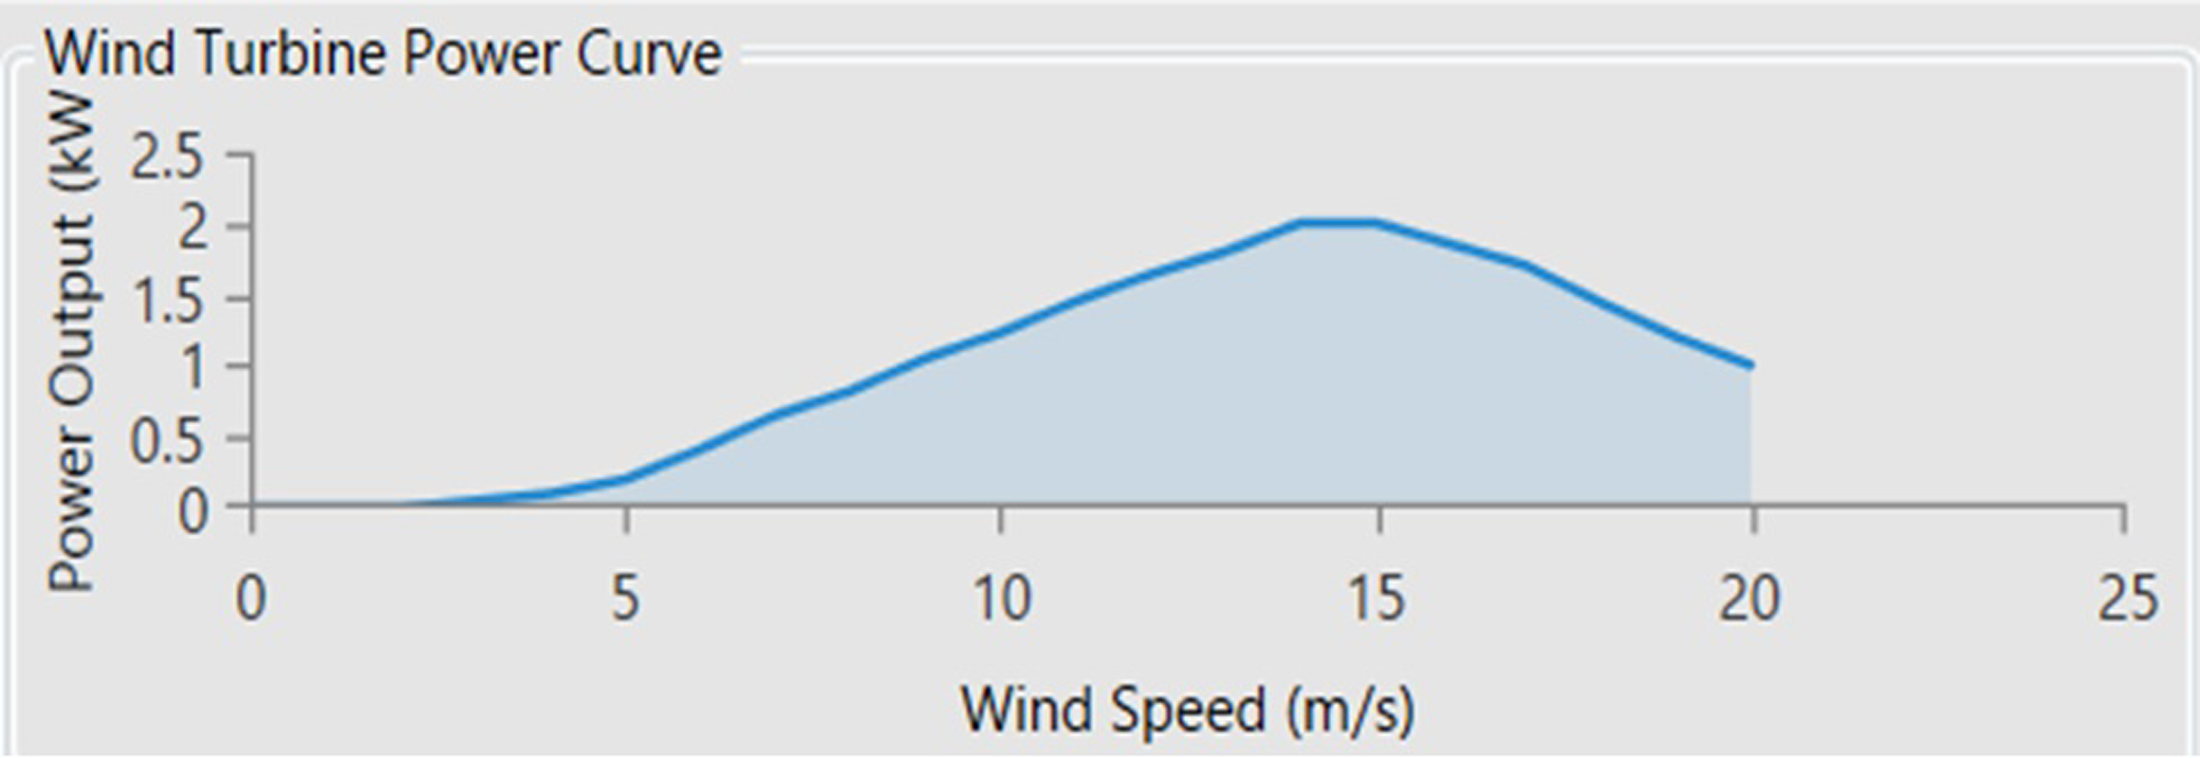
Wind turbine power curve.
Technical parameters and specifications of wind turbine.

Finally, the output power value is calculated for actual air density using Equation (4),
28
in which the obtained power value from the power curve is multiplied by the air density ratio. PWT = Actual output power of wind turbine (kW). PSTP = Output power of wind turbine at standard temperature and pressure (kW).
Diesel generator
Auto size diesel generator model is considered from the HOMER software library for simulations. The specifications of the generator are listed in Table 4 and its efficiency curve is shown in Figure 8. The diesel generator is used to meet the capacity shortages and intermittency of renewable sources. It is used to supply the load when renewable energy is insufficient, and batteries are also unable to supply sufficient energy to the load. Four dispatch strategies are used for generator operation: cycle charging (CC), load following (LF), combined dispatch (CD) and generator order (GO). 29
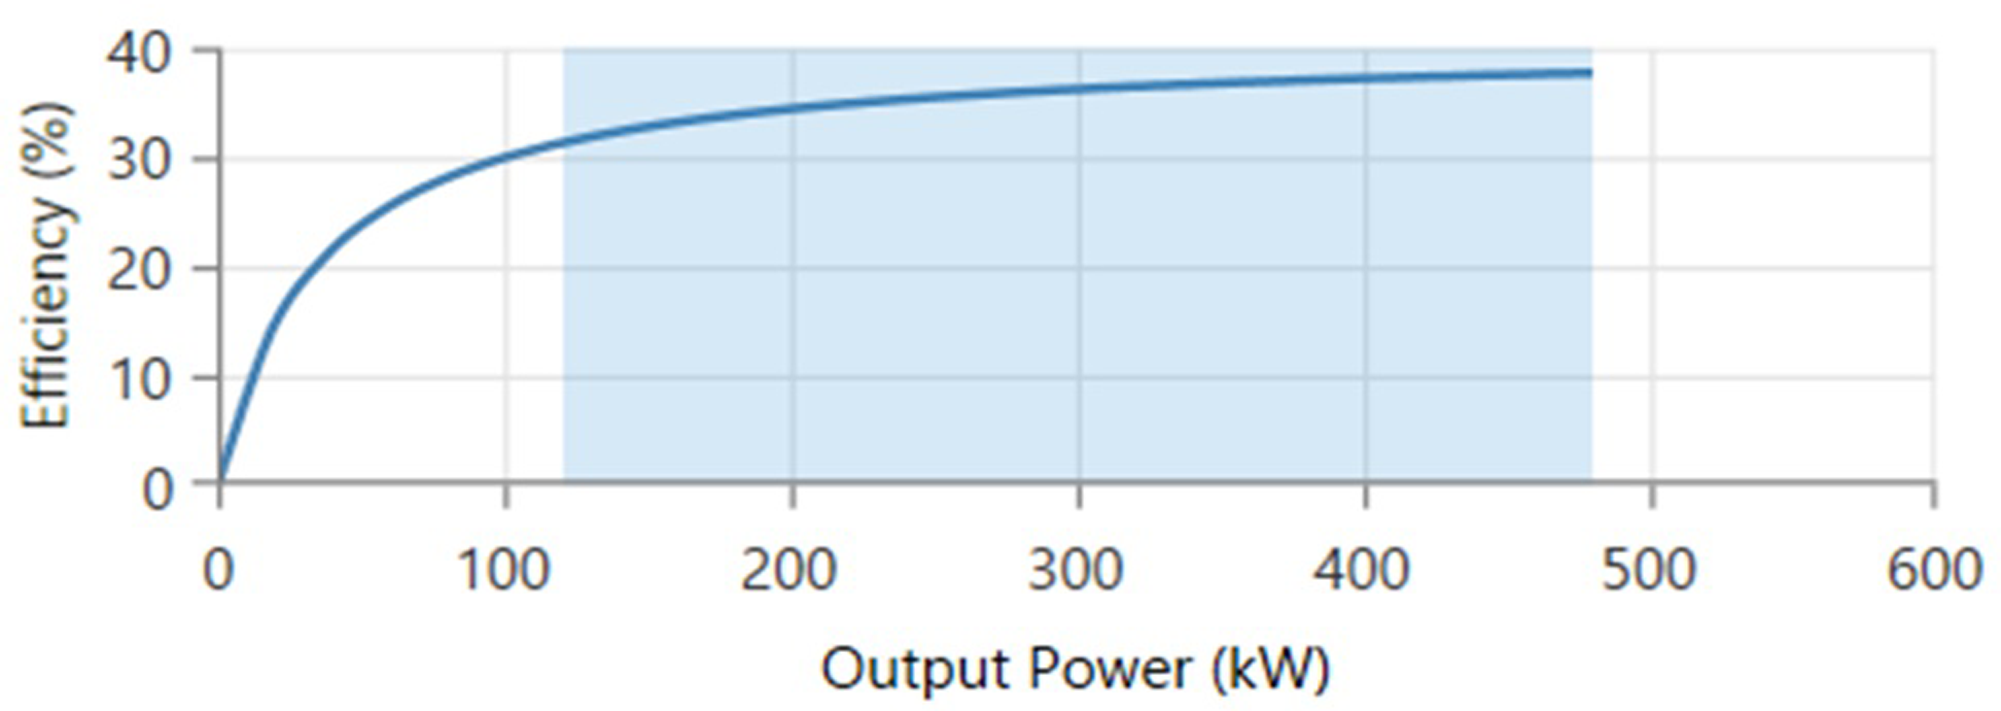
Efficiency curve of diesel generator.
Specifications and technical parameters of diesel generator.

Batteries
Batteries are used to store the excess renewable energy produced from PV or wind turbines. After its charging it is used as a backup supply when renewable is not enough or unavailable to meet the load. BAE, PVS Gmbh model is selected from the HOMER software library for simulations. The technical parameters and specifications of the battery are listed in Table 5. The maximum charge power (Pmax,c) of the battery is calculated using Equation (5)
30
to determine how much renewable power would batteries absorb or how much extra power would diesel generator produce to charge the batteries.
Specifications and technical parameters of battery.

ηc is the battery charge efficiency
Pcmax,kbm is the battery maximum charge power in terms of kinetic battery model given by Equation (6).
30
E1 = Available energy in the battery at the beginning of the time step (kWh). E = Total energy in the battery at the beginning of the time step (kWh). c = Battery capacity ratio. k = Battery rate constant (h-1). Δt = Length of time step (h). Pcmax,mcr is the battery maximum charge power in terms of maximum charge rate given by Equation (7).
30
αc = Battery maximum charge rate (A/Ah). Emax = Total capacity of the battery bank (kWh). Pcmax,mcc is the battery's maximum charge power in terms of the maximum charge current given by Equation (8).
30
nbatt = Number of batteries. Imax = Maximum charge current of the battery (A). Vnom = Nominal voltage of the battery (V).


The maximum discharge power (Pdmax,kbm) is calculated using Equation (9)
31
to determine whether the batteries can serve the load itself or not.

Converter
The generic system converter model is selected from HOMER software library for simulations. The converter will act both as an inverter and as a rectifier depending upon the requirements of the system. The capital and replacement cost of the converter considered is PKR 10,800/kW and 7800/kW, and the operation and maintenance cost considered is PKR 0/kw. The lifetime of the converter is considered 15 years while the efficiencies of both converter and rectifier are considered 95%. The relative capacity of the rectifier is considered 100%. The output power of the inverter is given by Equation (11) while the output power of rectifier is given by Equation (12).
24
Pout,inv = Output power of the inverter (kW) ηinv = Efficiency of the inverter (%) PDC = DC power input to the inverter from the DC bus (kW) Pout,rec = Output power of the rectifier (kW) ηrec = Efficiency of the rectifier (%) PAC = AC power input to the rectifier from the AC bus (kW)

Results and discussions
Optimization results
Optimization is performed to obtain the low-cost optimal system. Optimization provides different feasible configurations with ranking based on the total net present cost (TNPC), initial capital cost, operation and maintenance (O&M) cost and cost of energy (COE). The TNPC is the summation of the present value of all cash-out flow including initial capital, O&M, replacement and fuel cost etc. minus summation of all the cash-inflows (e.g., salvage values) of the system throughout its lifetime and is given by Equation (13).
32



The COE is the cost per kWh of useful output energy by the system and is given by Equation (16).
34

The following six different feasible configurations are suggested in this study. The general schematic of the hybrid system is shown in Figure 9.
PV/diesel generator system with batteries (PV/DG/BSS). PV/wind/diesel generator system with batteries (PV/WT/DG/BSS). PV/diesel generator system without batteries (PV/DG). PV/wind/diesel generator system without batteries (PV/WT/DG). PV/wind system with batteries (PV/WT/BSS). PV system with batteries (PV/BSS).
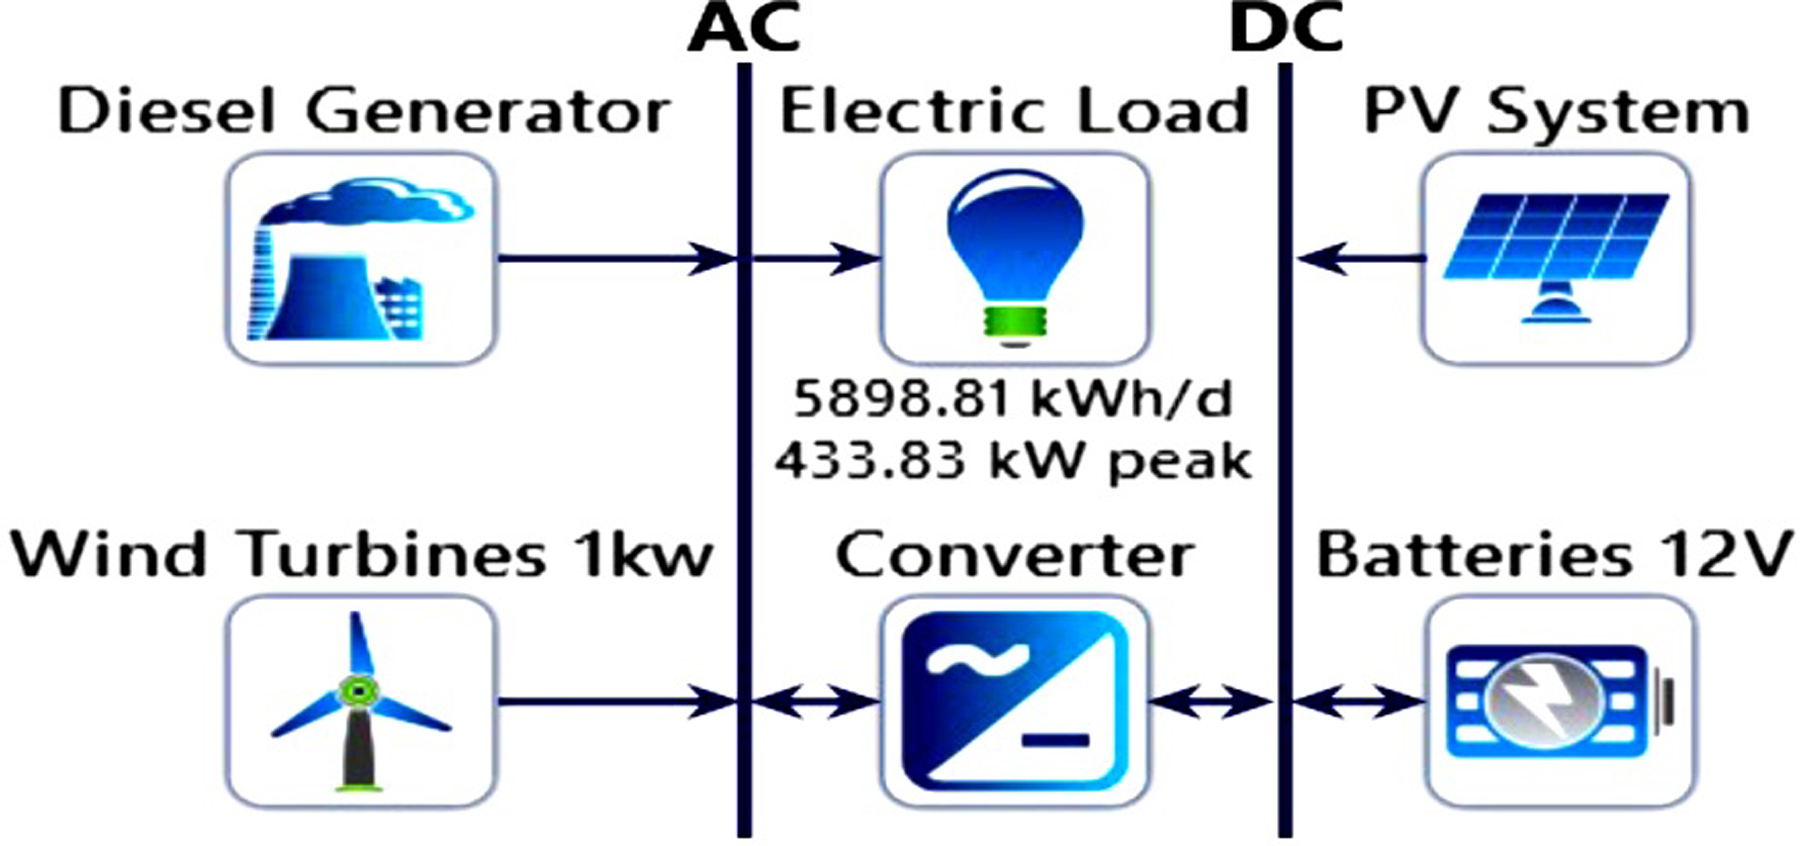
Schematic of the hybrid system.
In this study, the lifetime of the project is considered 25 years and the average value of nominal interest rate, inflation rate and diesel price of the last ten years are considered which are 9.66%, 7.73% and PKR 90/L35–37. A combined dispatch strategy is considered in this study which makes generator usage more efficient.
Technical analysis
The monthly average electric power production by each configuration is shown in Figure 10. The graph shows that the average power produces by PV/DG/BSS configuration is approximately equal to the PV/WT/DG/BSS while the average power produces by PV/DG configuration is approximately equal to PV/WT/DG. The comparison of Figure 10 and Figure 3 shows that each configuration produces the required power to meet the load. It can also be seen that in all configurations, the PV production is highest as compared to the wind, which shows that PV has the highest potential while wind has the lowest potential in the study area. The technical parameters of the six different feasible configurations are listed in Table 6. The highest production and highest excess generation occur in PV/WT/BSS which is 6,322,389 kWh/year and 3,922,243 kWh/year followed by PV/BSS owing to the highest capacity of batteries and renewable power sources as compared to the other configurations, because these are purely renewable energy systems and no diesel generator is used, thus the renewable sources and batteries itself must support the system. These two purely renewable energy systems, likewise, have small amount of capacity shortages of 2095 kWh/year and 2122 kWh/year and the unmet load of 1156 kWh/year and 1655 kWh/year owing to the intermittency of the renewable sources. The capacity shortage and the unmet load is zero in the PV/DG/BSS, PV/WT/DG/BSS, PV/DG and PV/WT/DG systems because of DG; thus, these four systems are able to meet the 100% load. The PV/DG and PV/WT/DG systems have the lowest renewable fraction i.e., 46.7%, because no batteries are utilized to store the renewable power thus 53.3% of the load is meet by the diesel generator which increases the harmful emission and fuel cost while most of renewable energy is wasted in the form of excess generation. The PV/DG/BSS and PV/WT/DG/BSS systems have the highest renewable fraction due to the batteries, as most of the excess generation from renewable sources are stored in batteries to provide to the load while the diesel generator is operated for short periods just to enhance the reliability of the system.
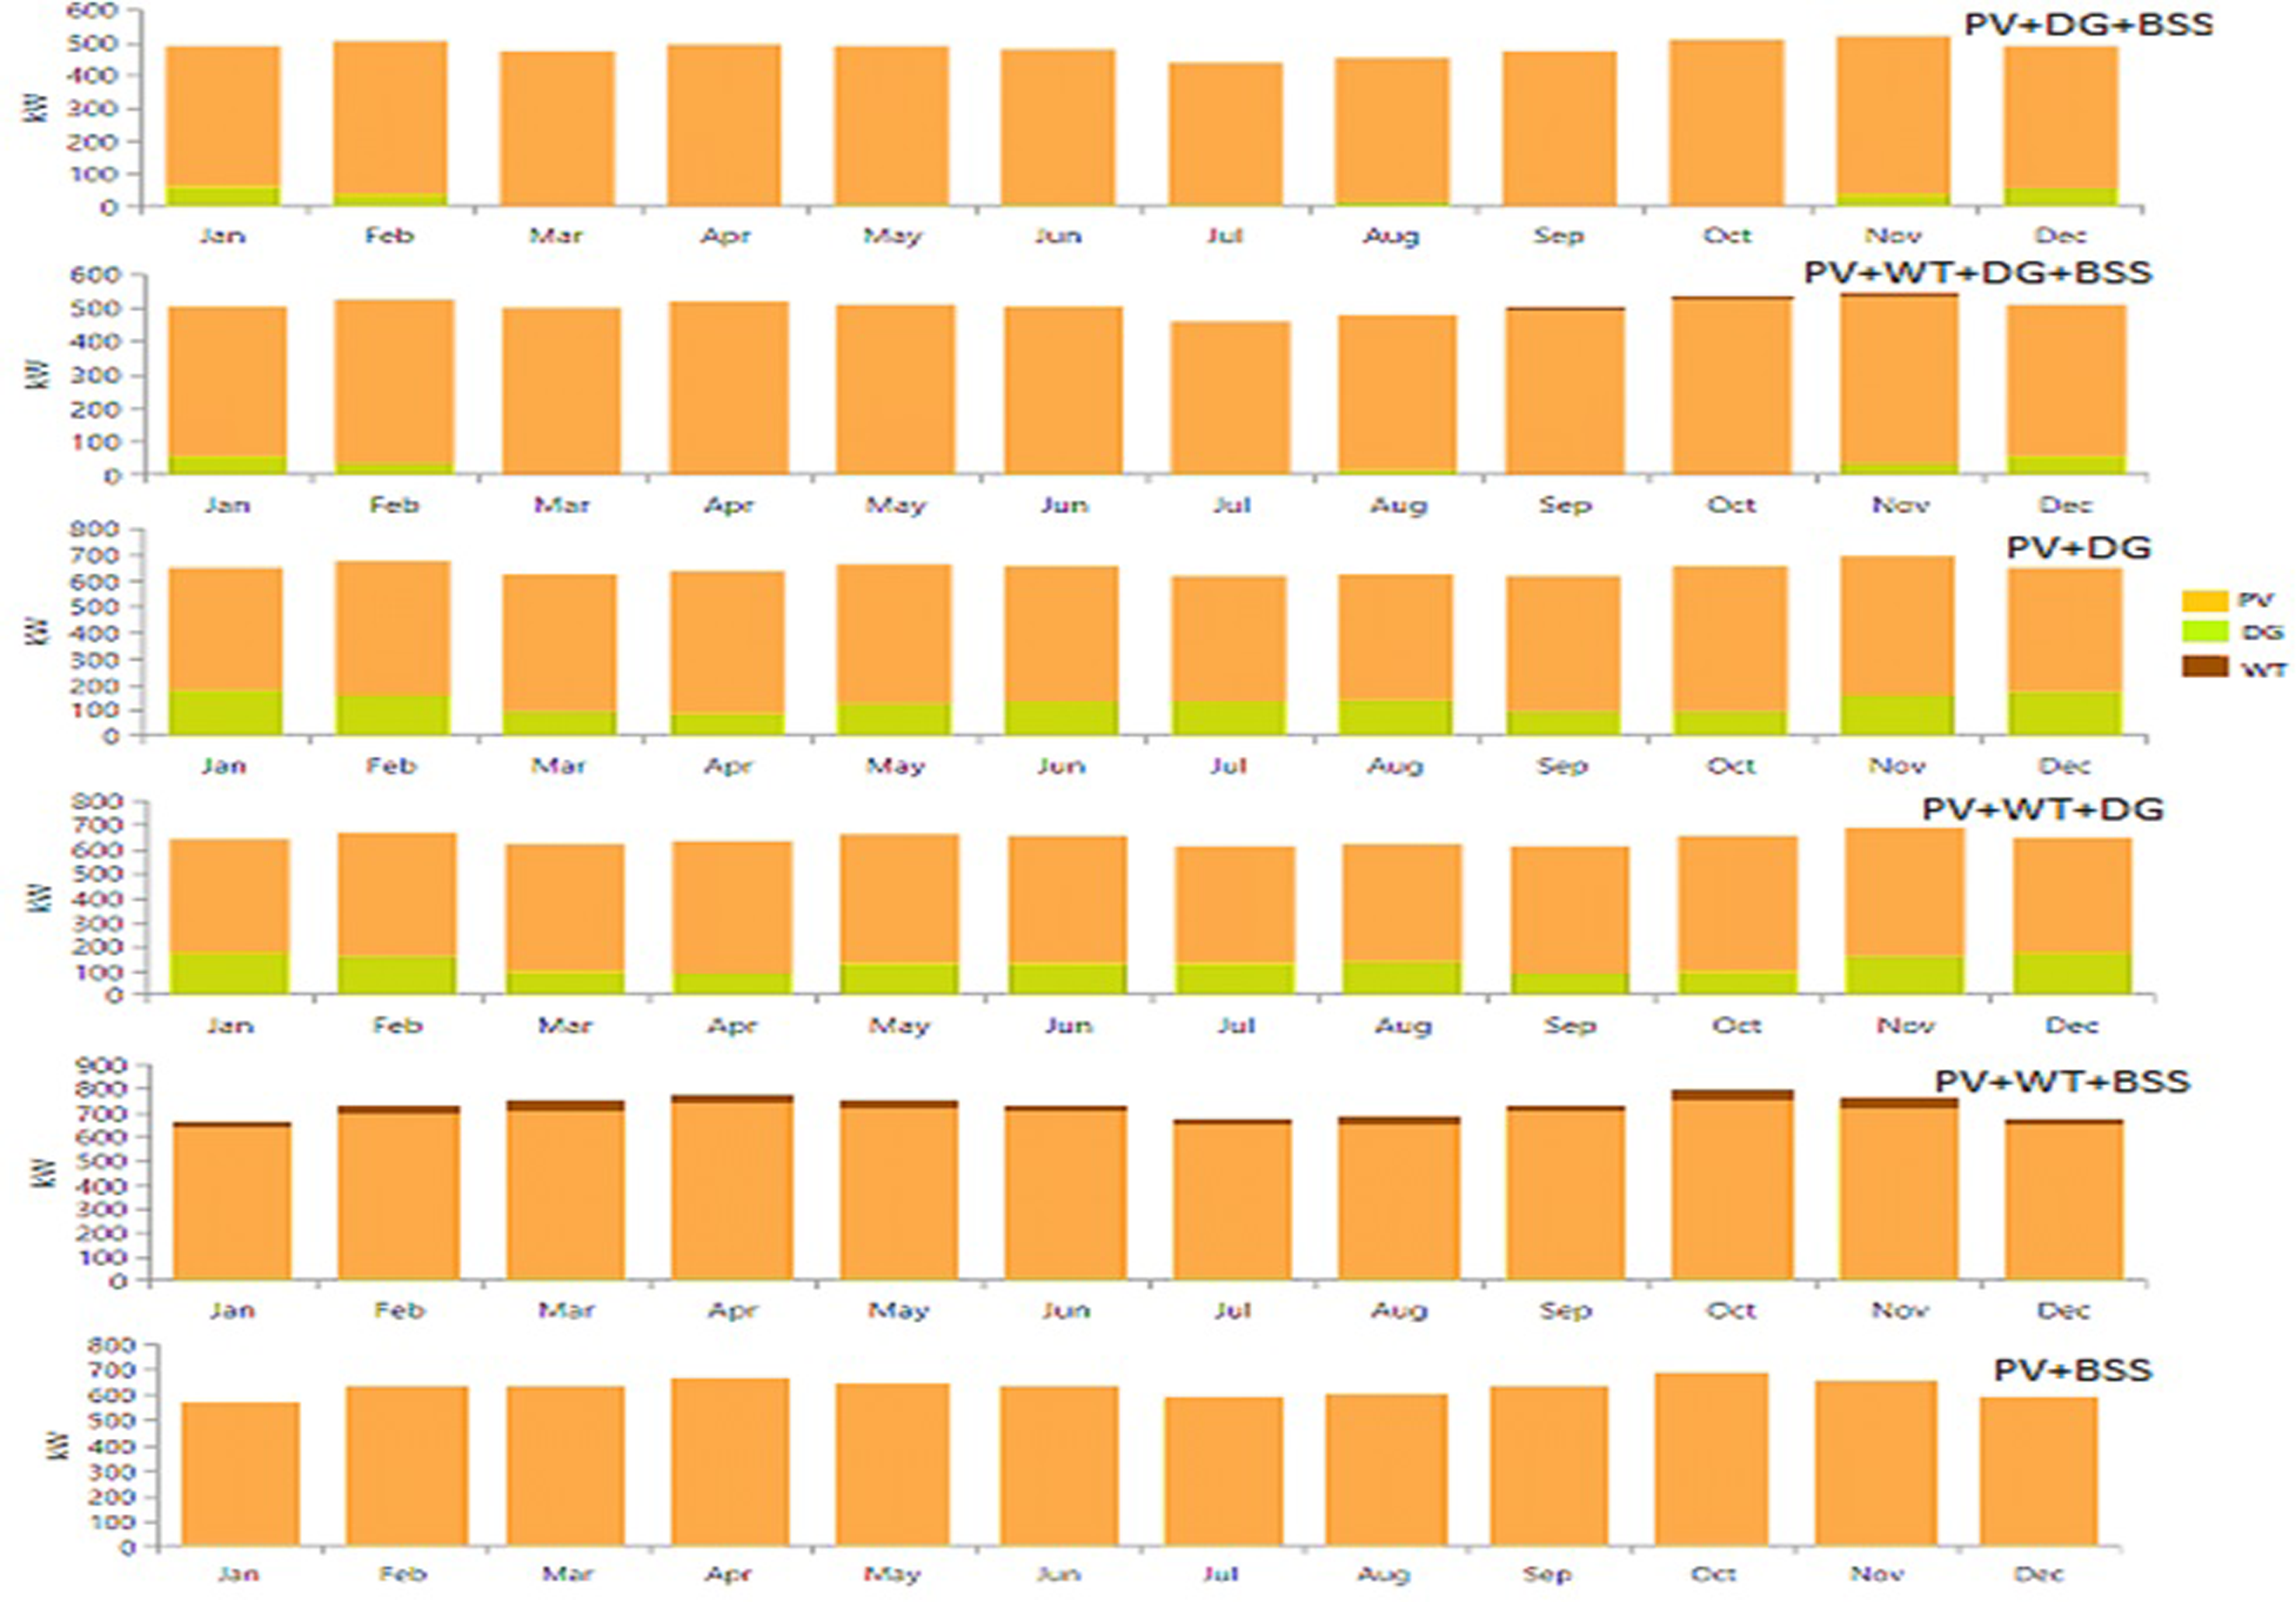
Monthly average electric power production of the six different feasible configurations.
Comparison of technical parameters of the six different feasible configurations.

The technical analysis shows that almost all the configurations are able to meet the electric load. The most suitable configurations are PV/DG/BSS and PV/WT/DG/BSS systems because there is no capacity shortage, unmet load and the renewable fraction is higher. PV/DG and PV/WT/DG systems are not suitable because of the lowest renewable fraction and PV/WT/BSS and PV/BSS are not suitable because of uncertainty and intermittency behaviour of renewable sources as there is a small amount of unmet load and capacity shortage.
Economic analysis
The cost summary of the six different feasible configurations is shown in Table 7. The comparison shows that the TNPC and all other costs of PV/WT/BSS system are highest followed by PV/BSS as compared to other configurations owing to the high capacity of the renewable power sources and batteries. Therefore, these two systems are omitted even these are clean energy systems but due to economic unfeasibility. The remaining four configurations show that the COE, TNPC, annual O&M cost and annual fuel cost of PV/DG and PV/WT/DG is higher as compared to the other two configurations due to low renewable fraction. The overall cost comparison shows that the PV/DG/BSS is most suitable configuration because TNPC, COE, O&M and fuel cost of this configuration is the lowest as compared to all other configurations. The reason for the low costs of the PV/DG/BSS system is a high renewable fraction as both the batteries and generator are included in the system. Thus, the batteries will store most of excess renewable power to provide to the load and the diesel generator is utilized for short periods and very small amount of energy i.e., 3.8%/year is produced from it, only to enhance the reliability of the system. Thus, the fuel cost is low, and this system required low capacity of PV and batteries due to the availability of diesel generator.
Cost summary of six different feasible configurations.

Note: M is million and B is billion.
Environmental analysis
The various annual harmful emissions of the six different feasible configurations emit from diesel generator are shown in Table 8. The emissions include CO2, CO, unburned hydrocarbons, Particulate matter (PM), SO2, and NOx. The emissions comparison shows that the PV/DG and PV/WT/DG has the highest emissions due to lower renewable fraction. The PV/DG/BSS and PV/WT/DG/BSS have lower emissions while PV/WT/BSS and PV/BSS have zero emissions. The emissions in the PV/DG/BSS and PV/WT/DG/BSS are reduced to 86% as compared to PV/WT/DG and PV/DG. Thus, the PV/WT/DG and PV/DG systems are omitted due to higher emissions, the PV/DG/BSS and PV/WT/DG/BSS are suitable due to lower emissions while PV/WT/BSS and PV/BSS are the most suitable due to clean energy systems.
Harmful emissions of six different feasible configurations.

The overall comparison shows that PV/WT/BSS and PV/BSS systems are technically and economically unsuitable because of the capacity shortages, unmet load and highest costs. The PV/WT/DG and PV/DG systems are technically, economically and environmentally unsuitable because of the lowest renewable fraction, higher costs and highest harmful emissions. The PV/DG/BSS system is technically, economically and environmentally the most suitable system because of no unmet load and capacity shortage, highest renewable fraction, lowest costs and lower harmful emissions.
Performance of the optimal Pv/Diesel generator system with batteries (PV/DG/BSS)
The schematic of the optimal hybrid system is shown in Figure 11. The optimization results are shown in Tables 6–8. The TNPC cost summary of the system and each component is listed in Table 9. The total initial capital cost of the system is PKR 211M which is the sum of PKR11.3 M for diesel generator, 97.5 M for PV, 96.3 M for batteries and 6.22M for the inverter. The total O&M cost of the system is PKR 20.2 M which include PKR 714,015 for diesel generator and 19.5 M for PV. The total replacement cost of the system is PKR 276M which includes PKR 273M for batteries and 3.44M for the converter cost and the total fuel cost of the system is PKR 81.9 M. A large PV system and battery storage bank are required due to which PV has the high initial capital cost and NPC while batteries have the highest initial capital, replacement and NPC cost as compared to other components. Batteries and converter do not require any maintenance therefore its O&M cost is zero. The lifetime of PV is equal to the project lifetime hence its replacement cost and salvage value is zero, similarly the generator lifetime is higher than the project lifetime, therefore, its replacement cost is also zero.

Schematic of the optimal hybrid PV/DG/BSS system.
TNP cost summary of the PV/DG/BSS system.

The annual nominal cash flows (non-discounted) for 25-year lifetime of the system are shown in Figure 12. Nominal cash flows are the actual costs or prices in the particular year. Initially, the capital cost of the system occur which is represented by the year zero, then every year O&M and fuel cost of the system occur which is PKR 5.1 M. The O&M cost include PV maintenance cost of PKR 975,382.82 and generator maintenance cost of PKR 35,683.2 and generator fuel cost of PKR 4.092M. After every six years the replacement cost of the batteries occurs, which is PKR 87.71M and after 15 years the replacement cost of the inverter occurs which is PKR 4.5 M. At the end of the 25th year the salvage value of the system will be generated, which is PKR 44.2 M.
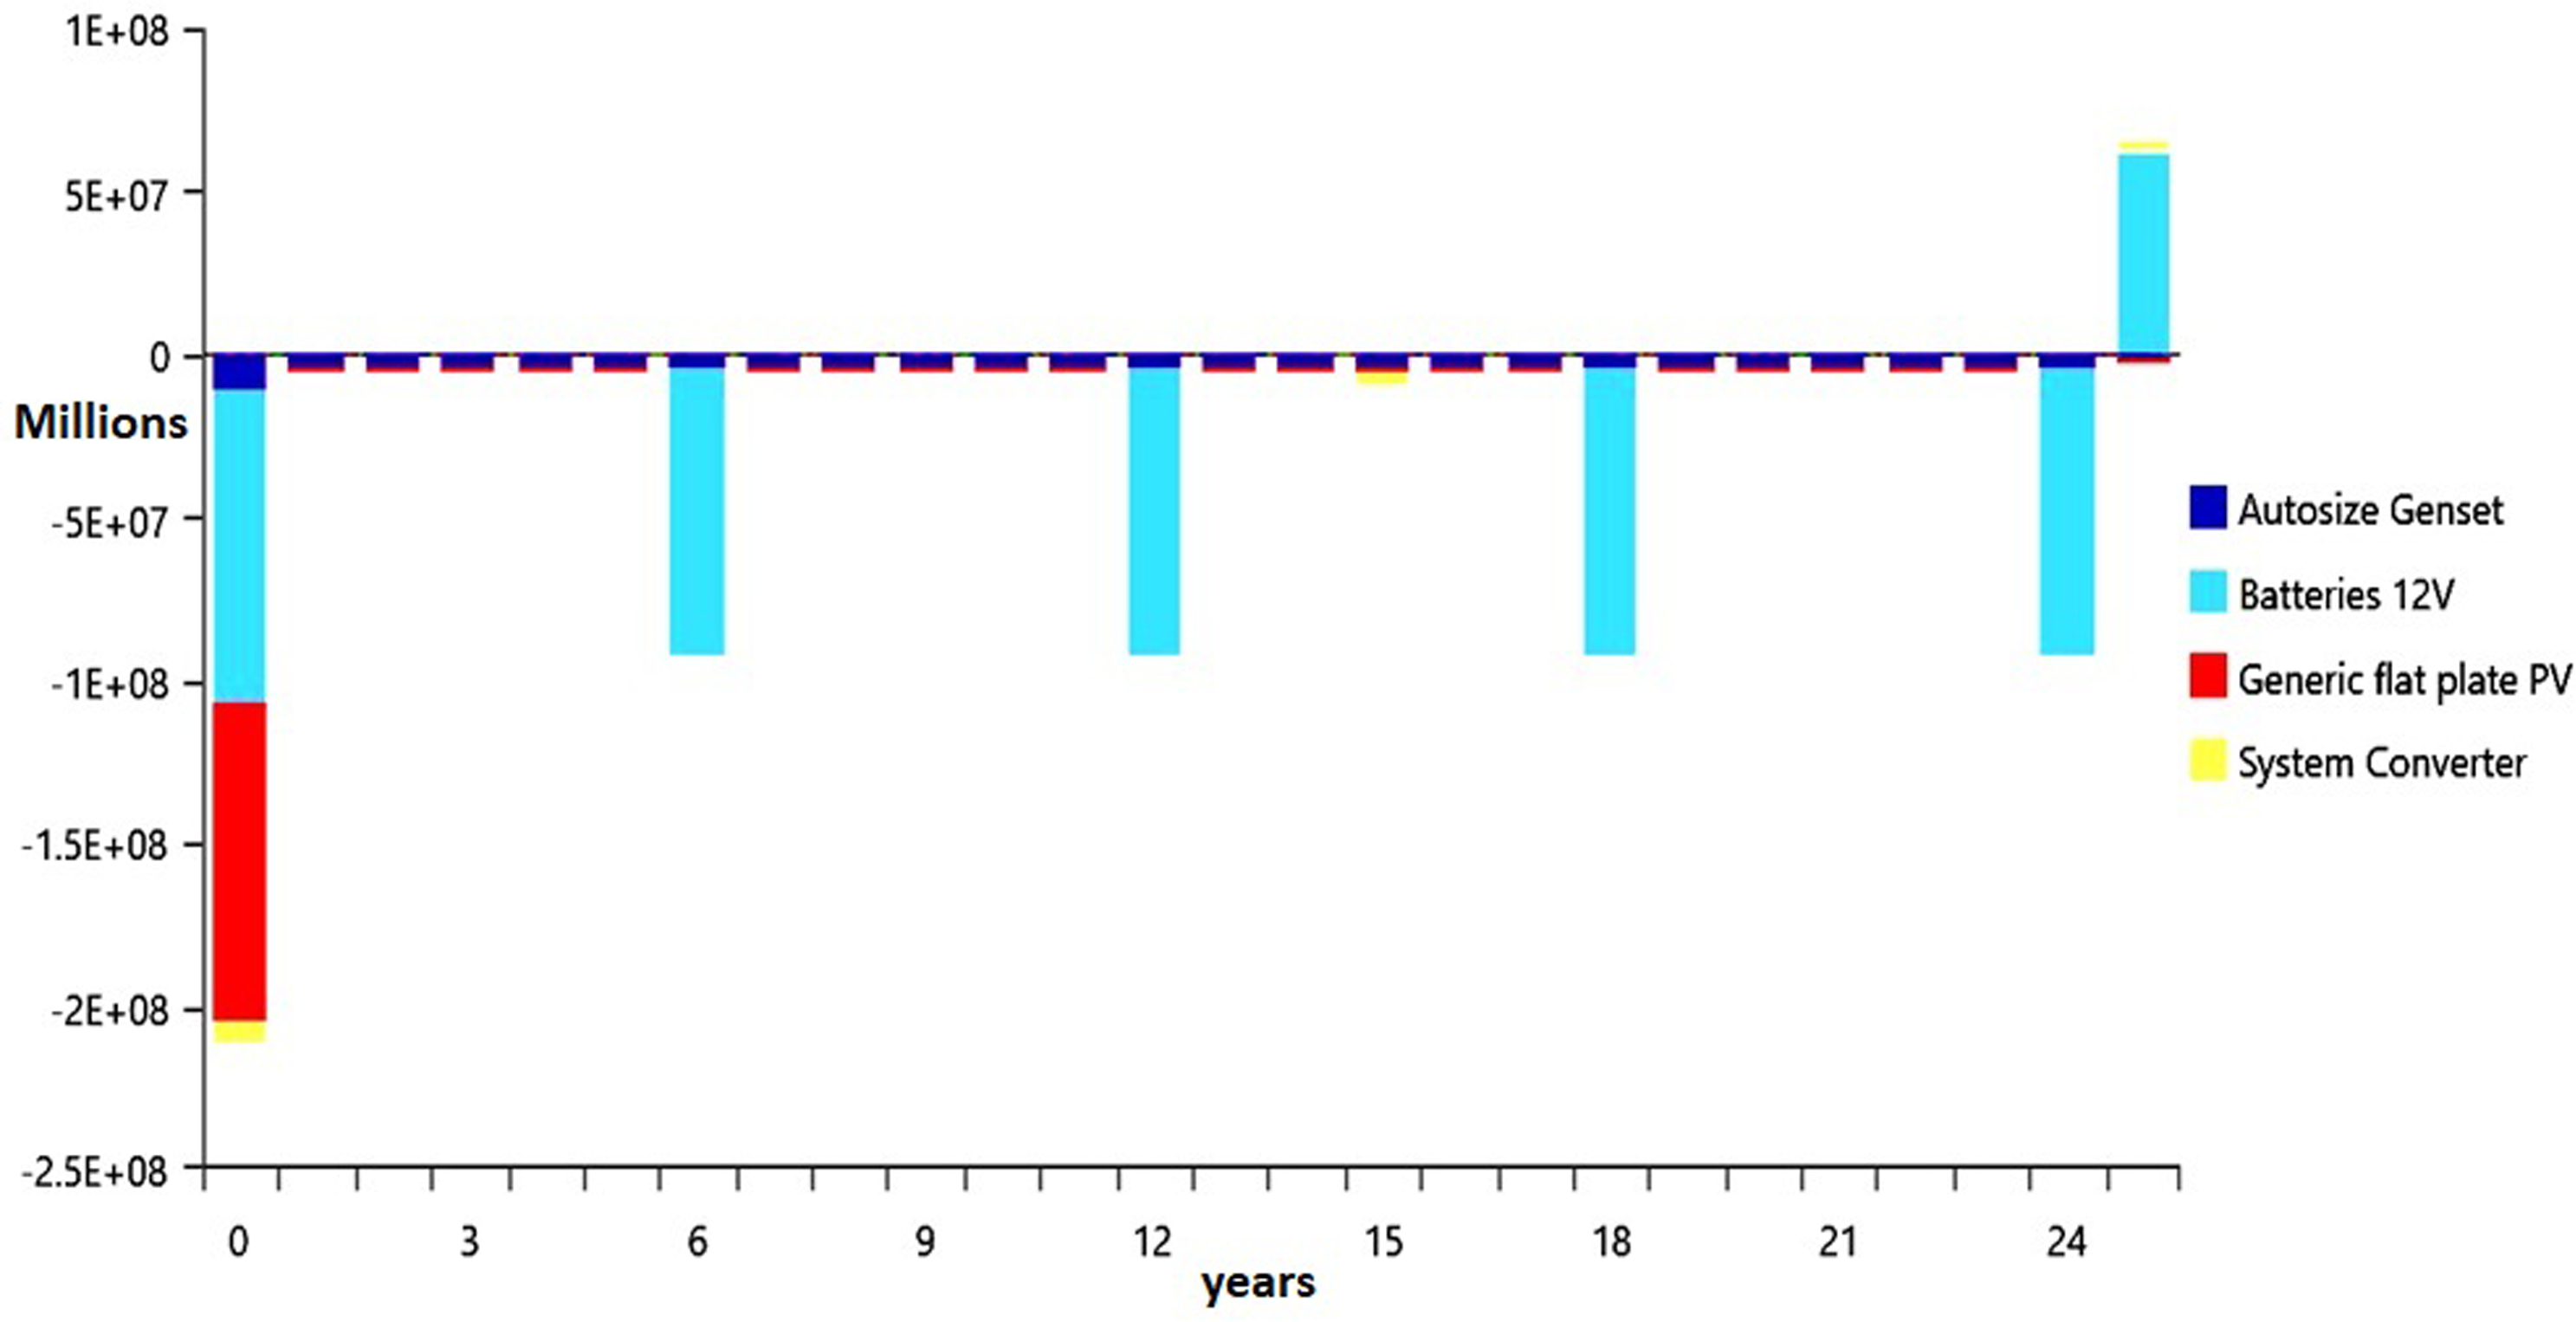
Nominal cash flows of the PV/DG/BSS system.
The monthly average electric power production by each source of PV/DG/BSS system is shown in Figure 10. The more clear scenario is shown in Figure 13, which shows the electric power consumption and production by each source for the entire year. The graph shows that the system produced the required power to meet the 100% load, as the unmeet load is zero in this system. The electric energy production and consumption of the PV/DG/BSS system are shown in Table 6, where the total electric energy production and consumption are 4,238,774 and 2,153,065 kWh/year. It is seen that the PV production is 96.2% of the total generation thus during daytime it is used to supply load and charge the batteries. The batteries are used as a backup source when the PV is insufficient or unavailable. The diesel generator has the lowest production which is 3.78% of total generation, thus it is used to cope with the intermittency behaviour of PV and capacity shortages in the system. It is operated when PV and batteries both are insufficient to meet the load.

Electric power production and consumption for the entire year of the PV/DG/BSS system.
The excess production is 1,836,877 kWh/year which is 43.3% of total production. The excess production is the additional benefit of the system if it is stored using extra battery storage system. It can be used for different purposes such as for selling to the national grid, for agriculture loads or for providing to the near un-electrified village. The unmet load and capacity shortage of the system is zero while the renewable fraction is 92.6%.
The electric energy management strategy of the system and the working of each component is shown in Figure 14. It is the daily load profile of 30th December in which load is reached to a peak value of the year i.e., 433.83 kW at 9 am. The graph shows that PV is available during the daytime between 6 am and 5 pm. The PV is high enough thus it is used to supply the load and to charge the batteries, therefore the generator is off, and the inverter is turned ON during this period to convert DC power of PV into AC to supply it to the load. The excess generation occurs between 11 am and 5 pm because PV output power increases more in this duration and is reached to the peak value of 1331.46 kW at 3 pm. During the evening and at night the PV is unavailable therefore the batteries are used as a backup source to supply the load. In the midnight between 12 am to 3 am and between evening (4 pm) and next midnight (12 am), the batteries themselves can meet the load thus the generator is off, and the inverter is turned ON in these periods to supply the batteries power to the load. The generator is used between 2 am and 7 am period because the batteries reach. the minimum state of charge thus it is unable to meet the load. The rectifier is off for the entire period because the generator is used only to supply the load not to charge the batteries. The graph shows that the battery SOC increases during daytime as it is charging from PV and gets fully charged up to 97% at 4 pm while in the evening and at night its state of charge is decreased due to supplying power to the load.
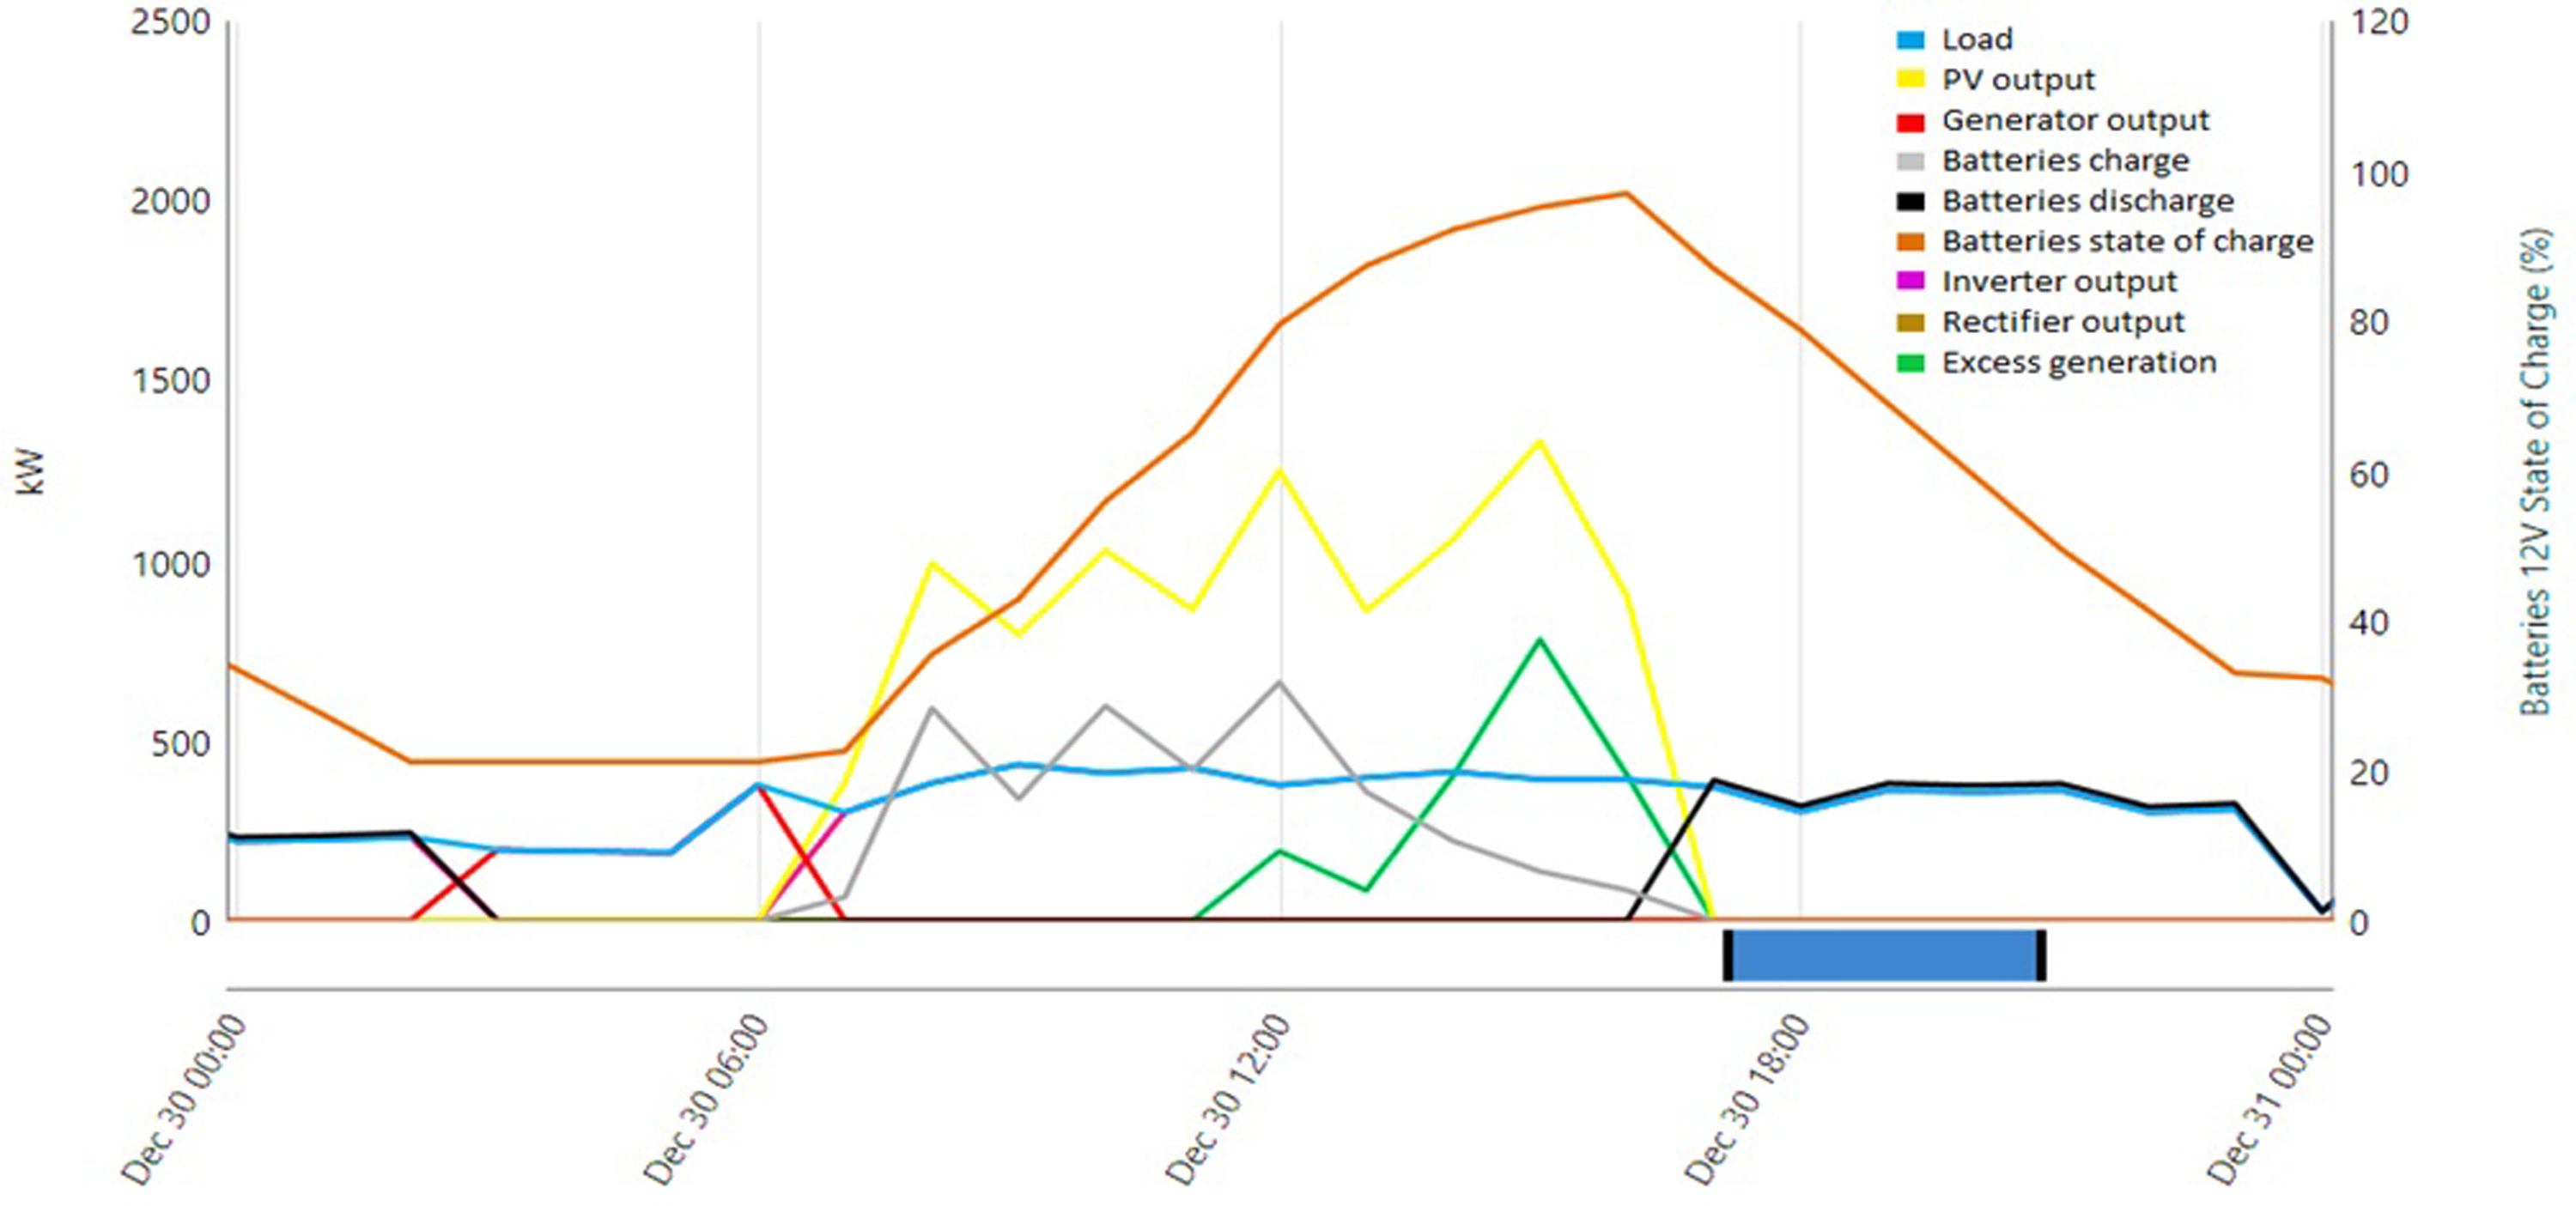
Electric energy management strategy of the PV/DG/BSS system.
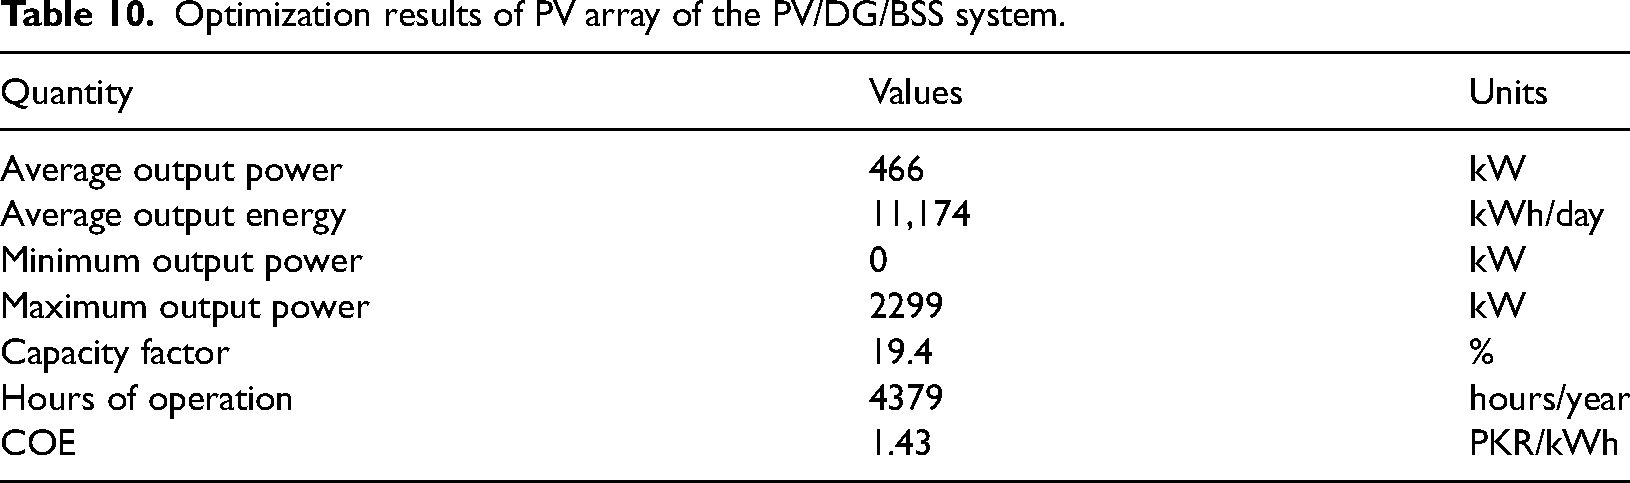
The D map of PV array output power is shown in Figure 15 which shows the daily and seasonal variations of PV array output power e.g., at 12 pm at day 180 the PV array produces 1609.12 kW. It is also seen that the PV array output power decreases during summer seasons because according to Equation (2) the temperature is increases. The average output power of PV array in each month is shown in Figure 16. The graph shows that in January the highest and lowest power that PV produces is 2299.18 kW and 0 kW, the monthly average power produces are 425.84 kW, the daily average maximum and minimum power produces is 1639.7 kW and 0 kW. The PV array optimization results are shown in Table 10. The monthly average power produced by diesel generator is shown in Figure 17. The graphs show that the generator is off in April, September and October because the load is low thus only PV and batteries are enough. The optimization results of the diesel generator are shown in Table 11.

Pv array output Power of the PV/DG/BSS system.

Monthly average output power of PV array of the PV/DG/BSS system.

Monthly average output power of diesel generator of the PV/DG/BSS system.
Optimization results of PV array of the PV/DG/BSS system.
Optimization results of diesel generator of the PV/DG/BSS system.

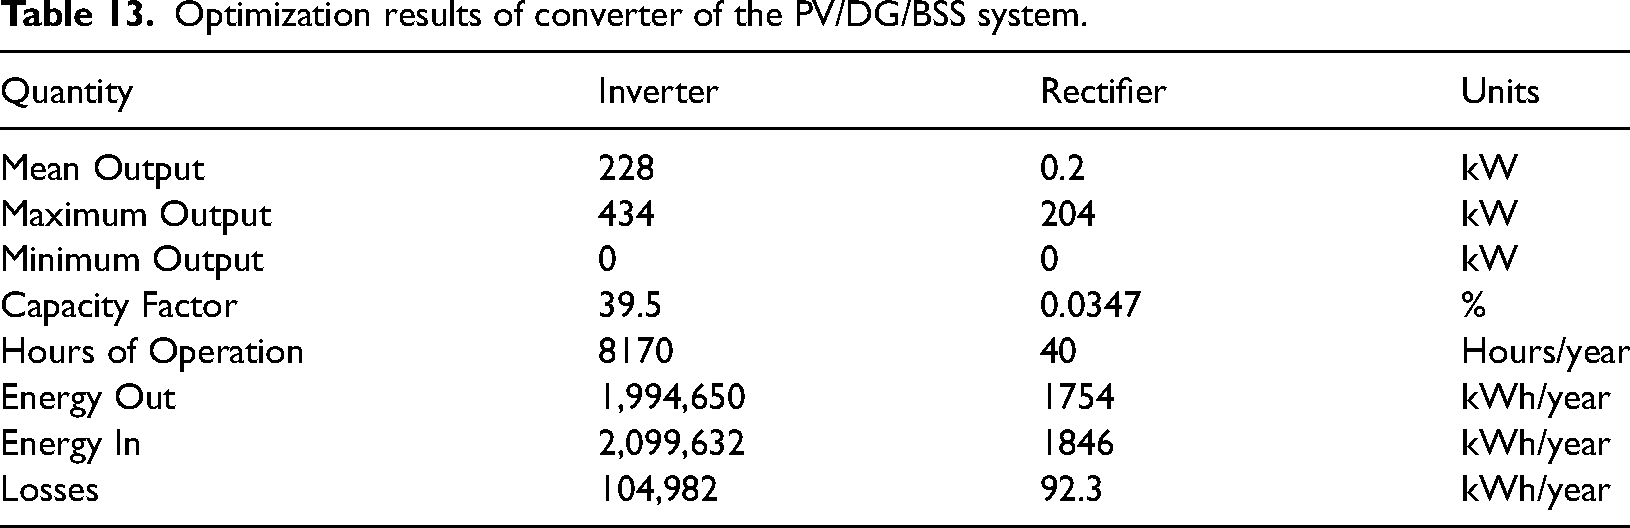
The daily and annual batteries SOC is shown in Figure 18, where the SOC in the daytime is higher approximately 95% due to its charging from PV while in the evening and at night the SOC is decreased due to supplying power to the load. The optimization results of the batteries are shown in Table 12. The daily and annual output power of the inverter is shown in Figure 19, where its output power is higher in the daytime because of the higher the load. The black portion of the graph shows that the diesel generator is used in these periods to supply the load therefore the inverter is off. The optimization results of the inverter and rectifier are shown in Table 13.

Battery state of charge of the PV/DG/BSS system.

Inverter output power of the PV/DG/BSS system.
Optimization results of batteries of the PV/DG/BSS system.

Optimization results of converter of the PV/DG/BSS system.
Sensitivity analysis results
Sensitivity analysis is performed to analyze the effect on the results of the optimal system by changing certain input variables. As variations occur from time to time in diesel price, expected inflation rate and nominal interest rate (discount rate) therefore it is considered as sensitivity variables in this study to determine the changes in configuration, size of components and economics of the system. The current value, average value, highest and the lowest value of the last ten years of sensitivity variables are considered. The current, average, highest and lowest value of diesel price are PKR 113/L, 90/L, 132/L and 68.6/L. 37 The expected inflation rate values are 9.05%, 7.73%, 12.9% and 2.5%.36, 38 The Nominal interest rate values are 7.00%, 9.66%, 13.5% and 5.75%.35, 39 The six sensitivity cases shown in Table 14 are considered. In the first case the current values of all the variables are considered, in the second case the highest values of all the variables are considered, in the third case the highest values of diesel price and expected inflation rate are considered while the lowest value of the nominal interest rate is considered, the fourth case is opposite of third, in the fifth case the lowest values of all the variables are considered while in the sixth case the average values of the last ten years of all the variables are considered. The different optimal configurations and the size of each component of configuration for each sensitivity case is shown in Table 14. The cost summary of the configurations for each sensitivity case is shown Table 15.
System architecture for sensitivity cases.

Cost summary of the system for sensitivity cases.
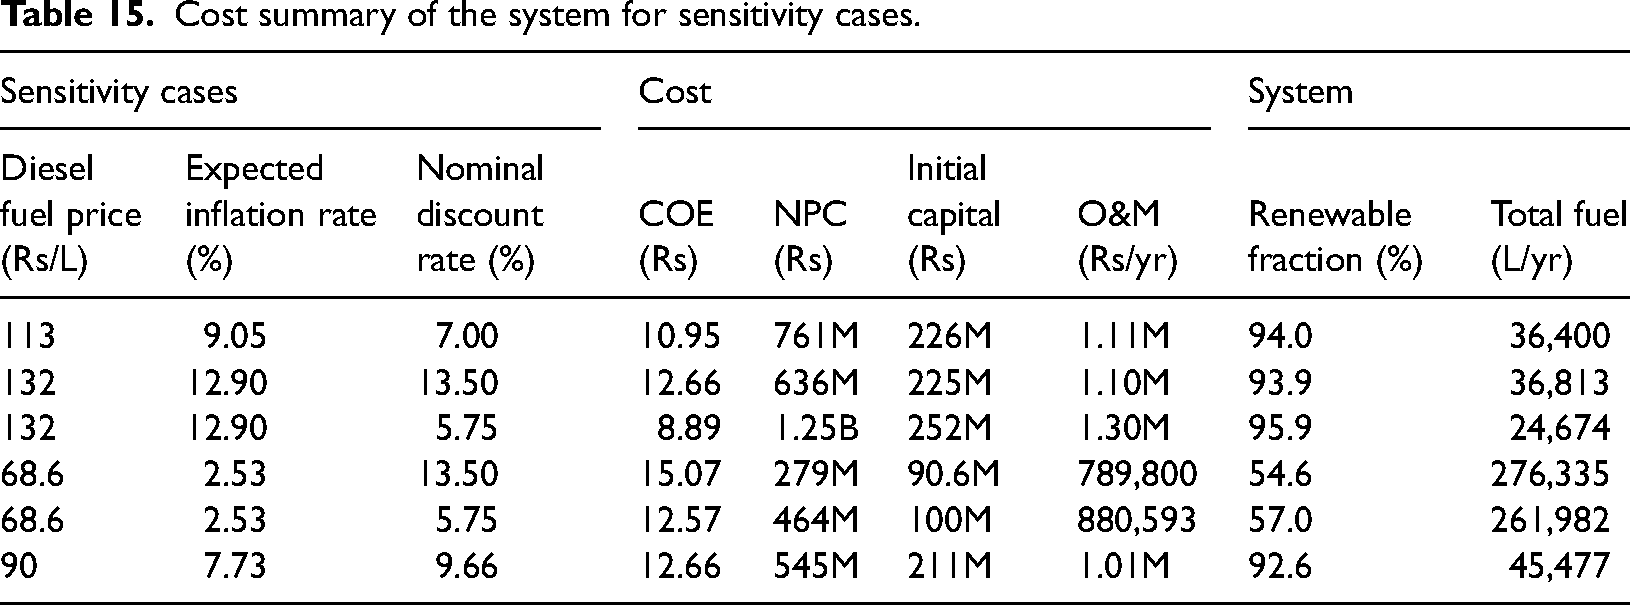
The results show that the system configuration does not change with changes occurring in sensitivity variables. The PV/DG/BSS system will remain the optimal system even if the input variables change with time but only the size of the components and cost of the optimal system will be varied. The results show that the diesel prices and inflation rate are directly proportional to the cost while the interest rate is inversely proportional to the cost. If the diesel prices are varied, then small variations will occur in PV capacity, quantity of the batteries and cost of the system, but the system would remain sustainable and optimal. If the nominal interest rate or inflation rate are varied, then high variations occur in the cost and the system would be sustainable and optimal for a certain range of values. Thus, inflation rate and interest are more sensitive variables as compared to diesel price and normally the average values occur, while the highest or lowest values occur in minor cases for short periods.
Conclusion
This study presents the optimal and cost-effective design of renewable-based hybrid energy system for the rural off-grid area of developing countries. HOMER (Hybrid Optimization of Multiple Energy Resources) software is used for the techno-economic and environmental analysis of the six different feasible configurations. The optimization results show that the PV/diesel generator system with batteries is the most economical, optimal and environmentally friendly system as compared to the other configurations. The optimal system required 2402 kW PV, 480 kW diesel generator and 12V, 1750 batteries, each of 201Ah with a total COE is PKR 12.66/kWh, TNPC is PKR 545M, the initial capital cost is PKR 211M and O&M cost of PKR 1.01M/year. The production capacity of the optimal hybrid system is 4,238,744 kWh/year with an excess generation of 1,836,877 kWh/year which is 43.3% of the total production. The share of the PV and diesel generator in the total production is 4,078,514 kWh/year (96.2%) and 160,261 kWh/year (3.78%) and the renewable fraction of the system is 92.6%. The harmful emission of the optimal system PV/diesel with batteries is cut off to 86% as compared to the PV/diesel system without batteries and the PV/wind/diesel system without batteries. Moreover, sensitivity analysis is performed to check the most optimal system sustainability by making variations in the sensitivity variables such as diesel price, expected inflation rate and interest rate. The analysis shows that the system will remain sustainable if variations occur in the diesel price while it will be sustainable for a certain range of interest rate and expected inflation rate values.
Further, this study suggest that the renewable based hybrid micro-grid technology is more feasible alternative to provide economical, reliable, affordable and environmental friendly electric energy to the remote regions, especially off-grid regions of developing countries, where grid extension is technically unfeasible or expensive due to infrastructural barriers. The government can play an important role by implementing proper policies and planning, providing incentives for developing such systems and starting electrification programmes, to improve the social lifestyle of people that are deprived of basic electricity needs.
Supplemental Material
sj-docx-1-eae-10.1177_0958305X221133256 - Supplemental material for Design islanded hybrid micro-grid and analyzing its socio-economic technical and environmental aspects for off-grid electrification in developing countries
Supplemental material, sj-docx-1-eae-10.1177_0958305X221133256 for Design islanded hybrid micro-grid and analyzing its socio-economic technical and environmental aspects for off-grid electrification in developing countries by Saleem Ullah, Muhammad Yousif, Muhammad Zeeshan Abid, Muhammad Numan and Mubashar Aslam Kataria in Energy & Environment
Supplemental Material
sj-xlsx-2-eae-10.1177_0958305X221133256 - Supplemental material for Design islanded hybrid micro-grid and analyzing its socio-economic technical and environmental aspects for off-grid electrification in developing countries
Supplemental material, sj-xlsx-2-eae-10.1177_0958305X221133256 for Design islanded hybrid micro-grid and analyzing its socio-economic technical and environmental aspects for off-grid electrification in developing countries by Saleem Ullah, Muhammad Yousif, Muhammad Zeeshan Abid, Muhammad Numan and Mubashar Aslam Kataria in Energy & Environment
Supplemental Material
sj-xlsx-3-eae-10.1177_0958305X221133256 - Supplemental material for Design islanded hybrid micro-grid and analyzing its socio-economic technical and environmental aspects for off-grid electrification in developing countries
Supplemental material, sj-xlsx-3-eae-10.1177_0958305X221133256 for Design islanded hybrid micro-grid and analyzing its socio-economic technical and environmental aspects for off-grid electrification in developing countries by Saleem Ullah, Muhammad Yousif, Muhammad Zeeshan Abid, Muhammad Numan and Mubashar Aslam Kataria in Energy & Environment
Supplemental Material
sj-docx-4-eae-10.1177_0958305X221133256 - Supplemental material for Design islanded hybrid micro-grid and analyzing its socio-economic technical and environmental aspects for off-grid electrification in developing countries
Supplemental material, sj-docx-4-eae-10.1177_0958305X221133256 for Design islanded hybrid micro-grid and analyzing its socio-economic technical and environmental aspects for off-grid electrification in developing countries by Saleem Ullah, Muhammad Yousif, Muhammad Zeeshan Abid, Muhammad Numan and Mubashar Aslam Kataria in Energy & Environment
Footnotes
Declaration of conflicting interests
The author(s) declared no potential conflicts of interest with respect to the research, authorship, and/or publication of this article.
Funding
The author(s) received no financial support for the research, authorship, and/or publication of this article.

Supplemental material
Supplemental material for this article is available online.
Notes
References
Supplementary Material
Please find the following supplemental material available below.
For Open Access articles published under a Creative Commons License, all supplemental material carries the same license as the article it is associated with.
For non-Open Access articles published, all supplemental material carries a non-exclusive license, and permission requests for re-use of supplemental material or any part of supplemental material shall be sent directly to the copyright owner as specified in the copyright notice associated with the article.
