



Abstract
This research utilizes a bootstrap rolling-window (BRW) causality test to explore the causal interrelationship between nuclear energy consumption (NUC) and carbon dioxide emissions (CO2) in 6 developed countries from 1980 to 2020. When there are structural shifts in the full-sample time series, empirical research exploring causality between two-time series generates erroneous conclusions. On the other hand, the BRW method allows researchers to find potential time-varying causality between time series using sub-sample data. The outcomes of the BRW causality test disclosed the following results: (i) a unidirectional negative causality from NUC to CO2 without feedback was found for Japan; (ii) a negative causality at sup-sample periods from NUC to CO2 surfaced at the sub-sample period while a positive causality surfaced from NUC to CO2 in sub-sample period for the United States of America (USA) and France; (iii) a negative feedback causality between NUC and CO2 was found For Canada; (iv) a positive unidirectional causality surfaced from NUC to CO2 was found for Germany, which implies that consumption of NUC worsens the environment in the sub-sampled period. The results may have policy consequences for the selected developed countries regarding NUC and CO2 nexus.
Introduction
The growing concentration of CO2 in the atmosphere adds to global warming and climate uncertainty.1,2 Unsustainable energy use threatens the economy, society, and environment as energy production and consumption contribute 70% of all emissions. 3 CO2 must be regulated to satisfy the Kyoto Protocol and the COP-26 accord; otherwise, it will double energy-linked emissions by 2050. Energy-linked emissions may be lowered by improving energy efficiency, substituting low-emissions technologies, such as nuclear and renewable energy, for traditional carbon-intensive technologies, and electrifying heat and transportation.4–10 Multiple approaches are needed to decarbonize economies because no single alternative can accomplish the 1.5°C objectives alone. As a result, inexpensive and dependable energy sources are essential to provide energy security and reduce foreign fuel reliance, as energy promotes economic growth and development.
In the past five decades, nuclear energy has stopped 60 gigatons of CO2. 3 Nuclear power facilities do not release greenhouse gas emissions while they operate and have very minimal emissions while supplying enormous amounts of energy. 11 Nuclear power plants can be evaluated as relatively inexpensive, offer reliable energy supplies, and encourage economic development and growth. In fact, nuclear power facilities have high initial capital expenditures, but they have low operational expenses.12,13 As a result, nuclear energy costs are predictable and steady over long periods as variations in nuclear energy are less noticeable due to the cost structure of nuclear reactors. 14 Nuclear energy promotes human health by ensuring a green environment. Nuclear energy has been improving and becoming more versatile and efficient. It gives emerging economies access to dependable, low-cost, and carbon-free power, which helps their economic growth. Nuclear energy has a lower mineral need than other energy industries. 15 The electricity generated by nuclear power reactors grew from 2563 terawatt hours in 2018 to 2657 terawatt hours in 2019. Moreover, nuclear energy's proportion in global power generation is predicted to increase to 25 by 2050%. Since nuclear energy can substitute fossil fuel energy safely, reliably, economically, and sustainably, it will play a significant part in the transition to clean energy. 16
Numerous attempts have been made from both theoretical and empirical perspectives, along with significant policy ramifications, which are thought to aid in reaching agreements on environmental-linked problems. Despite ongoing efforts, ecological problems resulting from the continual increase in carbon emissions, which cause global warming, have not only stayed unaddressed but also have the possibility of presenting bigger risks in the future. There are at least three elements that are connected to this unsolved problem. First, the globe's productive capacity continues to be primarily dependent on fossil fuels despite widespread support for switching from fossil fuel to renewable forms of energy. Secondly, due to the restricted accessibility and cost of renewable energy, the intense concentration on it has not yet produced the anticipated outcomes. Consequently, a clean alternative energy source is required throughout the present transition period. Thirdly, nuclear energy is the closest substitute for fossil fuels when it comes to being a cheap, readily available, and reasonably priced energy source. Nuclear energy is also a low-carbon-intensive energy source that can facilitate the transition to sustainable energy use. The International Energy Agency 17 referred to this viewpoint when it claimed that the operation of nuclear reactors did not increase carbon dioxide or air pollution. According to different research, nuclear energy is low-carbon and can create electricity on a big scale with negligible carbon emissions, on par with solar and wind energy. 18 The potential of nuclear energy to cut emissions unevenly, equal to a one-third drop in transport-induced emissions globally, makes apparent the crucial role that it will play in achieving the continued aim of carbon neutrality by 2050. 18
Exploring the role of nuclear energy in decreasing emissions in developed countries is essential. Likewise, the selected 6 developed countries, namely Canada, Germany, France, the United Kingdom, the United States, and Japan, are dedicated to lowering CO2 by diversifying their energy portfolios, particularly by including renewable energy sources into their conventional energy mix. However, these countries’ CO2 per capita (see Figure 1) is higher than that of India and China.19–21 These countries contribute around 30% and 25% of total global energy consumption and CO2, respectively. 22 Furthermore, these countries rely heavily on imported and indigenous non-renewable energy supplies. Interestingly, the selected countries rely on non-renewable energy imports to meet their energy needs. For instance, Japan and Germany import over 96% and 64% of their total primary energy supply, respectively. 23 Consequently, these figures highlight the selected countries’ dilemma of dirty fuel reliance. These statistics demonstrate why, despite their economic success, these countries have faced environmental problems. A persistent disparity between energy supply and demand has existed for decades, resulting in significant social and economic losses. Moreover, the current power demand will be expected to double by 2025. As a result, these countries have difficulties relating to ecological deterioration and energy scarcity that require rapid policy remedies. Based on these interesting facts about the selected nations, there is a need to evaluate the association between nuclear energy and CO2 emissions.
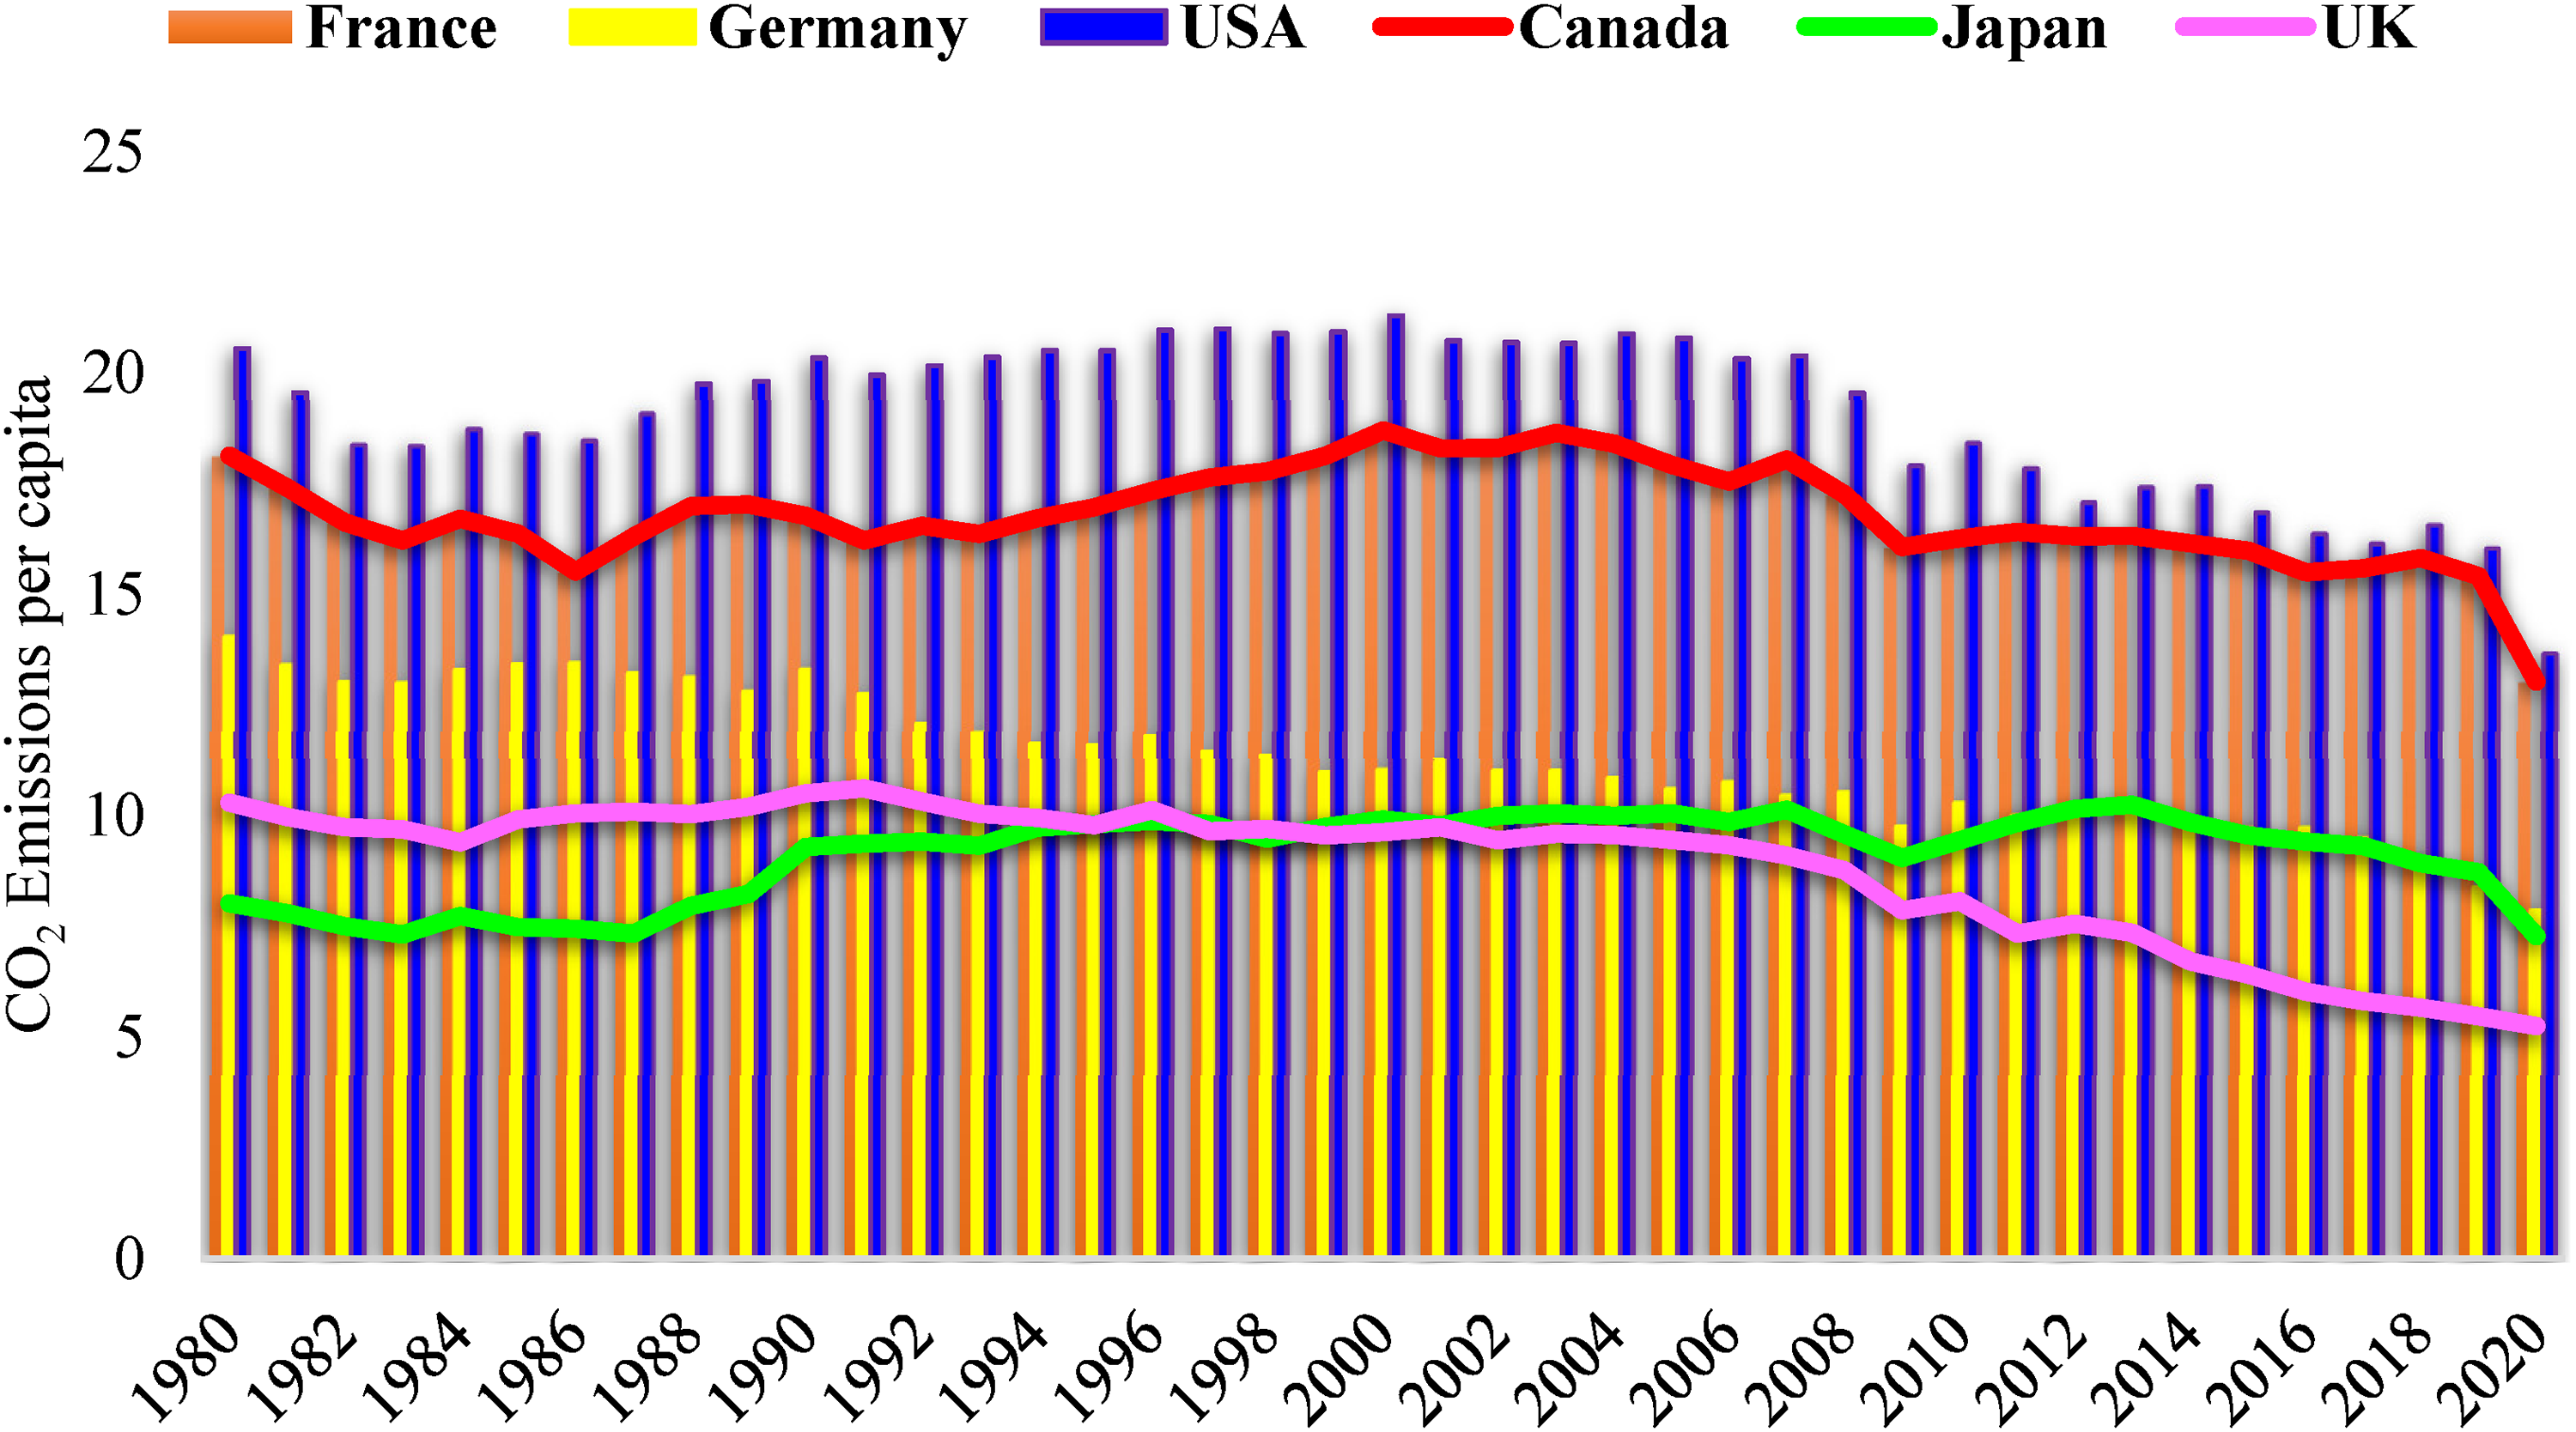
Trend of CO2 per capita between 1980 and 2020.
This study adds to the current knowledge by accounting for time fluctuations in the causal relationships between nuclear energy and CO2 in the selected countries. When the underlying series undergo structural shifts, empirical research investigating causation between two variables may produce erroneous conclusions. In the face of structural alteration, the linkages across series will demonstrate instability over distinct sub-periods. 24 We employ the Mean-F, Exp-F, and Sup-F tests initiated by Andrews 25 and Andrews & Ploberger 26 as well as the Lc test suggested by Hansen 27 and Nyblom 28 to evaluate the short-run and long-run parameter stability interconnection between CO2 and nuclear energy in the selected countries by taking structural changes into account. Furthermore, we used the BRW test to evaluate the causal linkages between nuclear and CO2. The BRW technique, which uses a fixed-size window to test for causality on rolling sub-samples, enables researchers to catch time fluctuations and structural changes in causal linkages. In this aspect, this study paper stands out from the previous research, which, in particular, only addresses full causality and, unlike this research, is vulnerable to erroneous findings and inferences in the face of uncertainty in parameters caused by the structural break(s). The results will aid environmentalists, development practitioners, and energy experts in developing and implementing ecologically friendly measures that will assure ecological sustainability. This research will be beneficial to economies by prioritizing nuclear energy investments.
The research is organized as follows: section 2 presents the information regarding nuclear power in the selected countries. A summary of prior studies and methodology is presented in Sections 3 and 4, respectively. Sections 5 and 6 illustrate the result and conclusion.
Nuclear power in the selected countries
Due to a long-standing strategy predicated on energy security, France gets around 70% of its electricity from nuclear power. The goal of government policy, established in 2014 under a previous administration, was to decrease nuclear power's contribution to energy generation to 50% by 2025. 29 This objective was pushed back from 2019 to 2035. France revealed plans to construct six nuclear reactors in 2022 and said it would explore building an additional eight. Due to its extremely cheap cost of production, France is the most significant net exporter of electricity in the world, earning over €3 billion annually. The nation has made great strides in the development of nuclear technology. Reactors, particularly fuel-related goods and services, have been major exports. 29 French power is made from nuclear fuel reprocessing to 17%. Figure 2(a) presents the Operable nuclear power capacity in France.

(a) Operable nuclear power capacity in France. (b) Operable nuclear power capacity in Germany. (c). Operable nuclear power capacity in Japan. (d) Operable nuclear power capacity in the United Kingdom. (e) Operable nuclear power capacity in the United States. (f) Operable nuclear power capacity in Canada.
Prior to March 2011, Germany used 17 nuclear reactors to generate one-fourth of its power. Germany plans to phase out nuclear energy gradually. The phase-out of nuclear energy was a component of the policies of a coalition government established following the 1998 federal elections. 29 The phase-out was abandoned in 2009 after a change of administration, but it was reinstated in 2011 in response to the Fukushima catastrophe in Japan, which resulted in the temporary shutdown of eight reactors. In Germany, there is still strong public opposition to nuclear power and hardly any support for constructing additional reactors. 29 As a result of its policy, Germany has some of the lowest wholesale power rates in all of Europe and some of the highest retail prices. The price of home power is more than half covered by taxes and fees. Figure 2(b) presents the operable nuclear power capacity in Japan.
Japan needs to import about 90% of its energy requirements. The country's first commercial nuclear power reactor began to operate in the middle of 1966, and nuclear energy has been a high national strategic priority since 1973. This was considered after the Fukushima disaster in 2011, but it has since been proven. 29 Up until 2011, Japan obtained roughly 30% of its energy from reactors; by 2017, it was anticipated that this percentage would reach at least 40%. By 2030, it is currently expected to replace at least 20% of the fleet. Since the first two reactors were revived in August and October of 2015, eight more have been done so. 29 The restart of 16 reactors is currently being authorized. Figure 2(c) presents the operable nuclear power capacity in Japan.
With a nuclear capacity of around 6.5 GW, the UK produces 15% of its power. Most of the current capacity is scheduled for retirement by the decade's end. However, the first nuclear plant of a new generation is now being built. Up to 24 GW of new nuclear capacity is required under government plans by 2050 to produce around 25% of the nation's power. 29 The UK has implemented a comprehensive evaluation procedure for new reactor designs and their location. Due to the UK's privatization of power generation and liberalization of its energy market, substantial capital investments are troublesome. 29 Figure 2(d) presents the operable nuclear power capacity in the United Kingdom.
With more than 30% of all nuclear electricity generated globally, the USA is the world's biggest nuclear power generator. In 2019, the nation's nuclear power plants generated 843 billion kWh, or 19% of all electricity production. 29 After a 30-year era in which few new reactors were constructed, it is anticipated that two more new units will go online shortly after 2020 as a consequence of 16 license applications submitted since mid-2007 for the construction of 24 new nuclear reactors. 29 The financial sustainability of certain current reactors and potential projects is in doubt due to some governments’ liberalization of wholesale electricity markets. This has made it challenging to finance capital-intensive power projects. Lower gas prices since 2009 have also contributed to this. Figure 2(e) shows the operable nuclear power capacity in the United States.
Nuclear energy generates around 15% of Canada's electricity, with 19 reactors, most of which are in Ontario, with a combined capacity of 13.6 Gwe. 29 Canada had intended to build two more new reactors during the following ten years to increase its nuclear capacity, but these plans have been postponed. 29 Canada has long been a global leader in nuclear research and technology, exporting reactor systems developed in Canada and a sizable share of the radioisotopes utilized in medical diagnosis and cancer treatment. Figure 2(f) shows the operable nuclear power capacity in Canada.
Literature review
The SDGs are inextricably intertwined. At a global level, synergies in decision-making are essential to achieve sustainability. As the sustainable development theory highlights, it is necessary to utilize resources in such a way that subsequent generations will be able to meet their demands. Since the energy sector primarily relies on fossil fuel extraction, which is constrained in quantity and diminishing owing to increased extraction to satisfy rising demand, future generations’ capacity to use this resource is endangered.20,30 As a result, resources that assure long-term viability are essential; in this sense, nuclear energy based on uranium is a viable choice.
Nuclear power plants use uranium widely disseminated across five continents, whereas fossil fuels are seen in vulnerable places that make them less susceptible to interruptions and fuel supply. Nuclear plant facilities can be built so that they are less susceptible to climate change and can assist in developing synthetic fuels for the transportation sector, significantly reducing emissions.2,31–35 Nuclear energy differs from hydrocarbon energy in two ways: first, it generates heat without emitting greenhouse gases, and second, it keeps dangerous materials inside the fuel throughout nuclear fusion, decreasing its total footprint. Moreover, nuclear plant emissions are caused by the use of fossil fuels during their life cycle, which can be decreased by substituting non-emitting fuels. 36 It is also known that nuclear plant emissions are comparable to renewable energy sources over their whole life cycle, which implies that it is a source aiding in decarbonization and minimizes the influence of other energy sectors on human health.
Moreover, it can help with medicinal and industrial uses in addition to reducing emissions. Nuclear medicine is helping a rising number of individuals, with around 30 million people, who have benefited each year. Moreover, nuclear power averted 1.8 million emission-linked fatalities worldwide from 1971 to 2009. 37 Nuclear energy preserves food by subjecting it to gamma rays, which extend its shelf life and destroy microorganisms. It also aids in the conservation and management of water resources as well as the discovery of new sources and water desalination. Nuclear fuel has a higher energy density than other fuels and a more negligible ecological impact. Therefore, nuclear plants consume less area and have fewer resource requirements than other sources, which results in minor global damage to biodiversity. 14
Nuclear power plants produce highly radioactive waste that must be shielded appropriately and disposed of because it is highly hazardous. All energy industries create toxic waste, which, if not properly managed, can pollute the environment; hence management is essential. Nuclear waste is produced in tiny quantities, is carefully controlled and disposed of, is not distributed in the ecosystem, and is recyclable. Nuclear power stations can impact the aquatic ecosystem and cause water scarcity since they require water for cooling and 66% of that water is sent directly into the environment as heat. 38 On the other hand, ecosystem stress can be alleviated via proper planting that decreases aquatic and water species stress. Nuclear power facilities with cogeneration have higher thermal efficiency and less environmental impact. In addition, while the fatality rate connected with nuclear energy is modest compared to other conventional sources, there is high displacement.
Studies examining the relationship between NUC and CO2 can be divided into two categories based on their findings. Numerous researches has looked at whether or not using nuclear energy reduces emissions. For instance, using Granger causality and dataset from 1960 to 2007, Menyah & Wolde-Rufael 39 examined the NUC-emissions nexus in the USA. The findings revealed that while NUC can assist in curbing CO2, renewable energy usage has yet to reach a point where it can significantly contribute to reducing emissions. Similarly, Saidi & Omri 40 studied the OECD countries and reported that the reduction in CO2 was caused by a surge in NUC between 1990 and 2018 using VECM and FMOLS approaches. Likewise, Dong et al. 41 study the connection between NUC and CO2 using data from 1993 to 2016 in China and reported that the utilization of nuclear energy triggers the reduction in China's emissions level. The study research of Hassan et al. 42 using CUP-BC and CUP-FM in the BRICS economies between 1993 and 2017 reported that the fall in BRICS countries’ emissions levels is due to an increase in consumption of nuclear energy. Nathaniel et al. 43 study on the role of NUC towards carbon neutrality in G7 countries reported that NUC curbs CO2. Recently, a Danish et al. 44 study in OECD countries reported that NUC contributes to the quality of the environment.
The second strand of studies reported an insignificant interrelationship between nuclear energy and CO2. For instance, from 1990 to 2013, Saidi & Ben Mbarek 30 study reported positive but insignificant emissions-nuclear energy connections using advanced countries. Likewise, an insignificant association between NUC and CO2 surfaced in the study of Jin & Kim 45 for selected 30 countries utilizing a dataset from 1990 to 2014. The third strand of literature reported positive nuclear energy-emissions nexus. For instance, using South Africa and a dataset from 1971–2017, Sarkodie & Adams 46 examine the nexus between CO2 and nuclear energy using ARDL. The findings disclosed that environmental deterioration is worsened by the consumption of nuclear energy in South Africa. Likewise, Syed et al. 47 study on the influence of NUC on pollution in India using the NARDL from 1975 to 2018 reported that a positive (negative) shift in nuclear energy increased (decreased) pollution in India. Majeed et al. 48 research in Pakistan using data between 1974 and 2019 disclosed insignificant nuclear energy-emissions connections.
Based on the summarized studies above, it is evident that several studies have been conducted on the association between CO2 and nuclear energy. Nevertheless, their results are mixed based on the techniques deployed, countries in focus, and timeframe. Moreover, most of these studies are premised on using conventional techniques such as Granger causality, VECM, Toda Yamamoto (TY) causality, autoregressive distributed lag, and ordinary least squares. Therefore, this study fills the gap in the literature by deploying a sophisticated technique known as the BRW approach. Unlike conventional causality tests, this test for causality on rolling sub-samples enables researchers to catch time fluctuations and structural changes in causal linkages. In this aspect, this study stands out from the previous research, which, in particular, only addresses full-sample causality.
Methodology and data
Econometric model
In this study, we use Granger causality tests to determine the causal link between CO2 and NUC using a bivariate VAR model. The Wald statistics and Likelihood ratio are the test statistics utilized in the current paper on Granger causality tests. When the sample size is small, traditional causality tests in VARs have the drawback of being non-asymptotic. As a result, as an improved Granger causality test, Toda & Yamamoto 49 is employed, which can yield valid asymptotic critical values for any order of integration, whether cointegrated or non-cointegrated.
We employ bootstrapping Granger (BG) causality tests, which are resilient to pre-testing prejudice and small sample size, to solve sample size difficulties. Moreover, Balcilar et al.
24
proposed the residual-based bootstrap (RB) approach, which is applied in this empirical analysis. The RB technique delivers a strong CV when Granger causality is tested.24,50 As a result, we use the Toda and Yamamoto adjusted edition Granger causality test to perform the bootstrap approach. We employ PP and ADF tests to check unit roots’ existence. To check for unit root, we follow the specification in Equation 1:

We must consider the model's instability or stability characteristics to acquire trustworthy findings. Therefore, parameter constancy was utilized to verify this. In the sub-sample period, evidence of causality may surface, whether bidirectional or unidirectional. Stability tests on the VAR were conducted to see whether structural fractures had happened or if the predicted coefficients were consistent throughout our period. The Sup-F, Mean-F, Nyblom-Hansen Lc, and Exp-F tests assess structural shift and parameter instability. Suppose any of the stability tests reveal the existence of nonstable parameters. In that case, it is feasible to determine when and where the instability happened and if any plausible phenomena triggered it. This is accomplished by combining granger causality with rolling regression tests. The rolling estimation approach generates many similar parameter estimations for the system to be stable. Suppose the parameter estimates of a time series change significantly from those of others, i.e., strong volatility. In that case, the model is considered unstable, and the estimated outcomes will be incorrect. Consequently, we use RWG causality tests to identify structural shifts, which may provide varied causality findings across rolling data subsamples. The following VAR bivariate model is considered:


The reason for utilizing this approach rather than a conventional Granger causality test is that typical granger causality tests assume parameters remain constant across time, leading to an inaccurate conclusion. We can analyze structural break(s) in the model using RWG causality tests relying on the bootstrap approach. The causality between variables can be identified as it evolve over time utilizing rolling estimation, and we can identify structural changes and causal relationships for rolling various subsamples.
Data
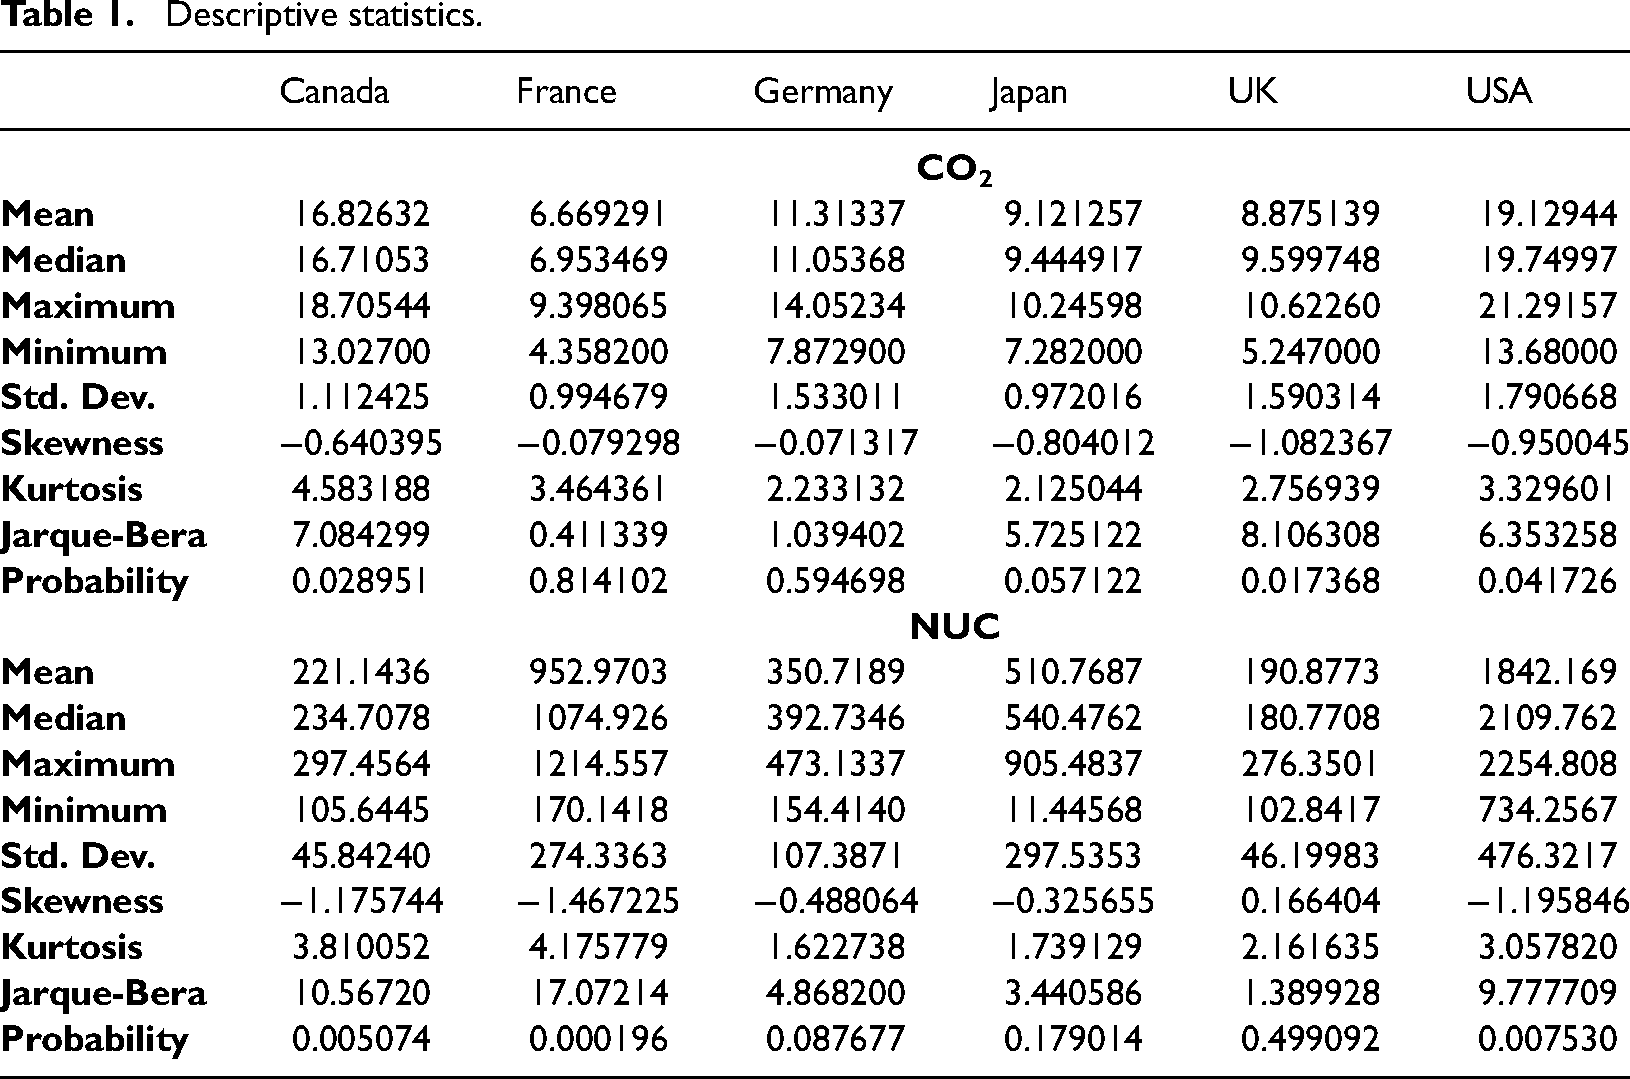
We utilize yearly data to examine the causality between NUC and CO2 for the period from 1980 to 2020 (41 observations) in the selected 6 developed countries. The dataset for NUC was assembled from the British Petroleum 52 database and measured in exajoules. In contrast, the dataset for CO2 is measured as metric tonnes per Capita and obtained from the BP 52 database. The natural log of the variables used is taken in this empirical investigation. Table 1 presents the variables’ statistics.
Descriptive statistics.
Stationarity test without break outcomes.

Note: *P < 10% and **P < 5%.
Discussion
Pre-estimation outcomes
Before the main analysis, it is crucial to identify the integration order of NUC and CO2 in each country. As a result, we employ PP and ADF tests to check for the existence of unit roots. Table 2 presents the ADF and PP for each country and Table 3 presents the ZA results
Stationarity test with break outcomes.

Note: *P < 10% and **P < 5%.
At level, NUC and CO2 are non-stationary; however, after differencing, both NUC and CO2 are stationary in each country. Furthermore, we used the 53 test to catch the stationarity feature of the variables in the presence of a single break. Table 3 presents the ZA results with results confirming stationarity at the first difference. We employ VAR to test the causal interrelationship between NUC and CO2.
Full sample Granger causality outcomes
We undertake a full sample Granger causality test in each country after confirming that our series are I(1). Instead of utilizing a VECM, we utilize the bivariate VAR to evaluate causality. For the period 1988 to 2020, a full sample Granger (FSG) causality test is developed using the Wald test statistics and bootstrap Likelihood ratio. The FSG test results are exemplified in Tables 4 and 5.
Full sample Granger causality tests outcomes.

Notes: *P < 10% and ***P < 1%. Causality tests are based on a VAR model, with the length of lag determined by SIC. H0 hypothesis is "no existence of causal interrelationship.
Results of short-run and long-run parameter stability tests.

Notes: 10,000 bootstrap repetitions are used to calculate P-value. *P < 10%, ** < 5% and ***P < 1%.
For France and UK, the outcomes reveal that NUC Granger causes CO2, while in Germany, CO2 Granger causes NUC. No causality exists between CO2 and NUC for the USA, Japan, and Canada.
Parameter stability tests outcomes
Furthermore, validating the reliability of our full sample causality outcomes requires analyzing the temporal coefficient stability of our computed VAR model. We argue that our FSG causality conclusions are legitimate if the parameter estimates are consistent across the whole sample period. On the other hand, if parameter estimates are discovered to be temporally unstable, resulting in erroneous full sample Granger causality conclusions, further analysis of the times in the sample when instability emerges is required. Changes in parameters may result from structural breaks and the trend of causal interrelationships may change. 24 Consequently, various research using different sample periods may provide contradictory causation outcomes. As a result, we must test for parameter stability and the likely reasons for such parameter changes. We used mean-F, Exp-F, and Sup-F tests to verify the parameter stability in the short-term. The mean-F, Exp-F, and Sup-F tests liken the H0 hypothesis to “parameter stable” against the Ha hypothesis “parameter instability.” The Sup-F test ascertains if a swift regime shift happened, while the Mean-F and Exp-F tests evaluate if the models stayed constant over time.51,54
Since the parameters of investigation are I(1) variables, we perform Nyblom 28 and Hansen 27 Lc tests for the parameter stability of all the system parameters. To ascertain whether or not equations are cointegrated, we used these tests. These stability tests benefit from not requiring previous knowledge of the structural break's timing. Outcomes of the stability parameter reveal structural fractures in our sample for each country, meaning that our model is unstable (See Table 4). Moreover, with the exemption of the United Kingdom, Nyblom and Hansen Lc tests dismissed the H0 of “parameter stability for the system” for France, Canada, Japan, the United States, and Germany. Thus, structural breaks evidence surfaced, and the model displays joint instability for France, Canada, Japan, the USA, and Germany with the exemption of the United Kingdom, which exhibit joint stability. Each country's Mean-F, Sup-F, and Exp-F tests reveal some model uncertainty. The H0 hypothesis is dismissed at a 1% significance level in the Mean-F, Exp-F, and Sup-F test statistics that indicate parameter uncertainty in each country's NUC equation and CO2 equation. Based on the outcomes of the stability tests, we can deduce that each country model has parameters instability across the period, which means that the findings of the full sample cannot be trusted and are thus unacceptable.
Bootstrap Rowling window outcomes
The time-varying pattern of the causal relationships between CO2 and NUC is explored using the bootstrap-based TY Granger causality test in a rolling window estimate paradigm, centered on the parameter stability test outcomes. The adoption of the rolling window regression approach is justified for two reasons. Firstly, the rolling window estimation permits the connection between variables to change over time. Secondly, the RWG causality method considers the possibility of structural discontinuities and regime changes in the causal interrelationship between NUC and CO2. The VAR model lag length is set utilizing the AIC in each stage of the rolling window estimation. The causality test is conducted utilizing the bootstrap technique on each sub-sample. The window size, which defines the number of observations handled in each subsample and the overall number of rolling estimates, is an imperative decision parameter in rolling estimation.
More crucially, the window size affects the subsample estimates’ representativeness and accuracy. Moreover, larger window sizes offer more exact estimates, but they may lower representativeness, mainly when heterogeneity exists. On the flip side, a small window size minimizes heterogeneity and enhances parameter representativeness, but it may also raise the SE of estimates that lowers parameter precision. As a consequence, the size of the window should be adjusted to strike a compromise between representativeness and accuracy. There is no rigorous requirement for setting the size of the window in the estimation of the rolling window. Moreover, Pesaran & Timmermann 55 utilized Monte Carlo simulations to disclose that the break size and persistence determine the ideal size of the window. Furthermore, they suggested that when there are numerous interruptions, the minimum window size should be 20. This window size does not include the lag observations. Therefore, it is the actual amount of VAR model observations. Considering that the small size of the window may result in imprecise estimates, each sub-sample estimation is subjected to bootstrap procedures to achieve more accurate parameter estimates and tests.
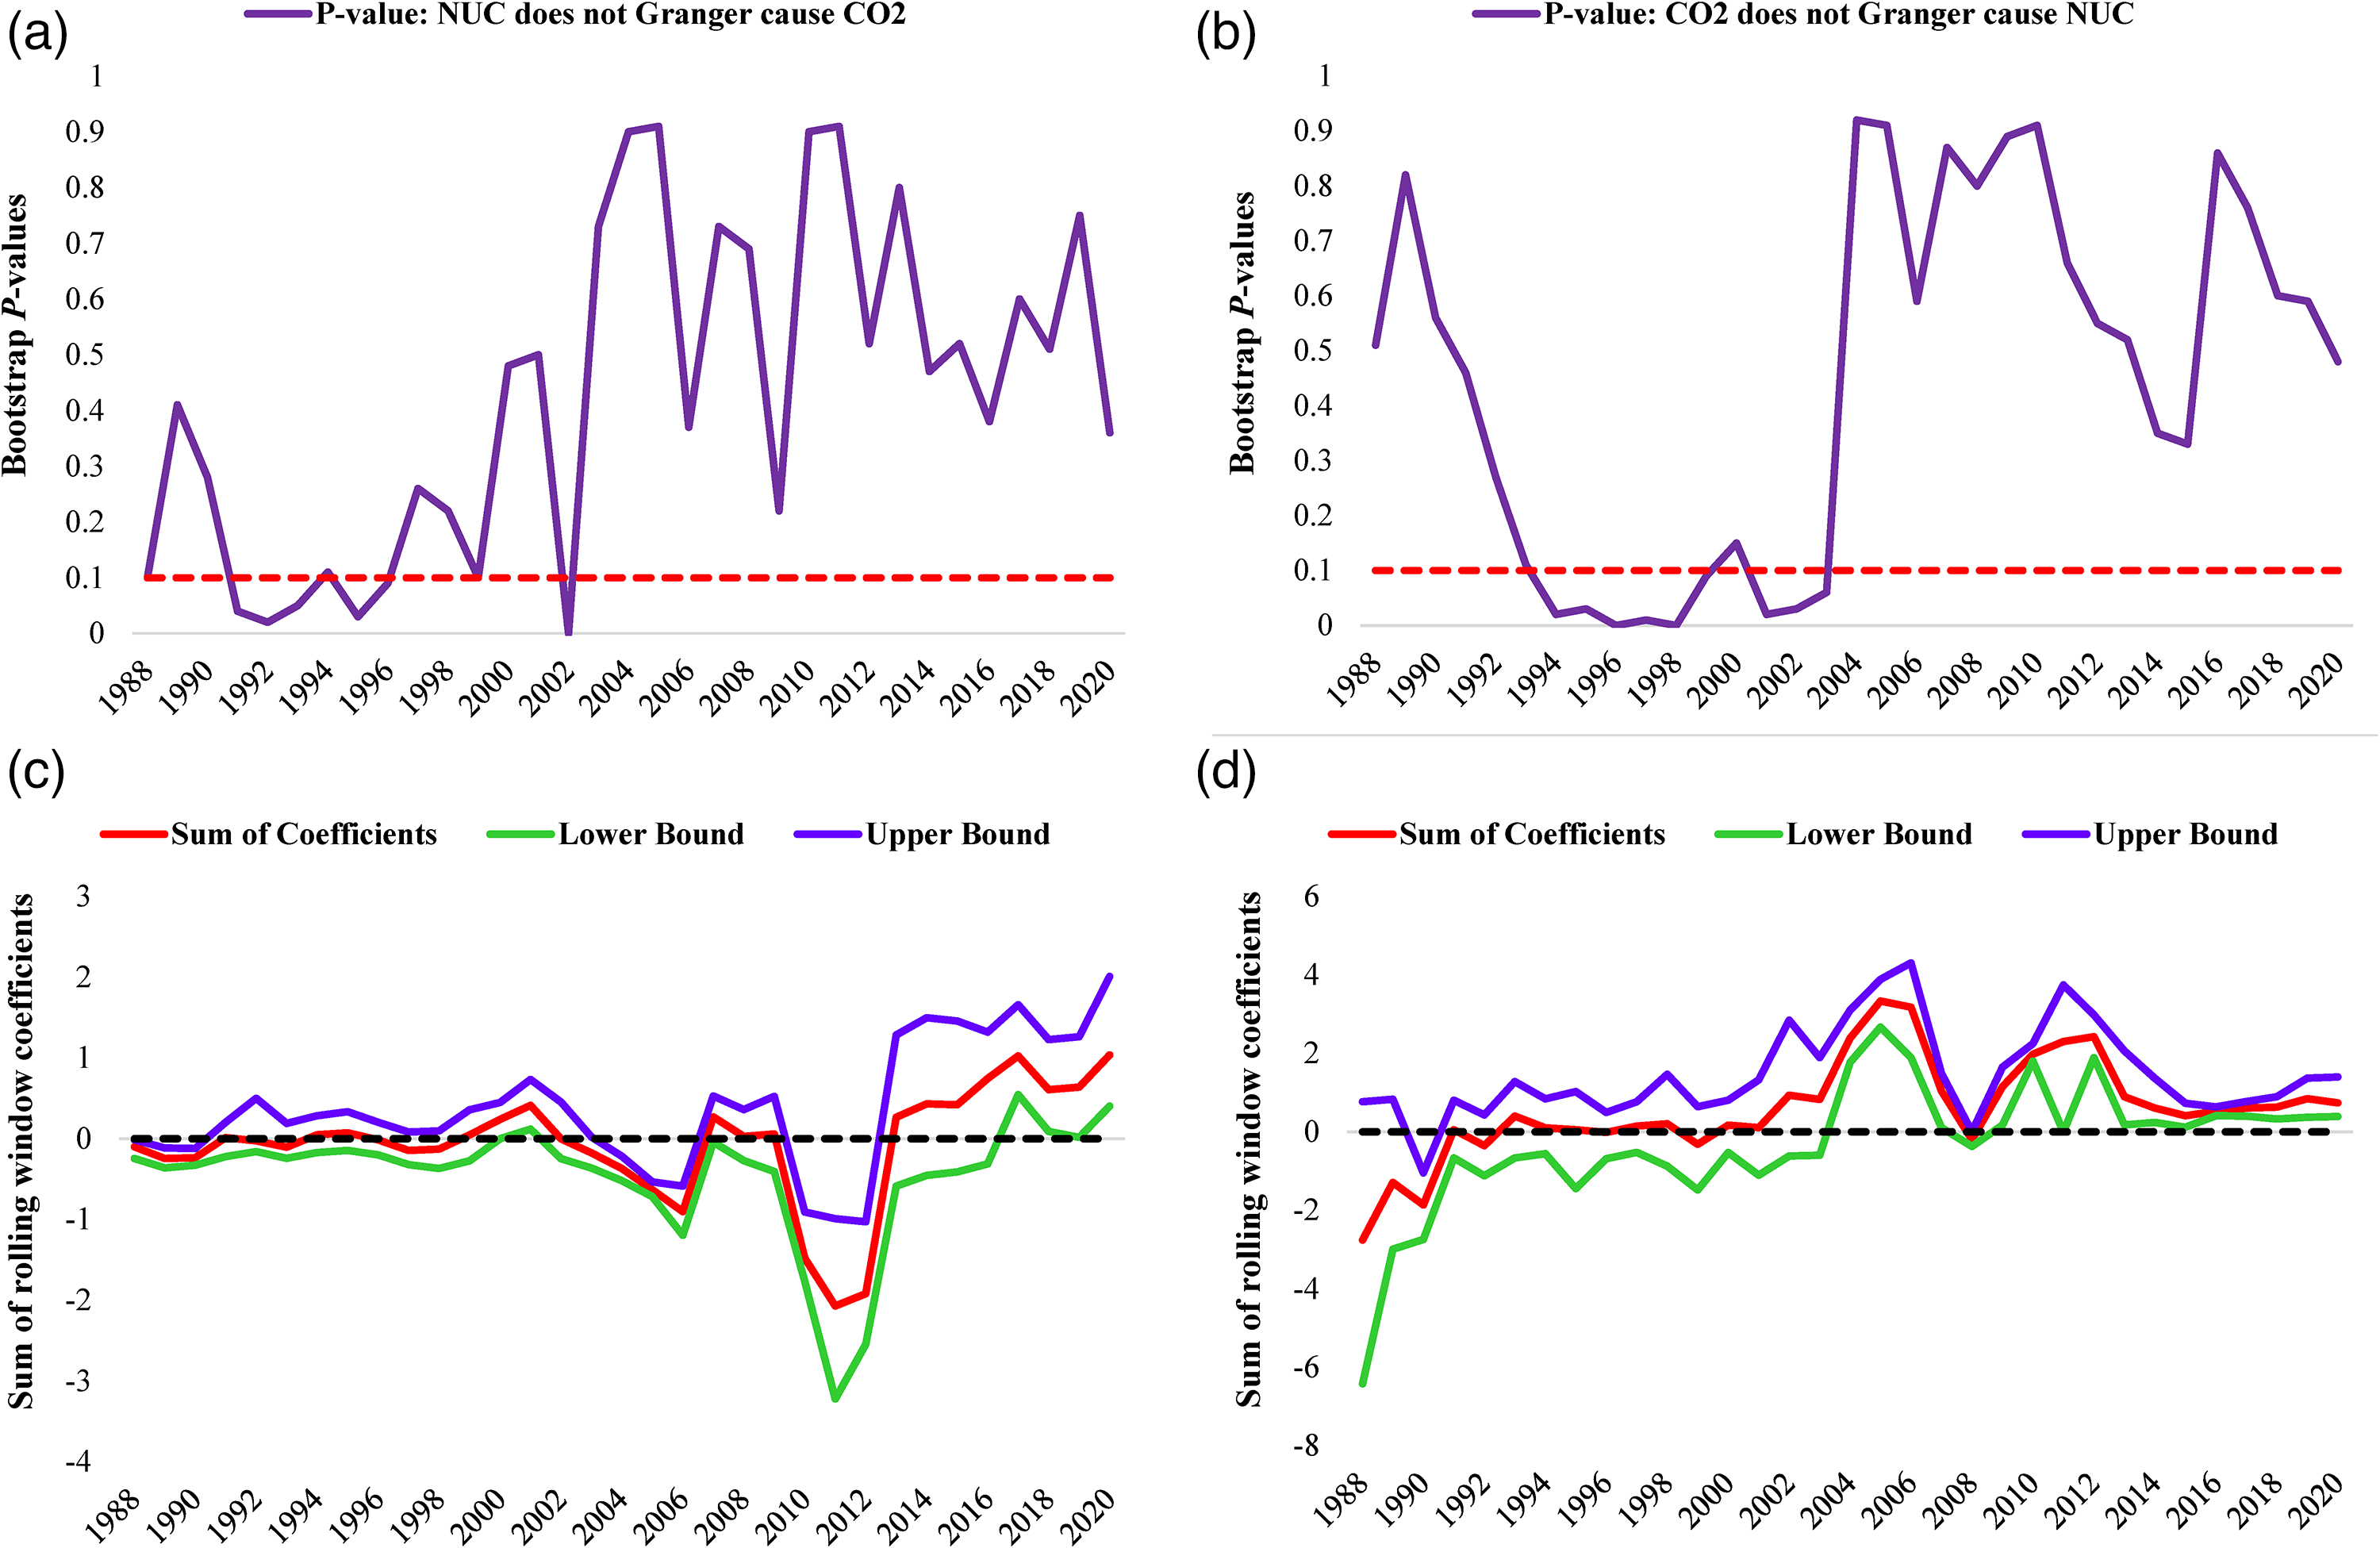
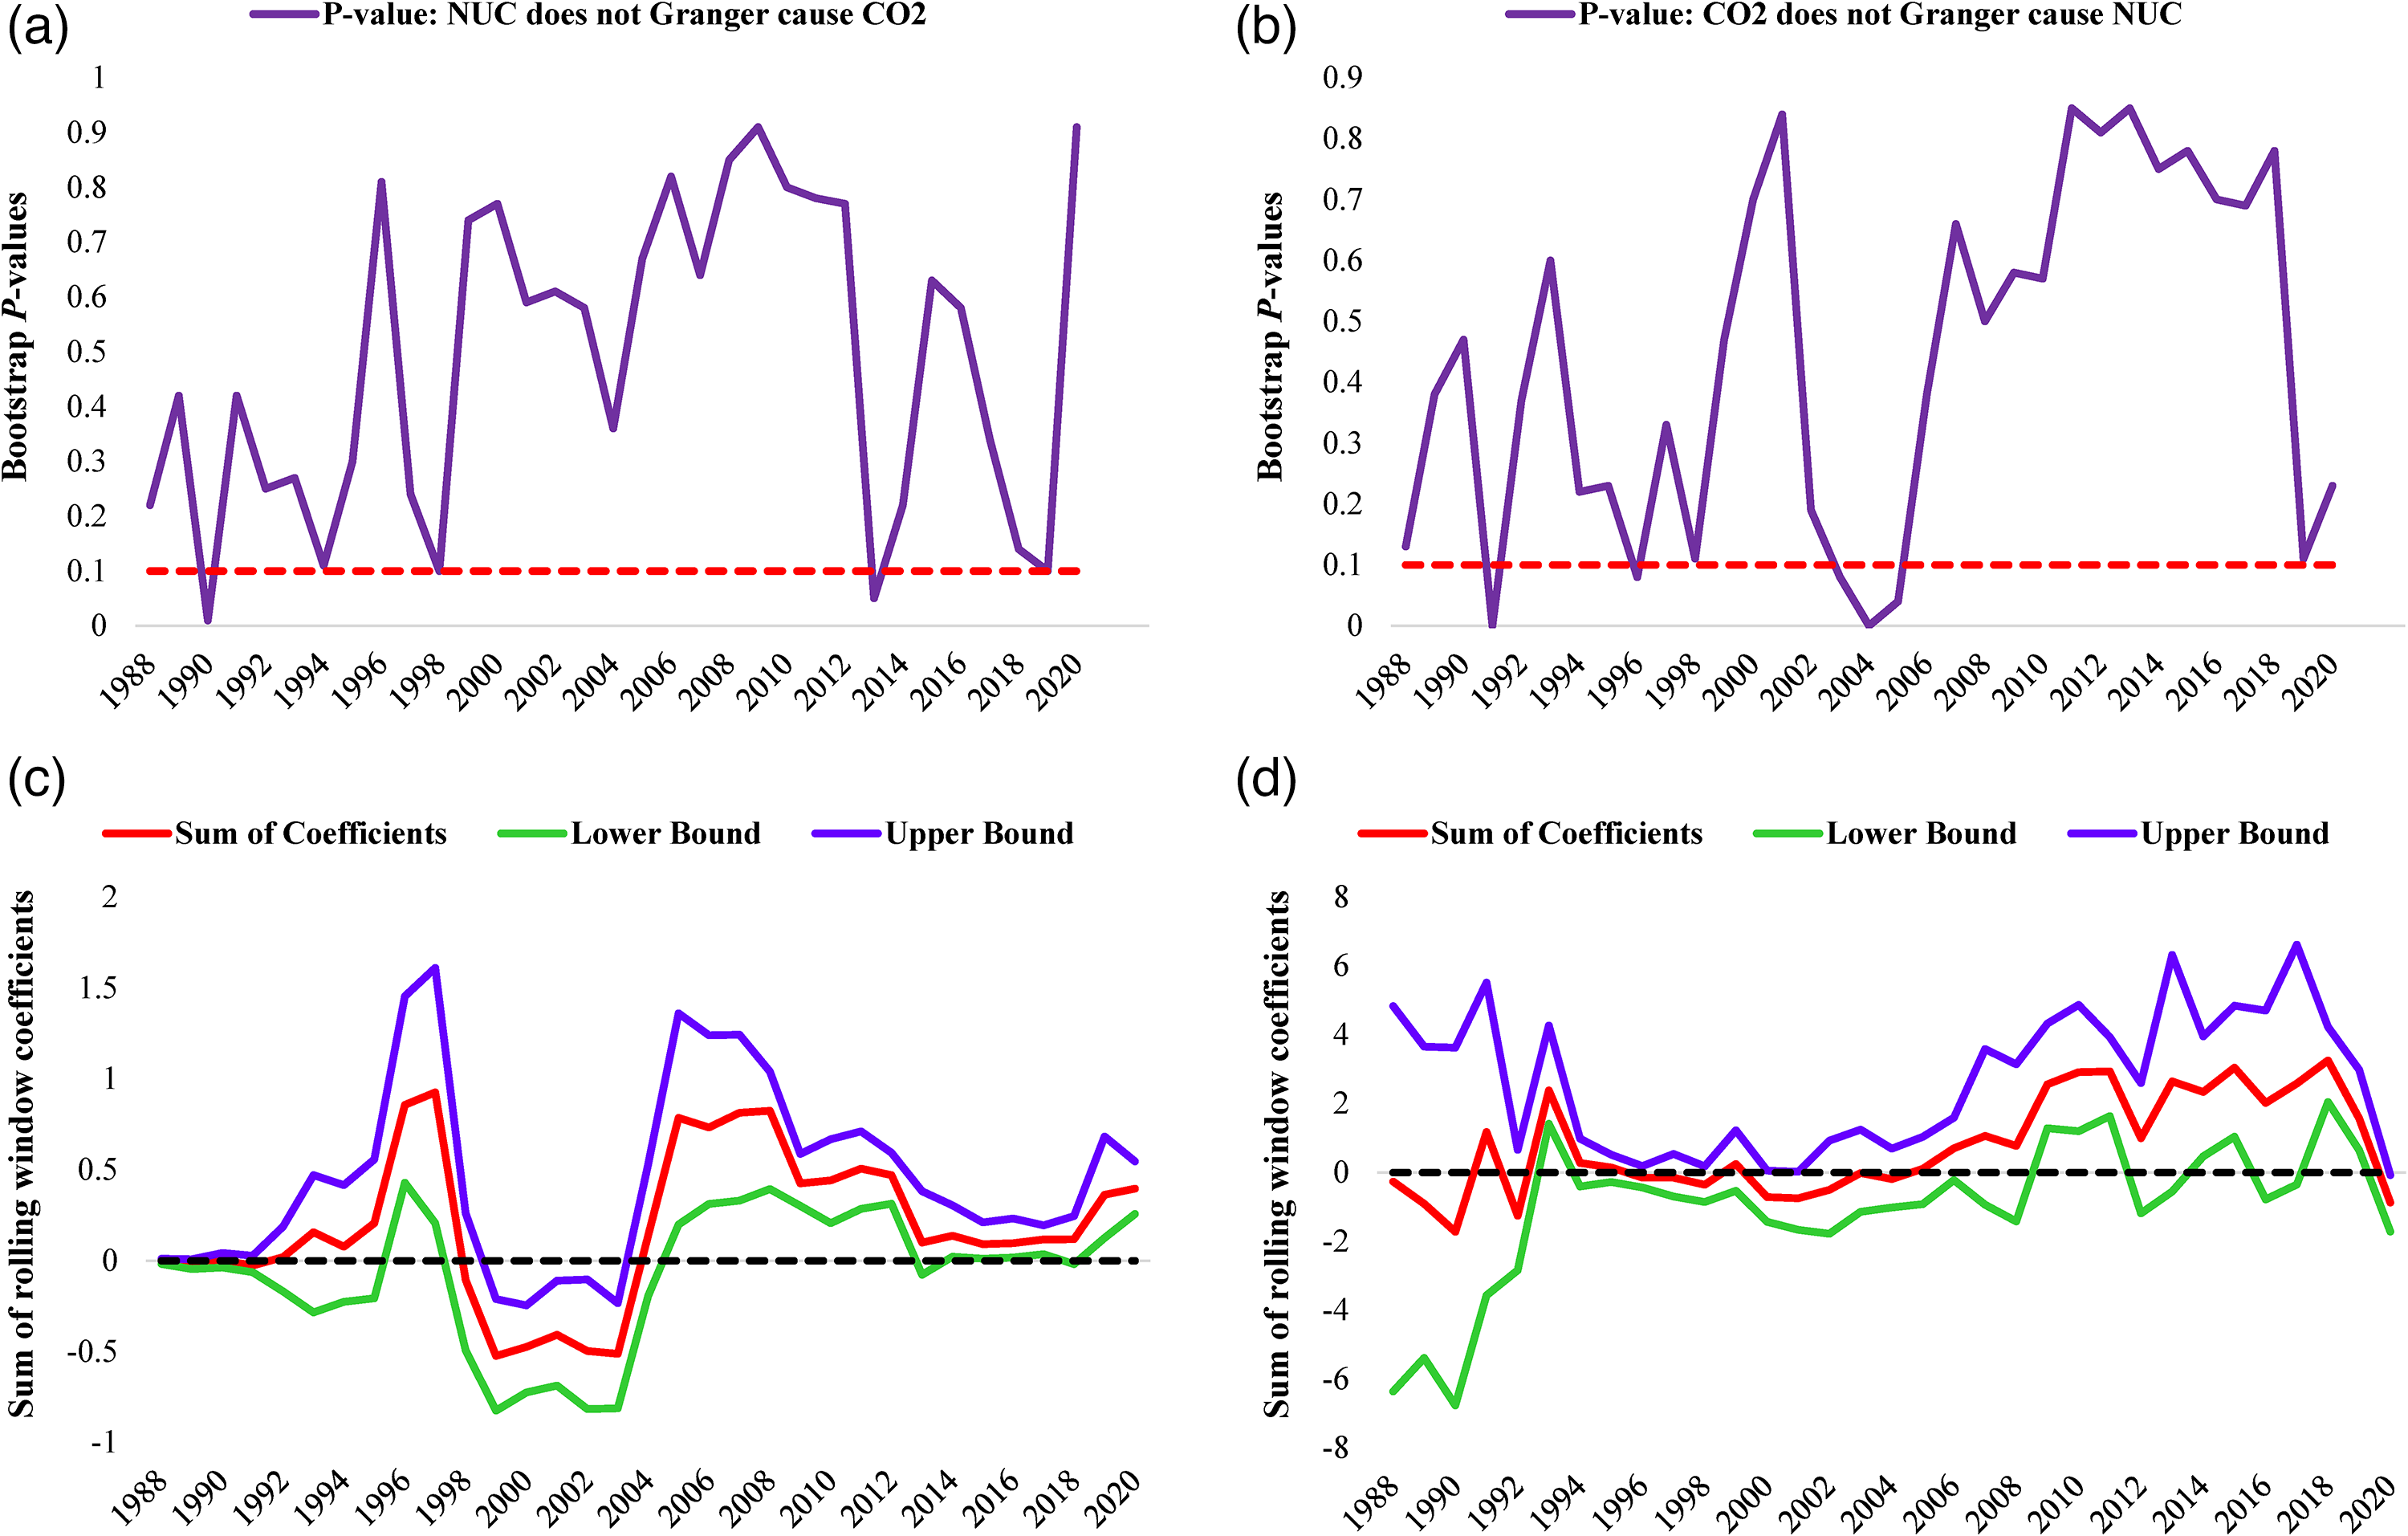
For each of the selected countries, Figures 3–8 show the p-values of the bootstrap rolling causality test statistics and the cumulative extent of the influence of one series on another. The null hypothesis of “no causal association” between the NUC and CO2 cannot be discarded at the 10% significance level when the purple lines, which indicate estimated p-values, are above the horizontal line (red line), indicating the significance level of 10%. Panels c and d show the sum of the rolling bootstrap estimates coefficients that measure the influence of NUC on CO2 and vice versa.

Rolling window estimates for Canada.
Rolling window estimates for France.
Rolling window estimates for Germany.
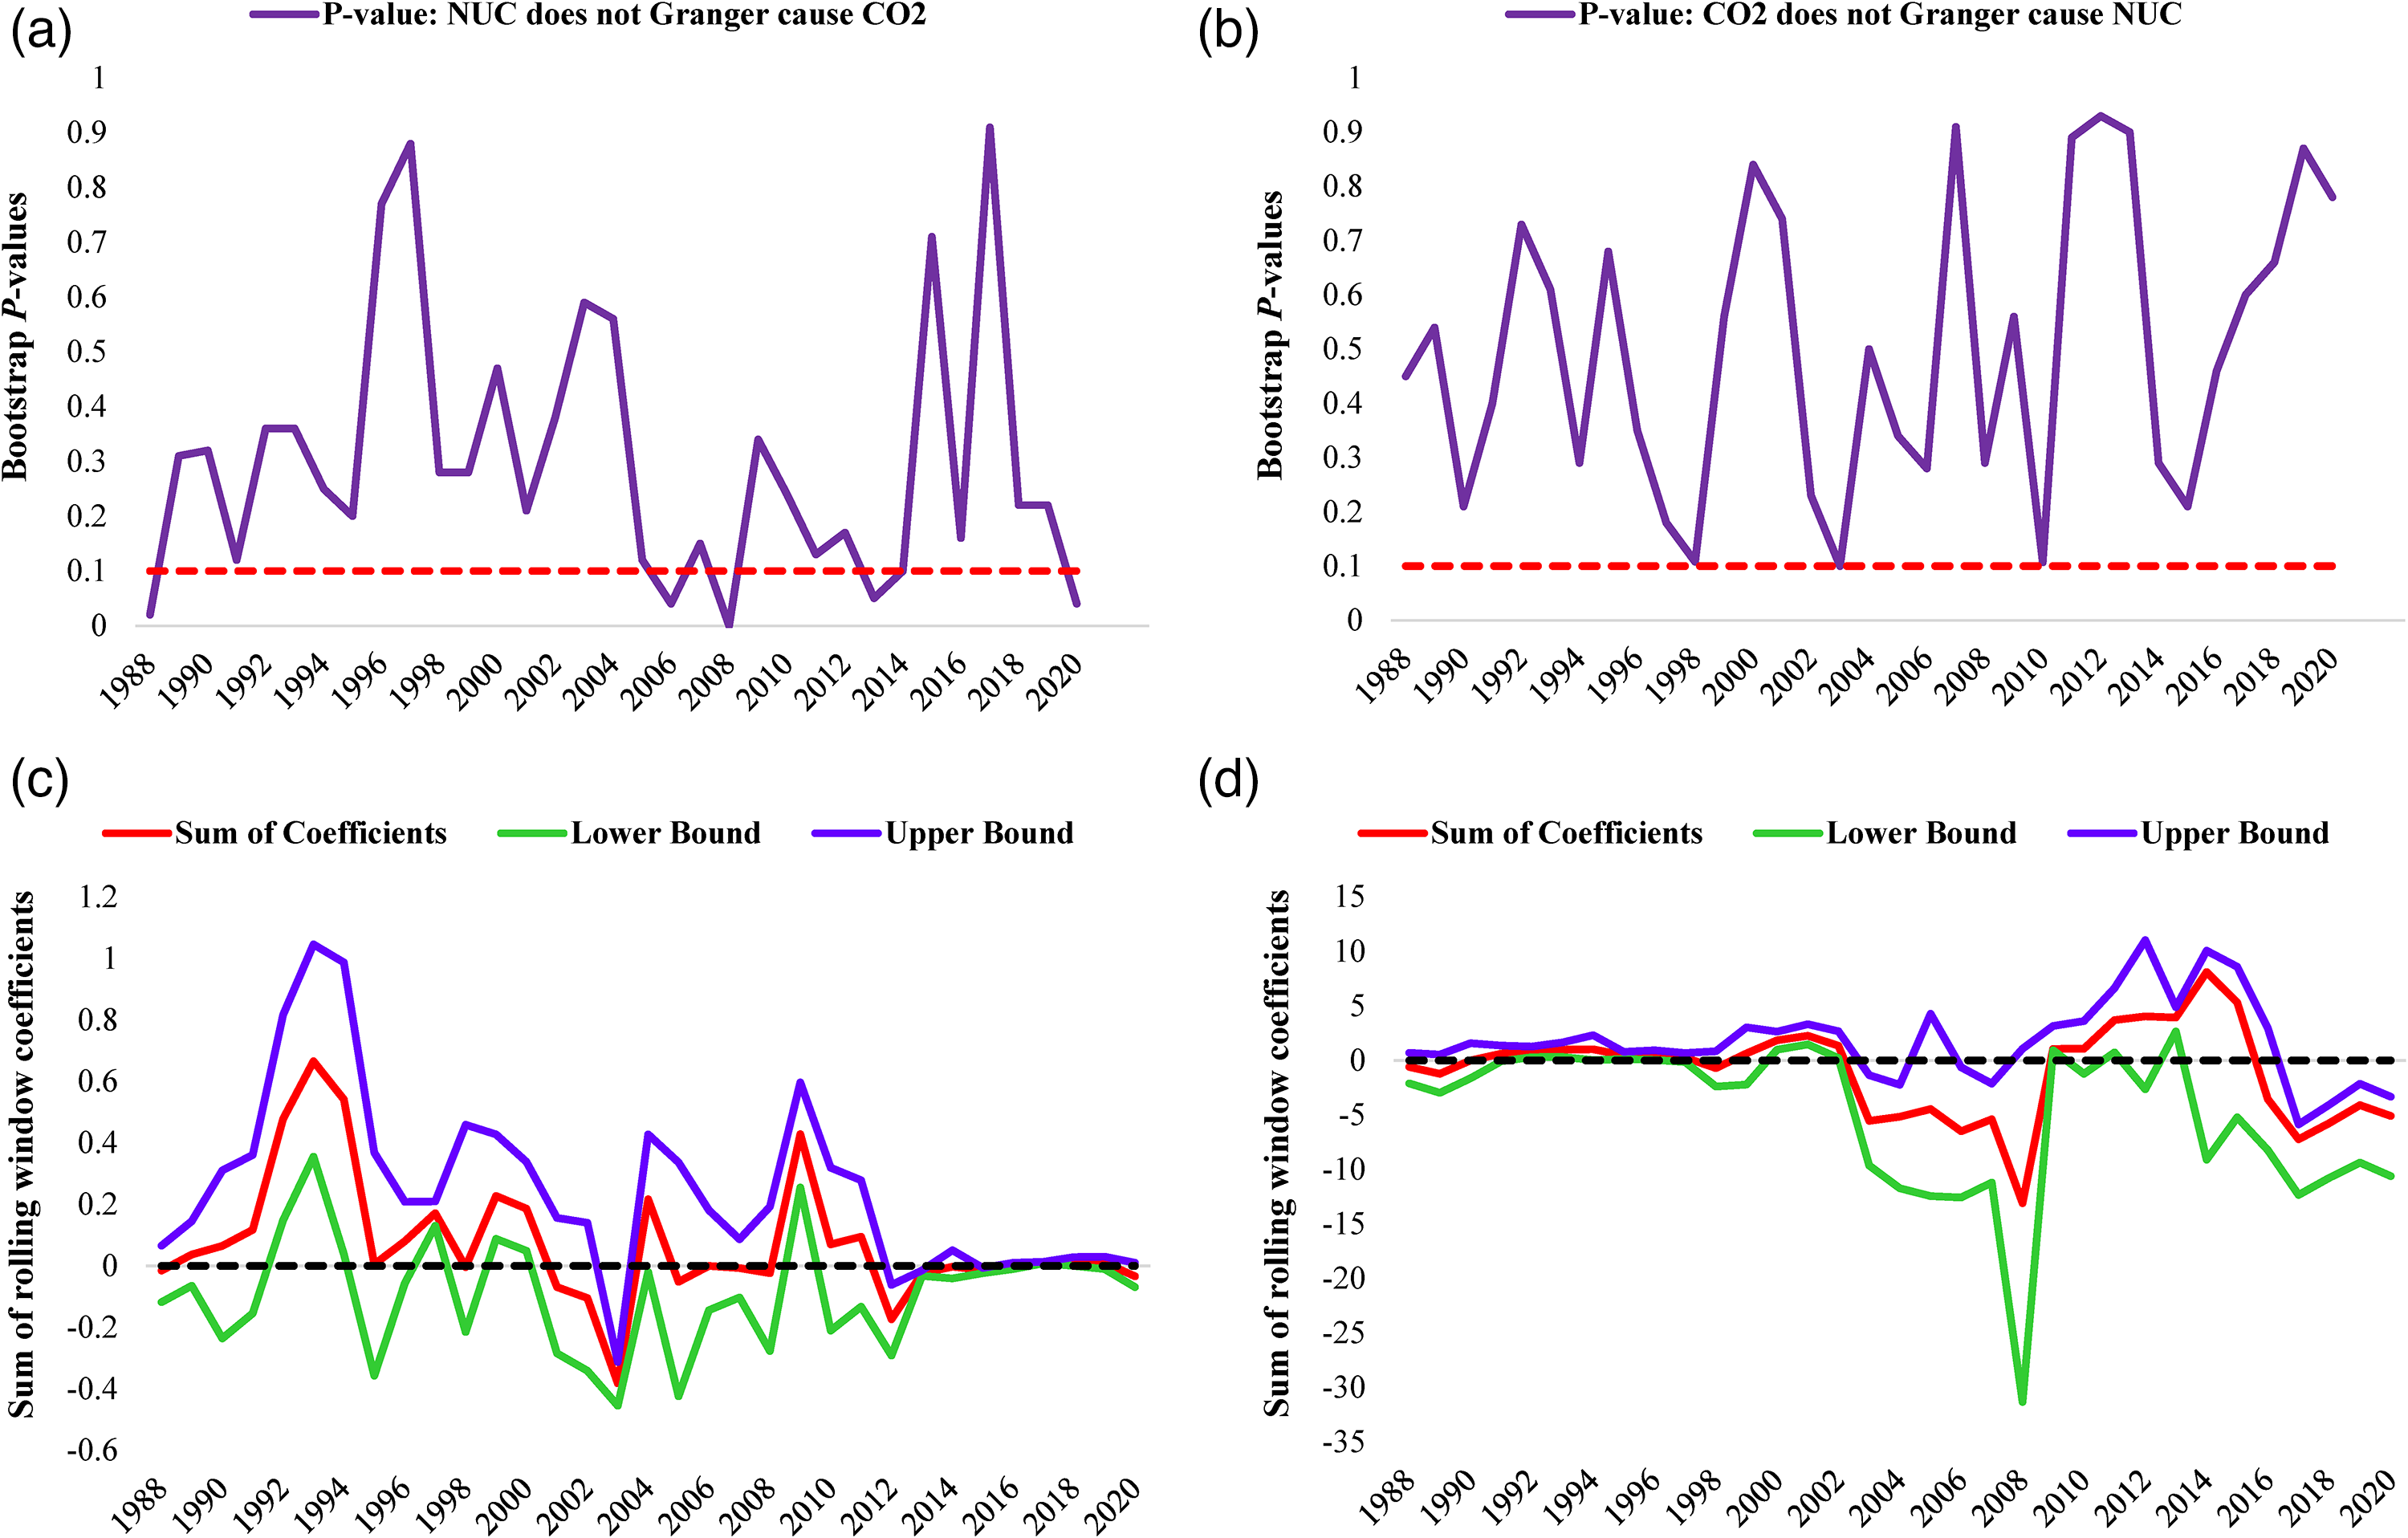
Rolling window estimates for Japan.
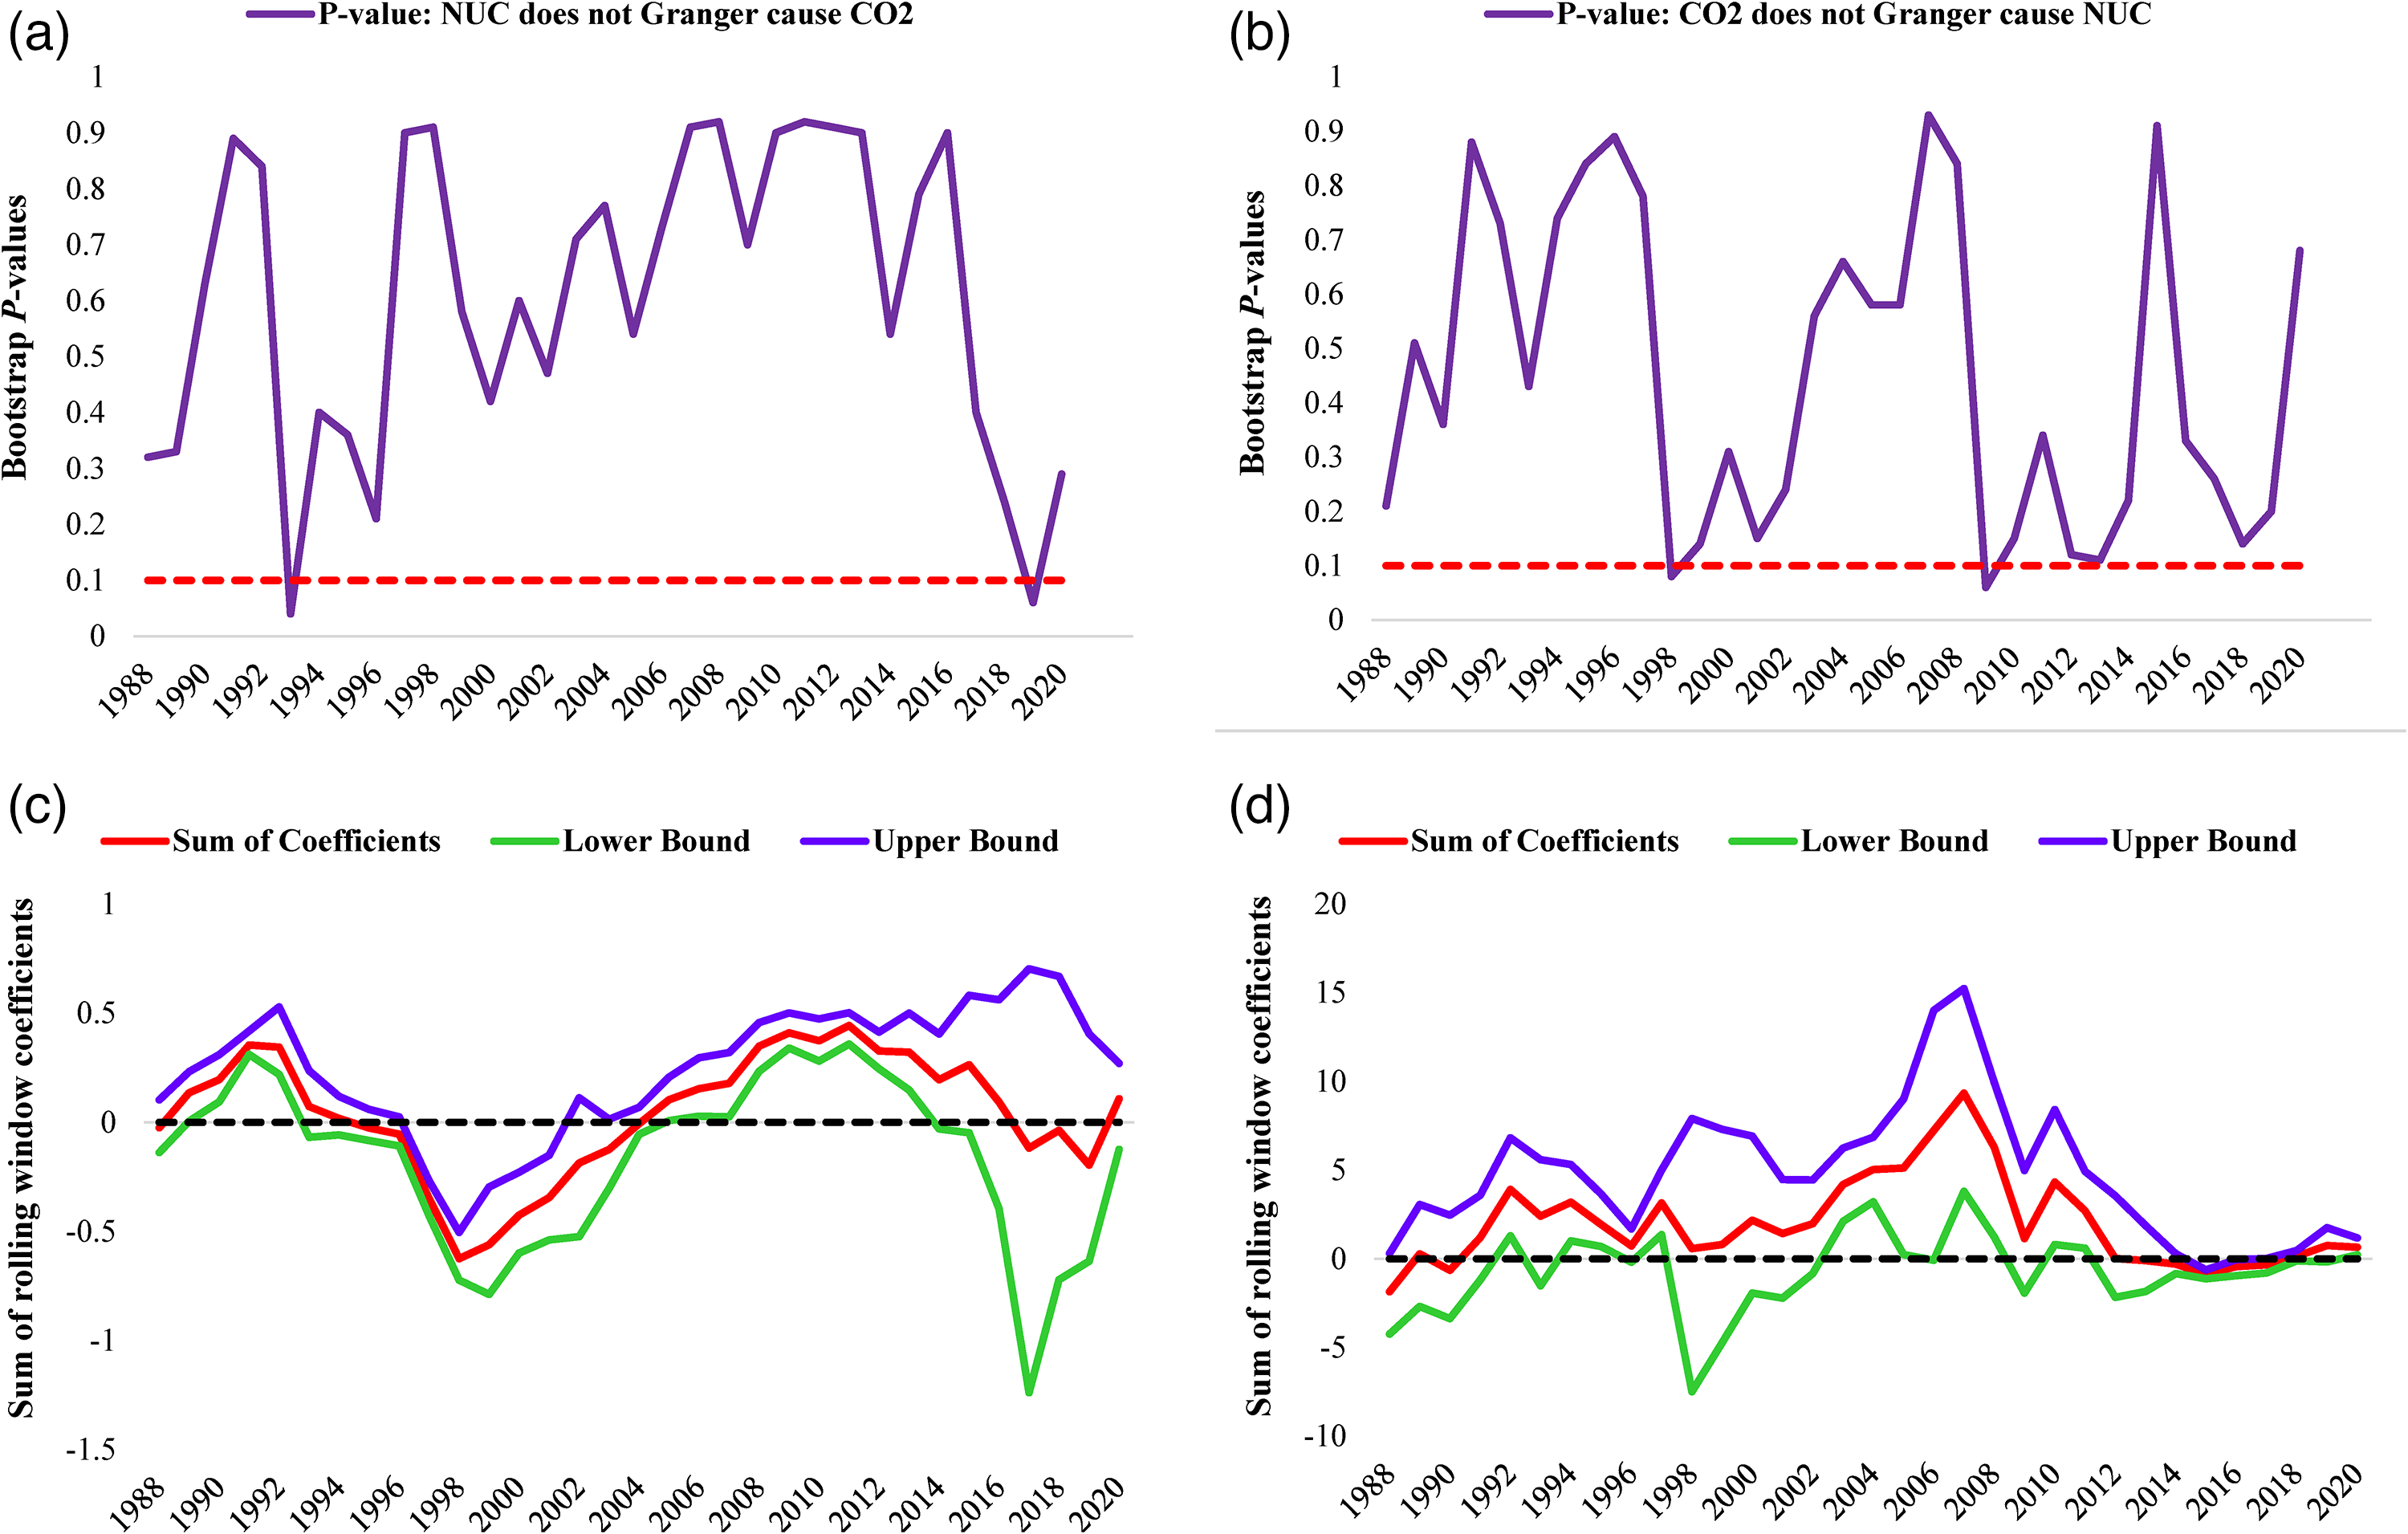
Rolling window estimates for the UK.

Rolling window estimates for the USA.
Figure 3 presents the bootstrap rolling causality test outcomes for Canada. Throughout the research period, it can be observed that the causal association between NUC and CO2 is relatively weak. The Ho hypothesis of “no causality from NUC to CO2” is dismissed at a significance level of 10% (Figure 3 panel a) in the sub-periods from 1988 to 1991, 2009 to 2014, and 2020. Moreover,Figure 3 panel c discloses negative and significant causality from NUC to CO2 only in the sub-periods from 1988 to 1991 and from 2009 to 2014, which implies that NUC plays a crucial role in mitigating emissions. Furthermore, the H0 hypothesis of “no causality from CO2 to NUC (Figure 3 panel b) is dismissed at a significant level of 10% from sub-sample periods from 2002 to 2003 and 2017 to 2018. In addition, panel d discloses negative and significant causality from CO2 to NUC emissions only in the sub-periods from 2002 to 2003 and from 2017 to 2018 (see Figure 3 panel c). These results are not surprising given that Canada ranks sixth among countries regarding nuclear power generation. Nuclear energy produces no greenhouse gas emissions during its operation. Thanks to Canada's enormous uranium supply, it is easily extensible and does not take up nearly as much space as wind farms, solar arrays, or hydroelectric power. Canada expects nuclear power to be a key component of its clean-energy mix, which will help to reduce carbon emissions drastically. Nuclear power generates around 15% of Canada's electricity 1 . Canada is a global leader in nuclear protection and energy. Its home market for the safe and responsible development of small modular reactor (SMR) technology is one of the most attractive globally. SMRs can generate significant economic advantages for Canada's economy while also assisting in the country's efforts to attain net-zero greenhouse gas emissions by 2050.
Figure 4 presents bootstrap rolling causality test outcomes for France. Panels a and b in Figure 3 also disclose a comparatively significant causality between CO2 and NUC. The Ho hypothesis of ”no causality is dismissed from 1992–1993 and 2002. Moreover,Figure 4 panel c discloses negative and significant causality from NUC to CO2 only in the sub-periods from 1992–1993 and 2002. This demonstrates that NUC lessens CO2 in the sub-sample periods. Furthermore, the Ho hypothesis of “no causality from CO2 to NUC (Figure 4 panel d) is dismissed at a significant level of 10% from sub-sample periods from 1994–2000 and 2002–2004. Moreover, panel d discloses positive and significant causality from CO2 to NUC emissions only in the sub-periods from 1994–2000 and 2002–2004. These outcomes affirmed the feedback hypothesis between CO2 and NUC. The negative effect of nuclear energy on emissions is not surprising, given that France generates roughly 70% of its electricity from nuclear energy due to its long-standing measure centered on energy security. France boasts the globe's largest nuclear power plant in terms of population. Indeed, as per 2019 data, nuclear energy provides 72% of electricity, renewable energy provides 20%, and fossil fuels provide 8%. Nuclear energy allows France to be 50% energy self-sufficient while still enabling it to profit via the export of electricity. The Nuclear Power Development Strategy is linked to the Multiyear Energy Plan's aims (MEP) and Energy Transition for Green Growth Act (ETGGA) 2 .
Figure 5 reveals the bootstrap rolling causality test outcomes for Germany. We observed that the causal association between NUC and CO2 was weak during the study period. The results refute the Ho hypothesis of “no causality from NUC to CO2” at a 10% level of significance (Figure 5 panel a) in the sub-periods 1990, 1998, 2013, and 2019. In addition, Figure 5 panel c discloses significant and positive causality from NUC to CO2 in Germany only in the sub-periods from 1990, 1998, 2013, and 2019, demonstrating that NUC intensifies environmental damage in Germany. Besides, the Ho hypothesis of ”no causality from CO2 to NUC (Figure 5 panel b) is refuted at a significant level of 10% from sub-sample periods 1991, 1996, and 2002–2005. In addition, a negative and significant causality from CO2 to NUC emissions in Germany surfaced only in the sub-periods 1991, 1996, and 2002–2005 (see Figure 5 panel d). These results support the feedback hypothesis in Germany. These results align with what is anticipated, given Germany's policy of eradicating nuclear energy. Germany used 17 reactors to generate 25% of its electricity from nuclear energy up to March 2011. After the oil price shock of 1974, German advocacy for nuclear energy was high in the 1970s, and there was a feeling of insecurity concerning energy sources, similar to France. After the Chornobyl disaster in 1986, this approach collapsed, and the final new nuclear power plant was installed in 1989. In December 2022, Germany's final nuclear power facility will shut down 3 . The 2011 Nuclear Energy Act (Atomgesetz) removed the authorization to run nuclear reactors for electricity generation on a phase-out timeline. Nuclear power's contribution to total energy output declined from 22.2% in 2010 to 11% in 2020. Renewables, including solar PV, biogas, and wind, on the flip side, will account for roughly 45% of total power generation in 2020. Nonetheless, it paints a very dubious image if a country that prides itself on being a climate action pioneer still has some of Europe's biggest power station polluters and would have probably failed its 2020 carbon reduction targets if not for the COVID-19 lockdown 4 .
Figure 6 discloses the bootstrap rolling causality test outcomes for Japan. We noticed that the causal interconnection between NUC and CO2 was weak in the study period. The study results dismissed the Ho hypothesis of “no causality from NUC to CO2” at a 10% level of significance (Figure 6 panel a) in the sub-periods 1988, 2006, 2008, 2012–2013, and 2019. In addition, panel c discloses significant and negative causality from NUC to CO2 in Japan only in the sub-periods 1988, 2006, and 2008, demonstrating that NUC intensification enhances the environmental quality; however, the causality from sub-sample periods from 2012–2013 and 2019 is positive and significant. Moreover, the Ho hypothesis of “no causality” from CO2 to NUC (Figure 6 panel b) is dismissed at a significance level of 10%. These results support the nuclear energy lead emissions hypothesis for the case of Japan. The findings might be explained by the fact that nuclear power reactors have been a national strategic goal since 1973, before the Fukushima disaster in 2011. The Japanese government indicated in March 2002 that it would rely significantly on nuclear energy to meet the Kyoto Protocol's GHGs emissions reduction targets. Cabinet approved a 10-year energy plan submitted to the Minister of Economy, Trade, and Industry (METI) in July 2001. This strategy projected a 30% growth in nuclear power capacity (13,000 MWe), with utilities expecting to have up to 12 additional nuclear units operational by 2011 5 . Nonetheless, after the Fukushima accident, this strategy was reviewed. The possible reason for the positive effect of nuclear energy on CO2 is due to the Fukushima accident, which causes a decrease in nuclear energy generation.
Figure 7 reveals the bootstrap rolling causality test outcomes for the United Kingdom. During the investigation, we noticed weak causality between NUC and CO2. There is causality from NUC to CO2 at a 10% significance level (Figure 7 panel a) in the sub-periods 1992 and 2019. Moreover,Figure 7 panel c discloses significant and positive causality from NUC to CO2 only in the sub-periods 1993, demonstrating that NUC intensified environmental damage in 1993. However, in the sub-sample period 2019, the Ho hypothesis of “no causality from NUC to CO2 is dismissed. The negative causality suggests that NUC intensifies the quality of the environment. On the flip side, there is causality from CO2 to NUC in sub-sample periods 1998, 2009, and 2013–2014 (Figure 7 panel b). In addition, the causality in the sub-sample periods 1998, 2009, and 2013–2014 are positive and significant (Figure 7 panel d). These results back up the NUC and CO2 feedback hypothesis in the United Kingdom. These results are not surprising because the quantity of electricity generated by nuclear power in the United Kingdom has decreased since the 1990s. Nuclear power offered nearly 25% of the United Kingdom's electricity in the late 1990s 6 . Since then, a lot of installations have been officially closed, while others are now closing more frequently for repair since they are old. Nuclear power facilities will provide 16% of the UK's electricity by 2020. Since the capacity of reactors scheduled for dismantling soon surpasses the number of new reactors authorized for construction, it is anticipated that the UK's nuclear power capacity will decline in the short and medium term. Over half of the United Kingdom's present nuclear capacity will be retired by 2025. The government recently said that additional nuclear power is key to reaching the government's carbon reduction targets. The government has set aside funds to help achieve its nuclear objectives. In 2021, the UK spent £1.7 billion to facilitate a final investment decision for a large-scale nuclear plant. Additionally, the government launched the £120 million Future Nuclear Enabling Fund to remove entry hurdles to the sector.
Figure 8 reveals the bootstrap rolling causality test outcomes for the United States. During the investigation, we noticed weak causality between NUC and CO2. The results refute the Ho hypothesis of “no causality from NUC to CO2” at a 10% level of significance (Figure 8 panel a) in the sub-periods 2016. Moreover, there is significant and negative causality from NUC to CO2 only in the sub-periods 2016, demonstrating that NUC intensified environmental quality in 2016 (Figure 8 panel c). On the flip side, there is causality from CO2 to NUC in sub-sample periods 1997, 2005, and 2010 (Figure 8 panel b). In addition, the causality in the sub-sample periods 1997, 2005, and 2010 are positive and significant (panel d). These results back up the NUC and CO2 feedback hypothesis in the United States. These results back up the NUC and CO2 feedback hypothesis in the United States. The United States is the globe's largest generator of nuclear power, responsible for more than 30% of global nuclear electricity output 7 . Nuclear power presently accounts for more than half of the country's carbon-free electricity, and the untimely shutdown of existing nuclear power facilities would put the United States well behind schedule in fulfilling its decarbonization targets. In 2021, the US Department of Energy (DOE) spent a record $1.3 billion on nuclear energy research.
Summary of results
In summary, the current analyses disclosed that in Japan, the United States, France, and Canada, consumption of nuclear energy curbs the emissions of CO2 in the sub-sample period. As a result, the empirical results of this study support the idea that nuclear energy is needed to prevent the negative effects of CO2 that lead to climate change and global warming. Nuclear energy is seen as a better alternative source of energy in Japan, the United States, France, and Canada because its development and use are both environmentally and economically beneficial. These outcomes comply with the study of Menyah & Wolde-Rufael, 39 who examined the NUC-emissions nexus in the USA. The findings revealed that nuclear energy could assist in reducing CO2.
Similarly, our findings comply with the study of Saidi & Omri 40 in OECD countries. According to the results, deploying nuclear technologies will reduce the usage and reliance on oil and coal, and CO2 will be eradicated. On the flip side, we found that in the sub-sample period in Germany and United Kingdom, consumption of nuclear energy contributed to ecological damage. Moreover, although nuclear energy reduces carbon emissions, nuclear power plants always present a serious risk due to significant cross-country political, social, and economic variations. The findings of this study, which show that using nuclear energy causes the environment to deteriorate, were observed in the examples of Germany and the United Kingdom. These results align with the studies of Sarkodie & Adams 46 in South Africa. Furthermore, the study also reported that the utilization of nuclear energy contributes to the deterioration of the environment. Similarly, the research of Syed et al. 47 for Pakistan testified that an intensification in NUC causes the damage of the environment. These outcomes present significant policy intuition for policymakers in the selected developed countries.
Based on these results, it is clear that the lead-lag connection between NUC and CO2 cannot be analyzed using linear models; instead, nonlinear models, which can specifically account for regime shifts, should be considered. The results show that the lead-lag connection between NUC and CO2 is unstable. Furthermore, volatile periods behave very differently, and the connection is probably nonlinear, time-varying, and asymmetric, implying that time-series assessments of NUC and CO2 that do not take these characteristics into account may be inaccurate. Additionally, linear models’ estimations that presume a constant association may be seriously deceptive.
Conclusions and policy recommendations
Conclusions
Nuclear energy is portrayed as low-carbon transitional energy that helps maintain CO2 levels in the atmosphere, reducing global warming and climate change. Therefore, this study assesses the nexus between CO2 and NUC utilizing the rolling-window causality and bootstrap full-sample Granger (BFSG) causality tests for selected 6 developed countries (i.e., Japan, Canada, France, United Kingdom, United States, and Germany) using a yearly dataset from 1980 to 2020. The FSG test results show that NUC Granger causes CO2 in France and UK, whereas CO2 Granger causes NUC in Germany. Furthermore, there is no causality between CO2 and NUC in the United States, Japan, and Canada. However, we analyze the predicted model parameters’ stability, taking structural changes into account. The results show that both the short-run and long-run connections between the two series are unpredictable across the sample period. As a result, misleading outcomes would surface using the full-sample causality test Therefore, the study evaluates the causal association between CO2 and nuclear energy. The current paper utilized the bootstrap rolling window technique. Instead of asserting that permanent causation exists in every time period, the rolling window technique permits the causal relationships to be time-varying. The rolling p-values of the observed LR statistics and the extent of one variable's influence on the other are calculated using the residual-based bootstrap and a rolling window approach. To the authors’ awareness, this is the first empirical analysis to explore the causal linkage between NUC and CO2 using time-varying techniques. Therefore, this study fills the gap in the literature. The outcomes of the rolling-window causality test disclosed the following: we found empirical proof of unidirectional negative causality from NUC to CO2 without feedback, suggesting that nuclear energy consumption can aid in mitigating CO2 for Japan. In contrast, a negative causality in sub-sample periods from NUC to CO2 surfaced during the sub-sample period, while a positive causality surfaced from nuclear energy to CO2 in the United States and France sub-sample period. The results indicate that the United States and France can reduce CO2 by increasing NUC. Furthermore, we found negative feedback causality between NUC and CO2, implying that nuclear energy can curb emissions and vice versa for Canada. The evidence of a positive unidirectional causality surfaced from NUC to CO2, implying that NUC's consumption worsened the environment in the sub-sampled period in Germany.
Policy suggestions
According to the results, deploying nuclear technologies will reduce the usage and reliance on oil and coal, and CO2 will be eradicated. Furthermore, the advancement of the nuclear energy industry aids in modernizing the energy industry. Japan, Canada, the United States, and France should diversify their energy supply to include nuclear energy to minimize emissions. Nevertheless, generating power from nuclear sources necessitates a high level of safety consideration. To avoid unintended incidents with negative health and environmental consequences, management of radioactive waste and nuclear plant construction must be handled with care. Nuclear energy has the prospect of being a viable substitute for traditional energy. Still, it is contingent on the economic categorization and socioeconomic elements that aid in using energy storage for sustainable development.
Nuclear energy has vast market potential and is also very inexpensive. Furthermore, to lessen the danger (radiation) of nuclear energy, the government can impose strict laws and controls to keep radiation exposures for employees and public members below prescribed levels. The governments of Japan, Canada, the United States, and France could support using clean energy (nuclear) to meet their countries’ energy needs. Furthermore, eco-friendly measures can lead to economic development. For Germany and the United Kingdom, a positive causal effect from NUC to CO2 surfaced, implying that the surge in CO2 in Germany and United Kingdom is attributed to an increase in nuclear energy. This means that nuclear energy increase emissions due to likely reasons, including improper management practices and nuclear waste. Based on these results, policymakers and governments in both countries should re-strategize their policies regarding nuclear energy by increasing their share in their energy mix.
Footnotes
Abbreviations
Declaration of conflicting interests
The author(s) declared no potential conflicts of interest with respect to the research, authorship, and/or publication of this article.
Funding
The authors disclosed receipt of the following financial support for the research, authorship, and/or publication of this article: This research was funded by the National Natural Science Foundation of China (71973011).
