
Abstract
Empirical narratives pertaining to the implications of energy security (ENS) on environmental quality (EQ), particularly in the context of Emerging Seven (E7) countries, are currently understudied. Likewise, the influence of renewable energy (RWN), economic complexity (ECI) and environmental control technology (EVT) on EQ is still unsettled. Thus, based on arrays of pollution metrics (ecological footprint (ECF), carbon emission damage (CO2D) and consumption-based carbon emissions (CCO2) and annual panel series spanning 1990–2018, this study provides fresh insights into the implications of the listed variables on EQs in E7 countries. Accordingly, the following empirical narratives were established: (i) The effects of the enlisted panel series on EQ are sensitive to the peculiarities of each pollution metric. (ii) Estimates of the pool mean group autoregressive distributed lag (PMG-ARDL) model and those of cross-sectional augmented autoregressive distributed lag (CS-ARDL) underscore the important roles of ENS and RWN on EQ, particularly on ECF; and ECI on CO2D. While EVT provides insignificant carbon emission reducing effects across all variants of EQ indicators, population and economic growth are all time-significant pollution enablers. (iii) The outcomes of the panel quantile regression demonstrate that ENS enhances EQ only at the 25th and 50th quantiles and accelerates pollution at the 75th and 95th quantiles. RWN enhances EQ across all quantiles while ECI deaccelerates ECF and CO2D and accelerates CCO2 across all quantiles. Furthermore, EVT accelerates ECF and CO2D while it deaccelerates CCO2 across all quantiles. Meanwhile, the unpleasant effects of growth and population are reemphasized. Policy strategies to ensure a sustainable environment in E7 have been highlighted.
Keywords
Introduction
Environmental decay and ecological deficit are among the toughest challenges that countries all over the globe are constantly grappling with. It is indeed very worrisome and an issue of critical concern how the global environmental ecosystem is being compromised uncontrollably chiefly on the instance of human activities. On account of several prior studies,1–7 the quest for economic advancements and overall development seems to have blindfolded humankind, leading to compromised ecosystems both in developed and developing countries. To respond to the mounting challenges of ecological imbalances, global economies have entered into several international conventions/treaties that were conscientiously constituted and crafted to ensure comprehensive abatement of continuous environmental decay. Such treaties, including the Kyoto protocol in 1997, the Paris Agreement in 2015 and the Intergovernmental Panel on Climate Change (IPCC) in 2018 were all crafted to ensure a sustainable environment for the benefit of all humankind. In addition, a historic conference of Paris (COP21) provides critical objectives, including keeping global temperature within 2°C above the preindustrial level. The agreement also craves a further decline in global temperature to at least 1.5°C. 8 , 9 Likewise, the commitment to sustainable ecosystems and healthier environments occupies the 13th spot in the United Nations’ sustainable development goals (SDGs).
Unarguably, the Emerging seven (E7) countries consisting of China, India, Brazil, Turkey, Russian federation, Mexico and Indonesia are not just among the world's fastest growing economies but are prominently among the world's top carbon emitters. Specifically, the E7 countries are among the fastest growing economies in terms of population and economic growth 10 and, at the same time, are among the world's most compromised ecosystems. 11 Likewise, based on the report of Earth System Science Data (ESSD [2020]), the E7 countries jointly contributed approximately 45% to global greenhouse emissions. It is also established that mainly due to high energy consumption occasioned by the quest for development, the E7 countries continue grappling with monumental environmental decay. Likewise, the E7 countries are ranked among the world top 10 on the basis of total ecological footprint (ECF) burden. Accordingly, China, India, Russian federations, Brazil, Indonesia and Mexico are ranked 1st, 3rd, 4th, 6th, 7th and 8th, respectively. Meanwhile, Turkey is ranked a distance of 14th position. Likewise, all the E7 countries except Brazil and the Russian Federation are biocapacity debtors. That is, a precarious situation whereby a country's ECF exceeds its biocapacity. Accordingly, China, India, Turkey, Mexico and Indonesia are indebted biocapacities of 311%, 171%, 156%, 106% and 38%, respectively. Brazil and Russian federation enjoy biocapacity reserves of 233% and 26%, respectively 1 . In terms of energy security (ENS), there is an impressive rise in most E7 countries. For instance, access to electricity in India increased from 43% to almost 85%, while in Indonesia, it increased to 62% in 1990 2 (see Figure 1 for more insights). Obviously, for countries with strong population growth, such improvements in the share of the population with access to electricity are impressive owing to the potential environmental enhancing effects of ENS. Therefore, it is critical to understand the implications of ENS and other enlisted series on environment qualities (EQs) in E7 countries and accordingly provide a workable policy framework to reposition the E7 countries on the path of environmental sustainability. Additionally, the urgent need for the continuous reappraisal of available policy options in these countries to ensure long-lasting sustainable ecosystems and overall carbon neutrality is critical.
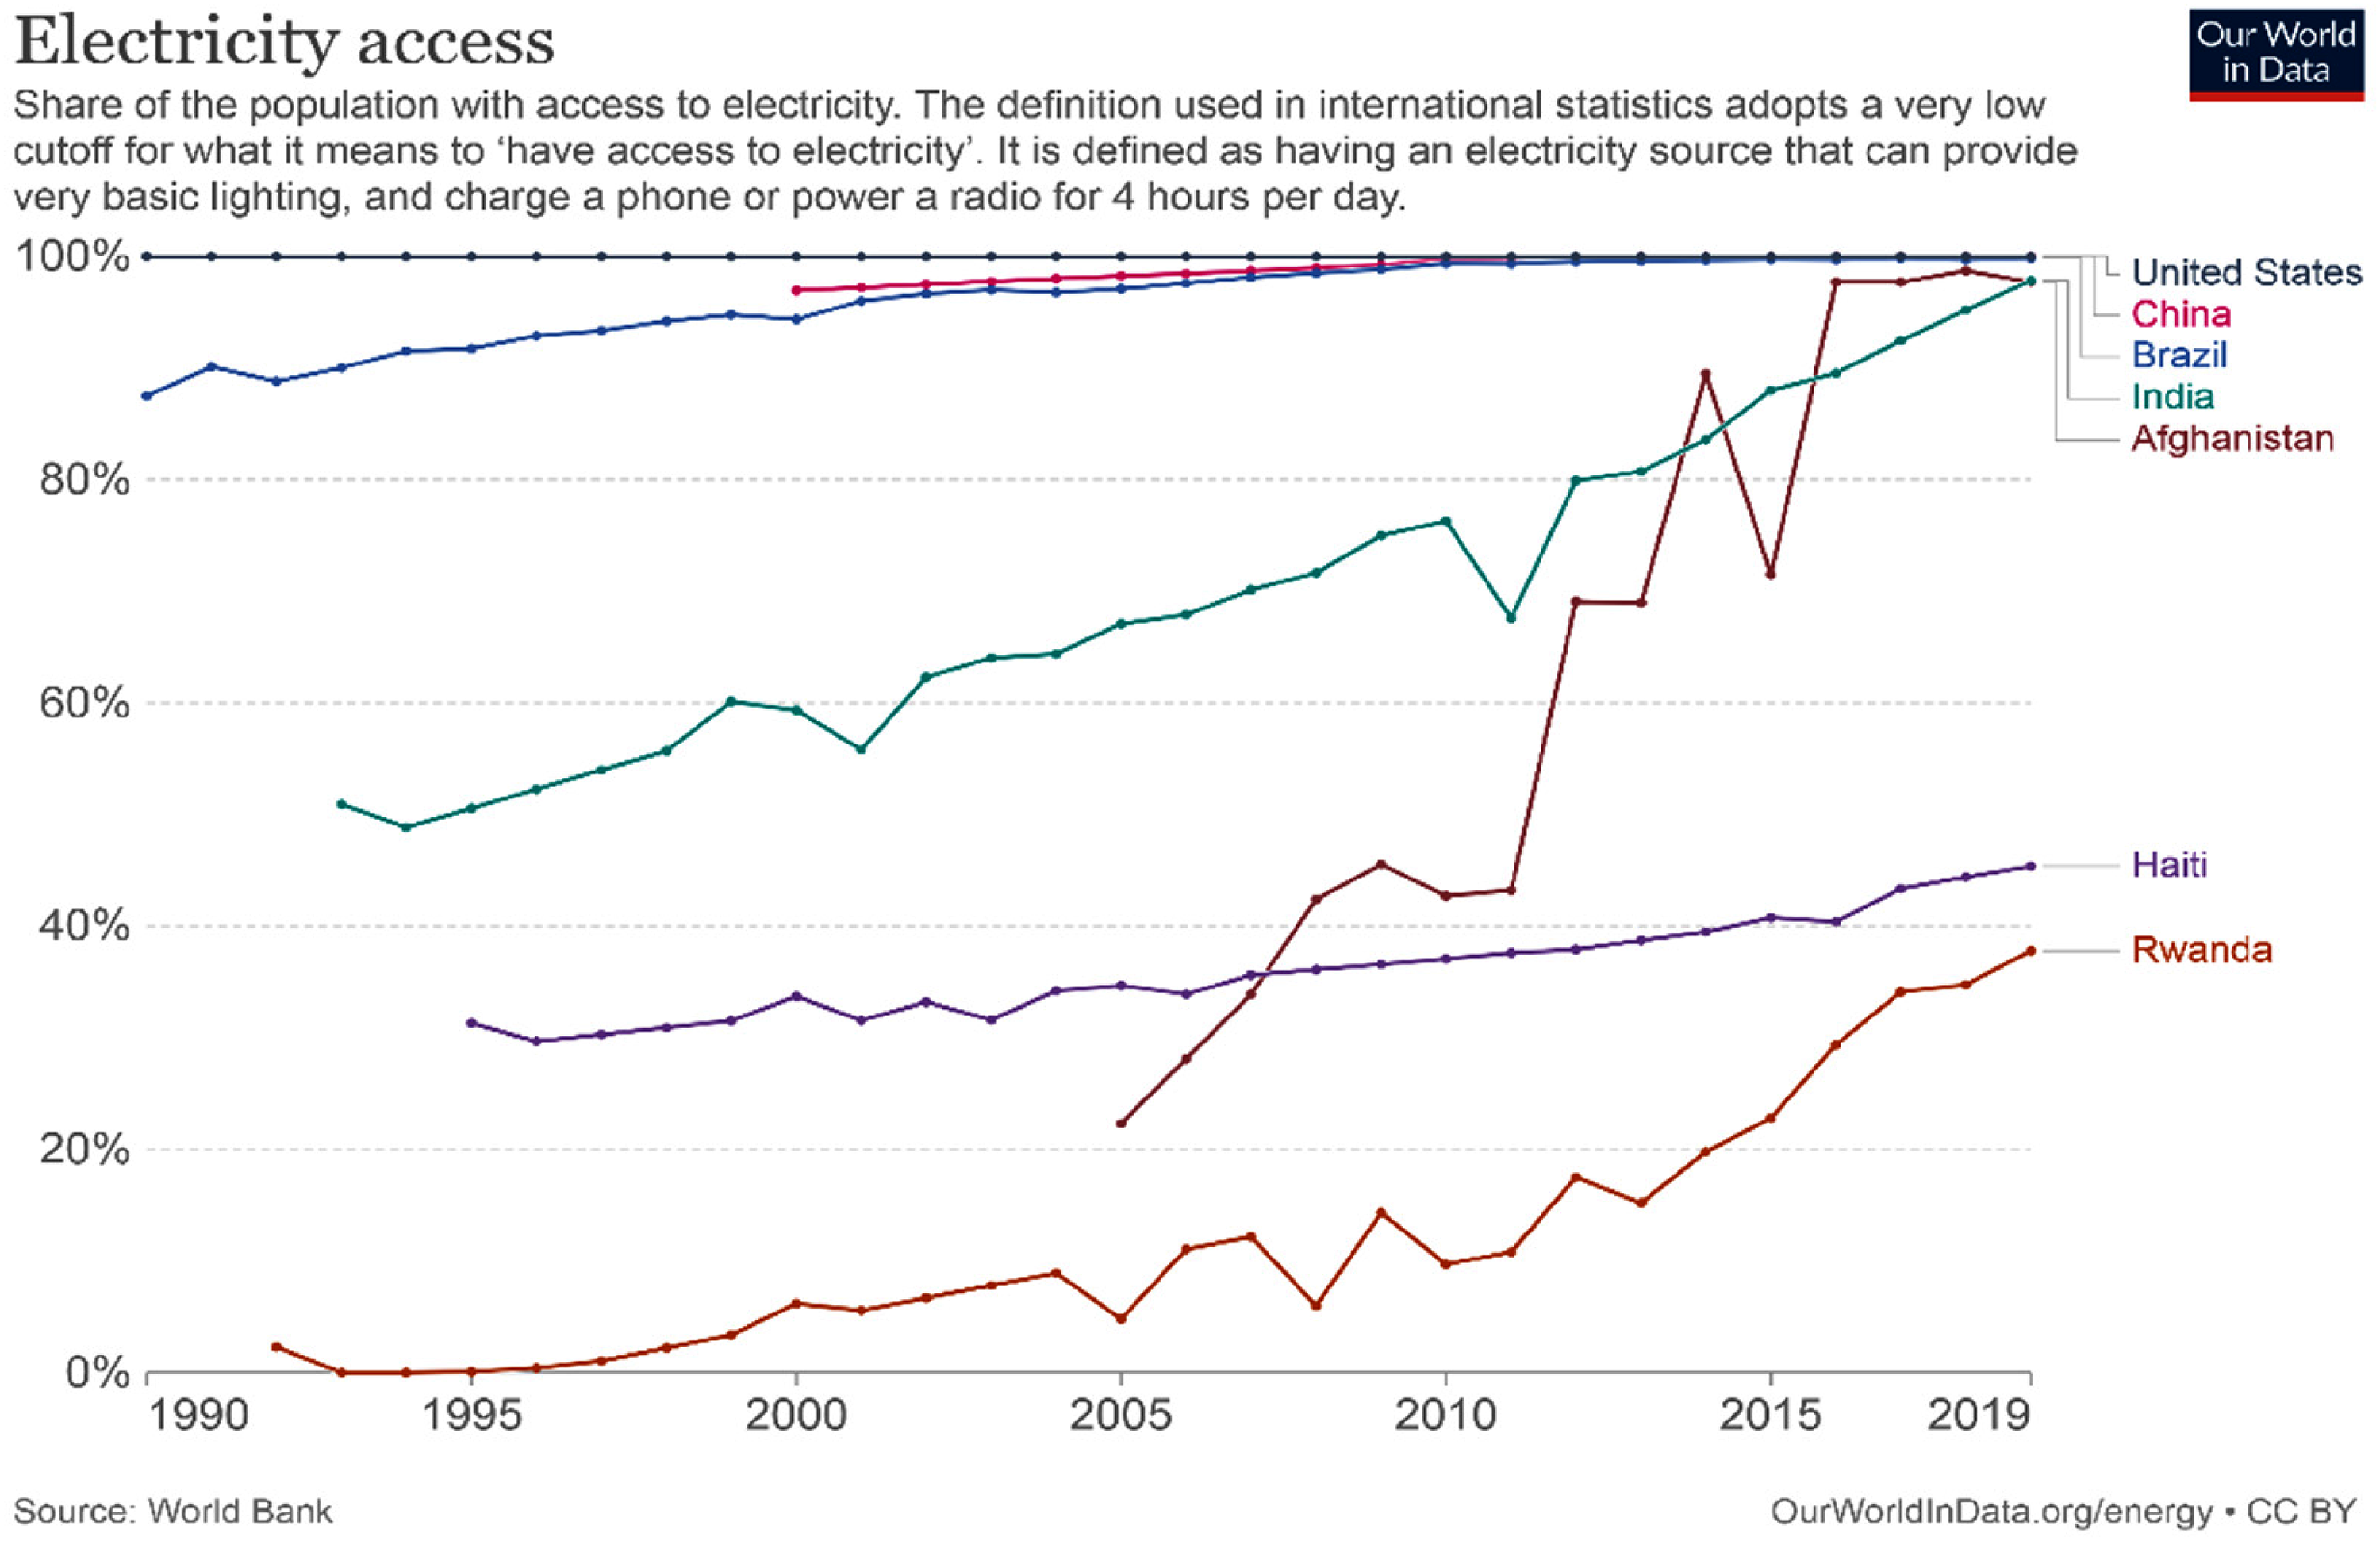
Access to electricity.
Irrespective of the daunting environmental pollution experiences of the E7 countries, it is surprising that empirical enquiries pertaining to the constituent factors of environmental decay in these emerging countries are largely understudied. Furthermore, empirical expositions of the critical factors that could salvage the compromised ecosystem within the E7 countries are also not readily available. More challenging is the unconvincing positions and ambiguities in related prior empirical studies, which, to a very large extent, has made the issue bordering on the determinants of environmental decay an open debate. Accordingly, Akadiri et al., 12 Li et al. 13 and Mujtaba et al. 14 reveal that renewable energy (RWN), economic growth and economic complexities (ECIs) contribute to growing ecological deficits in China, 147 countries and the Middle East and North Africa. Similar narratives were exposed in Awosusi et al. 15 and Hamid et al., 16 suggesting that affluence, non-RWN and technological innovativeness are fundamental pollution enablers in Brazil, Russian Federation, India, China and South Africa (BRICS) countries. However, the reports of Akalin et al. 17 and Chien et al. 18 exonerate RWN from the negative implications of fossil fuel and economic growth on EQ in the newly industrialized nations and ASEAN countries, respectively. To further deepen the contradictions, Ali et al. 19 rectify that economic growth does not contribute significantly to environmental decay in Malaysia at all times. Zeraibi et al. 20 suggest that higher renewable electricity and technological innovations are enhanced, while increasing economic growth and financial development mitigate EQ in ASEAN-5 nations. A similar assertion was extended by Zhao et al., 21 suggesting that energy poverty eradication (ENS) and technological advancement encouraged green growth in China.
Another critical incentive for the current evaluation is the near absence of prior studies that integrated and considered the implications of metrics such as ENS, RWNECI and environmental control technology (EVT) on EQ, particularly in E7 countries. On this premise, the study aims at unravelling the potential implications of the listed metrics as well as economic growth (affluence) and population on environmental health in these countries. To further provide clearer perspectives, we outlined the following research question: (i) Can the E7 countries achieve a clean environment by ensuring higher ENS? (ii) To what extent can the transition to RWN consumption and commitment to ECI ensure sustainable ecosystems in these economies? (iii) What is awaiting the E7 countries ecosystem when its EVT progresses? and (iv) Do affluence and population explosion constitute significant threats to EQ in E7? Overall, we conjectured that improvements in ENS, transition to RWN consumption, ECI and improved EVT will invoke a healthier environment while affluence and a growing population constitute a drag on EQ in these countries.
Notably, the modest contribution of this study to the literature related to EQ determinants stems from its ability to enlist such critical metrics listed above within the Stochastic Impacts by Regression on Population, Affluence and Technology (STIRPAT) framework of E7 countries. It is pertinent to highlight that prior studies did not trade this path. Meanwhile, the dearth of studies linking ENS to climate change is further highlighted in Jessel et al., 22 suggesting the urgent need for more empirical enquiries in that direction. To further extend the trajectory of knowledge, this study, unlike existing investigations, also engaged arrays of pollution indicators such as the ECF, carbon emission damage (CO2D) and consumption-based carbon emissions (CCO2). In addition, unlike prior studies, the current evaluation relied on the barrage of robust panel estimators, including the pool mean group autoregressive distributed lag (PMG-ARDL), the dynamic cross-sectional augmented autoregressive distributed lag (CS-ARDL) and the panel quantile regression (P-QREG) techniques. Expectedly, these holistic approaches lacking in related prior studies were consciously undertaken not only to extend the frontiers of knowledge but also to provide more formidable carbon neutrality pathways for the E7 countries. Consequently, it is expected that the inferences from this commitment will avail the E7 countries of a cutting-edge template that ensures total compliance with all treaties entered by E7 countries. Likewise, policies that will ensure that these countries remain within the track of SDGs 7 and 13 will emerge. Expectedly, beyond the E7 countries, other developing and emerging economies may draw inspiration from the inferences of this study to devise environmental sustainability strategies.
The rest of the study is organized as follows: Review of related literature section reveals the related literature while Methodology section presents the methodology. The penultimate section provides data analysis and discussions while the Conclusion and policy implications section unveils the concluding remarks and policy options.
Review of related literature
Theoretical literature
Environmental economists have proposed some theories pertaining to the dynamic interactions of economic metrics and EQ. Among such theories is the environmental Kuznets curve (EKC) hypothesis. 23 In a nut shell, the EKC theory predicts a U-shaped or an inverse interaction between economic growth and EQ. Technically, the theory suggests that at the initial stage of economic growth, environmental pollution increases to a certain threshold where continuous growth ensures a cleaner environment by reducing pollution. 24 Additionally, some researchers 25 connected the metrics of technology, innovations, RWN, ECI and ecological balance to the popular STIRPAT framework. Overall, the findings of these related studies are inconclusive. Moreover, there is a dearth of empirical narratives pertaining to the interactions of ENS and the other enlisted metrics with environmental performance in the context of E7 countries. For clarity, we have outlined several recent empirical investigations that considered the relevant factors influencing EQ.
Empirical literature survey
The empirical survey is presented in such a way that it clearly showcases the contradictory submissions of prior studies, which obviously demands further clarification. For instance, Bilgili et al. 26 considered the influence of ENS on CO2D in select Asian economies between 1997 and 2017. Based on the outcomes of the panel quantile regression, they report a significant inverse interaction between pollution and access to electricity. Unarguably, their study did not consider the E7 countries and other pollution indicators. The study also failed to include metrics such as ECI and EVT within the model. Likewise, Li, et al. 13 and Zhao et al., 21 on the basis of a panel of 30 Chinese provinces, document that energy poverty elimination (increasing ENS) and technological innovations contribute significantly to green growth. However, this study not only failed to consider E7 countries but also ignored other variants of pollution indicators and relied on a less robust econometrics algorithm.
For studies in the context of E7 countries, Tong et al. 10 document that energy consumption is the cause of environmental decay in E7 countries, while ul Husnain et al. 11 buttressed further that while non-RWN mitigates, RWN enhances EQ in E7 countries. More conflicting narratives in the context of E7 countries emerged from the submissions of Gyamfi et al. 27 and Gyamfi et al. 28 While the former emphasizes the long-term deleterious effects of renewable and non-RWN on EQ the latter documents an appealing influence of RWN investment on EQ. Additionally, Huang et al. 29 report that information and communication technology (ICT) and ECI escalate pollution while RWN reduces pollution in E7 countries. Obviously, these few studies that considered the E7 countries not only failed to include both ENS, ECI and EVT in their analysis, but they also compounded the subsisting contradictions. Moreover, they also considered only a variant of the pollution indicator, therefore compelling the need for further evaluations.
Several other studies have, albeit divergent inferences, considered other determinants of EQs in many other economies. Accordingly, we X-ray such related prior and recent studies. For instance, Usman et al. 30 relied on the outcomes of the CS-ARDL model and inferred that electricity consumption spurs ecological deficits in advanced countries. Likewise, Usman and Hammar 31 relied on the outcomes of AMG and CCEMG panel estimators to emphasize that improvement in technology mitigate EQ in Asian-Pacific Economic Corporation (APEC) countries. Conversely, Zeraibi et al. 20 document that renewable electricity and technological innovations enhance EQ in ASEAN-5. This opinion is further enthroned by the submissions of Abbasi et al., 32 Razzaq et al. 33 and Yang et al. 34 extolling the appealing impacts of technology on WQ in Pakistan and BICS economies, respectively. Likewise, Nguyen et al. 35 and Xin et al. 36 rectified that improvements in ECT and innovation expenditure improve EQ in the G-20 economies and US, respectively. However, Awosusi et al. 15 and Umar et al. 37 emphasized that innovations spur CO2 emissions in BRICS countries and China, respectively. More contradictory inferences emerged from the submissions of Ahmad et al. 38 and Ding et al., 39 emphasizing the environmental deleterious effects of technological innovativeness and RWN on the environments in twenty-four OECD and G7 countries, respectively. Additionally, Amin et al. 40 report that for Asian nations, modernization accelerates ecological deficits.
Furthermore, prior studies still provide an open debate on the RWN–EQ nexus; meanwhile, as previously highlighted, the E7 countries were underrepresented. Accordingly, Chien et al. 18 adopted the QARDL model and report that RWN and eco-innovations deaccelerate emissions in the United States. Corroborative inferences emerged from Chien et al., 41 Dingru et al., 42 Gormus and Aydin 43 and Hsu et al. 44 in the context of Asian, BRICS, top 10 innovative economies and China, respectively. Likewise, Chang et al., 45 Dogan and Shah 46 and Zhao et al. 21 document that RWN and environmental-related technology deescalate environmental decay in Gulf Cooporation Council (GCC) countries and the top five polluted countries, respectively. Furthermore, Atsu et al., 47 Mujtaba et al. 48 and Wang and Dong 49 identified that RWN improves EQ in South Africa, OECD countries and sub-Saharan African countries, respectively. Iqbal et al. 50 further comment that RWN and ECT are desirable factors for clean environments in the context of OECD economies. Conversely, Chen and Lee, 51 however, rectify that RWN usage and technological advancement have no significant CO2 reducing effects globally but for high-income countries. Likewise, Destek et al. 52 reported that biomass (RWN) increases the ECF but reduces CO2 emissions in the top five biomass nations. Furthermore, while Murshed et al. 53 remark that RWN consumption degrades EQ in G7 countries, Wang et al. 7 admit that RWN utilization provides a varying reducing influence on the ECF across different economic settings. Likewise, Emre et al. 54 extended the debate and considered RWN utilization and ECI as desirable EQ enhancing factors. Likewise, He et al. 55 employed the CS-ARDL for panel datasets spanning 1990–2018 for the top 10 energy transition economies. They rectified that RWN adaptation as well as ECIs deaccelerate carbon emissions.
Undoubtedly, irrespective of the bourgeoning literature pertaining to EQ determinants, the influence of ENS on EQ, particularly in the E7 countries context, is conspicuously lacking in prior studies. Meanwhile, the few existing ones failed to consider other pollution metrics, and they relied largely on conditional mean estimators that are not robust to non-linearities. Thus, the present study bridges the conspicuous lacuna in the literature and therefore makes a significant contribution to knowledge.
Methodology
Data description
For empirical analysis, this study relied on annualized panel datasets that span 1990–2018 cutting across E7 countries. Consequently, a macro panel framework with a larger time dimension (T) and a smaller cross-section (N) dimension are envisaged. In this instance, all relevant prerequisite steps peculiar to such an arrangement (T > N) were adopted in this study for robust inferences. Meanwhile, it is imperative to highlight that the scope of the study is selected due to data availability constraints. Table 1 provides more tables about the relevant panel series.
Data description and sources.
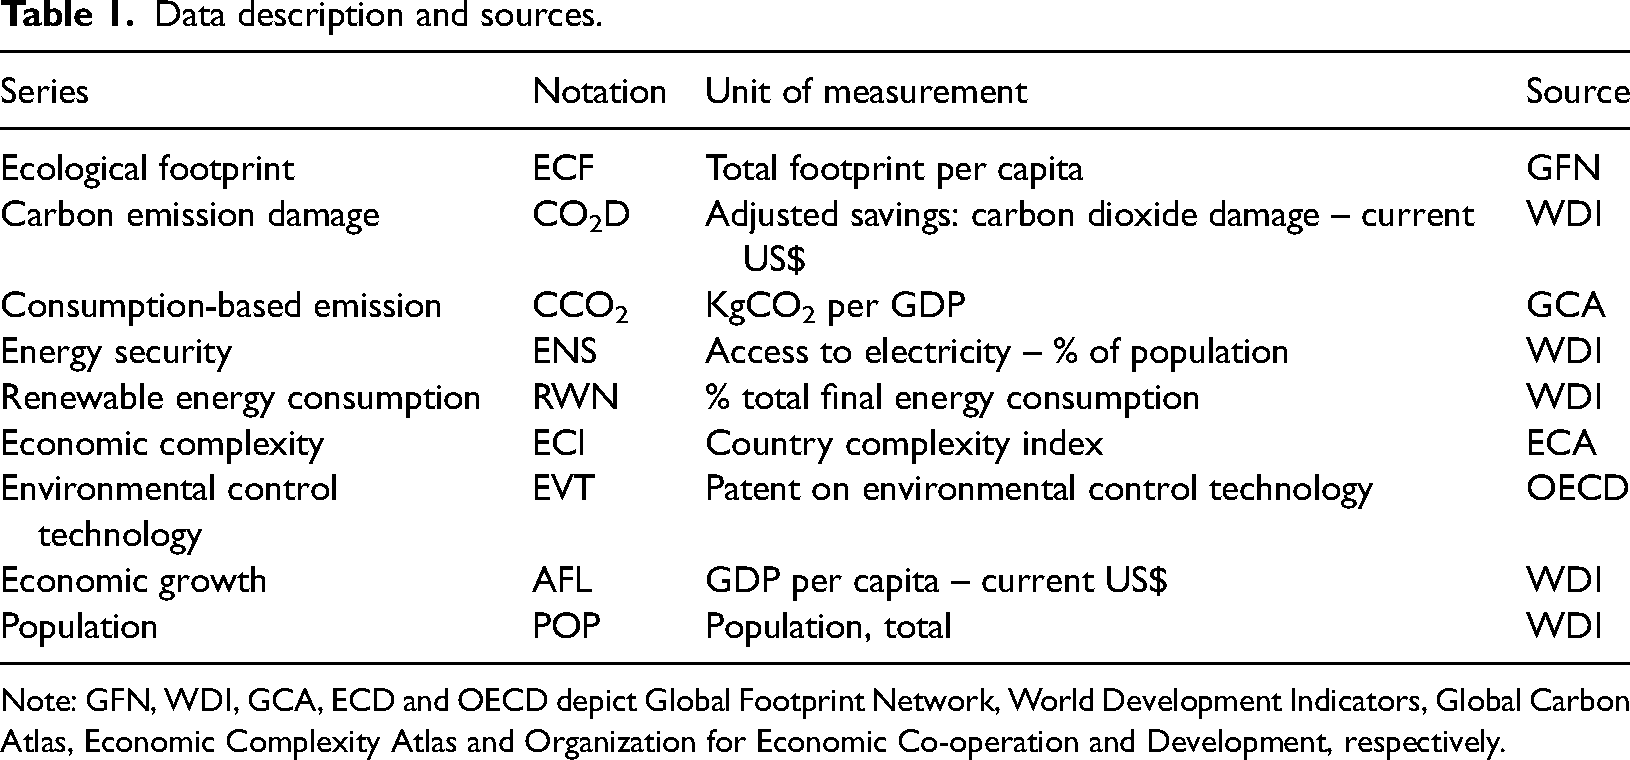
Note: GFN, WDI, GCA, ECD and OECD depict Global Footprint Network, World Development Indicators, Global Carbon Atlas, Economic Complexity Atlas and Organization for Economic Co-operation and Development, respectively.
Model specification
This study considers a STIRPAT framework for E7 countries’ environmental performance when embellished with ENS, RWN, ECI and ECT. Accordingly, relying on insights from prior related studies,
26
the overall objective is to empirically ascertain the implications of the enlisted series on environmental performance in the context of E7 countries. On this premise, the typical IPAT framework is projected:
For this study, the modified STIRPAT framework, where energy poverty, RWN consumption, eco-innovation and ECT were enlisted with affluence and population to rectify their specific influences on environmental performance in E7 countries, is presented. Meanwhile, three EQ indicators (ECF, CO2D and CCO2) were selected for comparative expositions and robust policy narratives.

Estimation techniques
Several enhanced panel estimators peculiar to the macro panel (T > N) specification have been adopted in this study given that the study aims to provide cutting-edge policy strategies that will ensure the attainment of SDG7 in E7 countries. In this study, the Pesaran
57
cross-sectional dependency (CD) procedure and the Pesaran
58
weak-CD techniques were selected for the CD test Furthermore, the study relied on the Hashem Pesaran and Yamagata
59
slope heterogeneity (SH) test process to consider the effects of transnational heterogeneity. As earlier identified, these steps became necessary to select the appropriate generation of panel stationarity test procedures that will avail robust estimates.
24
The formulae for the CD and SH tests are provided in eqautions (4) and (5a) and (5b), respectively.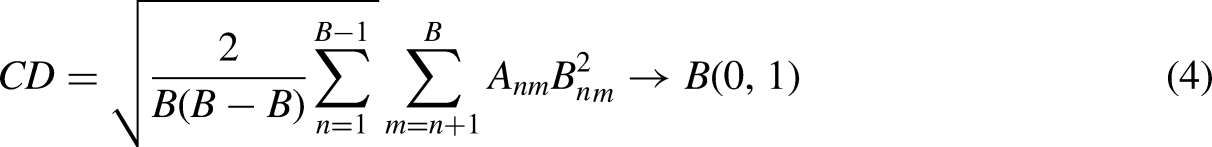


First-generation panel unit root procedures assume cross-sectional independence of the panel series; as such, the procedures perform poorly amidst CD and heterogeneous slopes among the panel series. Therefore, this study adopted sets of second-generation panel unit root procedures, including the cross-sectional Im, Pesaran and Shin (CIPS)
60
and the Pesaran cross-section augmented Dickey–Fuller (PesCADF)
57
processes for its inferences. Accordingly, CIPS and CADF inspection structures are given in equations (6) and (7), respectively.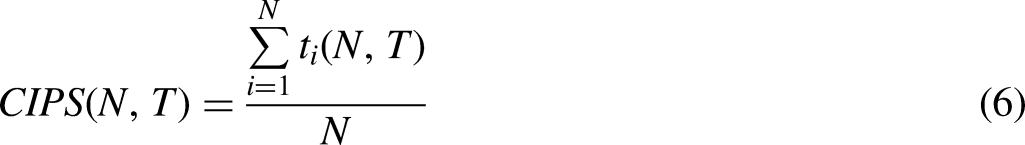


Furthermore, the study relied on two enhanced cointegration procedures, Pedroni
62
and Westerlund,
63
to examine if the enlisted panel series coevolve in the long term. Accordingly, these cointegration techniques are Lagrange multiplier (LM) and bootstrap-based cointegration procedures, which also account for heterogeneous slope, time trend, heteroscedastic and individual-specific intercepts, as well as unknown breaks within the cointegrated series.
64
The functional notation of these error-correction base panel cointegration procedures is provided herewith in equation (9).
where

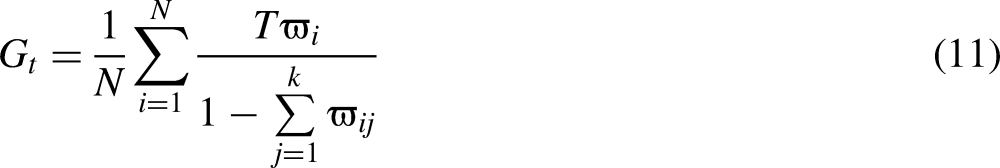


In equations (10) and (11),
To understand the implications of individual explanatory variables on each of the selected response variables (EQ indicators), the study carefully explored arrays of robust and enhanced panel estimators. Among such are the PMG-ARDL, the CS-ARDL and the P-QREG. In specific terms, the PMG-ARDL
65
and CS-ARDL
66
are enhanced panel estimators that are robust to heterogeneous effects and endogeneity problems in panel series.
30
The procedures are formidable even in the face of cross-sectional exigencies and provide empirical details for both short- and long-term effects.
67
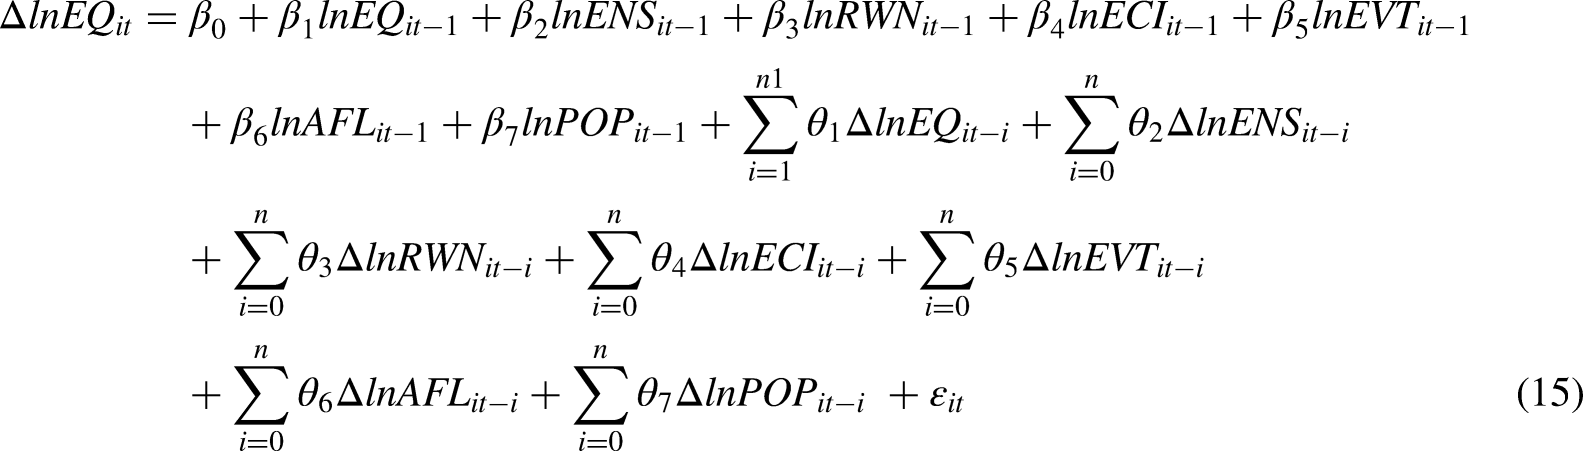
Furthermore, the PMG-ARDL panel estimator performs efficiently even when the relevant panel series are fractionally integrated. However, the models are inefficient when the series are second-order unit root processes. In line with the aforementioned previous studies, we present the functional form of the PMG-ARDL procedure herewith in equation (14).
To provide a robustness check on the outcome of the traditional PMG-ARDL technique, the study also adopts the CS-ARDL technique. The CS-ARDL panel estimator proposed by Chudik and Pesaran
66
also accounts for heterogeneity in panel series, as well as long- and short-run dynamics interactions of relevant variables.4,67 Other advantages of the CS-ARDL include its ability to produce efficient estimates among fractionally integrated panel series. The model also avails reliable estimates amidst cross-sectional dependences.3,30 Likewise, the procedure is equally an efficient technique in the case of weak exogeneity that may appear due to the lagged response variable in the specified equation. Furthermore, the technique prevents the endogeneity problem by adding the lagged cross-sectional averages in the equation.
30
However, much like the PMG-ARDL, the CS-ARDL breaks down amidst the second-difference panel series, and the model may not adequately address the issues of non-linearities and structural breaks. The baseline functional notation of the CS-ARDL is thus presented in equation (16).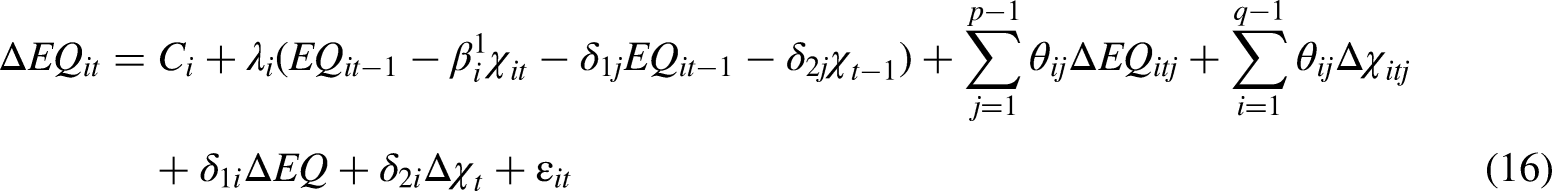
Following recent studies, 26 the panel quantile regression technique of Ponomareva 68 was also adopted in this study to adequately account for potential non-linearity and structural breaks peculiar to economic dynamics. Ideally, economic variables suffer from shocks that arise through economic cycles such as financial crises and the recent COVID-19 global pandemic. Unfortunately, traditional econometric algorithms are incapable of providing a consistent account of such non-linear dynamics among variables. The panel quantile regression model enjoys several advantages over the traditional linear models. Accordingly, unlike the conventional linear models that account for only the conditional mean of the response variable, the quantile regression process allows for the identification of other relevant information within the conditional distributions. 68 The model also accounts for the influence of any unobserved heterogeneity within the panel series and controls for the unobserved individual impasse. 29
Unlike traditional linear models, the quantile regression specification is based on different quantitative points. The characteristics of each point in the conditional distribution can be ascertained by providing a conditional estimate through the quantile regression procedure.
26
The quantile regression estimates the conditional median or other quantiles at different percentiles. Equation (17) describes the quantile regression with fixed effects that this study adopted following prior studies.
26
Ponomareva
68
further explained that the combination of quantile regression models with a fixed effects panel data model provides robust outcomes given that it allows for the study of the causal effect of covariates on the distribution of the explained variable (quantile regression) while controlling for some unobserved heterogeneity (fixed effects).
In quantile estimations, the estimated coefficients are not assumed to be constants but are regarded as functions with a dependency on several quantiles.
26
The sequence of arriving at the estimated coefficients at a particular quantile value is similar to the sequence of arriving at the estimated coefficients of a conventional linear regression model. The main difference is that in quantile regression estimations, the median absolute deviation is minimized. Following the above arguments, the quantile regression framework of the interactions of the dependent variable (EQ) and the enlisted explanatory variables have been outlined in equation (18).
Data estimation and discussions
The outcomes of the summary statistics and correlation matrix have been projected on Table 2 for empirical overview.
Summary statistics and correlation matrix.
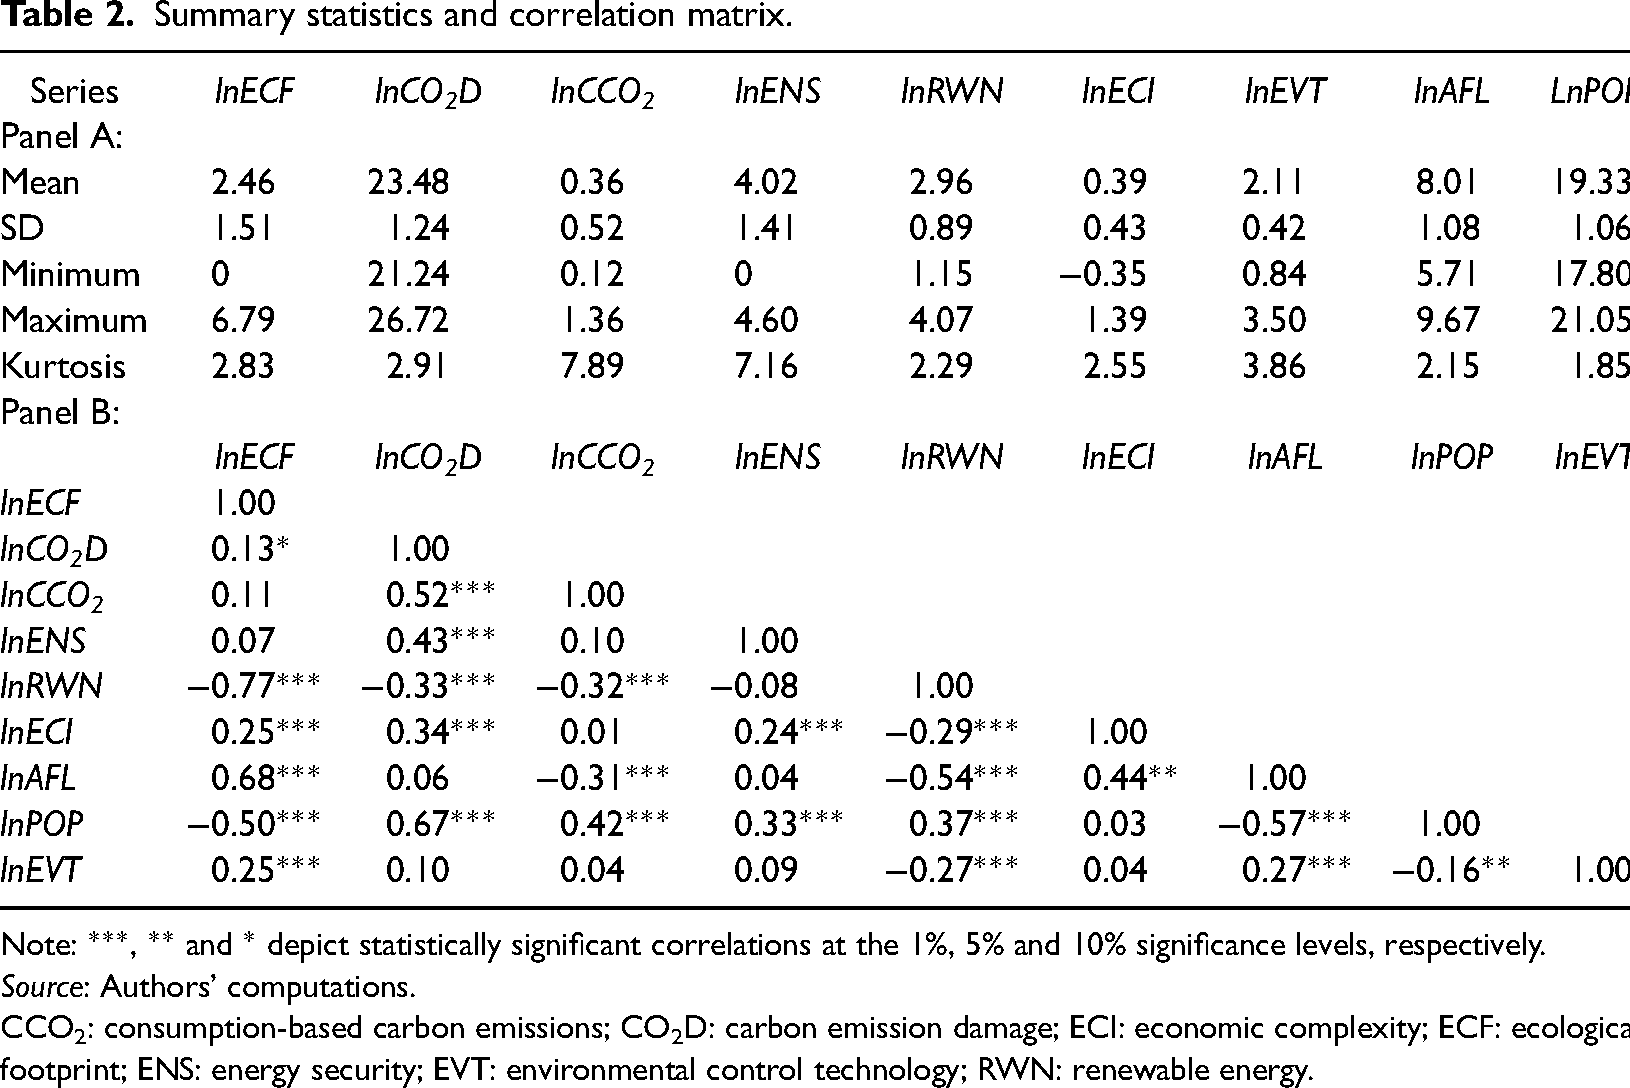
Note: ***, ** and * depict statistically significant correlations at the 1%, 5% and 10% significance levels, respectively.
Source: Authors’ computations.
CCO2: consumption-based carbon emissions; CO2D: carbon emission damage; ECI: economic complexity; ECF: ecological footprint; ENS: energy security; EVT: environmental control technology; RWN: renewable energy.
The outcomes of the two pre-estimation diagnostic tests (summary statistics and correlation matrix) (Table 2) highlight some important characteristics of the enclosed panel series. Accordingly, the expected values of all the series fall between their minimum and maximum values. This denotes a possible convergence of the enlisted panel series. Furthermore, lnECF is the most dispersed, followed by lnCO2D while lnEVT is the least dispersed series. The kurtosis statistic, which indicates whether a series is normally distributed or otherwise unveils that among the panel series, lnCO2 and lnAFL deviate from a normal distribution. In this case, a conventional linear econometric technique may not produce consistent estimates when enlisted series are not normally distributed, therefore justifying the application of non-linear techniques that can adequately capture the effects of such abnormal distributions. In addition, the correlation matrix (Panel B) provides preliminary insights about the strength of correlation among the enlisted series. The matrix suggests that lnENS, lnECI, lnAFL, lnEVT and lnPOP are potential positive predictors while lnRWN is a negative predictor of all the EQ indicators. Meanwhile, the problem of multicollinearity is ruled out given that all the correlation coefficients are below 50%. 56
To provide deeper insights into the characteristics of the enlisted variable and possible interdependences of the cross-sections, the study proceeded with CD and SH tests. Thus, the outcomes of these tests are illustrated in Table 3.
Estimates of cross-sectional dependency (CD) and slope heterogeneity (SH) tests.

Note: *** and ** imply significant relationships at the 1% and 5% levels of significance.
Source: Authors’ computations.
CCO2: consumption-based carbon emissions; CO2D: carbon emission damage; ECI: economic complexity; ECF: ecological footprint; ENS: energy security; EVT: environmental control technology; RWN: renewable energy; W-CD: weak cross-sectional dependency.
Estimates of CD and SH tests (Table 3) rectified that the panel series are cross-sectional dependent. This implies the rejection of the null hypothesis of cross-sectional independent panel series. The SH test (Panel B) also provides overwhelming evidence of transnational heterogeneity of the relevant panel series. This also suggests the rejection of the null hypothesis of a homogeneous slope among the cross-sections. Given the outcomes of the CD and SH tests, the study adopts two second-generation unit root techniques and a third-generation panel unit root procedure. Expectedly, these selected panel techniques are formidable amidst cross-sectional exigencies and structural breaks.
The second-generation panel stationarity test estimates (CIPS and CADF – Table 4) 61 provide some interesting outcomes. Accordingly, the panel datasets are mutually cointegrated between order-zero and order-one. This outcome highlights the suitability of the adopted empirical estimation models (PMG-ARDL) and (CS-ARDL). Specifically, all the EQ variables (lnECF, lnCO2D and lnCCO2) as well as lnRWN, lnECI and lnPOP are all first differenced stationary series, while lnENS, lnAFL and lnEVT are level stationary series. Additionally, the outcome of the third-generation panel unit root procedure provides evidence that some of the panel series are stationary processes, while some are unit root processes. The outcome also suggests evidence of structural breaks in the panel series. Specifically, structural breaks affected the series lnECF and lnEVT in 1991, lnCCO2 in 1996, lnAFL in 2005 and lnENS in 2008. Consequently, the application of the enlisted panel estimators, including the panel quantile regression, has been conscientiously selected to adequately account for the influence of such a phenomenon, thereby leading to robust policy prescriptions. Before the application of the selected panel empirical estimators, efforts were made to confirm the potential long-run coevolution of the relevant panel series. The outcomes of the panel cointegration test based on the Pedroni and Westerlund procedures are illustrated in Table 5.
Panel unit root test results.
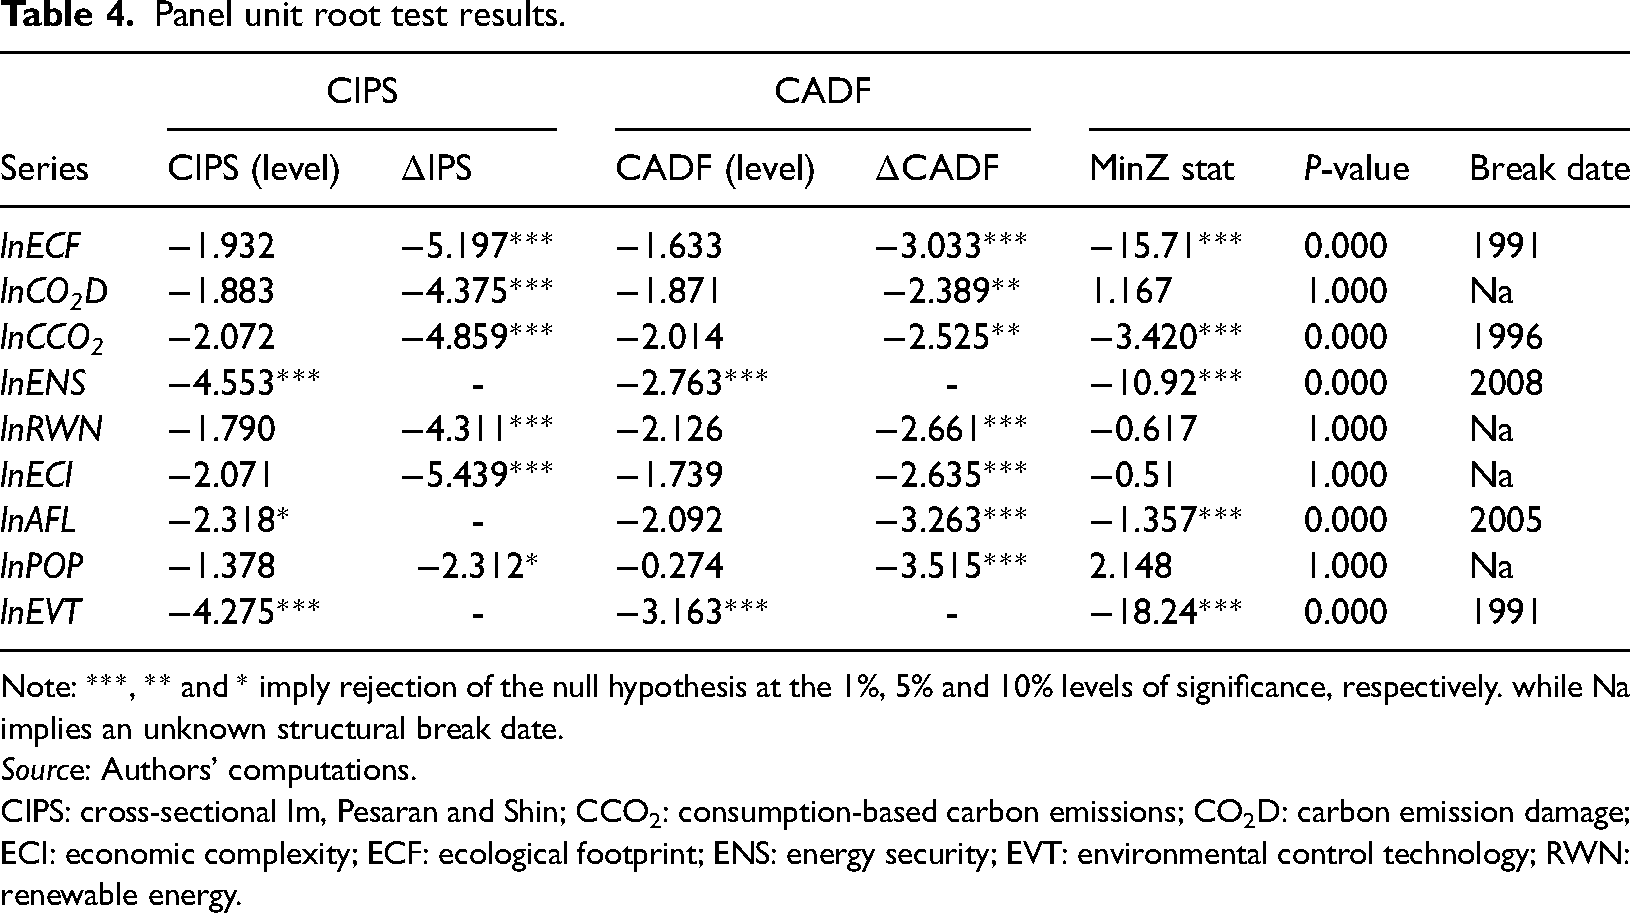
Note: ***, ** and * imply rejection of the null hypothesis at the 1%, 5% and 10% levels of significance, respectively. while Na implies an unknown structural break date.
Source: Authors’ computations.
CIPS: cross-sectional Im, Pesaran and Shin; CCO2: consumption-based carbon emissions; CO2D: carbon emission damage; ECI: economic complexity; ECF: ecological footprint; ENS: energy security; EVT: environmental control technology; RWN: renewable energy.
Panel cointegration tests.

Note: ***, ** and * imply the rejection of the null hypothesis at the 1%, 5% and 10% significance levels, respectively.
Source: Authors’ computations.
Table 5 illustrates the estimates of the two cointegration procedures adopted in this study for all the models. Consequently, the results underscore that the enlisted panel series in all the models representing EQ have a long-run coevolution. Therefore, this indicates the rejection of the null hypothesis of no cointegration. However, it is imperative to highlight that except for model 1 (lnecf = (lnens lnrwn lneci lnevt lnafl lnpop), there is evidence of weak cointegration among the panel series judging from the Westerlund cointegration procedure. This outcome further highlights the need for the application of the non-linear (PQREG) model, which will provide robust outcomes with far-reaching implications for environmental performance in E7 countries. Furthermore, in Table 6, we provide the results of the PMG-ARDL and CS-ARDL procedures that account for both the long- and short-term impacts of individual explanatory variables on the response variable.
PMG-ARDL and CS-ARDL estimates.
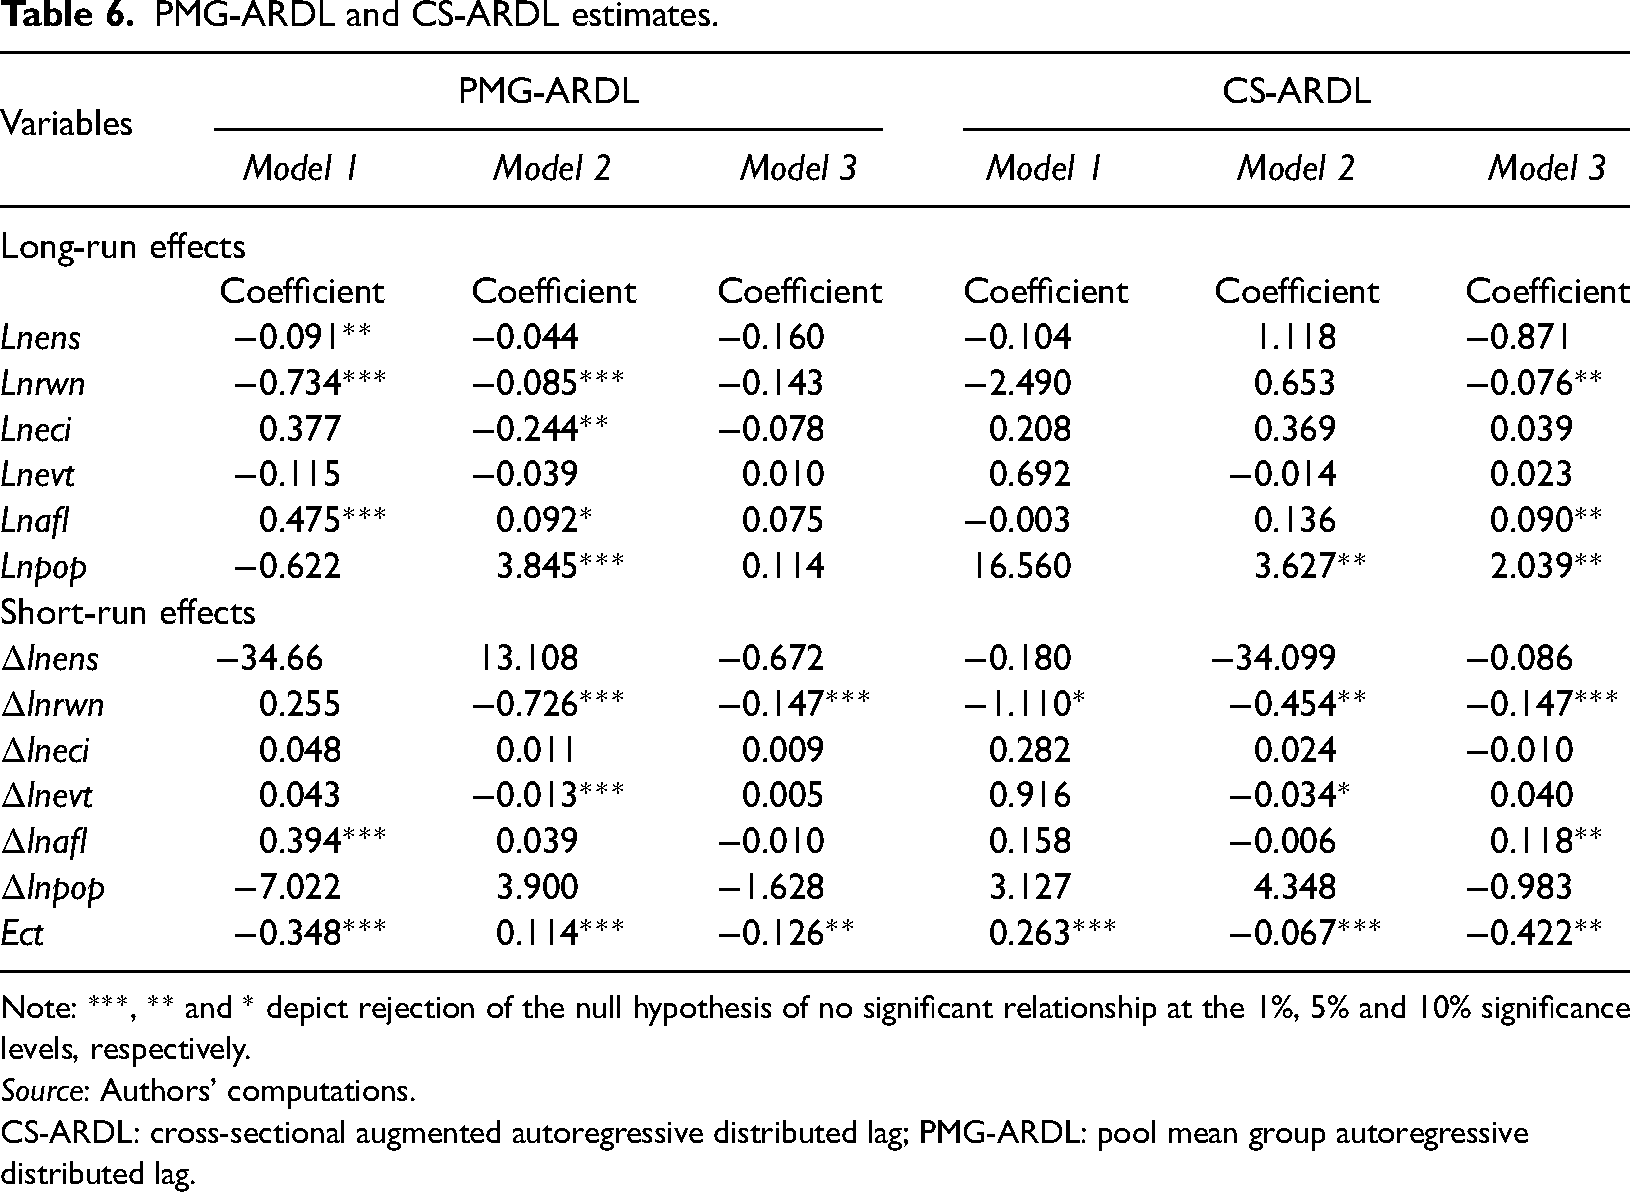
Note: ***, ** and * depict rejection of the null hypothesis of no significant relationship at the 1%, 5% and 10% significance levels, respectively.
Source: Authors’ computations.
CS-ARDL: cross-sectional augmented autoregressive distributed lag; PMG-ARDL: pool mean group autoregressive distributed lag.
The analysed results emanating from the PMG-ARDL and CS-ARDL highlight some interesting features that are critical for devising robust environmental sustainability pathways in E7 countries. Accordingly, each of the three selected EQ indicators (ECF, CO2D and CCO2) are represented as separate models (1–3) in that other. On account of the PMG-ARDL, it is established that ENS provides significant long-term impediments to carbon emissions in the E7 countries, mostly on ECF. Specifically, a one-per cent improvement in ENS results in an approximately 9% significant decline in the ECF. However, when the other two EQ indicators (CO2D and CCO2) are considered, ENS provides insignificant declining effects on them. This finding buttresses that its effects are sensitive to variants of EQ indicators, which also marks the significant contribution of this study. This outcome aligns with the reports of Bilgili et al. 26 and Zhao et al., 21 which buttress that ENS enhances EQ in selected Asian countries and China, respectively. These two studies failed to consider other variants of pollution indicators. RWN consumption enhances EQ in E7 countries irrespective of the variant of the EQ indicator considered. However, it is pertinent to highlight that RWN consumption failed to produce significant reducing effects on CCO2. Accordingly, this outcome invalidates the report of Akadiri et al.; 12 however, it corroborates the reports of several other studies.17,18
Furthermore, ECI and EVT also provide varying effects when different pollution indicators are considered. For instance, ECI provides a significant carbon neutrality pathway when CO2D is considered, while it provides an insignificant reducing effect on CCO2. However, the empirical analysis indicates that ECI impedes ecological balance when the ECF is considered. EVT also provides insignificant carbon neutrality pathways in E7 countries when the ECF and CO2D are considered, while it produces insignificant but long-term positive environmental pollution effects. This suggests the inadequacy and lack of penetration of EVT in mitigating environmental pollution. This poor outcome of EVT highlighted above validates some prior studies (Awosusi et al. 15 ); however, it is at variant with the submissions of Nguyen et al. 35 and Xin et al. 36 in the context of G-20 and the US economies, respectively. The outcome also highlights the appealing attributes of considering different variants of EQ indicators that promise streamlined policy strategies leading to comprehensive carbon neutrality pathways in E7 countries. Likewise, affluence and population constitute significant EQ degrading effects in E7 countries with varying effects across the variants of pollution indicators. However, on average, their EQ degrading effects outweigh their insignificant appealing effects. Furthermore, the short-term effects are largely inconsistent and vary considerably across variants of pollution indicators. However, it is pertinent to highlight the consistent EQ enhancing attributes of RWN that cut across all the selected pollution indicators, except the ECF. Overall, there is evidence of long-run steady-state convergences to equilibria given that all the error-correction terms are negative and significant.
The outcomes of the CS-ARDL for each model, which serves as a robustness check on the PMG-ARDL estimates, are largely consistent with the estimates of the PMG-ARDL, but there are minor dissimilarities that are not strong enough to dispute the outcomes of the PMG-ARDL. The observed consistencies in the estimates of the two models buttress the robustness of the study and consequential robustness of policy prescriptions thereof. Regardless of the outcomes of these estimates, the study elected to probe further principally to ensure that the influence of structural breaks is adequately captured. In this end, the PQREG was adopted accordingly given its appealing attributes, as highlighted earlier.
The estimates of the non-linear model (PQREG) that accounts for the effects of structural breaks and non-linear interactions among the explanatory and response variables are shown in Table 7. The estimate is based on the effects of the explanatory variables of each EQ indicator over the 25th, 50th, 75th and 95th quantiles. The PQREG analysis depicts several interesting outcomes highlighting its efficiency in stimulating robust empirical imperatives relevant for cutting-edge policy prescriptions. Accordingly, ENS possesses environmental enhancing attributes across the quantiles except at the 75th and 95th quantiles, where it escalates ecological deficits significantly. In essence, caution must be applied not to allow the ENS nosedive to thresholds where it cannot guarantee a cleaner environment. Therefore, policymakers must ensure that ENS is sustained or surpasses the 50th quantile, where it provides optimal environmental enhancing effects.
Panel quantile regression estimates.
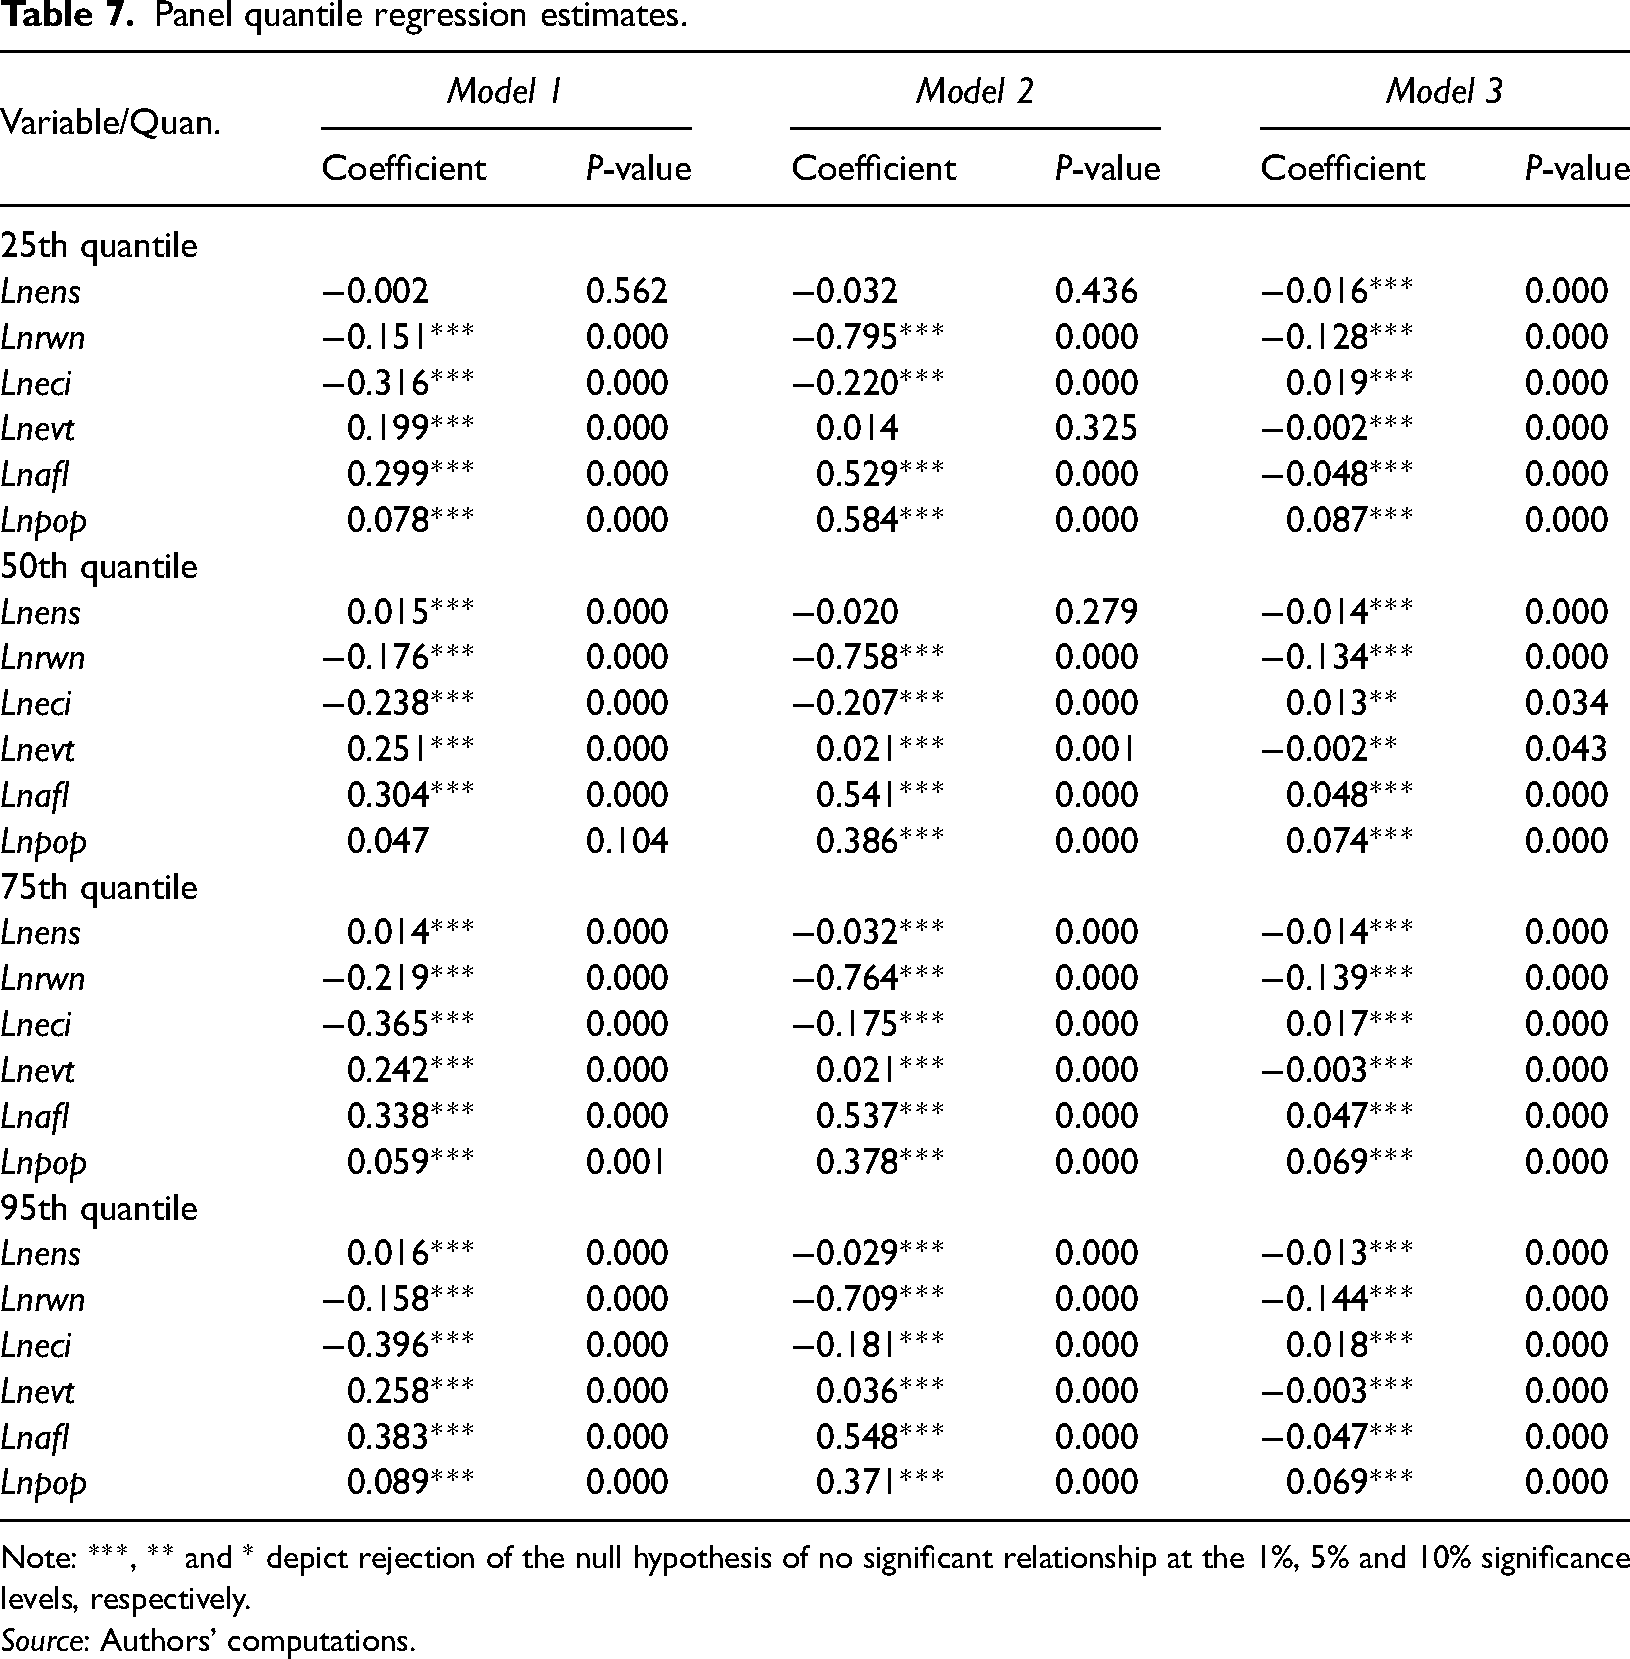
Note: ***, ** and * depict rejection of the null hypothesis of no significant relationship at the 1%, 5% and 10% significance levels, respectively.
Source: Authors’ computations.
Similar to the outcomes of the PMG-ARDL and CS-ARDL, the PQREG estimates reinforce the environmental enhancing attributes of RWN across all the quantiles considered. Thus, policies that could ensure the continuous development, deployment and consumption of RWN in these countries are critical for sustainable environments. Furthermore, ECI also possesses notable significant EQ enhancing attributes at all quantiles of ECF and CO2D; however, it contributes positively and significantly to CCO2. EVT provides varying positive and negative effects on EQ across the quantiles. Specifically, it deescalates CCO2 significantly at the 25th, 50th and 95th quantiles and CO2D at the 75th quantile. However, it significantly impedes EQ across the quantiles, and all pollution indicators are listed herein. This largely underscores the divergent submissions of prior studies in terms of the varying effects of EVT on EQ. This further reinforces the need to consider different pollution indicators for streamlined policy strategies. Thus, varied policy options are essential if E7 countries must reap the full potential of EVT at all times. Moreover, if the variable must deliver its full potential, it is pertinent to remark that more investments are needed to develop and deploy more ECTs in E7 countries. Economic growth and population maintained their negative effects on the environment across all quantiles except for a significant reducing influence on CCO2 at the 25th and 95th quantiles. This demonstrates that E7 countries have continuously traded sustainable environments for rising affluence and population. Thus, to attain the relevant SDGs 7, 11, 12 and 13 and in compliance with the relevant treaties, E7 countries must vigorously pursue and outlined policies that ensure a balance between affluence, population and sustainable environment.
Conclusion and policy implications
A clean environment remains a top priority of all modern economies and therefore cannot be overemphasized. Meanwhile, the E7 countries must not be left behind. Several critical factors have been considered determinants of EQ in several economies, but the issue is still unresolved. Furthermore, very few efforts have been extended to unravelling the relevant enablers of EQ in the context of E7 countries. Furthermore, variables such as ENS, RWN and EVT are largely understudied, mostly as they affect EQ in E7 countries. Against this backdrop, this study took several holistic steps to provide fresh insights in this direction. First, the study enlisted the above explanatory variables as well as economic growth and population to provide a modified STIRPAT framework for E7 countries on the instances of three EQ indicators that were not considered in prior studies. Second, the study provides robust empirical narratives by analysing annual panel series spanning 1990–2018 with three enhanced panel estimators, including the PMG-ARDL, CS-ARDL and PQREG.
In the above premise, several empirical discoveries emerged. First, the estimates from all the models rectified that ENS possesses varying environmental enhancing attributes peculiar to different EQ indicators. However, its most significant soothing effects occurred within the 50th quantile based on the outcome of the PQREG. Therefore, it is instructive to ensure more commitment to ensuring ENS in E7 countries. Second, RWN consumption provides a robust decarbonization pathway for E7 countries, thereby necessitating the compelling need for more investments in that direction. Third, ECI possesses some varying environmental enhancing attributes peculiar to the EQ indicator considered, while it remains inimical in some other indicators. Therefore, pleasant environmental outcomes await the ecosystem in E7 if more efforts are channeled to ensuring a more transformed economic outlook through the adoption of environmentally friendly production techniques. Fourth, the E7 countries have yet to reap the full benefits of EVT given its unimpressive effects on EQ. It is therefore imperative to ensure that the depth of EVT in E7 countries improves such that its full benefits are appropriated. Last, economic growth and population density maintained all-time negative influences on EQ in E7 countries.
Given the above discoveries and peculiarities of these emerging countries, policymakers are therefore encouraged to provide workable strategies that will ensure that the increasing affluence and teeming population of E7 countries respond to the environmental sustainability drive at all times. Therefore, investing a greater proportion of such income in green technologies and building human capital could salvage the ugly situation. In summary, the outcomes of this empirical study remain robust within the context of the E7 countries and the period investigated. However, more robust estimates could emerge when other economies are considered or when the data scope improves. Therefore, future research in this direction is encouraged. 69
Footnotes
Author’s contribution
All the authors contributed significantly in varying proportions in the various sections of the study. Likewise, all the authors read and approved the final draft of the manuscript.
Declaration of conflicting interests
The authors declared no potential conflicts of interest with respect to the research, authorship, and/or publication of this article.
Funding
The authors received no financial support for the research, authorship, and/or publication of this article.
Data availability statement
The datasets generated during and/or analysed during the current study are available from the corresponding author upon reasonable request.