



Abstract
To explore the core mechanisms of green synergistic development in China in the context of transition, this study takes 30 Chinese provinces and cities as a sample. Additionally, it is the first study to include digital finance, green finance, and ecological governance in the same research framework, and it innovatively explores the internal linkages between them from the perspective of systemic coupling and dynamic correlation. The study finds that the levels of digital finance, green finance, and ecological governance at the provincial level in China are all increasing to a certain extent. The coupling coordination degree between the three shows a development trend first rising and then falling in a transitional stage between barely coordinated and high-quality coordination, with developed regions having a higher coupling coordination degree, and less developed regions having a lower coupling coordination degree. From the dynamic correlation perspective, digital finance, green finance, and ecological governance all have a positive self-reinforcing effect, with the interaction effects being positively significant, except for the non-significant contribution of green finance to the level of digital finance and ecological governance. This study makes a series of theoretical suggestions that can optimize the transition path based on the reality of China's green development.
Introduction
Under traditional high-carbon production methods, high socio-economic development comes at the high cost of excessive energy consumption. For example, China's total GDP increased from RMB 9.9 trillion in 2000 to RMB 101.4 trillion in 2020, with coal accounting for over 50% of Chinese society's energy consumption and oil accounting for 20% of the total. 1 As green development continues to grow, to bridge the gap between the high economic speed and high efficiency, traditional social production methods are undergoing a green transformation and ecological management. 1 In recent years, most scholars have focused on the formation, development, and application of digital finance and green finance, which is a collaborative governance tool in the context of green transformation, while linking them closely to ecological and environmental governance. It is argued that digital finance significantly improves the overall energy and environmental performance of society by enhancing the capacity for green technological innovation 2 and that it also has a significant upgrading effect on regional low-carbon development and inclusive growth. 3 Furthermore, as a financing backstop for ecological governance, green finance effectively solves the problems of complex and expensive financing for regional ecological development. It has a more apparent overall effect on green investment. 4 Some scholars also argue that the effect of green finance on regional eco-efficiency is non-significant and that for developed regions, it may even create a weak inhibitory effect. However, it can significantly improve eco-efficiency in less developed regions. 5 In the context of transformation, existing studies suffer from a lack of coordination of multi-directional governance approaches and the lack of significant correlation between them. Additionally, the intrinsic relationship between digital finance, green finance, and ecological governance has been insufficiently explored. There is also controversy over the judgment of their relationship orientation, and there is a serious lack of understanding with regard to the spatial evolution, coupling and coordination, interaction, and dynamic correlation between digital finance, green finance, and ecological governance, thus providing a new research perspective and logic for this study.
Based on synergy theory in systems science, this study considers China's digital finance, green finance, and ecological governance as three subsystems in the context of transformation. Additionally, it explores the synergistic mechanisms among the three subsystems, intending to make a significant theoretical contribution to China's green synergistic development. The key innovations and research contributions of this study are as follows: First, by reviewing the literature and constructing a scientific and reasonable index evaluation system, the entropy value method is used to measure the index levels of digital finance, green finance, and ecological governance at the provincial level in China, while the evolutionary trends of the three are examined based on kernel density estimation over the study period. Second, the coupling model measures the degree of coordination between digital finance, green finance, and ecological governance to observe the synergy between the three in terms of the spatial and temporal distribution. Finally, considering the theoretical endogeneity problem among digital finance, green finance, and ecological governance, a panel vector autoregressive (PVAR) model, which can solve the endogeneity problem, is selected. The Granger causality test, generalized method of moments (GMM) estimation, impulse response plots, and variance decomposition are specifically used to analyze the dynamic correlation and interaction effects of the variables.
Literature review and theoretical mechanisms
Green synergistic development is essentially an impact mechanism formed by the coordination of internal elements in the green development process and the synergy of external regions. It can transform the traditional high-carbon production mode and build a green-low-carbon-recycling development economic system, ultimately achieving the coordinated development of climate action, environmental protection, the economy, and society. 6 Furthermore, based on the synergy theory perspective, any complex, extensive system is composed of several interacting or linked subsystems. Under certain conditions, spatial and temporal equilibrium is achieved through adaptation and coordination between subsystems. 7 This study innovatively considers green synergistic development in the context of transition as a large and complex system while considering digital finance, green finance, and ecological governance as its intrinsic subsystems. It conducts an in-depth analysis of the complex forces and synergistic mechanisms that they constitute.
Research on the relationship between digital finance, green finance, and ecological governance has the following main dimensions. (1) In research on the relationship between green finance and digital finance, green finance is a manifestation of the “greening” transformation of the financial industry. In contrast, digital finance is a manifestation of the “digital” upgrading of the financial industry. There are essential differences in the connotation between the two, but at the same time, there are also non-negligible linkage effects. 8 The findings of existing studies clearly show that digital finance is beneficial for deepening the integration of consumption in the virtual and real sectors, increasing the market dynamics of green financial consumption to a certain extent, optimizing the efficiency of the offline transaction model inherent in the traditional financial industry, 9 and indirectly increasing the motivation of financial institutions to take responsibility for the environment, which is an essential enabler for the development of green finance. 10 It has also been shown that if financial institutions lack the necessary green literacy, this can result in exclusionary behavior towards digital finance and be detrimental to the digital transformation of finance. 11 (2) In research on the relationship between green finance and ecological governance, the starting point for the development of green finance is to solve the financing problem in the ecological governance process, to stop ecological degradation, and to accelerate the low-carbon transformation of the economy by increasing the output of the clean sector. 1 As a core driver of ecological governance, green finance can mitigate rising CO2 levels and ecological degradation by expanding green investments at the forest expansion and governance levels, which in turn can contribute to economic growth.12–15 Moreover, green finance has significant ecological governance effects that are reflected at the micro level, such as optimizing resource allocation, promoting industrial structure upgrading, and enhancing technological innovation capacity.16–18 (3) In research on the relationship between digital finance and ecological governance, digital finance will, to some extent, enhance regional green technological innovation capacity and further provide strong support for energy and environmental performance. 2 The advantages of digital finance as a macro-regulatory tool for environmental pollution management are highlighted by portable new financial market-based operational models such as mobile payment and online offices, which minimize the transaction costs in the ecological governance process and correspondingly reduce the rate of consumption of limited resources. 19 In addition, the flexibility and inclusiveness of digital finance can stimulate public participation in governance, which is essential for solving a series of challenges such as low public green participation. 20 Digital finance has also provided environmental service platforms such as the “Ant Forest” and “Idle Fish” for ecological governance, improving the efficiency of ecological governance and resource recycling. 21
In terms of the systemic components of green synergistic development in the context of transformation, digital finance, green finance, and ecological governance will have circular effects and feedback mechanisms. When all three are in a positive state of development, the positive cycle and positive feedback between the subsystems will produce synergistic effects and jointly promote the efficiency of the overall system. Suppose that the development of any one of the subsystems is stalled. In that case, it will breed adverse effects such as a “reverse cycle” and “negative feedback,” and the operation of the overall system will even be restricted. 22 The literature review above shows that existing studies are more concerned with two of the three green finance, digital finance, and ecological governance subsystems. Few studies are directly concerned with the three subsystems, and there is a lack of understanding of the synergistic development mechanisms between them. This study explores the macro effects of such system relationships by introducing the coupling model, which has been widely used in economics and management in recent years. This model uses the coupling coordination degree to reflect the properties and degree of interconnection and interaction between systems. 23 The use of this model is a situational adaptation and fits the much-needed expansion of research on the conjectural relationship between digital finance, green finance, and ecological governance. On this basis, studying the interaction effects of the variables using the PVAR model holds great practical significance and theoretical value.
Index evaluation system construction and research methodology
Index evaluation system construction
A scientific and convincing index evaluation system is constructed based on reviewing the cutting-edge literature. At the current stage, green finance is mainly an evaluation system consisting of green credit, green securities, green insurance, green investment, and carbon finance, synthesizing the characteristics of inter-provincial panel data and mainstream practices. The specific indicators are constructed as follows4,24: green credit uses the ratio of interest expenditure on energy-intensive industrial industries to total interest expenditure on industrial industries above a specific size as a defining indicator. Second, drawing on the majority of scholars who have used green securities as a component of green finance evaluation, the ratio of the market capitalization of A-share listed enterprises in energy-intensive industries to the total market capitalization of A-share listed enterprises is used. As an essential aid to green credit, green insurance is measured by the ratio of agricultural insurance income to property insurance income as the evaluation index. In addition, the development of green finance is inseparable from the strong support of the government, and the ratio of fiscal expenditure on energy conservation and environmental protection to general fiscal budget expenditure is selected as a green investment consideration indicator. Finally, the ratio of CO2 emissions to the loan balance of financial institutions is used as an essential supplement to the level of carbon finance. Digital financial indicators mainly use the digital financial inclusion index and its constituent elements, i.e., the breadth of coverage, depth of use, and degree of digitalization. To minimize the difference between indicator values, the indicators are logarithmically processed. 25 For the ecological governance indicators, drawing on the studies of Zhou et al. 26 and Li et al., 27 five main dimensions, that is, urbanization and socio-economic energy consumption, green industrial governance, the green living of residents, government environmental regulation, and ecological resources and the environment, are used. Among them, urbanization and social and economic energy consumption are expressed in terms of the urbanization rate and total social energy consumption. Green industrial governance is expressed in terms of the industrialization level, the treatment capacity of industrial waste gas treatment facilities, the extensive use of industrial fixed waste, and the treatment capacity of industrial wastewater treatment facilities. The green living of residents is expressed in terms of the regional urban sewage treatment rate and the harmless treatment of domestic waste. Government environmental regulation is expressed in terms of the harmless treatment of domestic waste. Finally, ecological resources and the environment are expressed in terms of the forest coverage rate, per capita water resources, and the erosion control area (logarithmically processed).
Considering a large number of missing data for Tibet, Hong Kong, Macau, and Taiwan, they are not included in the study sample. Therefore, 30 Chinese provinces and cities are used as the study population, and the study period is set from 2011 to 2020. The green finance indicators are mainly sourced from the China Statistical Yearbook, China Financial Statistical Yearbook, and China Insurance Statistical Yearbook. The digital finance indicators are mainly sourced from the Digital Finance Research Centre of Peking University. The ecological governance indicators are sourced from the China Statistical Yearbook and China Environmental Statistical Yearbook. The missing annual indicators for some provinces are filled in through interpolation.
Research methodology
The entropy value method was used to measure the comprehensive indices of digital finance, green finance, and ecological governance for each province. In contrast, two main models, the coupling model, and the PVAR model, were used to analyze in depth the coupling relationship and the association mechanism between the three research themes. The details are as follows:
(1) Entropy value method. Based on the existence of positive and negative differences between each indicator, we first need to carry out the forwarding process. At the same time, to exclude the influence of the difference in the scale, the original data need to be homogenized. Taking the green financial index as an example, the calculation formula is as follows
26
: (2) Coupling model. Assuming that M is the digital finance index, G is the green finance index, and E is the ecological governance index and drawing on Yin and Xu,
28
the formulas are as follows: (3) PVAR model. The PVAR model is a multivariate system equation that combines the vector autoregressive (VAR) model in the time series with panel data, treats all variables as an endogenous system, and examines the lagged terms of each variable. In doing so, the PVAR model can truly reflect the interaction between variables and effectively portray the shock response and variance decomposition among system variables.
30
The general form of the model is as follows:
In equation (1),
In equation (4),





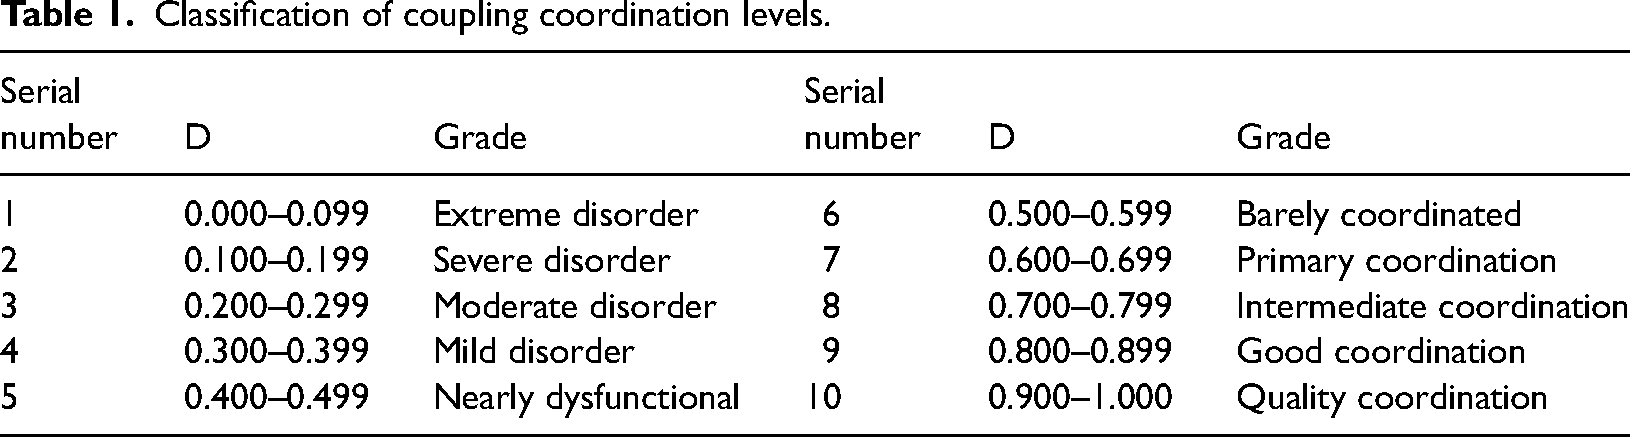
Classification of coupling coordination levels.
In equation (5),
Analysis of the empirical results
Kernel density analysis of the empirical results of the entropy value method
Based on the above index evaluation system construction and research methodology, Stata 16.0 was used to measure the digital finance, green finance, and ecological governance indices of 30 provinces in China from 2011 to 2020. To present a complete picture of the development differences, distribution dynamics, and evolutionary patterns of the above indices at the regional level, kernel density estimation was used to analyze each index. The horizontal coordinates indicate the magnitude of each index, and the vertical coordinates indicate the kernel density of each variable. Considering that there are 10 years in the period under study, to avoid situations in which the trend lines of the kernel density plots of different years cross and are misplaced due to a large number of years, the even-numbered years (2012, 2014, 2016, 2018, and 2020) were selected to explore the evolutionary dynamics of each index. The specific results are shown in Figure 1.
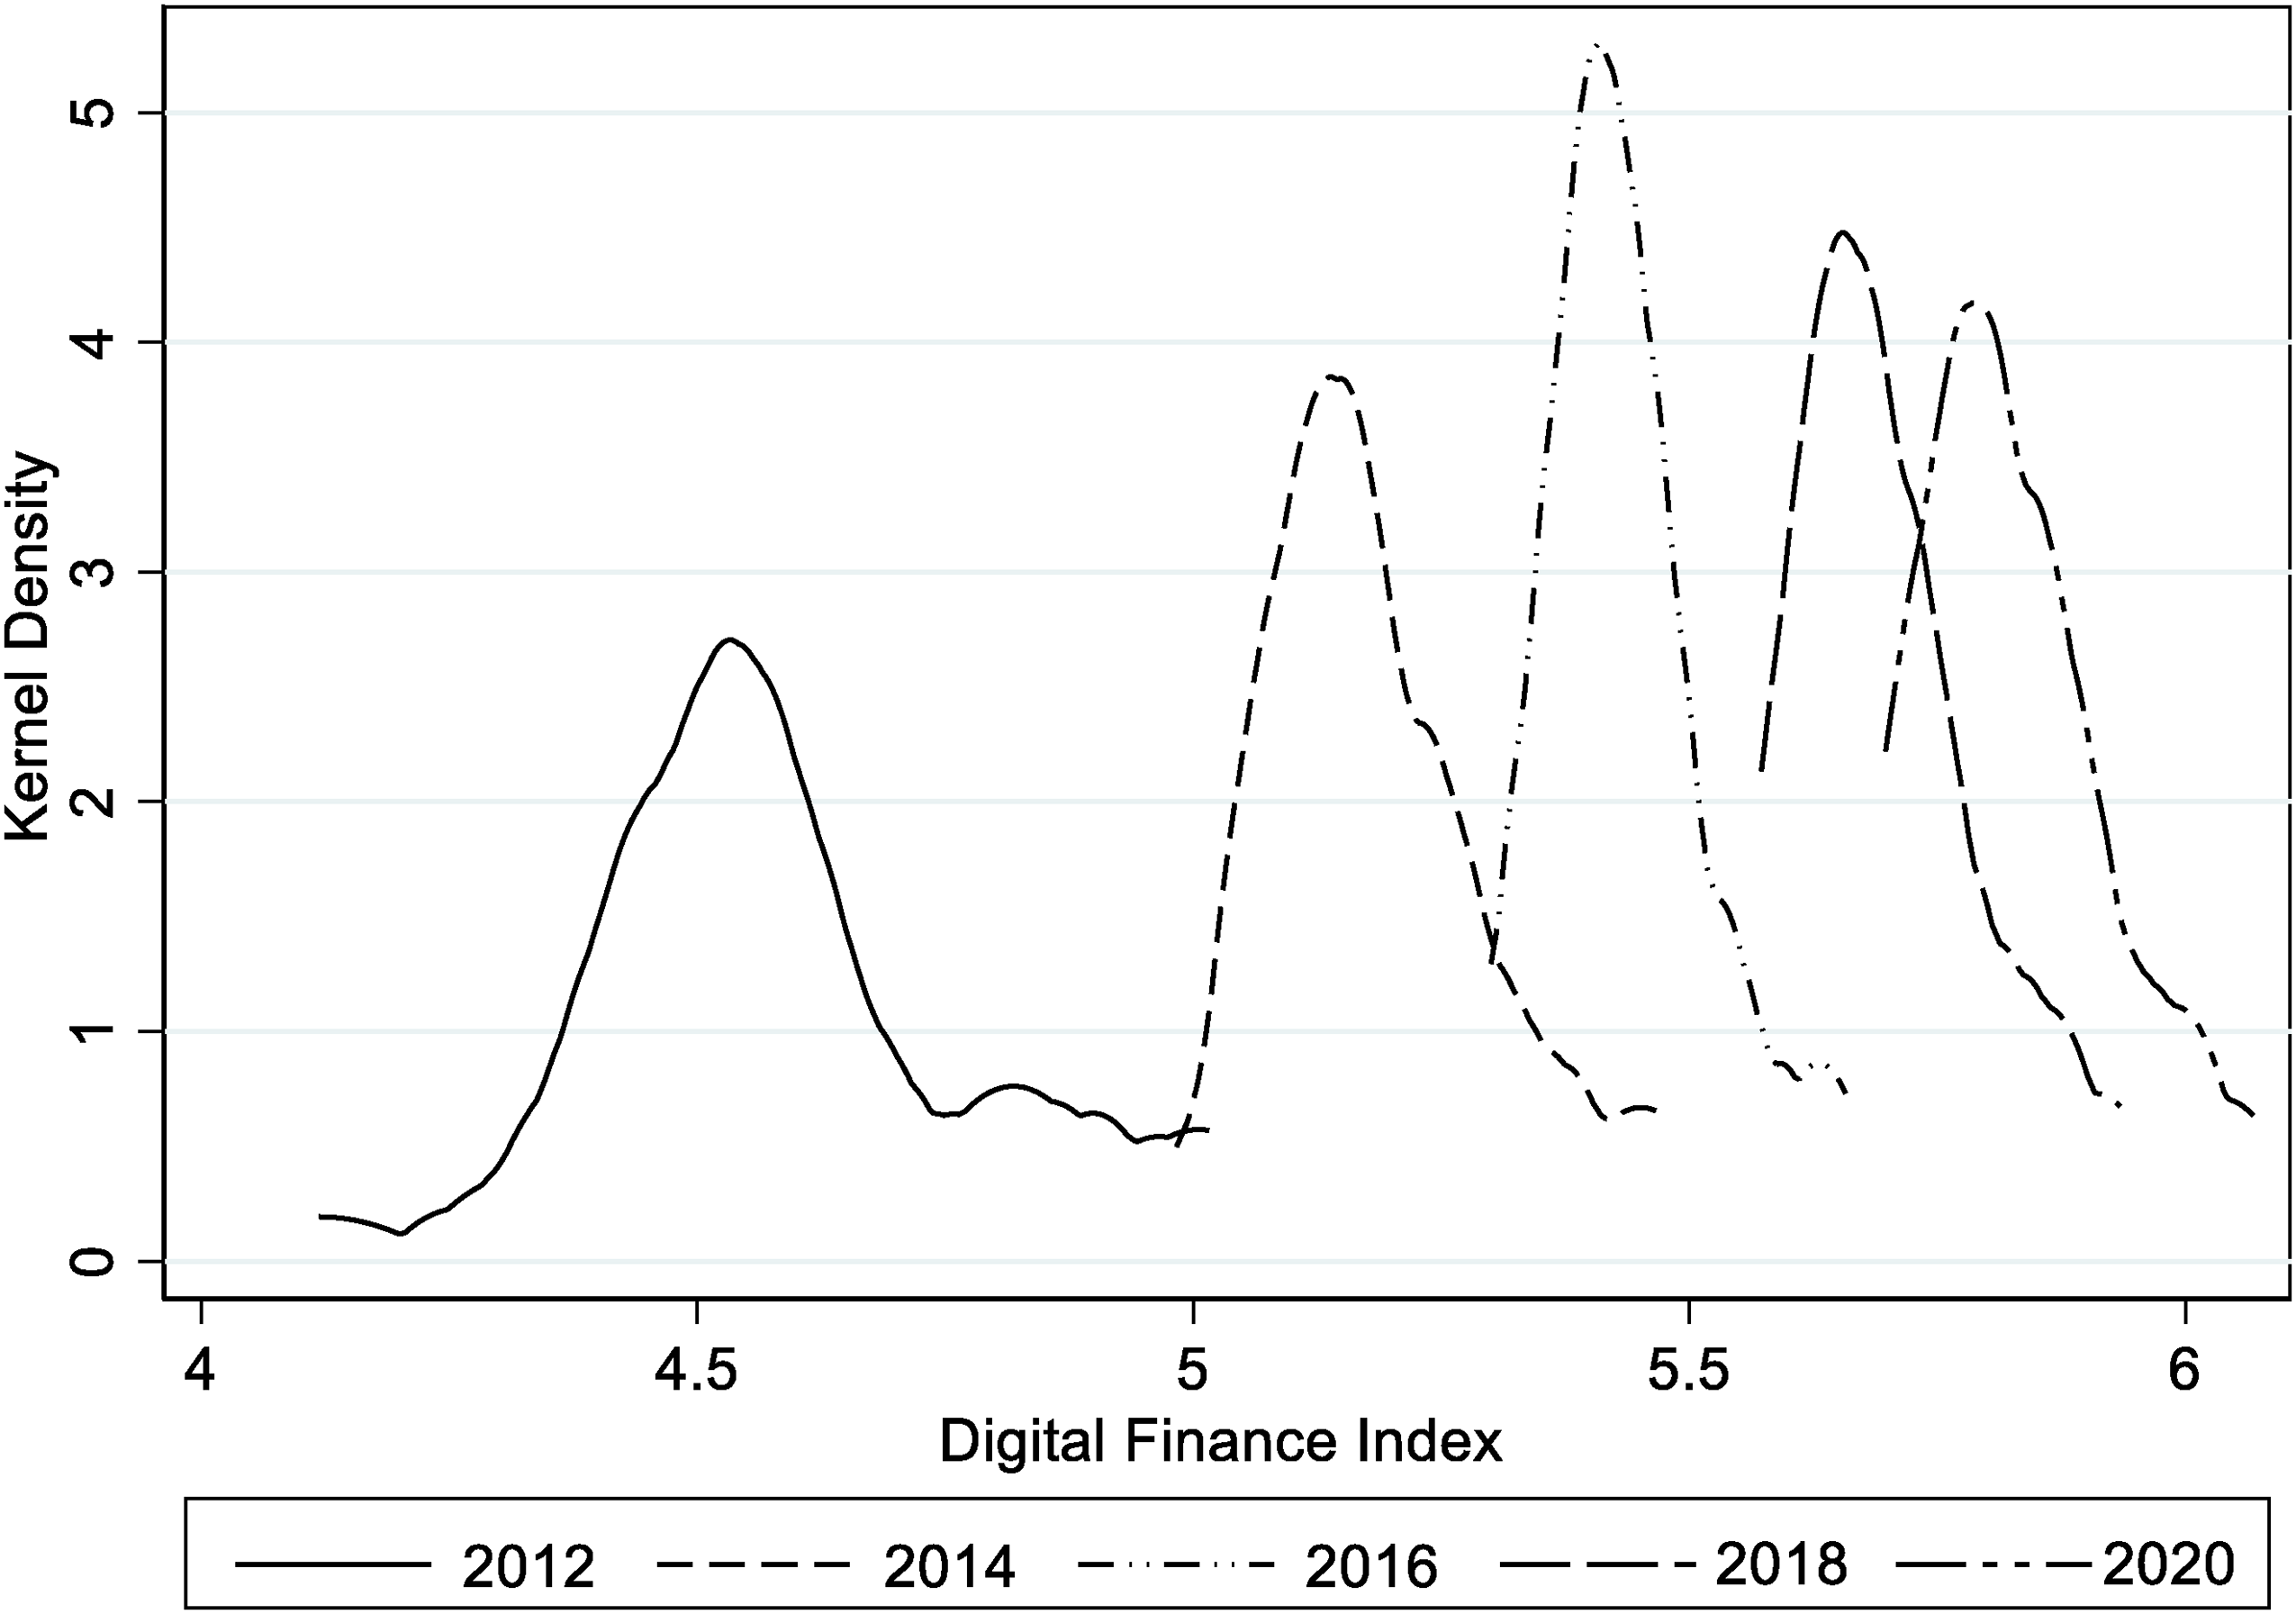
Kernel density estimates for the digital finance index.
The digital finance indices of the provinces and cities showed a more pronounced evolutionary pattern over the study period, as depicted in Figure 1. Overall, the development of digital finance has the advantage of a high degree of popularity and a positive development trend, which can be analyzed based on the following points. (1) The central value of China's provincial digital finance index shows a clear upward trend, rising from approximately 4.5 in 2012 to approximately 5.7 in 2020. These results indicate that the effect of the spread of China's financial digitalization level was highly significant during the study period. (2) There are significant differences in the peak of the digital finance index in different years, showing a trend of first increasing and then decreasing, that is, the concentration of digital finance at the provincial level first increases and then decreases. (3) During the study period, the width of the wave narrowed gradually over time, reflecting that the gap in the level of digital financial development between provinces and municipalities gradually decreased and showed a state of equilibrium between regions. There was no two-wave phenomenon, that is, no polarization in the level of financial digitalization.
The dynamic evolution of the green finance index over the study period is shown in Figure 2. In chronological order of development, the central value of the density function of the green finance index for each province is concentrated around 0.1. At the same time, there is a tendency to move to the right, but the movement is not apparent, that is, the level of the green finance index was not high during the study period, with a weak upward trend. At the same time, there is also an overall downward trend in the crests, and the width of the crests widens, with inconspicuous double crests appearing, reflecting a further widening of the gap in green finance development between provinces and municipalities and a particular polarization. Specifically, for each year, (1) 2012 had a high peak and the smallest central value, while the span of the wave cross-axis was at its smallest, i.e., the green finance indices of each province were more concentrated and around the smallest value, with the smallest gap between the indices of different provinces. (2) The peak in 2014 was lower, and the central value did not change significantly. The span of the wave cross-axis increased slightly, that is, the concentration level of the index decreased slightly, and the gap between the indices of different provinces increased accordingly. (3) The peak in 2016 reached its highest point. The central value shifted slightly to the right, the horizontal axis span of the wave increased significantly, the green finance index of each province was in the most concentrated state, and the overall level increased. The gap between the indices of different provinces widened rapidly. (4) The peak in 2018 shows a sudden drop and a significant rightward shift of the central value, and the span of the wave cross-axis continued to increase, that is, the concentration of the index decreased, but the overall level increased. Additionally, the gap between the indices of different provinces was increasing. (5) The peak in 2020 was at its lowest value, and the central value shifted to the left. The span of the horizontal axis of the wave was at its maximum, that is, the concentration of the index was at its lowest level. Additionally, the overall level decreased, the difference between the indices of different provinces was at its maximum level, and the index values were the most dispersed.
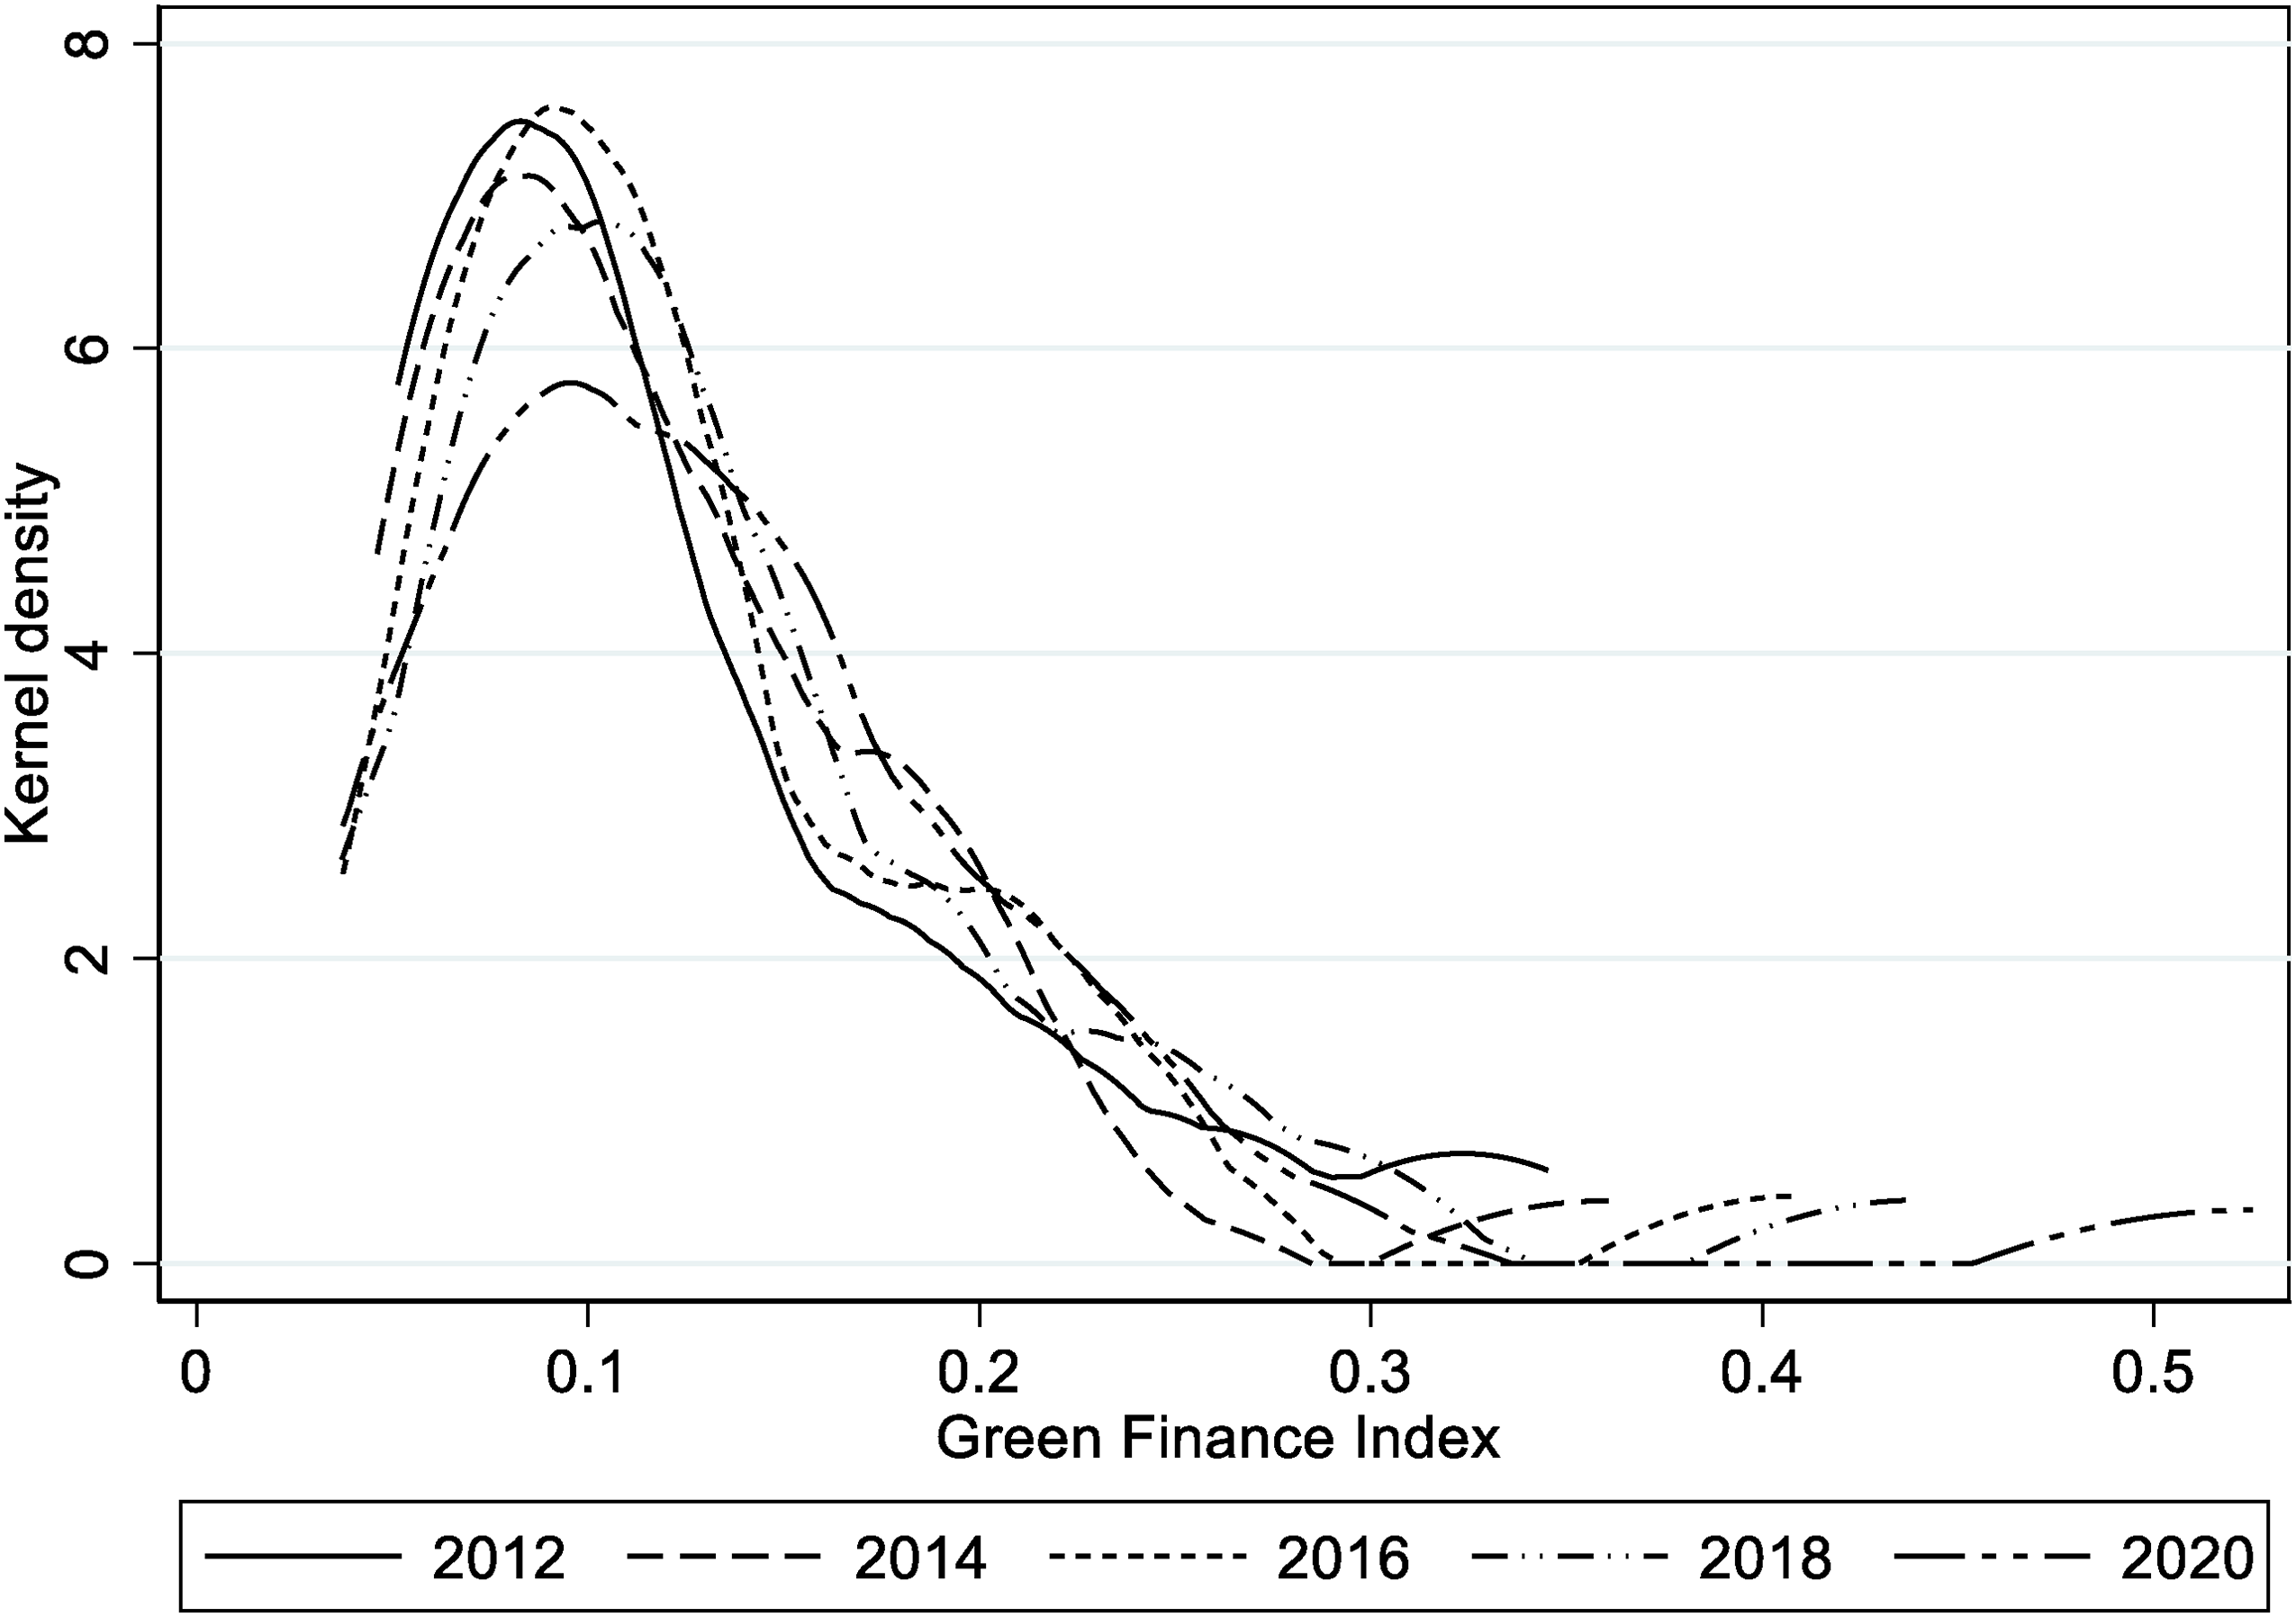
Kernel density estimates of the green finance index.
The dynamic evolution of the ecological governance index over the study period is shown in Figure 3. Overall, there is a clear rightward shift in the center of the ecological governance index peak, with the peak being higher and narrower in the early part of the wave and decreasing in width in the later part. Specifically, for each year, (1) the central value of density in 2012 was the lowest during the study period, with the peak at a higher level. Additionally, the wave spanned a minor horizontal axis, that is, the lowest overall level of ecological governance, but with a more concentrated distribution of indices and a smaller gap between different provinces. (2) The central value increased in 2014 compared with 2012, and the peak also showed a downward trend. The horizontal axis of the wave increased, that is, the overall level of ecological governance increased. The gap between the ecological governance levels of individual provinces and municipalities also further increased. (3) The central value further increased in 2016. The peak also further decreased, while the span of the wave cross-axis increased abruptly, that is, the overall level of ecological governance continued to rise. The index concentration continued to decrease, and the gap between the ecological governance levels of individual provinces and municipalities increased abruptly. (4) In 2018, the central value shifted further to the right, and the peak again plummeted. The span of the wave cross-axis decreased, meaning that the level of ecological governance continued to rise. However, the concentration of the index increased, and the gap between the levels of environmental governance in individual provinces and municipalities also rebounded. (5) The central value reached its maximum in 2020, while the horizontal axis of the wave was the largest. The peak rose compared to the previous period, that is, the overall level of the ecological governance index rose to its maximum, the dispersion of index values at the provincial level was at its highest point, and the data distribution was at its most homogeneous during the study period.
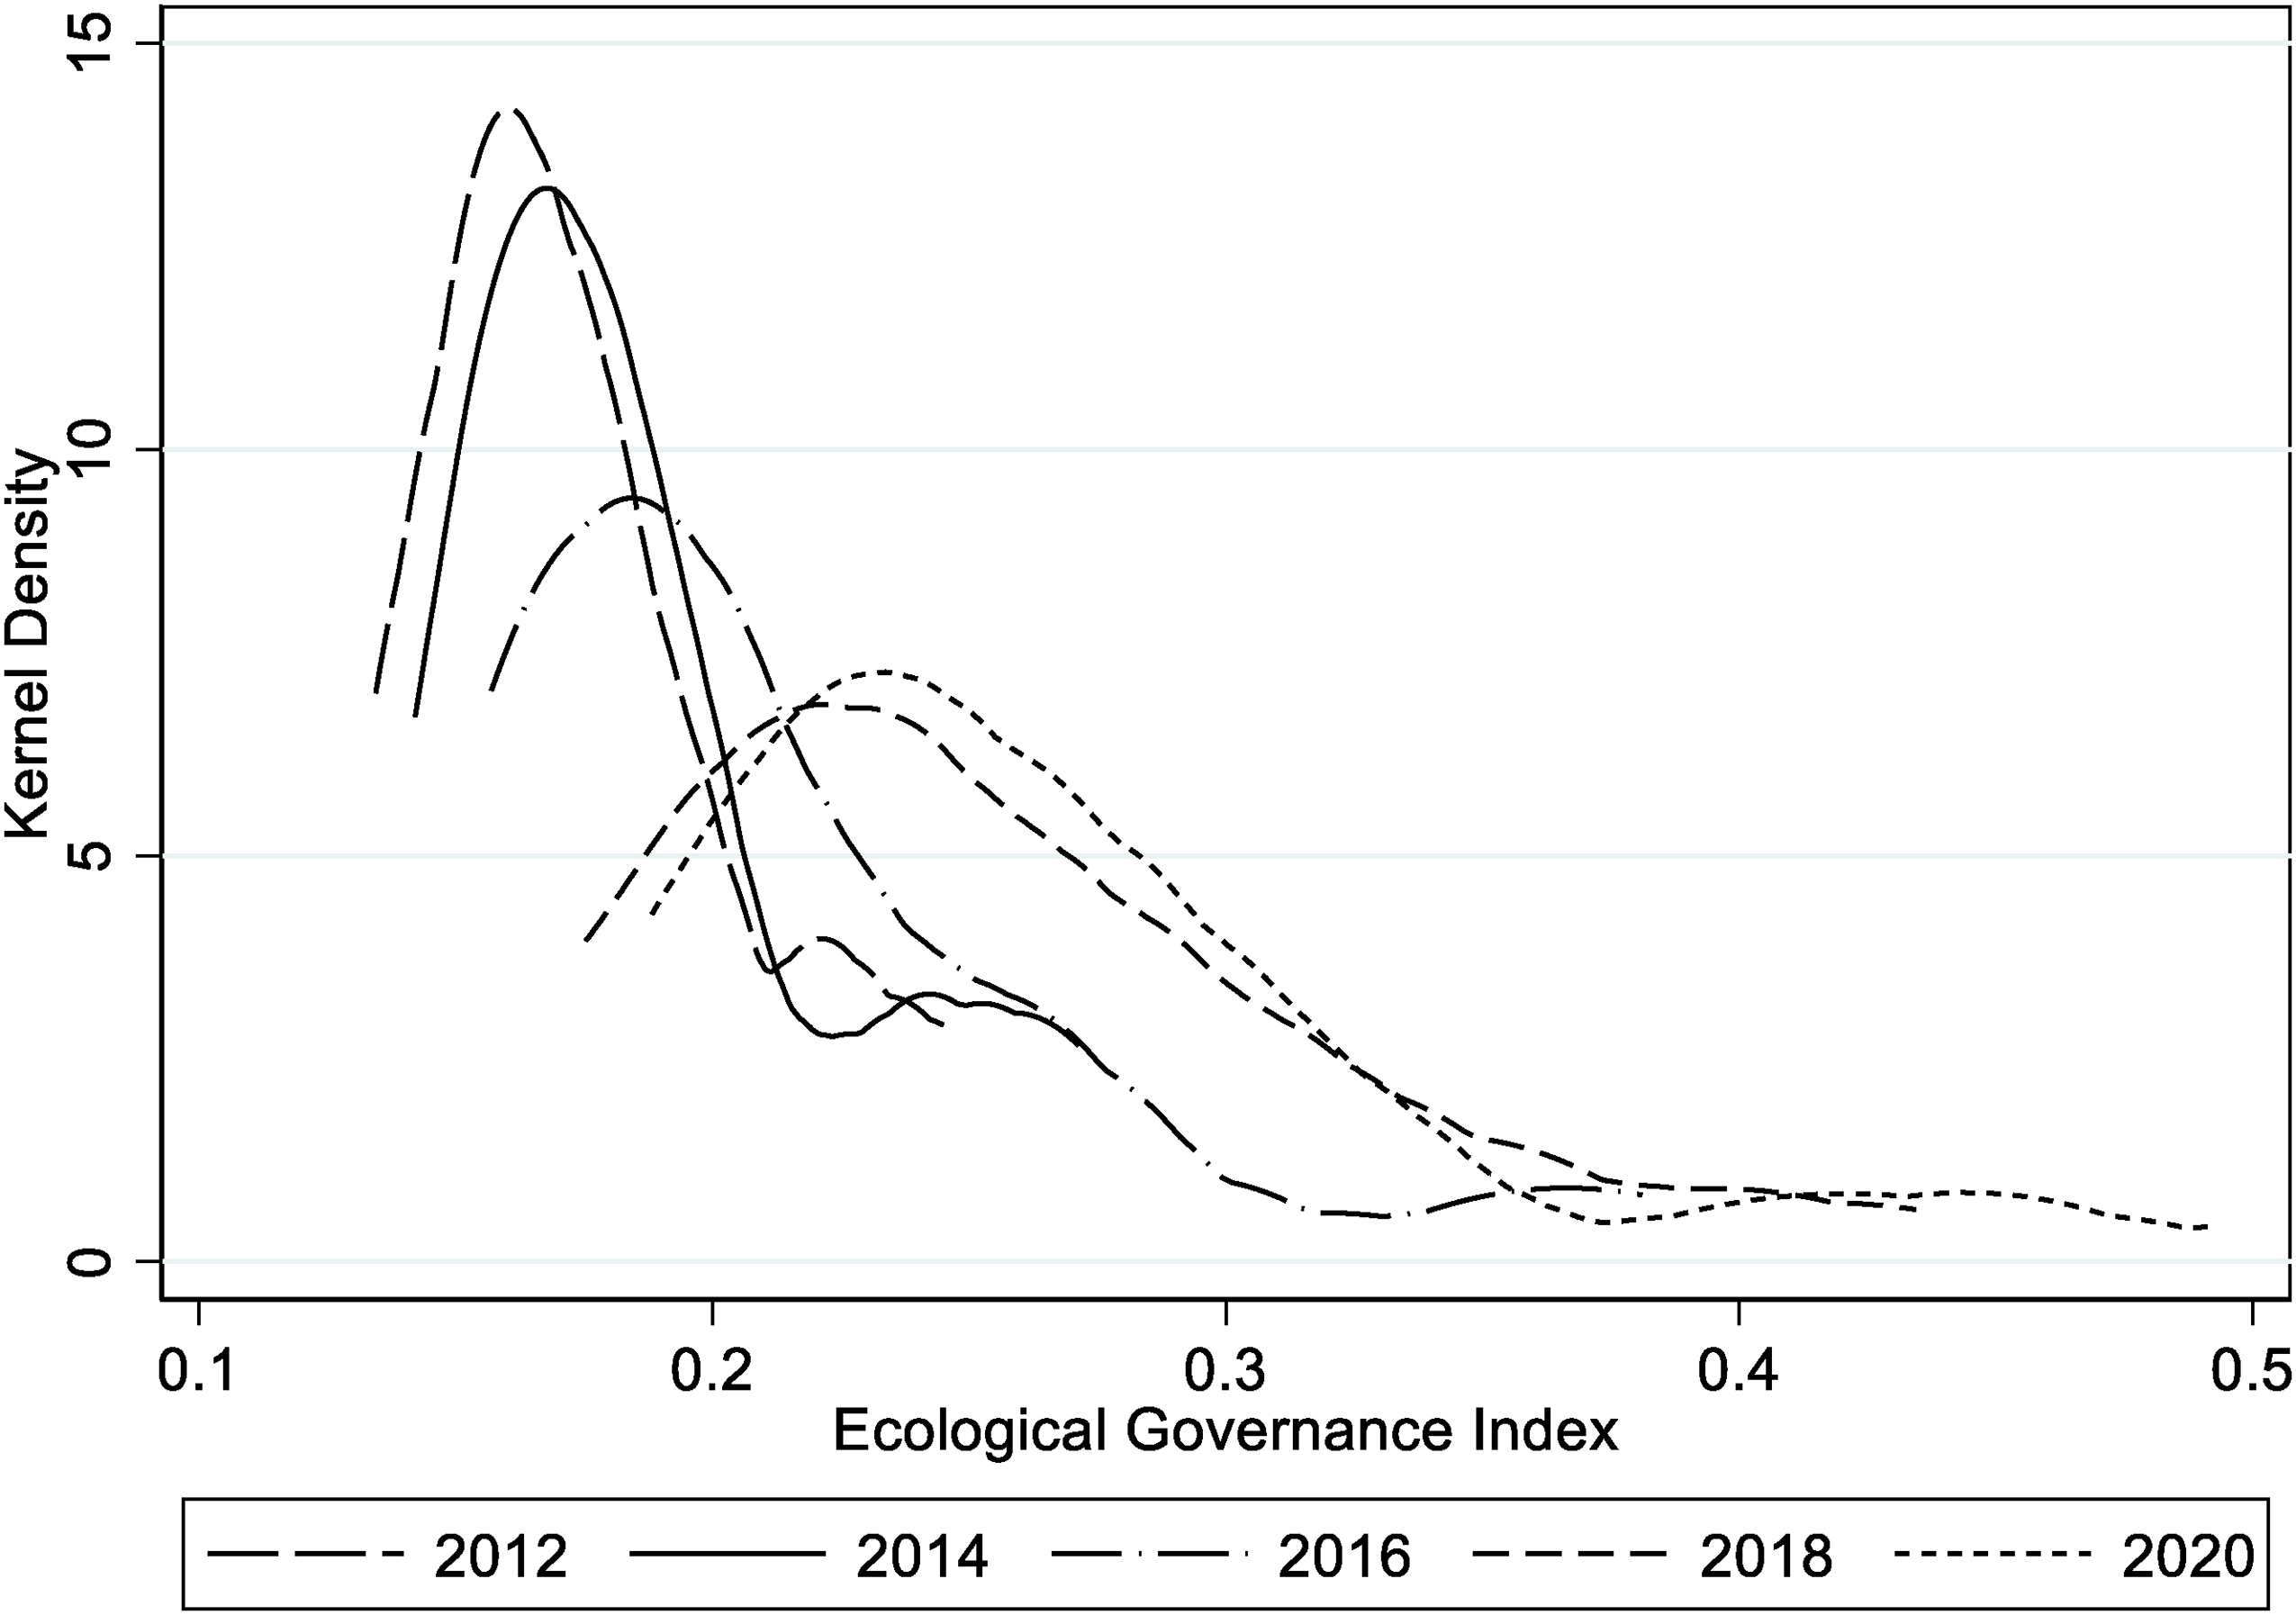
Kernel density estimates of the ecological governance index.
Analysis of coupling coordination results
As mentioned above, to explore the intricate relationship between digital finance, green finance, and ecological governance, a coupling model was used to calculate the coupling coordination degree between these three subsystems. The results are given in Table 2.
Provincial coupling coordination degree in China, 2011–2020.
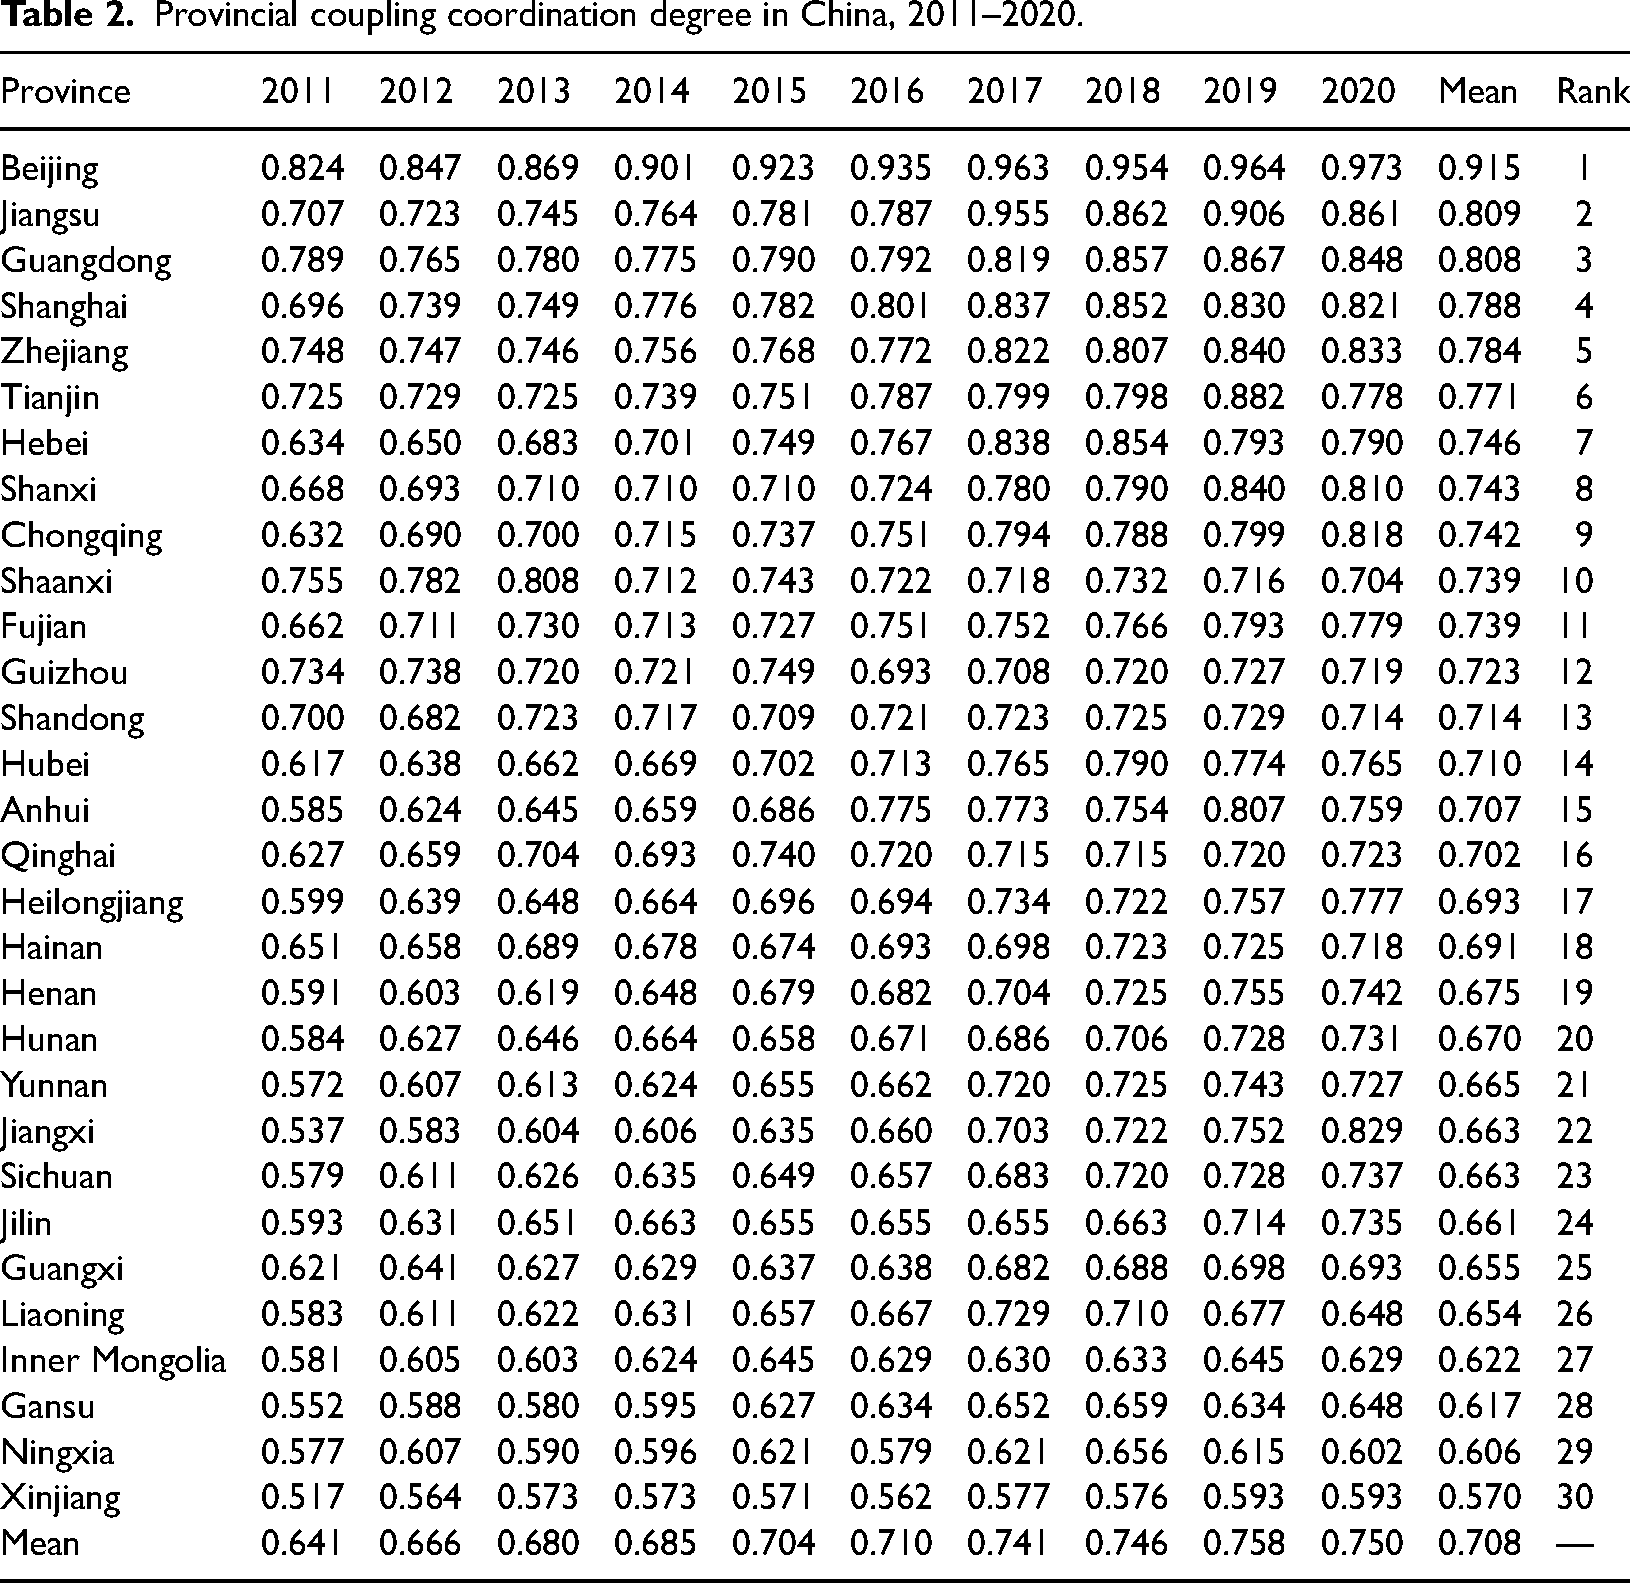
The overall results are shown in Table 2. The coupling coordination degree of the 30 provinces and municipalities lies between 0.537 and 0.936 in a transitional stage of development between barely coordinated and quality coordination, with an overall mean value of 0.708 and an average level at the intermediate coordination stage. Specifically, (1) based on the rankings of provinces and cities, Beijing, Jiangsu, Guangdong, Shanghai, and Zhejiang rank in the top five in terms of the mean value of the coupling coordination degree; Xinjiang, Ningxia, Gansu, Inner Mongolia, and Liaoning rank in the bottom five; and the rest of the provinces and cities are located in the middle of the range. (2) In terms of the overall time series, the coupling coordination degree of the system shows a steady upward trend from 2011 to 2019 and a decreasing trend from 2019 to 2020. (3) In terms of the quantitative distribution, the mean value of the coupling coordination degree is at a high-quality coordination level in one province and municipality, good coordination in two provinces and municipalities, intermediate coordination in 13 provinces and municipalities, prior coordination in 13 provinces and municipalities, and barely coordinated in one province and municipality. The coupling coordination degree results show that China's level of green synergy is outstanding. However, there is still much room for improvement, with a decreasing trend in the coupling coordination degree at the end of the study period. One possible reason for this finding is that the Chinese government realized the seriousness of environmental problems early on, established the concept of green development in a timely and accurate manner, and firmly grasped the developmental linkages between digital finance, ecological governance, and green finance, thus giving regional green transformation and synergistic development a strong and constructive force. In addition, the outbreak of the COVID-19 pandemic in 2019 dealt a blow to green synergy and, to some extent, weakened the closeness between digital finance, green finance, and ecological governance.
Based on the above analysis, the coupling dynamics of digital finance, green finance, and ecological governance during the study period can be significantly observed. To explore more valuable academic information, this study, based on synthesizing the results of existing research and the aforementioned empirical findings, conducts an in-depth exploration from a regional perspective. Based on the division criteria of the National Bureau of Statistics, the 30 provinces above are divided into eight economic regions, as shown in Figure 4. The average value of the coupling coordination degree for the Beijing–Tianjin region (Beijing and Tianjin) is 0.843, ranking first. In the eastern coastal region (Shanghai, Jiangsu, and Zhejiang), the average value is 0.794, ranking second. In the southern coastal region (Guangdong, Fujian, and Hainan), the average value is 0.746, ranking third. In the northern coastal region (Shandong and Hebei), the average value is 0.730, ranking fourth. In the central region (Hubei, Hunan, Anhui, Jiangxi, Shanxi, and Henan), the average value is 0.695, ranking fifth. The average value of 0.690 for the southwest region (Chongqing, Sichuan, Guangxi, Yunnan, and Guizhou) ranks sixth. The average value of 0.669 for the northeast region (Jilin, Heilongjiang, and Liaoning) ranks seventh. Finally, the average value of 0.643 for the northwest region (Gansu, Qinghai, Ningxia, Inner Mongolia, Shaanxi, and Xinjiang) ranks eighth. Overall, the coupling and coordination of digital finance, green finance, and ecological governance are higher in developed regions than in less developed regions, with findings that are more similar to those of existing studies. 31 The results show that the level of green synergistic development in the context of transition is more related to the economic level of s region, with economically developed regions having strong financial capital and cutting-edge financial digital technology, as well as practical and well-planned institutional support and policy dividends in terms of ecological governance.
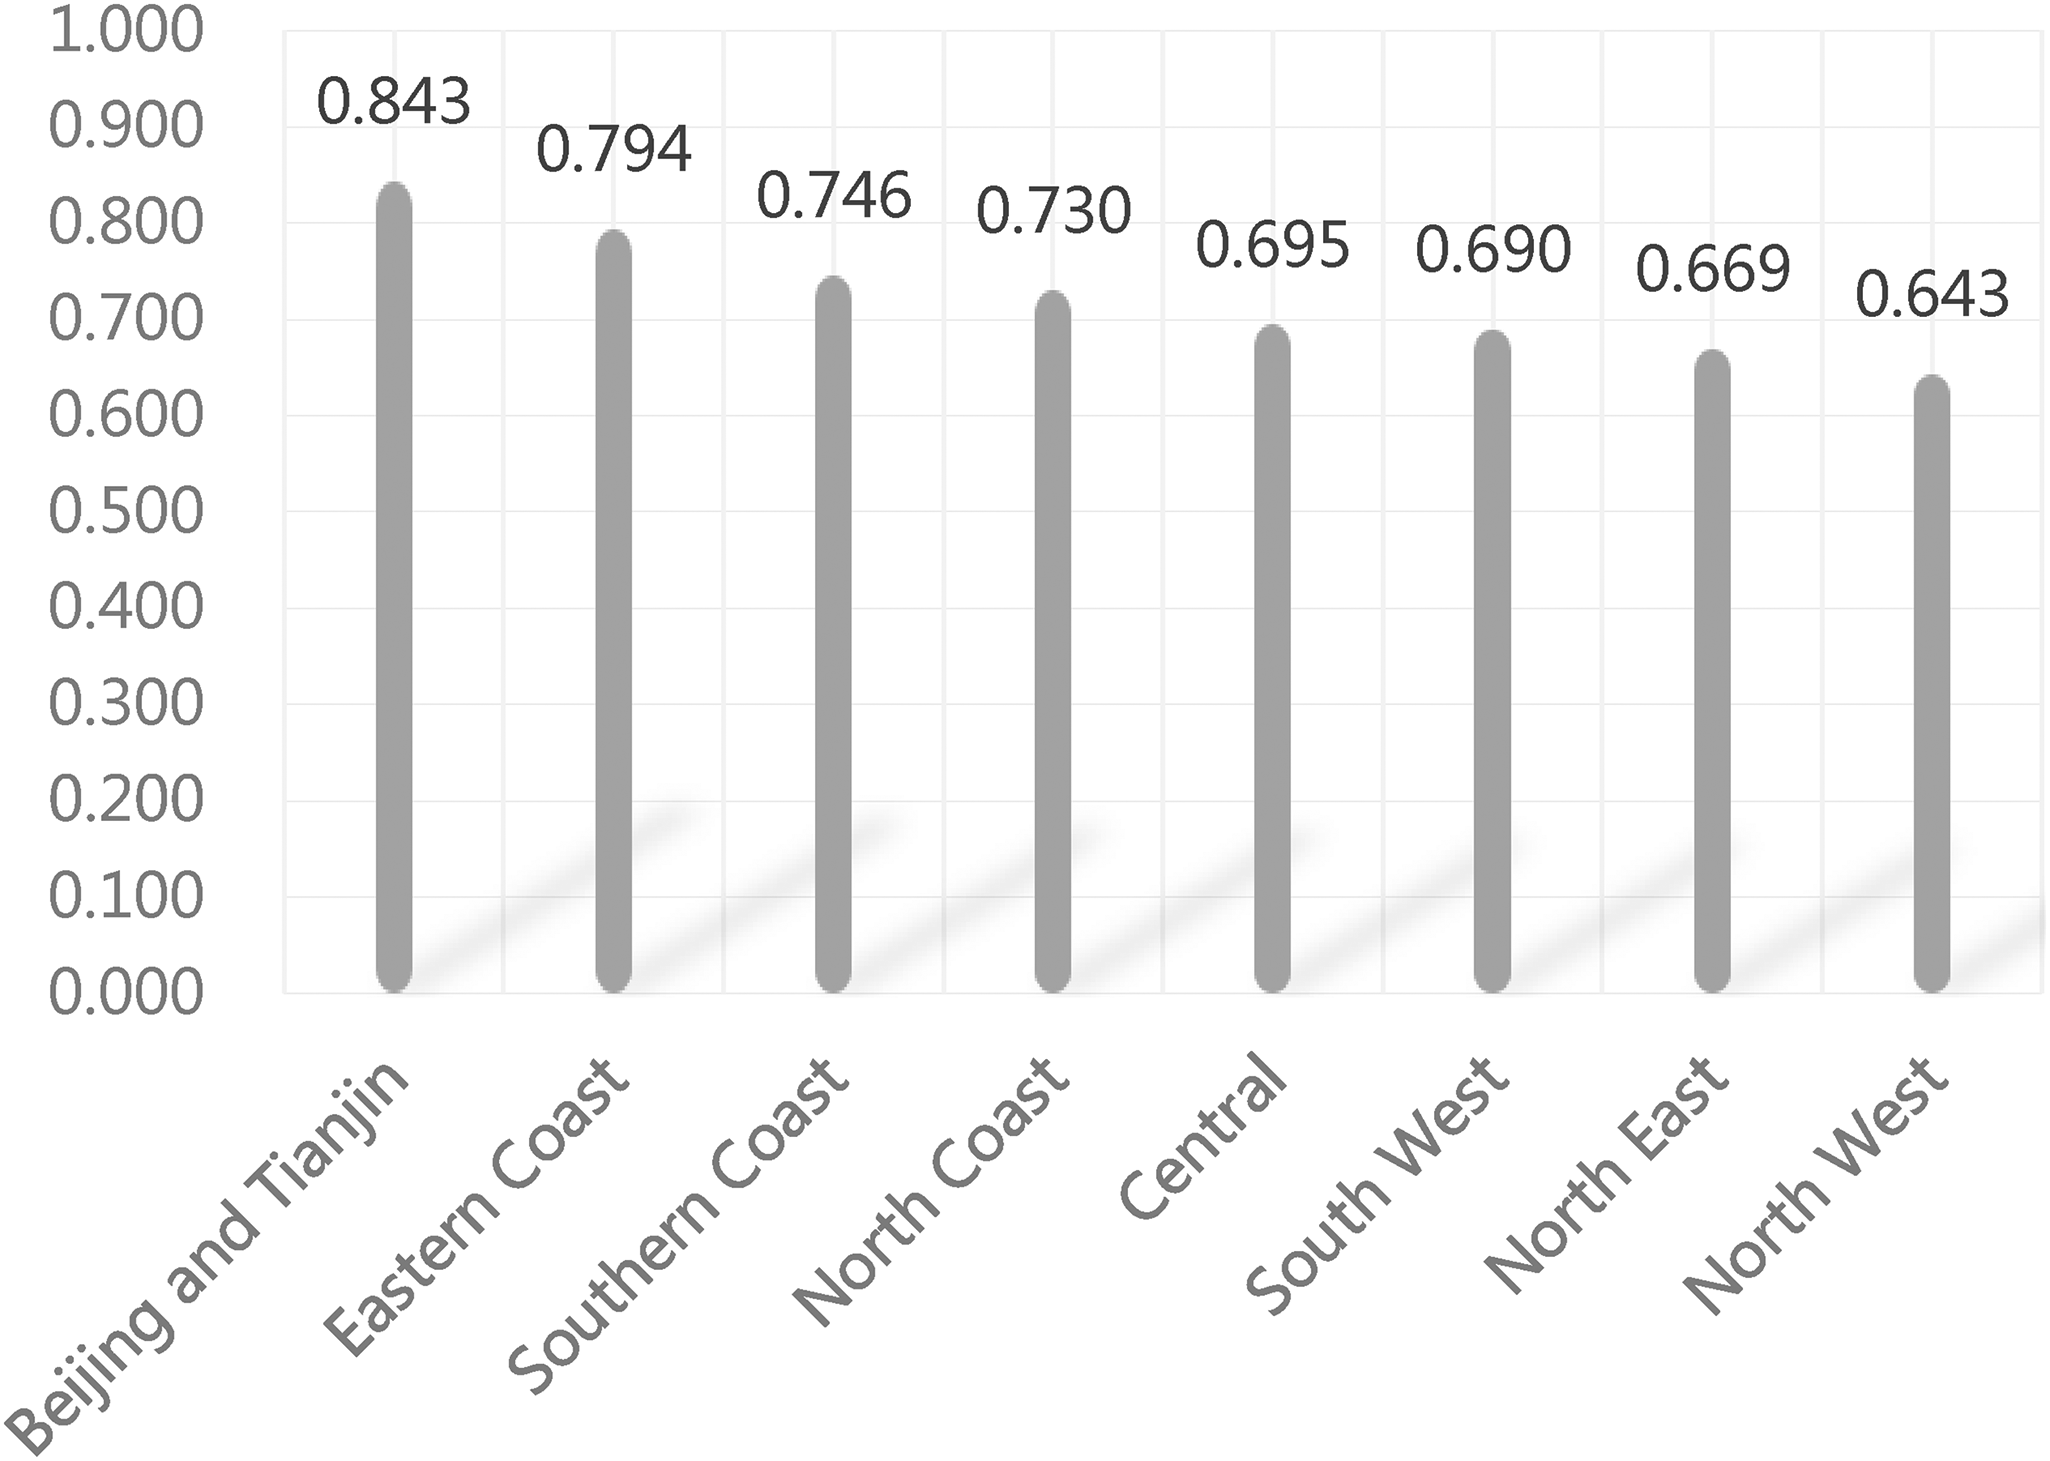
Coupling coordination degree of China's eight economic regions, 2011–2020.
Analysis of the dynamic relevance of digital finance, ecological governance, and green finance
Test of smoothness
The possible cross-sectional correlation between regional digital finance, green finance, and ecological governance can affect the results of the unit root test of the panel data and is easy to form pseudo-regressions. Therefore, drawing on Shahbaz et al., 32 a cross-sectional correlation (CD) test was conducted on the sample data, and if the CD test results were not significant, a first-generation unit root test (Im–Pesaran–Shin (IPS) and augmented Dickey–Fuller (ADF)) was used. Conversely, a second-generation unit root test (cross-sectionally augmented Im–Pesaran–Shin (CIPS) and cross-sectionally augmented Dickey–Fuller (CADF)) was used. The results are shown in Table 3. The CD test results for digital finance, green finance, and ecological governance are significant; thus, the second-generation unit root tests are used. The CIPS and CADF tests for the above three indicators reject the null hypothesis that there is a unit root in the panel data.
Cross-sectional correlation test and unit root tests.
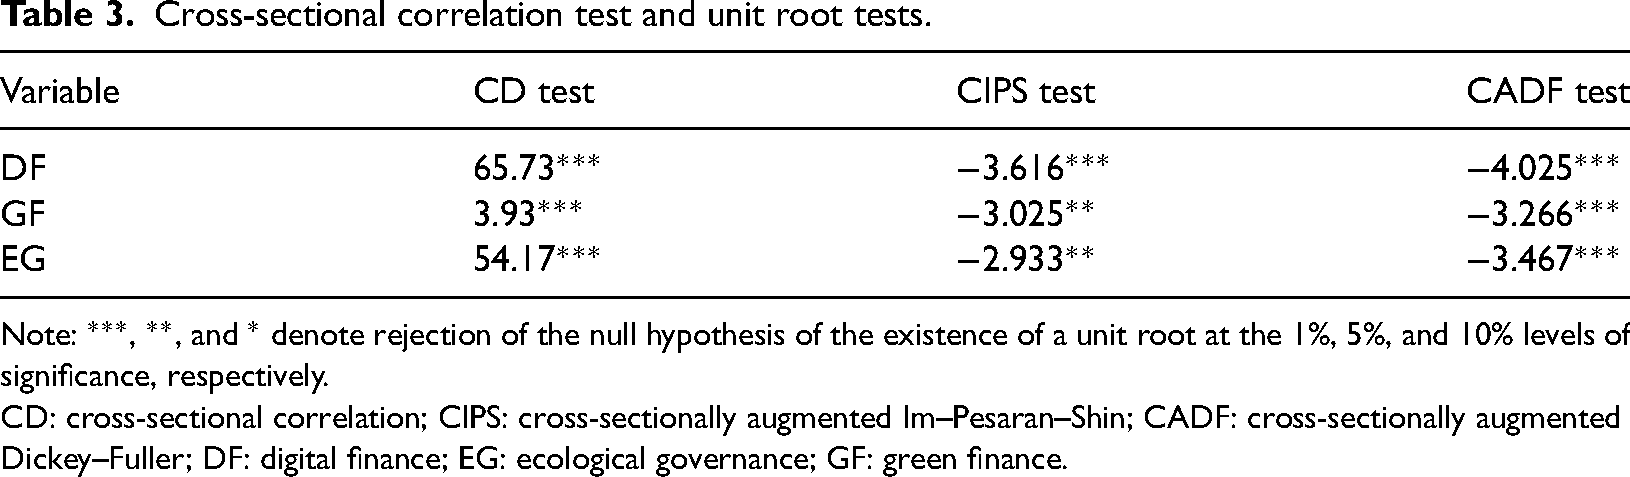
Note: ***, **, and * denote rejection of the null hypothesis of the existence of a unit root at the 1%, 5%, and 10% levels of significance, respectively.
CD: cross-sectional correlation; CIPS: cross-sectionally augmented Im–Pesaran–Shin; CADF: cross-sectionally augmented Dickey–Fuller; DF: digital finance; EG: ecological governance; GF: green finance.
Granger causality test
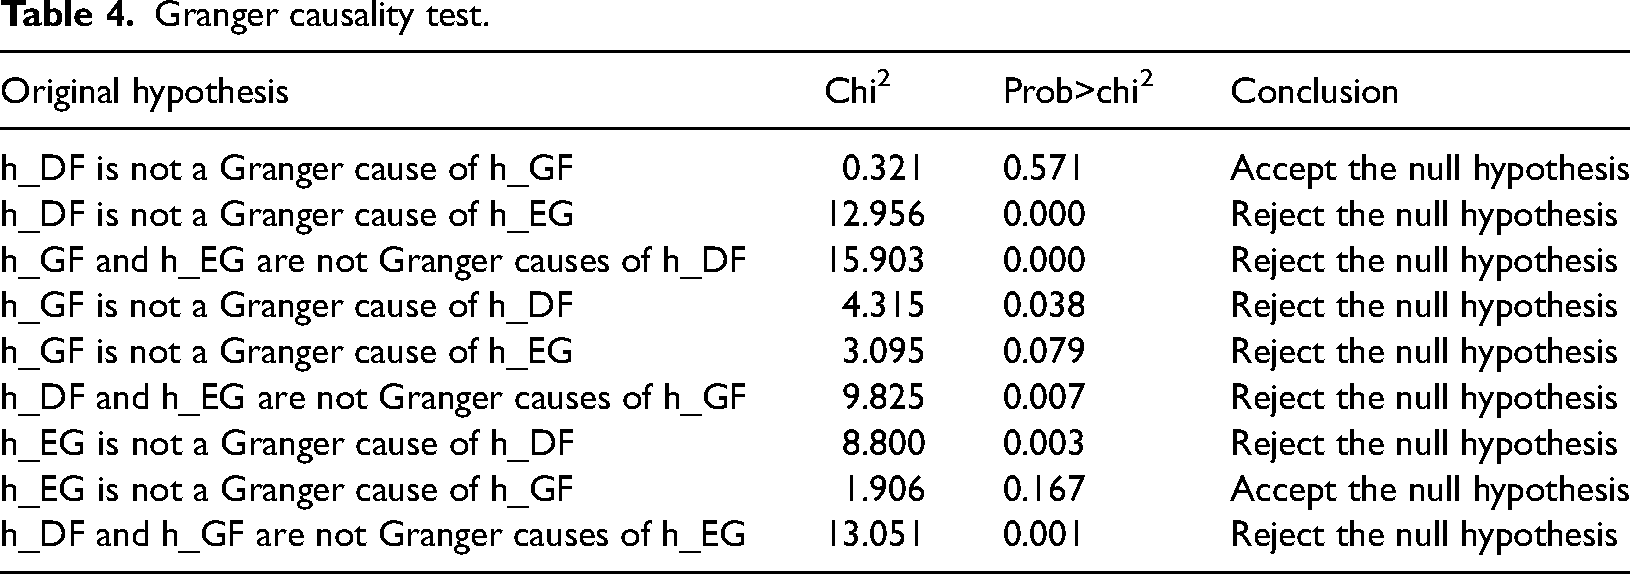
To verify the causal relationship between digital finance, green finance, and ecological governance and the direction of their influence, a Granger causality test is required to make causal judgments between the elements. The test results, presented in Table 4, show that only “h_DF is not a Granger cause of h_GF” and “h_EG is not a Granger cause of h_GF,” accepting the original hypothesis. At the same time, the rest of the results reject the original hypothesis, that is, digital finance is not a Granger cause of green finance. Ecological governance is not a Granger cause of green finance. To further investigate the dynamic effects between the three in the short term and the long term, tests using GMM estimation, impulse response plots, and variance decomposition are also needed.
Granger causality test.
Selection of the optimal lag order
As the number of lags in a PVAR model can have a significant impact on the estimated parameters of the model, it is common practice to choose the optimal number of lags based on the minimum value corresponding to the modified Bayesian information criterion (MBIC), modified Akaike information criterion (MAIC), and modified quasi-likelihood information criterion (MQIC). 30 The results are shown in Table 5. The minimum values of the MBIC, MAIC, and MQIC are all lagged by one period. Thus, the optimal number of lags for the model constructed in this study is set to be lagged by one period to ensure the reliability and robustness of the results.
Determination of the optimal lag order.
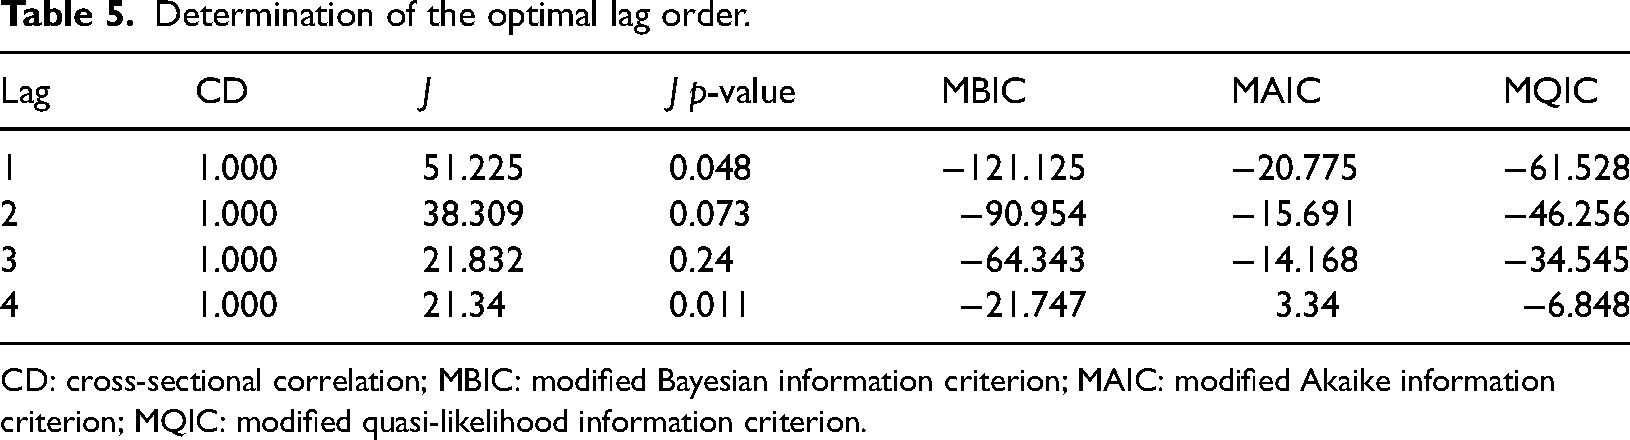
CD: cross-sectional correlation; MBIC: modified Bayesian information criterion; MAIC: modified Akaike information criterion; MQIC: modified quasi-likelihood information criterion.
Analysis of GMM estimation results
Based on the optimal lag order choice, the PVAR model requires estimating the model parameters using GMM estimation. The results are shown in Table 6. Specifically, (1) the coefficient of the impact of digital finance with a lag of 1 period on its current period is 0.480 and is significant at the 1% confidence level. The coefficient of the impact of digital finance with a lag of 1 period on green finance is 0.005 and is significant at the 5% confidence level. The coefficient of the impact of digital finance with a lag of 1 period on ecological governance is 0.020 and is significant at the 1% confidence level. These results show that regional digital finance not only has a better self-reinforcing effect but also can promote an improvement in green finance and ecological governance. (2) The coefficient of the effect of green finance with a lag of 1 period on its current period is 0.691 and is significant at the 1% confidence level. The coefficients of the effect of green finance with a lag of 1 period on both digital finance and ecological governance are positive, but neither is significant. These results indicate that although regional green finance has a good sense of self-reinforcement, the effect on digital finance and ecological governance is not yet significant. (3) The coefficient of the impact of ecological governance on itself with a lag of 1 period is 0.603 and is significant at the 10% confidence level. The coefficient of the impact of ecological governance on digital finance with a lag of 1 period is 0.910 and is significant at the 1% confidence level. The coefficient of the impact of ecological governance on green finance with a lag of 1 period is 0.058 and is significant at the 10% confidence level. These results show that ecological governance has a better self-reinforcing effect and can promote an improvement in digital finance and green finance.
GMM estimation results.
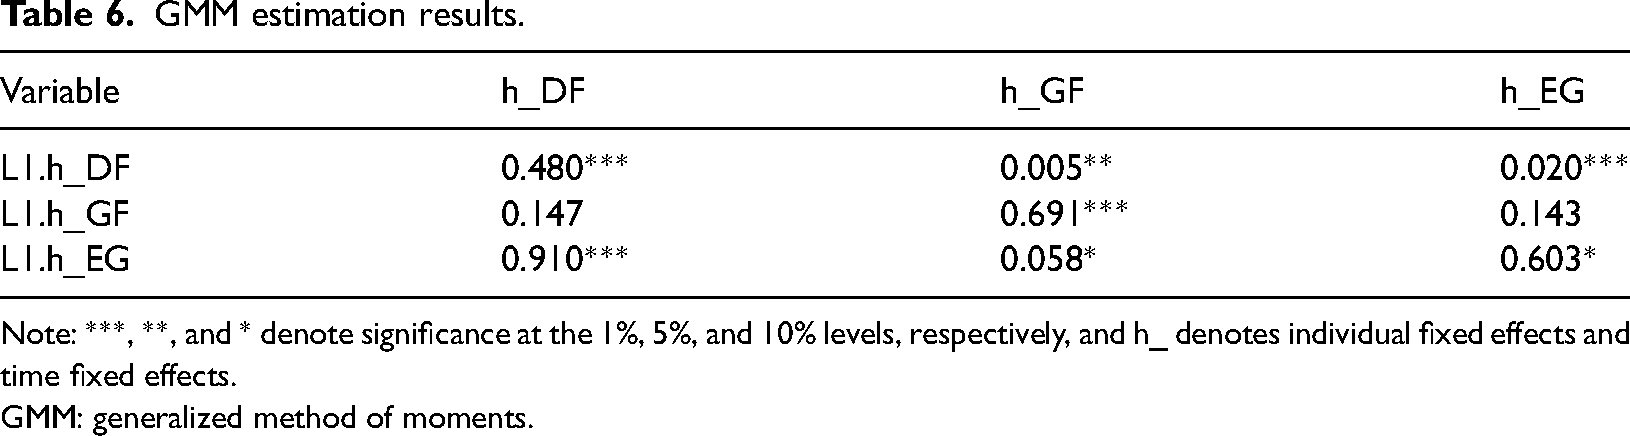
Note: ***, **, and * denote significance at the 1%, 5%, and 10% levels, respectively, and h_ denotes individual fixed effects and time fixed effects.
GMM: generalized method of moments.
Impulse response plots
GMM estimation can reflect the effects between variables only at a macro level, but impulse response plots provide insight into the dynamic transmission trends between variables, that is, the effect of a shock of one standard deviation size applied to a perturbation term of a variable in the model on the current and future values of other variables, based on 1000 Monte Carlo simulations to obtain impulse response plots for the following ten periods at 95% confidence intervals. The results are shown in Figure 5.

Impulse response plots.
There is not always a two-way Granger causality between digital finance, green finance, and ecological governance. Therefore, this study performs impulse response analysis only on the relationship between variables with Granger causality. First, digital finance, green finance, and ecological governance all have a significant positive effect on themselves, with the positive effect of digital finance decreasing and the positive effect of green finance and ecological governance being more stable. Second, ecological governance positively impacts digital finance, with the utility value reaching a maximum in the second period and tending to decline thereafter. In addition, digital finance and ecological governance positively impact green finance, and the utility value is low and remains flat. Finally, digital finance also positively impacts ecological governance, and the utility value is low and remains flat.
Variance decomposition
Variance decomposition can measure the contribution of different disturbances to other endogenous variables, allowing a more precise examination of the degree of interaction between digital finance, green finance, and ecological governance. The number of periods analyzed was set at 10. The results are shown in Table 7.
Variance decomposition results.
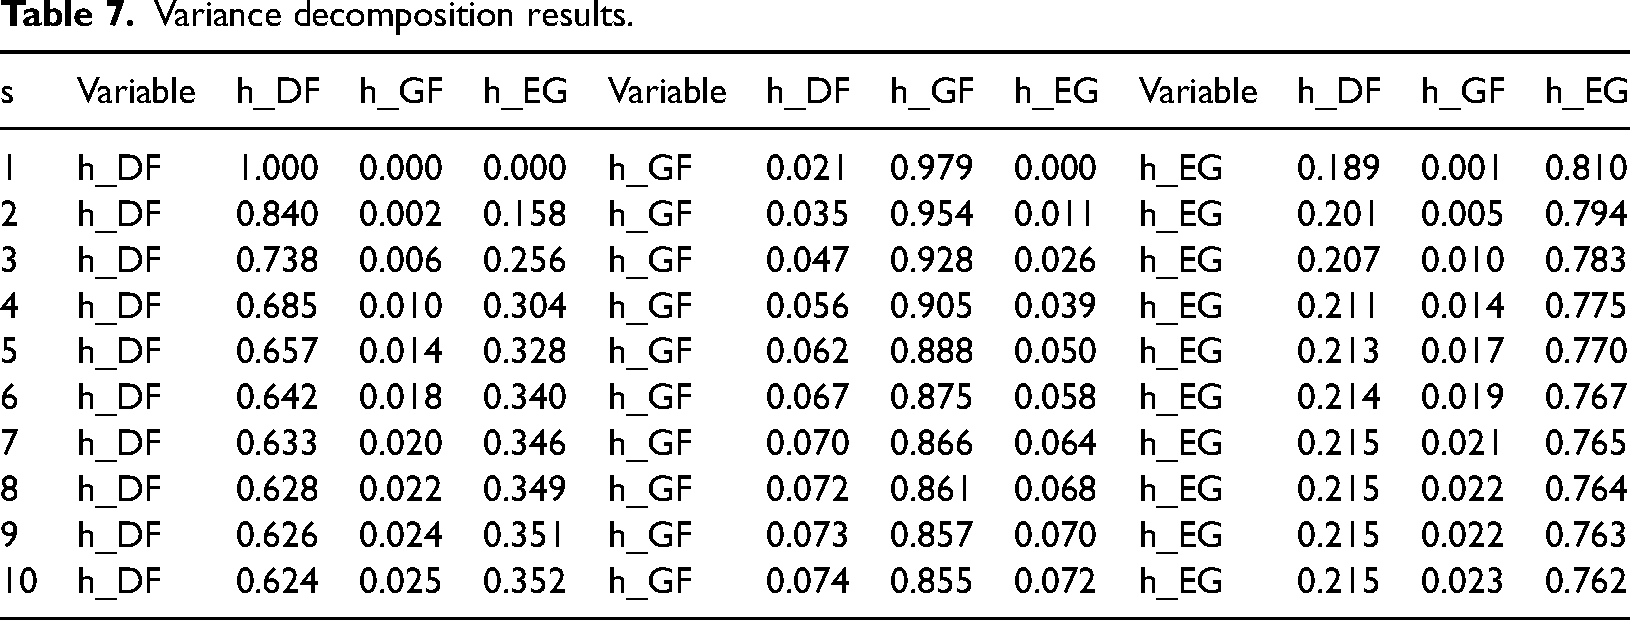
As shown in Table 7, the results of variance decomposition are similar to the results of the aforementioned Granger causality test and GMM estimation. That is, the effect of green finance on digital finance and ecological governance is non-significant, and the remaining dynamic effects become progressively more pronounced over time, which is similar to the findings of existing studies. 33 Specifically, (1) digital finance makes the most significant contribution to itself, but the contribution tends to decrease as the period increases. Additionally, the degree of influence of green finance and ecological governance on digital finance increases, with the contribution of green finance being 2.5% and the contribution of ecological governance being even higher at 35.2% in period 10. (2) Green finance also contributes the most to itself. However, the contribution tends to decrease as the period increases. Additionally, the degree of influence of digital finance and ecological governance on green finance increases slowly, at a rate of 7.4% for digital finance and 7.2% for ecological governance in period 10. (3) Ecological governance also makes the most significant contribution to itself. However, the contribution slowly decreases over time, with green and digital finance increasing their impact on ecological governance, reaching 21.5% for digital finance and 2.3% for green finance in period 10.
Robustness tests
This study uses a common practice for PVAR models, namely, applying dynamic matrix eigenvalues to determine the robustness of the model constructed in this study. That is, it is observed whether the mode of the eigenvalues is less than 1 (within the unit element). The results are shown in Figure 6. The dynamic effects between digital finance, green finance, and ecological governance are all significant, as seen in the figure, indicating that the model constructed in this study is robust.

Panel vector autoregressive (PVAR) model robustness test.
Conclusions and suggestions
Main conclusions
The level of digital finance at the provincial and municipal levels in China shows a clear development pattern, with a significant increase in the temporal evolution and a balanced and stable spatial distribution. Although green finance shows an upward trend to a certain extent, the overall green level is not outstanding, and the gap between different provinces and cities is widening. The overall level of ecological governance is on a relatively rapid upward trend, but the disparities between different provinces and municipalities have become more expansive.
The coupling coordination degree of digital finance, green finance, and ecological governance increased in the 2011–2019 period and decreased in the 2019–2020 period. The overall coupling coordination degree is in the overdevelopment stage of barely coordinated. However, the number of provinces and cities in the quality-coordinated and well-coordinated stages is small. The coupling coordination degree is higher in developed regions, such as the Beijing-Tianjin region, the eastern coast, the southern coastal region, and the northern coastal region, and lower in less developed regions, such as the central region, the southwest region, the northeast region and the northwest region.
The results of GMM estimation, impulse response plots, and variance decomposition show that digital finance, green finance, and ecological governance have a good self-reinforcing effect, with digital finance significantly contributing to improvements in green finance and ecological governance. Similarly, ecological governance significantly contributes to improvements in digital finance and green finance, and the level of such improvements has an upward trend in the time series. On the other hand, green finance does not contribute significantly to digital finance and ecological governance.
Theoretical suggestions for promoting green synergy
Based on the theoretical basis of systemic synergy theory, green synergistic development is not an isolated appearance of governance but a result of the complementary digital finance-green finance-ecological governance operation, which also contains a more complex coupling and correlation mechanism. Based on the empirical results above and the findings of established studies, the following theoretical recommendations are made to consolidate the transformational path of green synergistic development.
Build a regional digital finance-green finance-ecological governance linkage platform. For green synergistic development, there is an urgent need to create a linkage environment for dual regional transformation. We need to recognize that it is not that the regions are unable or unwilling to cooperate in ecological governance; rather, they do not know how to cooperate and lack practical channels to do so. The Regional Green, Collaborative Development Platform is a multi-faceted platform that integrates government authority, financial institution services, and digital support, which, to a certain extent, can break down the digital barriers and information silos between regions and maximize the radiation mechanism of digital finance and green finance for ecological governance effects. This linkage platform will allow each region to take into account its regional resource endowments and to give fuller play to the instincts of green finance in supporting low-carbon transformation, optimizing the industrial structure, and supporting green technological innovation. It will also be able to take advantage of the amplification and intermediary effect of digital finance on the development of traditional finance to break the friction and spatial blockage in the flow between the components of green finance. Multi-entity participation in green collaborative governance. Profit-driven companies overlook the value of a range of implicit non-monetary green transitions, that is, that high-carbon behavior reduces the quality of corporate reputation and increases public relations costs. In contrast, decarbonization transitions can use green finance channels to address the financing of expansionary corporate growth. Therefore, we believe that irrational high-carbon operations by companies can be a way of behaving that does not pay off. As another critical player in green participation and a determinant of life-level governance, the traditional green advocacy paradigm can no longer break out of the dilemma of weak environmental regulation, especially in the context of rising material standards and the rise of digital technology. Therefore, the government must maintain the correct orientation and incentivize pro-environmental behavior by businesses and residents. The threshold for green financial services should be lowered, and the breadth of services should be secured. Companies should establish specialized financial docking departments to better understand and cater to the supportive governance of green finance. At the same time, digital technology can be used to make financial participation in governance more widespread, encourage residents to buy green financial products, and refer to the rise of government consumption vouchers in the post-pandemic era by issuing symbolic green consumption vouchers to make the low-carbon transition more vibrant and change “what you get out of it” to “what you can get out of it.” Increase the talent pool for collaborative green governance. It is possible to build talent teams who are financially literate, digitally savvy, and technologically savvy in governance and who have a cross-disciplinary background. Specifically, the first step is to build a “cross-degree” cultivation mechanism, referring to the existing dual-degree cultivation method, and encourage finance majors to take an interdisciplinary minor in environmental science and digital disciplines. Second, a “cross-teacher” teaching mechanism should be established to bring in “dual-teacher” instructors who have a multidisciplinary educational background (or who have undergone further training) so that the curricular standards are aligned with green thinking and the professionalism of teachers is aligned with green awareness. Third, a new “school-enterprise crossover” mechanism should be built. The traditional school-enterprise joint mode of visiting, learning, and exchanging has defects such as laziness and non-alignment. The new mechanism can directly hand over the green technology and green development problems faced by enterprises to universities and research institutions in the form of project funding. Fourth, a “cross-certification” certification mechanism should be constructed. With the current employment pressure, examinations should increase the quality of the trend of increasing the employment weight. China's Environmental Protection Bureau can refer to the existing certificate issuance model based on three dimensions, that is, theoretical, technical, and practical aspects, of the development of green qualifications, providing the highest incentive for cross-talent certification.
Research gaps and outlook
While this study has drawn the conclusions above, there are also certain limitations. There are various subsystems and indicators for constructing green synergistic development, and this study uses digital finance, green finance, and ecological governance as proxy variables, which cannot fully cover the whole green synergistic development system. Other representative indicators can be tried in future studies for re-examination. Furthermore, this study takes an endogenous perspective. It considers the intrinsic relationship between digital finance, green finance, and ecological governance through coupling and PVAR models without considering some exogenous influencing factors. Consequently, the research results lack certain macro factors to explain. In subsequent research, we will expand the test of this research topic by introducing exogenous variables and constructing suitable econometric models.
Footnotes
Declaration of conflicting interests
The author(s) declared no potential conflicts of interest with respect to the research, authorship, and/or publication of this article.
Funding
The author(s) disclosed receipt of the following financial support for the research, authorship, and/or publication of this article: This work was supported by the National Social Science Fund project “Research on Systemic Risk Induction and Contagion Mechanism of Commercial Banks under the Background of Interest Rate Marketization,” The postgraduate scientific research project of Anhui University “China’s Green Finance Efficiency Measurement and Its Explanatory Factors Configuration Path Identification Research,” Anhui Ecology and Economic Development Research Center Project Funded Project “Promoting the Realization of the ‘Double Carbon’ Goal Green Finance Research” (grant nos. 16BGL051, YJS20210063, and AHST2022016).
