



Abstract
This study aims to examine the impact of globalization, renewable energy generation, and agricultural value addition on the ecological footprint (EF) and carbon emissions (CO2) of selected five most populous countries in Asia during the period 1975–2020. The Westerlund cointegration test supports long-term cointegration relationships among the considered variables in selected countries. The long-term elasticity results of the mean group, augmented mean group, and common correlated effects mean group estimators clearly show that agricultural value added and globalization make significant contributions to the ecological footprint and carbon emissions of the five most populous countries in Asia. However, renewable energy generation significantly reduces the ecological footprint and carbon emissions. Moreover, the impact of gross domestic product (GDP) on ecological footprint and carbon emissions is significantly positive while the impact of GDP2 on ecological footprint and carbon emissions is significantly negative, thus validating the inverted U-shaped Environmental Kuznets Curve hypothesis for specific Asian densely populated countries. The results of the causality test indicated a two-way causality between renewable energy generation and ecological footprint, supporting the feedback hypothesis. There is also a two-way causal relationship between agricultural value added and ecological footprint. Overall, these empirical results show that renewable energy plays a prominent role in combating environmental pollution in selected densely populated Asian countries. Thus, these countries should achieve their sustainable development goals by cultivating existing renewable energy generation policies. Moreover, specific densely populated countries in Asia should encourage clean energy production and consumption in the agricultural sector, and increased investment in renewable energy can improve environmental quality and agricultural production.
Introduction
The resources required to meet the needs of the present generation without destroying the resources of the next generation are called sustainable development. The goal of sustainable development is also to protect the natural environment for future generations while meeting critical needs. 1 The sustainable development revolution gained popularity after the Brundtland report, “Our Common Future: The World Commission on Environment and Development (WCED). The report highlights that the main obstacles to sustainable development are population growth and the overuse of energy and natural resources. As the commission emphasized, sustainability requires not only economic growth but also energy intensity and fewer resources. 2 With the aim of contributing to the sustainable development debate, this study focuses on the role of renewable energy generation, agriculture, and globalization on environmental pollution in the five most populous Asian countries (China, India, Indonesia, Pakistan, and Bangladesh). The process of globalization in developing countries is accompanied by rapid upgrading and differentiation of production and consumption. A major source of environmental pollution and health hazards is the fossil fuels used to produce commodities. Society is turning to solar and wind power as sources of renewable energy that are free in nature and do not pollute the air. Besides, it is more critical that food production and supply systems meet social needs, but agricultural activities degrade environmental quality. Thus, the current study seeks answers to the following questions: Does renewable energy generation contribute to improved environmental quality, and are agriculture and globalization the main drivers of environmental degradation in densely populated countries? Alleviating the environmental problems in densely populated countries in Asia is the main purpose of this study, which can be achieved by answering the above questions.
The latest forecast for the world population is 8 billion in 2022, projected to reach 8.5 billion by 2030, 9.7 billion in 2050, and 10.4 billion in 2100. The never-ending trend of rapid population growth poses a challenge to sustainable development. 3 Addressing environmental challenges is even more critical to achieving the targets set in the 17 sustainable development goals (SDGs). In this regard, the halting of environmental hazards such as global warming, air pollution, deforestation, desertification and water pollution, as well as the sustainable consumption of natural resources, embody SDGs 12, 13, 14, and 15. 4 The goal of eliminating the effects of global warming and climate change is sustainable and equitable and must be achieved.5,6 The extent of recorded global warming over the past five years as determined by the world's highest temperatures. Global carbon dioxide emissions account for about 76% of total greenhouse gas emissions, reaching a peak of 36.3 billion tons in 2021. 7 Emissions of carbon dioxide, methane, and nitrogen dioxide increase to 495.4 ppm, 1991ppb, and 370.4 ppb in 2021, an increase of 152%, 281%, and 148%, respectively, compared with the preindustrial era. 8 Global warming and climate change are significantly affected by other environmental pollutants besides carbon dioxide emissions. 9 In this context, Wackernagel and Rees 10 proposed a cumulative environmental metric, the ecological footprint (EF), for the simultaneous analysis of soil, water, and air pollution. In doing so, it captures overall environmental dynamics by summing six subcomponents (forest footprint, fisheries, rangeland, cropland, carbon, and building land) to measure human gravitational pull on the environment in global hectares. The ecological footprint reflects human pressure on natural resources and services are on the demand side, while the regenerative capacity of natural resources is a reflection of the bio capacity of the supply side to meet human needs. While linking EF to biocapacity, it is possible to infer whether there is a minimum environment for sustainable development in a geographical area.11,12 Environmental degradation caused by increased world regenerative capacity since 1970 due to ecological footprint negatively impacting human well-being and human health on earth. 13 Global warming and climate change are environmental problems caused by carbon dioxide emissions and ecological footprint, adversely affecting human health and the national economy. Thus, it is imperative to identify the factors that lead to environmental degradation. The key factors affecting environmental degradation and sustainable development are renewable energy, globalization and agriculture. Globalization can increase production levels and provide environmental technology, therefore, globalization can be considered as one of the main determinants of environmental pollution. Higher CO2 emissions and ecological footprints are directly affected by production and consumption activities. Environmental conditions may worsen as production technologies remain unchanged in the process of globalization. 14 Conversely, if economic globalization provides environmentally friendly technologies, it can improve environmental quality as foreign direct investment and trade volumes increase. 15
Agriculture in developing economies is identified as a key factor for sustainable development.16,17 As an important tool within the context of the SDGs, agriculture can eradicate absolute poverty. Thus, increasing agricultural productivity, ensuring food supply security and providing better nutrition require sustainable consumption, production, and distribution chains. 18 The 2030 target can be achieved through a global transformation of agricultural systems and food that considers climate change. 19 Agriculture sustains economies by creating jobs for people, providing food, supplying raw materials, and increasing competition. 20 Hunting, fishing and forestry are agricultural activities in developing countries that play a vital role in wealth creation. 21 However, higher water, land and carbon footprints may be caused by agriculture. Agriculture such as livestock and crop irrigation uses 70% of the world's water. 22 Additionally, the primary production stages of raising livestock, tilling the soil and using agricultural inputs add to greenhouse gas emissions and carbon footprints. Agrifood production increases land footprint over time. 23 Agricultural vegetation based on fossil fuel inputs and outdated technologies exacerbates environmental quality and hinders the achievement of SDGs. Agricultural productivity accounts for about 20% of global carbon dioxide emissions. 24 Increases in agricultural carbon dioxide emissions may worsen global environmental quality, so a sharp decline in agricultural emissions is critical for sustainable development. 25 The agricultural sector is the third largest contributor to climate change, after industry (22%) and energy (36%). 26 Clearing land, burning soil and crops, and growing rice are all agricultural activities that use fossil fuels, leading directly to higher emission levels.27,28 Using renewable energy can offer farmers the advantage of compensating for the economic and environmental losses that fossil fuels inflict on agricultural soil and environmental quality. 12 Renewable energy can be used in a variety of decisions to support agricultural activities such as soil improvement, drying of produce, cooling, irrigation and heating. 29 Additionally, environmental concerns can be mitigated through green investments in agriculture. More investment in the agricultural sector needs to address resource depletion, forest degradation and groundwater pollution. 30
The world is focusing on a sustainable development agenda that requires the use of renewable and clean energy because fossil fuels contribute to global warming.5,31,32 A technically feasible and economically effective strategy to reduce greenhouse gas emissions is to use renewable energy. 33 Renewable energy can reduce dependence on fossil fuels, thereby ensuring energy security and preventing air pollution.34,35 In addition to improving air quality, human health and job creation, renewable energy can help reduce environmental and climate impacts and energy costs. 36 Moreover, the use of domestic renewable energy sources, such as solar energy, geothermal energy, biomass energy, wind energy, and hydropower, are all domestic renewable energy sources that can be used to reduce costs associated with energy imports. 32 Thus, countries for the aforementioned environmental reasons need to switch to renewable energy sources. Renewables are more likely to generate more electricity than coal by 2025, and by 2050, 50% of global electricity production will rely on renewables. 37
Five developing countries (China, India, Pakistan, Indonesia, and Bangladesh) with 45% of the world's population develop agricultural activities to meet social needs. Developing countries in Asia are the countries with the highest agricultural production because these high-level communities have a higher demand for agricultural products. Table 1 lists the information on the top eight producers of agricultural products in the world from 2019 to 2021. The top two countries are China and India, and Indonesia ranks fourth. As can be seen, agricultural production increased in China, Indonesia, and India, while it decreased slightly in the United States, Turkey, and the Russian Federation. Agricultural value added in selected developing Asia (China, India, Indonesia, Pakistan, and Bangladesh) is equivalent to 49.6% of world agricultural production by 2021.
The world's top eight agricultural producers.

The selected top agricultural-producing countries are also leaders in renewable energy generation. Between 2009 and 2018, installed renewable energy capacity in developing Asia nearly tripled from 349.1GW to 1023.5GW. This growth now accounts for around 68% of the region's total installed capacity, largely led by China. China is not only the leading renewable energy producer in Asia, but also the world's leading producer of renewable energy, generating twice as much electricity as the world's second-largest country, the United States. Hydropower is the largest source of renewable energy, and nearly half of China's renewable energy comes from hydropower. 38 India has the fourth most attractive renewable energy market in the world, ranking fourth in terms of installed renewable energy capacity, fifth in solar power and fourth in wind power in 2020. 39 With incredible potential for solar and wind power generation, Pakistan needs only 0.071% of the country's current electricity needs to be powered by solar photovoltaics (solar PV). Promoting renewable energy could help Pakistan save up to $5 billion over the next 20 years by lowering electricity costs, reducing carbon emissions and achieving greater energy security. 40 Mobilizing investment in renewable energy and energy efficiency through reforms could make Indonesia a world leader in clean energy, according to the latest report of the OECD. 41 The OECD report further demonstrates that Indonesia has substantial untapped financing and investment potential in renewable energy and energy efficiency, areas critical to supporting a sustainable recovery from the COVID-19 crisis and accelerating the country's green energy transition. Bangladesh achieved economic growth and mitigated climate change during 2019-2021 with the help of USAID's Scaling Up Renewable Energy (SURE) program. 42
Figure 1 shows that India, China, Pakistan, Bangladesh, and Indonesia have a slight decline in renewable energy generation as a percentage of total energy generation over the period 2000–2015. However, renewable energy generation in these specific countries start to grow slightly again in 2021.
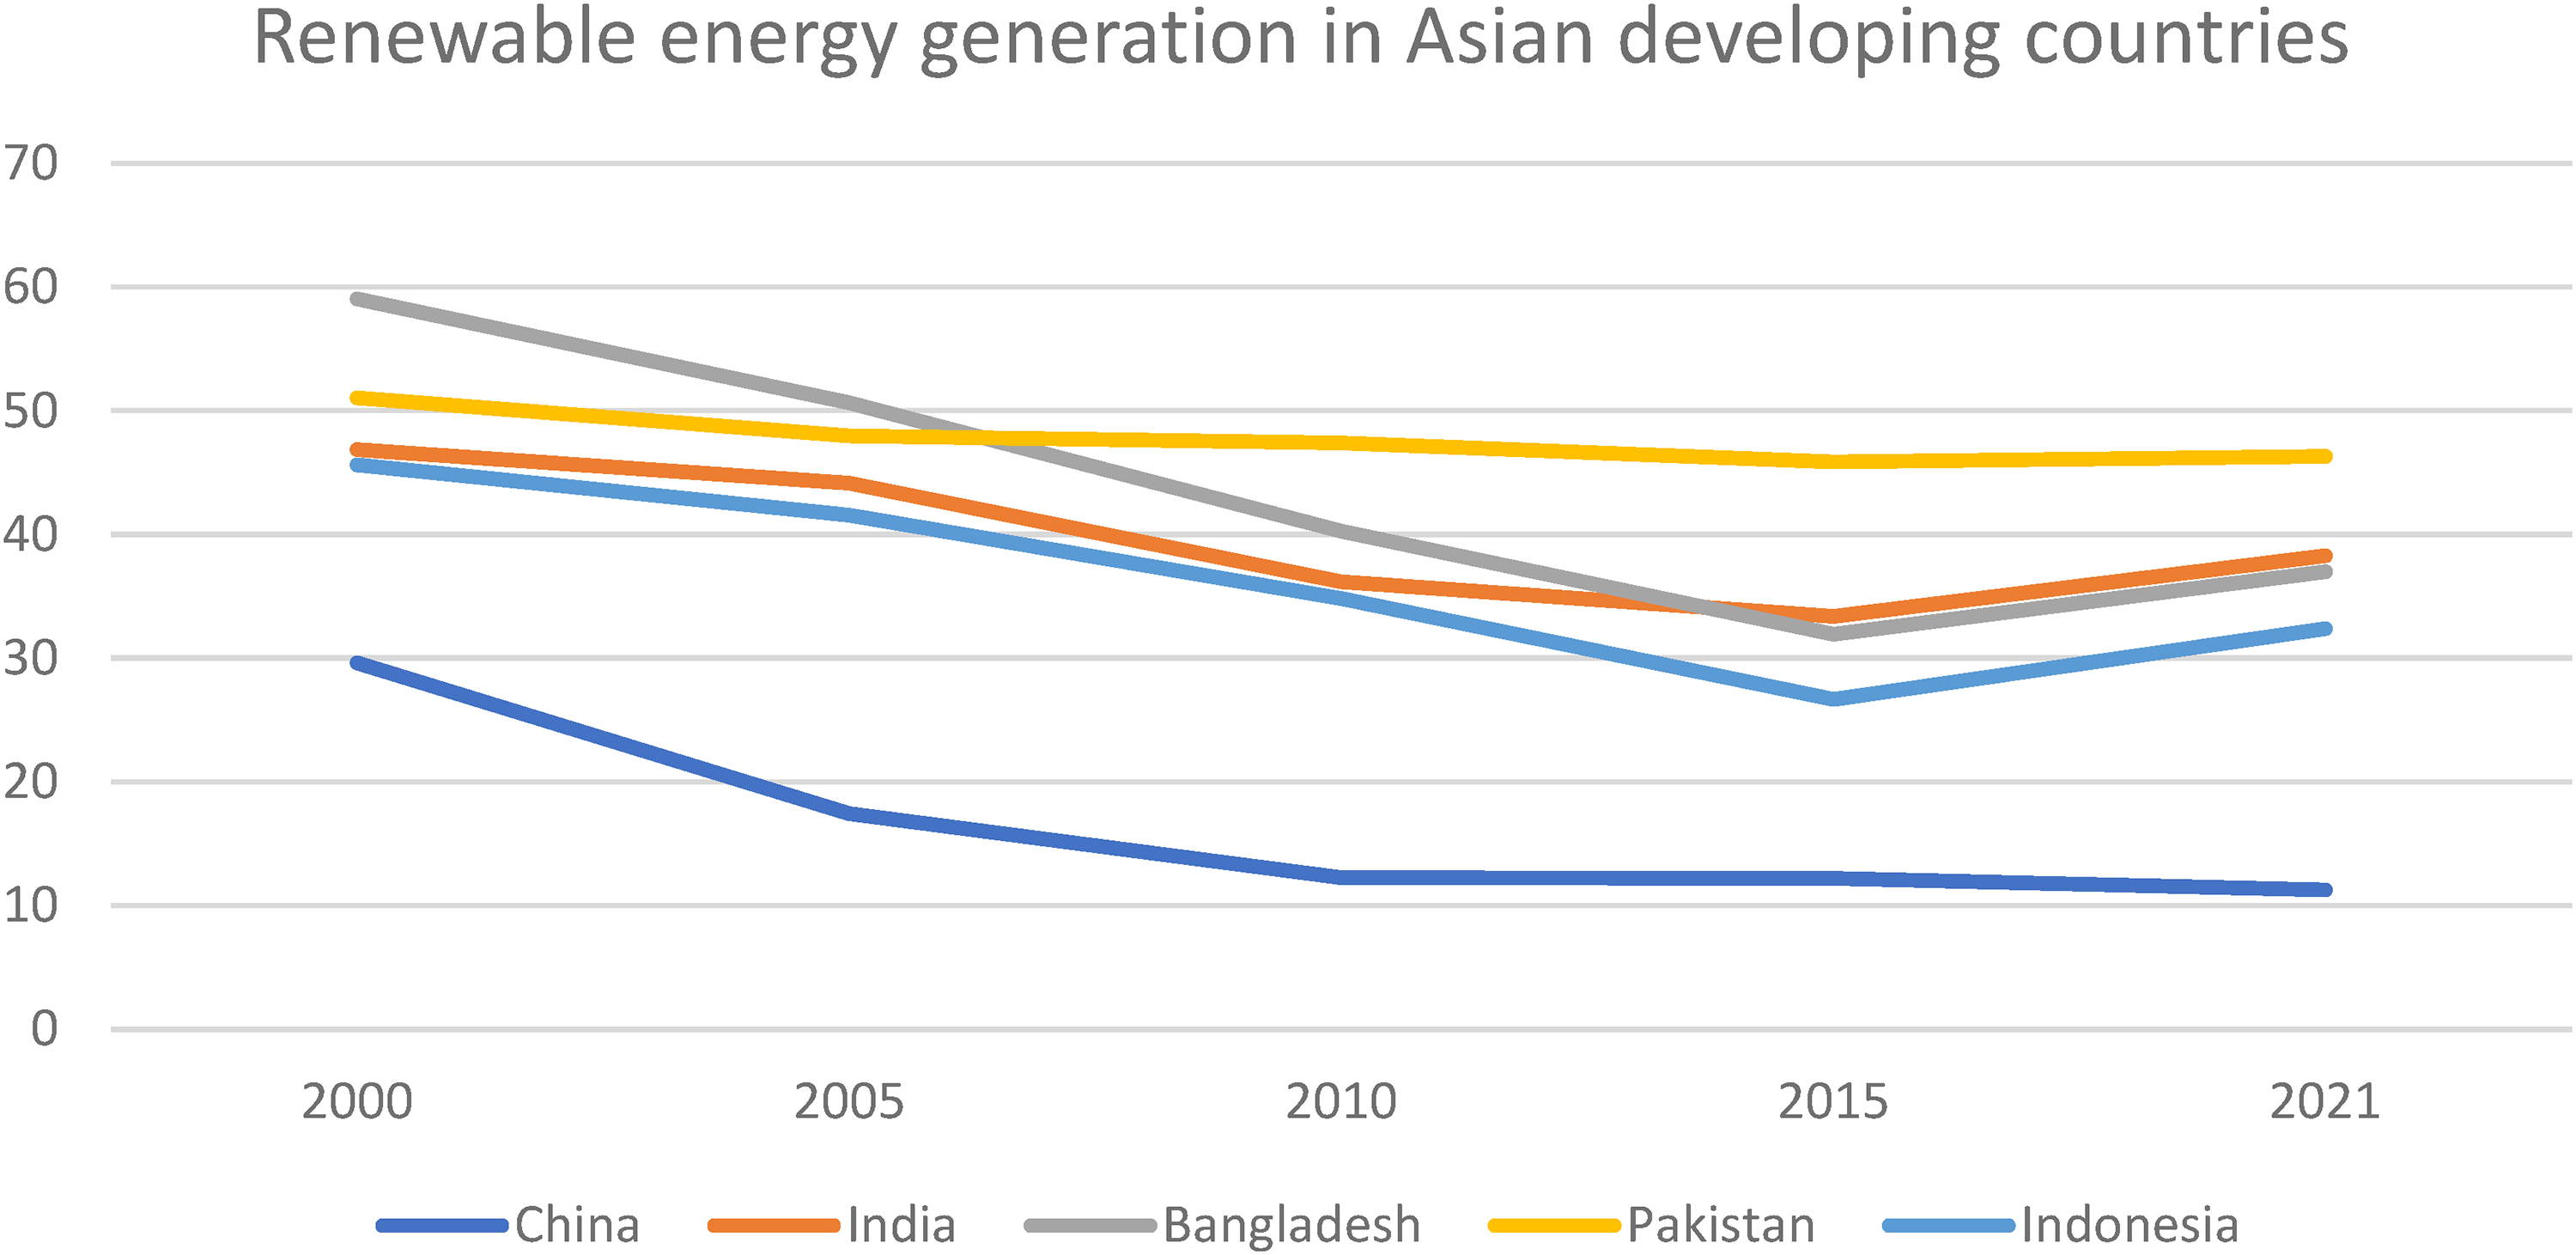
Renewable energy as a percentage of total energy generation in developing Asia from 2000 to 2021.
Therefore, in view of environmental degradation, air pollution in particular will worsen with the increase of fossil fuels. Countries such as China, India, Pakistan, Indonesia, and Bangladesh must diversify their energy mix. These countries are considered the world's largest consumers of fossil fuels. India, China, Pakistan, Bangladesh, and Indonesia must replace fossil fuels with renewable energy sources such as solar, wind, and biomass to reduce pressure on the environment.
Based on the above information flows, this study aims to examine the impact of globalization, renewable energy consumption, and agricultural value addition on the EF and carbon emissions (CO2) of selected five most populous countries in Asia. Wen et al. 43 examined the impact of globalization, renewable energy consumption, and economic growth on CO2 emission for selected South Asian economies. Anwar et al. 44 selected 15 Asian economies to empirically reveal the impact of urbanization, renewable energy consumption, financial development, agriculture, and economic growth on CO2 emissions. Similarly, Sharma, Sinha, and Kautish 45 selected eight developing countries in South and Southeast Asia to explore the effects of per capita income, renewable energy, life expectancy, and population density on ecological footprint. Wang et al. 46 investigated the impacts of globalization (GL), renewable energy (RE), and value-added agriculture (AG) on CO2 emissions in South Asian countries. Contrasting the above studies with the current study, this is the first attempt to explore the impact of globalization, renewable energy consumption, and agricultural value added on the ecological footprint and carbon emissions of the five most populous countries in Asia. The synchronized effects of globalization, renewable energy consumption, and agricultural value addition on the ecological footprint, the use of the ecological footprint as a proxy for environmental damage, and the proposed sample data and panel selection have not been examined in other studies. Furthermore, unlike the traditional methods previously used in panel studies, this study determines to use the CS-ARDL method, which is robust to cross-sectional dependence (CSD), heterogeneity, and endogeneity.
Literature review
Various studies over the past three decades have obviously identified the determinants of environmental pollution. Groundbreaking studies by Grossman and Krueger 47 and Shafik and Bandyopadhyay 48 concluded that there is an inverted U-shaped relationship between pollution indicators and economic development. Panayotou 49 delineated the nonlinear relationship between economic growth and environmental pollution while testing the Environmental Kuznets Curve (EKC) hypothesis. Abbasi et al. 50 explored the inverted N-type EKC hypothesis, reflecting the fact that renewable energy sources mitigate pollution rather than nonrenewable energy sources exacerbate pollution. Validation of the EKC hypothesis is still controversial, such as, few studies have found the EKC to be valid,51–54 while others have found the EKC hypothesis to be invalid.55–58 In addition to the level of economic development, various studies have linked environmental pollution to nonrenewable energy consumption,59–62 trade openness,53,54,63,64 urbanization,65–67 foreign direct investment,51,68,69 regulatory quality,70–72 economic complexity,73–75 and globalization.76–78
Given its importance, many studies have revealed the impact of renewable energy on environmental pollution. These studies, mainly focused on the consumption side, determined that renewable energy consumption has adverse impacts on environmental degradation.79–84 Furthermore, the environmental impacts (air, water pollution, and soil) of renewable energy generation have only been explored with very limited research. Among them, Ibrahim et al. 85 revealed that renewable energy generation in Algeria, Egypt, Morocco, Nigeria, and South Africa could reduce environmental degradation over the period 1990–2019. Koengkan et al. 86 investigated the reduction of air pollution by renewable energy in 15 countries in the Latin America and Caribbean region from 1990 to 2017 using panel quantile regression. Zeng, Bao, and McFarland. 87 collected data from 282 Chinese cities using the spatial difference in differences model and found that renewable energy generation reduced air pollution in China. Alsaleh and Abdul-Rahim 88 investigated the impact of renewable energy generation on water quality in EU participating countries using a panel fully corrected ordinary least squares method over the period 1990–2019. The results of the analysis show that increasing the amount of renewable energy can effectively exacerbate water quality degradation in the EU-27 region.
Moreover, recent studies have employed multiple methodologies and data samples and selected different regions to investigate the impact of agriculture on environmental degradation. Abbasi et al. 89 used a panel nonlinear autoregressive distributed lag (NARDL) model to reveal the impact of agricultural activities on carbon emissions in the world's top 22 forest-covered countries during the period 1980–2019. Results show that agricultural activities have gradual and statistically significant long-term effects on CO2 emissions in selected regions. Abbasi et al. 89 pointed out that positive shocks to agricultural value added and forest area have significant adverse effects on environmental degradation while negative shocks have significant long-term positive effects on CO2 emissions in the specific 22 most forested countries. Usman et al. 90 also explored the detrimental contribution of agricultural value added to environmental quality in South Asian countries using FMOLS techniques during 1995–2017. Likewise, Adekoya et al. 91 concluded that agricultural activities reduce environmental quality in resource-rich African countries. Muoneke et al. 92 used FMOLS and dynamic ordinary least squares (DOLS) methods and found that the ecological footprint increased as agricultural development in the Philippines accelerated. In contrast, Raihan and Tuspekova 93 used a DOLS method for the period 1996–2020 and found that a 1% increase in agricultural productivity and forest area could lead to a reduction in CO2 emissions of 0.34% and 2.59%, respectively in Kazakhstan. Anwar et al. 44 published the impact of renewable energy and agriculture on carbon dioxide emissions in 15 Asian economies during the period 1990 and 2014. The results of the analysis show that renewable energy significantly reduces CO2 emissions, while agriculture contributes only marginally to the reduction in CO2 emissions in selected countries. Likewise, Raihan and Tuspekova 94 used DOLS to identify that a 1% increase in agricultural development and renewable energy use in Malaysia would reduce CO2 emissions by 3.86% and 0.10%, respectively, over the period of 1996–2020. Raihan and Tuspekova 95 again reveal that using the DOLS approach, agricultural value addition increases Brazil's CO2 emissions, leading to environmental degradation, while increasing renewable energy use and forest area helps reduce Brazil's CO2 emissions.
Many recent studies have shown that globalization is another important driver of accelerated environmental degradation. Using wavelet techniques, Adebayo and Kirikkaleli 96 found that globalization increased Japan's CO2 emissions while renewable energy use decreased Japan's CO2 emissions during the period from the first quarter of 1990 to the fourth quarter of 2015. Another study by Aladejare 97 shows that globalization using augmented mean groups (AMGs) reduces environmental degradation in the five wealthiest African economies during the period 1990–2019. Jahanger 76 empirically finds that economic, social, and overall globalization reduce environmental quality by applying the generalized method of moments in 78 developing economies during the period of 1990–2016. Farooq et al. 77 also analyzed that globalization helped improve environmental degradation in 180 countries over the period of 1980–2016. In contrast, Usman et al. 98 explores the adverse effects of renewable energy consumption and globalization on the ecological footprint of financially resource-rich countries from 1990 to 2018. Similarly, another study by Usman et al. 99 used the AMG strategy and found that renewable energy consumption exacerbated environmental degradation, while globalization contributed to environmental degradation in eight Arctic countries over the period 1990–2017. Rehman et al. 100 also concluded that globalization has a significant positive effect on CO2 emissions, while renewable energy consumption has no effect on global CO2 emissions, using an NARDL technique from 1985 to 2020. Similarly, Sun et al. 101 employed the method of moment quantile regression (MMQR) to conclude that renewable energy consumption significantly reduces carbon emissions while globalization leads to an increase in carbon emissions in the top 10 polluting countries.
As noted from the above literature few studies have analyzed the impacts of renewable energy generation, globalization and agriculture value addition on the EF simultaneously. Furthermore, few studies have used EF as a proxy for environmental degradation while exploring the links between renewable energy generation, agricultural development, globalization, and EF. There is also a lack of research in the literature analyzing the causal links between renewable energy, agriculture, globalization, and environmental degradation.
Methodology
The main objective of this study is to reveal the impact of renewable energy generation, agricultural value addition, and globalization on the ecological footprint and CO2 emissions of the five most populous countries in Asia. Yurtkuran
102
used renewable energy production, globalization, and agriculture as independent variables in the model, and carbon dioxide emissions as dependent variables, revealing the impact of renewable energy production, globalization, and agriculture on carbon dioxide emissions. Ozturk and Acaravci
103
used per capita carbon emissions as the dependent variable in model development, and considered per capita energy consumption, per capita globalization, per capita real income, and the square of per capita real income as independent variables. This model obviously embodies the impact of per capita energy consumption, per capita globalization, per capita real income, and the square of per capita real income on per capita carbon emissions. Following the models of Yurtkuran
102
and Ozturk and Acaravci
103
above, the following econometric models are derived in log-linear form.

Variable measurements, descriptions, and data sources are highlighted in the Appendix below. Renewable energy consumption data in million tons of oil equivalent (Mtoe) obtained from OECD. 107 EF data in global hectares received from global footprint network. 108 Data for the KOF Globalization Index, which measures the political, economic, and social dimensions of globalization, is available from the KOF Swiss Economic Institute. 109 Data on agricultural value added as a percentage of GDP, carbon dioxide emissions (Mtoe), and GDP (constant 2015 U.S. dollars) are available from the World Bank's public website world development indicators (WDI).
CSD and slope heterogeneity tests
Testing the CSD of panels is critical as panels may have significant CSD across countries due to rising trends in interdependence. To this end, the current study sets out to examine cross-sectional correlation tests, which address the problem of panel data estimation and ensure that empirical estimators are unbiased, consistent, and valid. Originally, Pesaran scaled LM, Pesaran CSD, Breusch-Pagan LM, and bias-corrected scaled LM were four different CSD tests developed by Pesaran,
110
Pesaran, Ullah, and Yamagata,
111
Breusch and Pagan,
112
Baltagi, Feng, and Kao
113
with the expression of the following equations 3 and 4.

where the symbols N and T reflect the panel size (cross section) and sample size (period), respectively. It turns out that the presence of CSDs in the dataset will put more emphasis on applying second-generation panel data methods. This will demonstrate more appropriate steady-state results by using second-generation panel stationary tests.
Panel unit root tests
Augmented Dickey Fuller, Phillip Perron, Lin and Chu, Levin, Hadri, Breitung, Im, Pesaran, and Shin are first-generation panel stationarity tests that fail to account for CSDs in longitudinal datasets. Thus, the cross-sectional Im, Pesaran and Shin (CIPS) test developed by Pesaran
114
and the cross-sectional augmented Dickey-Fuller (CADF) test are the second generation panel unit root tests applied in this study to reduce the concern. These panel unit root tests perform better and are more robust because of their asymptotic assumptions and do not require (N⁓∞). Accurate information on the order of sequence integration can be generated using CADF and CIPS tests. The CADF panel unit root test is described in equation (5).



Westerlund cointegration test
After testing the order of integration of selected variables, it is more critical to examine long-term associations between series. Thus, for this purpose, Westerlund
115
developed an error correction model (ECM)-based cointegration test that takes into account the CSD and slope heterogeneity issues, without delving into previous studies analyzing the integration order of series topic. Informatively, this test tolerates differences in the robustness of the regressors. Thus, the test can be used in very general cases, and moreover, the method tends to be arbitrary bootstrapping, allowing multiple repetitions of the long-term cointegration test. The method is mainly based on mean-group tests (Gt and Ga) and panel tests (Pt and Pa), which are combined into four test statistics. The alternative hypothesis (H1) mean-group test statistic indicates that there is at least one long-run association between the variables and the presence of panel cointegration in the long run, as assumed by the alternative hypothesis (H1) of the panel test.116,117 Equation (9) clearly highlights Westerlund's long-run cointegration test.




Long-run elasticity estimation
Long-term parameters are expected to be estimated after confirming long-term associations between series. Eberhardt and Bond
118
proposed mean group (MG), common correlated effects mean group (CCEMG), and AMG estimators that can be used for long-term estimation in this study. These estimators can be used to reveal the impact of relevant explanatory variables on environmental degradation. Furthermore, the AMG estimator proposes a two-stage constraint, mainly the first stage of the AMG estimator, highlighted in Equation (14).


An enhanced version of the mean cross-section with all the above variables is set forth in equation (17).
Granger causality test
The Granger causality test of Dumitrescu and Hurlin
119
can be used after long-term estimated parameters to reveal bidirectional causality between variables of interest. This method is not subject to any restriction of T > N, and is very flexible and applicable. This test is suitable for heterogeneous and unbalanced panels. This method provides robust conclusions even for small samples and CSD, as recognized by Monte Carlo simulations.
120
The Dumitrescu–Hurlin causality test equation can be expressed as:
Results and interpretation
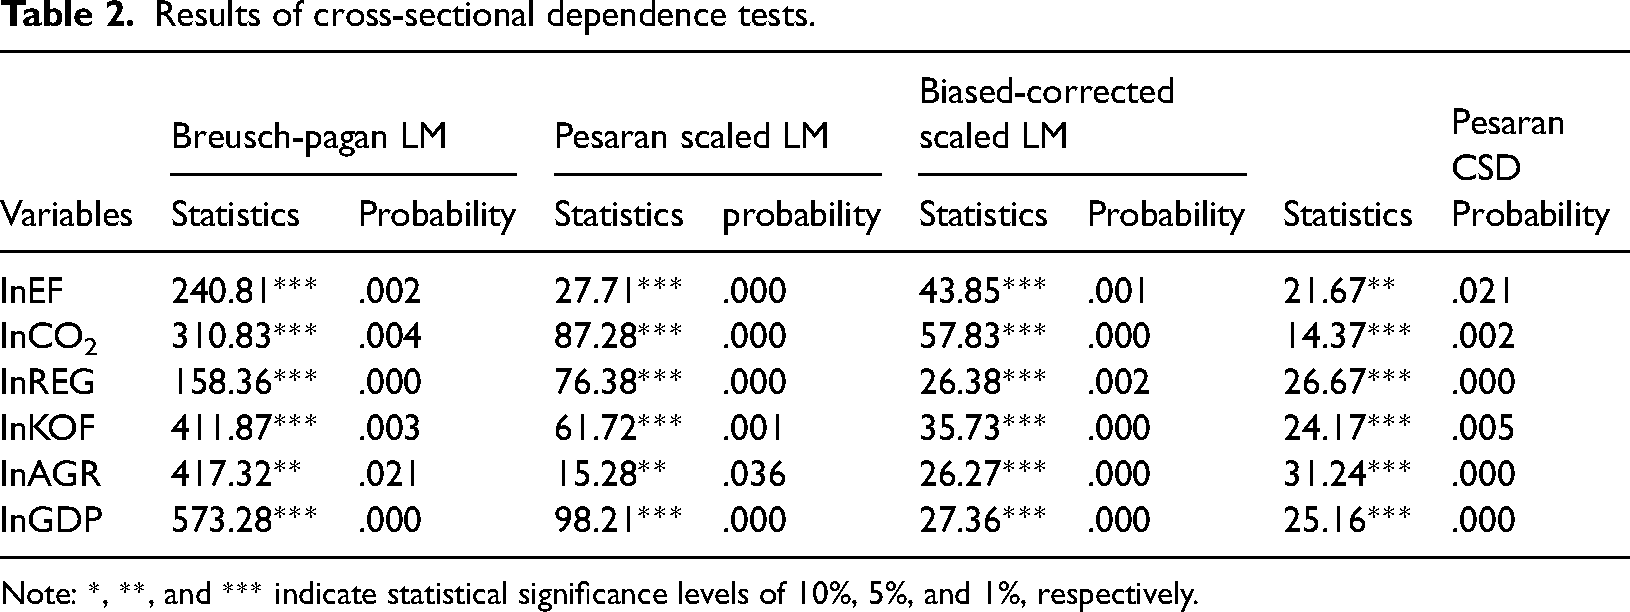
First, to obtain robust estimation results, cross-sectional dependencies in panel datasets can be detected. Pesaran Scaled LM, Pesaran CSD, bias-corrected scaled LM, and BreuschPagan LM are four different CSD tests highlighted in Table 2, providing strong evidence for CSD in the panel data set for the five most populous Asian countries. Therefore, the results clearly show that specific countries in the panel are strongly correlated. The advent of cross-sectional dependency testing suggests that second-generation techniques will yield reliable, robust, efficient, and consistent results.
Results of cross-sectional dependence tests.
Note: *, **, and *** indicate statistical significance levels of 10%, 5%, and 1%, respectively.
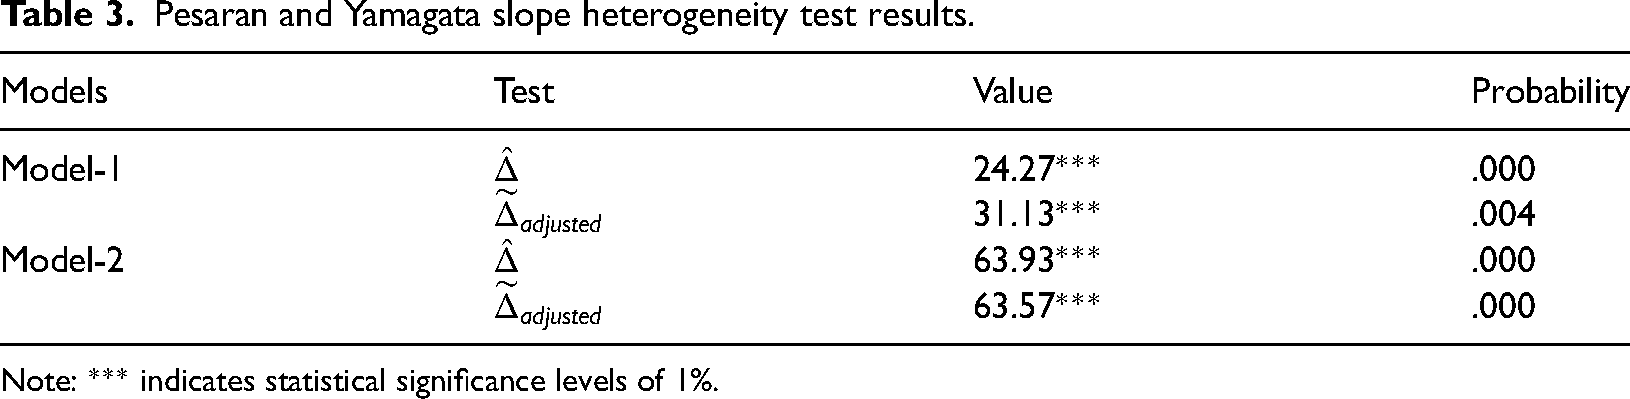
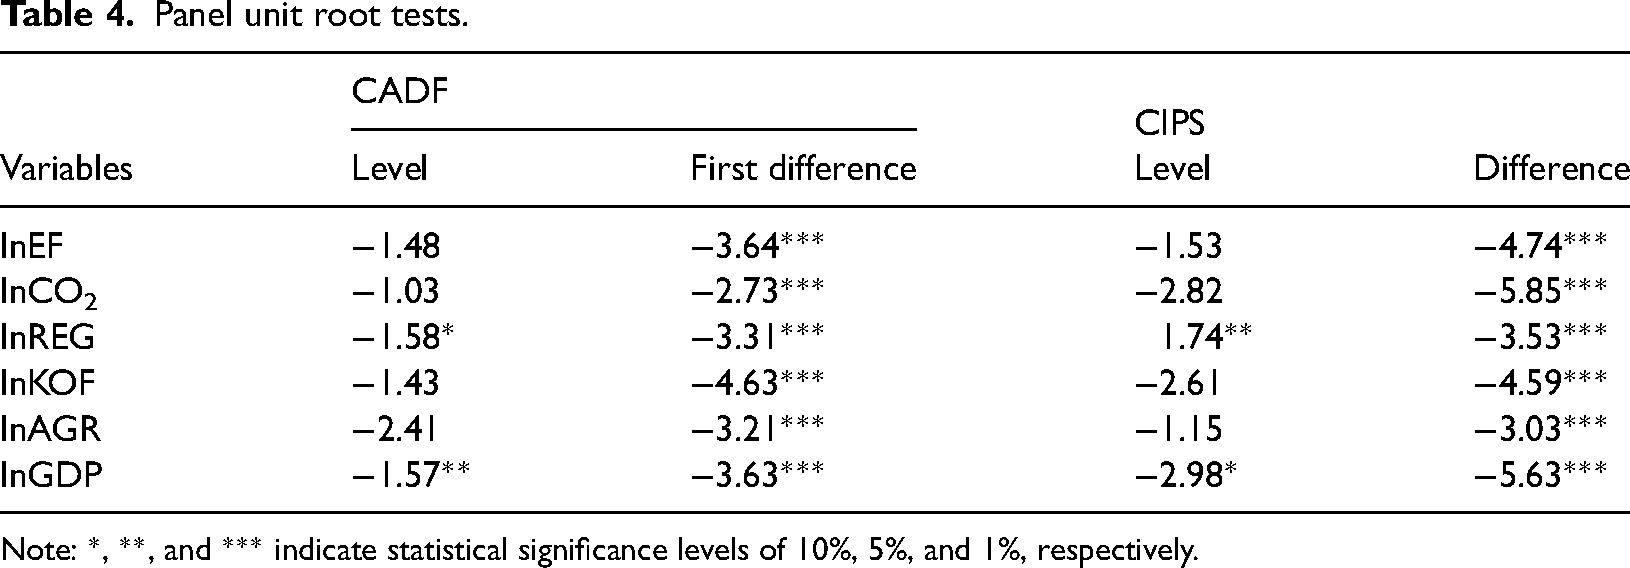
The slope heterogeneity results show that both models in Table 3 suffer from heterogeneity issues, which clearly shows that traditional cointegration techniques and unit root tests may provide biased results. The model test statistic is statistically significant, thus, in this case, the most appropriate method adopted in this study is the second-generation unit root test of CADF and CIPS, and the results are summarized in Table 4. The results of the CADF and CIPS tests show that the model variables are stationary at 1(1) and 1(0), which allows the use of the Westerlund cointegration test.
Pesaran and Yamagata slope heterogeneity test results.
Note: *** indicates statistical significance levels of 1%.
Panel unit root tests.
Note: *, **, and *** indicate statistical significance levels of 10%, 5%, and 1%, respectively.
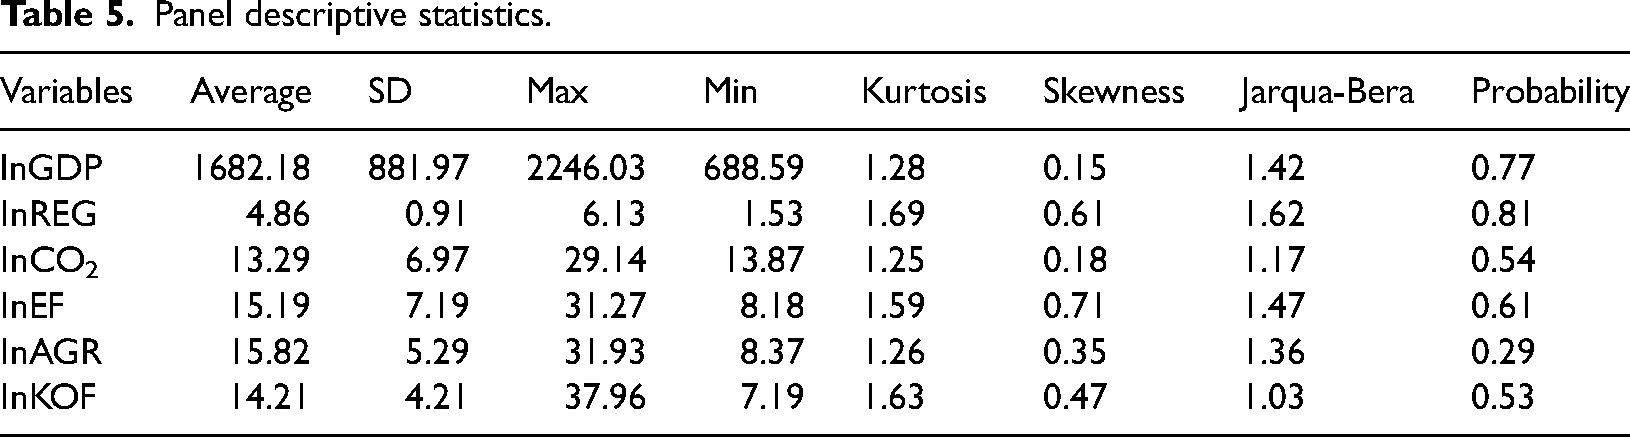
The descriptive statistics of the variables are shown in Table 5, reflecting that US$1682.18 billion is the average GDP of specific countries, illustrating the large variation in the standard deviation during the period 1975–2020. The average EF was recorded at 15.19 global hectares, with a variation of 7.19 global hectares, and the average CO2 emissions were 13.29 million tons, with a variation of nearly 6.97 million tons. Average renewable energy, average agricultural value-added, and average globalization were 4.86 Mtoe, 15.82% and 14.21%, respectively. The skewness statistics are positive, reflecting that all variable data are positively skewed. The kurtosis results show that only GDP is stretched and peaked due to its high statistics. In addition, the Jarque-Bera test obviously shows that none of the variables are significant, reflecting the normal distribution of the variable data.
Panel descriptive statistics.
Multicollinearity issues have been checked using the correlation coefficients and variance inflation factors (VIF) for each variable shown in Table 6. The correlation matrix results show that renewable energy generation and agricultural added value are positively correlated with ecological footprint, while globalization and GDP are negatively connected with ecological footprint. The results for the VIF indicate that there is no multicollinearity in the series, as all values of VIF are below 5.
Correlation matrix and VIF tests.

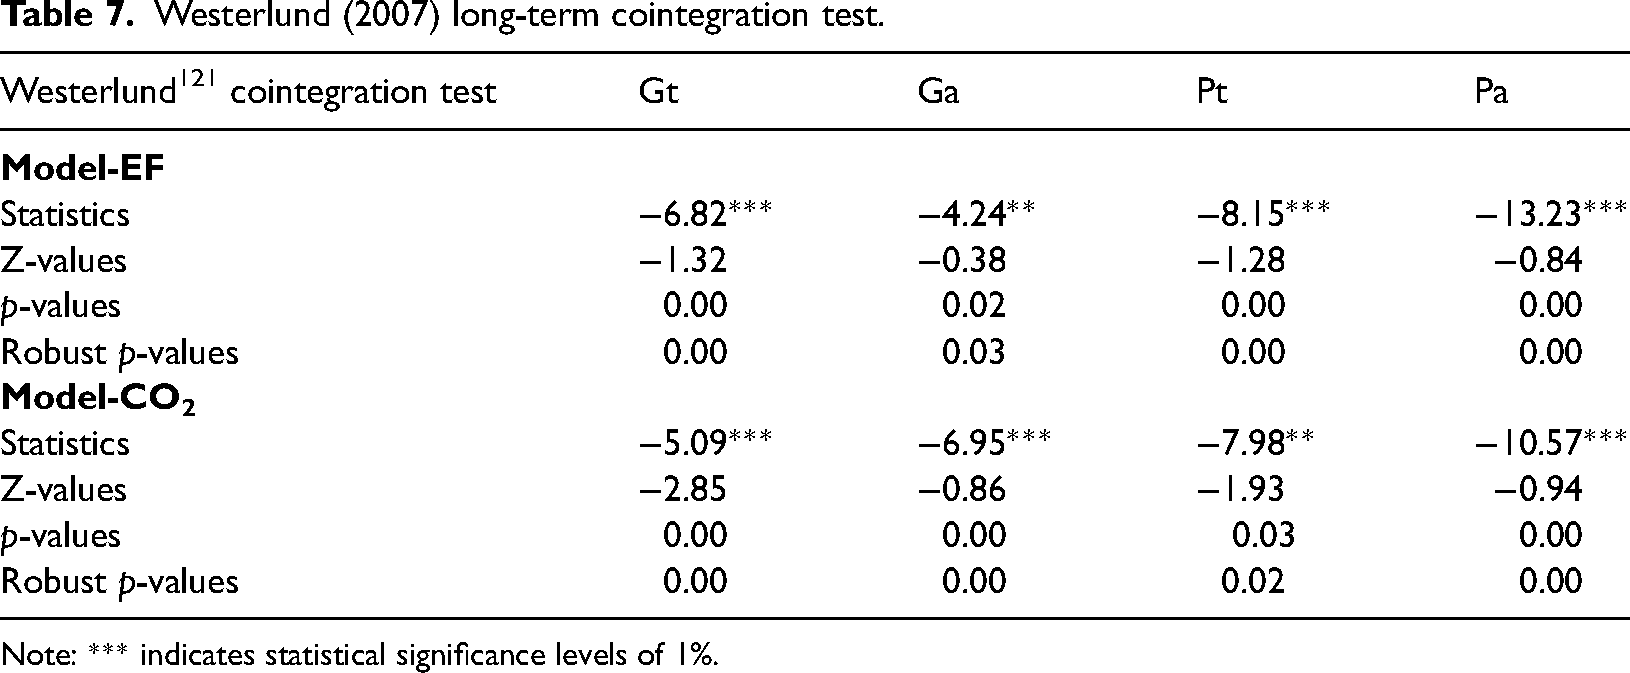
Next, the Westerlund (2007) cointegration test is applied based on the current study using partial integral regressors, which is widely used in the energy-environment literature. This test compromises an exclusive feature of accommodating stationary regressors in the model. The ability to accommodate partially stationary regressors in the model is a unique feature of this test. Thus, for the current study, this test is more appropriate. The results of the Westerlund test shown in Table 7 illustrate the acceptance of the alternative hypothesis implying cointegration in the panel data for the five most populous countries in Asia.
Westerlund (2007) long-term cointegration test.
Note: *** indicates statistical significance levels of 1%.
The derived long-term elasticity results are shown in Table 8. According to the results of the AMG strategy, agricultural value addition contributes significantly to the ecological footprint and carbon emissions of the five most populous countries in Asia. For every 1% increase in agricultural added value, the EF will increase significantly by 0.304%, and the carbon emissions will increase significantly by 0.471%. This finding is consistent with the studies by Abbasi et al. (2021), Usman et al., 90 Adekoya et al., 91 and Muoneke et al. 92 However, this result contradicts the studies of Raihan and Tuspekova, 93 Anwar et al., 44 Raihan and Tuspekova, 94 and Raihan and Tuspekova. 95 A 1% increase in renewable energy generation can significantly reduce the ecological footprint by 0.426% and carbon emissions by 0.309%. This result is in good agreement with the studies by Ramzan et al., 34 Chien et al., 79 Abbasi, Kirikkaleli, and Altuntaş, 122 Omri et al., 80 Usman, Alola, and Sarkodie, 81 Ahmad et al., 82 Suki et al., 83 and Kartal. 84 For every 1% increase in globalization, the ecological footprint can be significantly increased by 0.318%, and the carbon emissions can be significantly increased by 0.528%. This finding is in good agreement with studies by Jahanger, 76 Farooq et al., 77 Usman et al., 99 and Adebayo and Kirikkaleli, 96 also contradicted by Usman et al. 98 The impact of GDP on ecological footprint and carbon emissions is significantly positive, while the impact of GDP2 on ecological footprint and carbon emissions is significantly negative, thus validating the EKC hypothesis for specific Asian populous countries. This result is consistent with the studies by Liu et al., 65 Luo et al., 52 Liu et al., 53 and Ali et al. 54 However, this result contradicts studies by Zeraibi et al., 55 Murshed, Haseeb, and Alam, 56 Dai et al., 57 and Jahanger et al. 58
Long-term elasticities results.

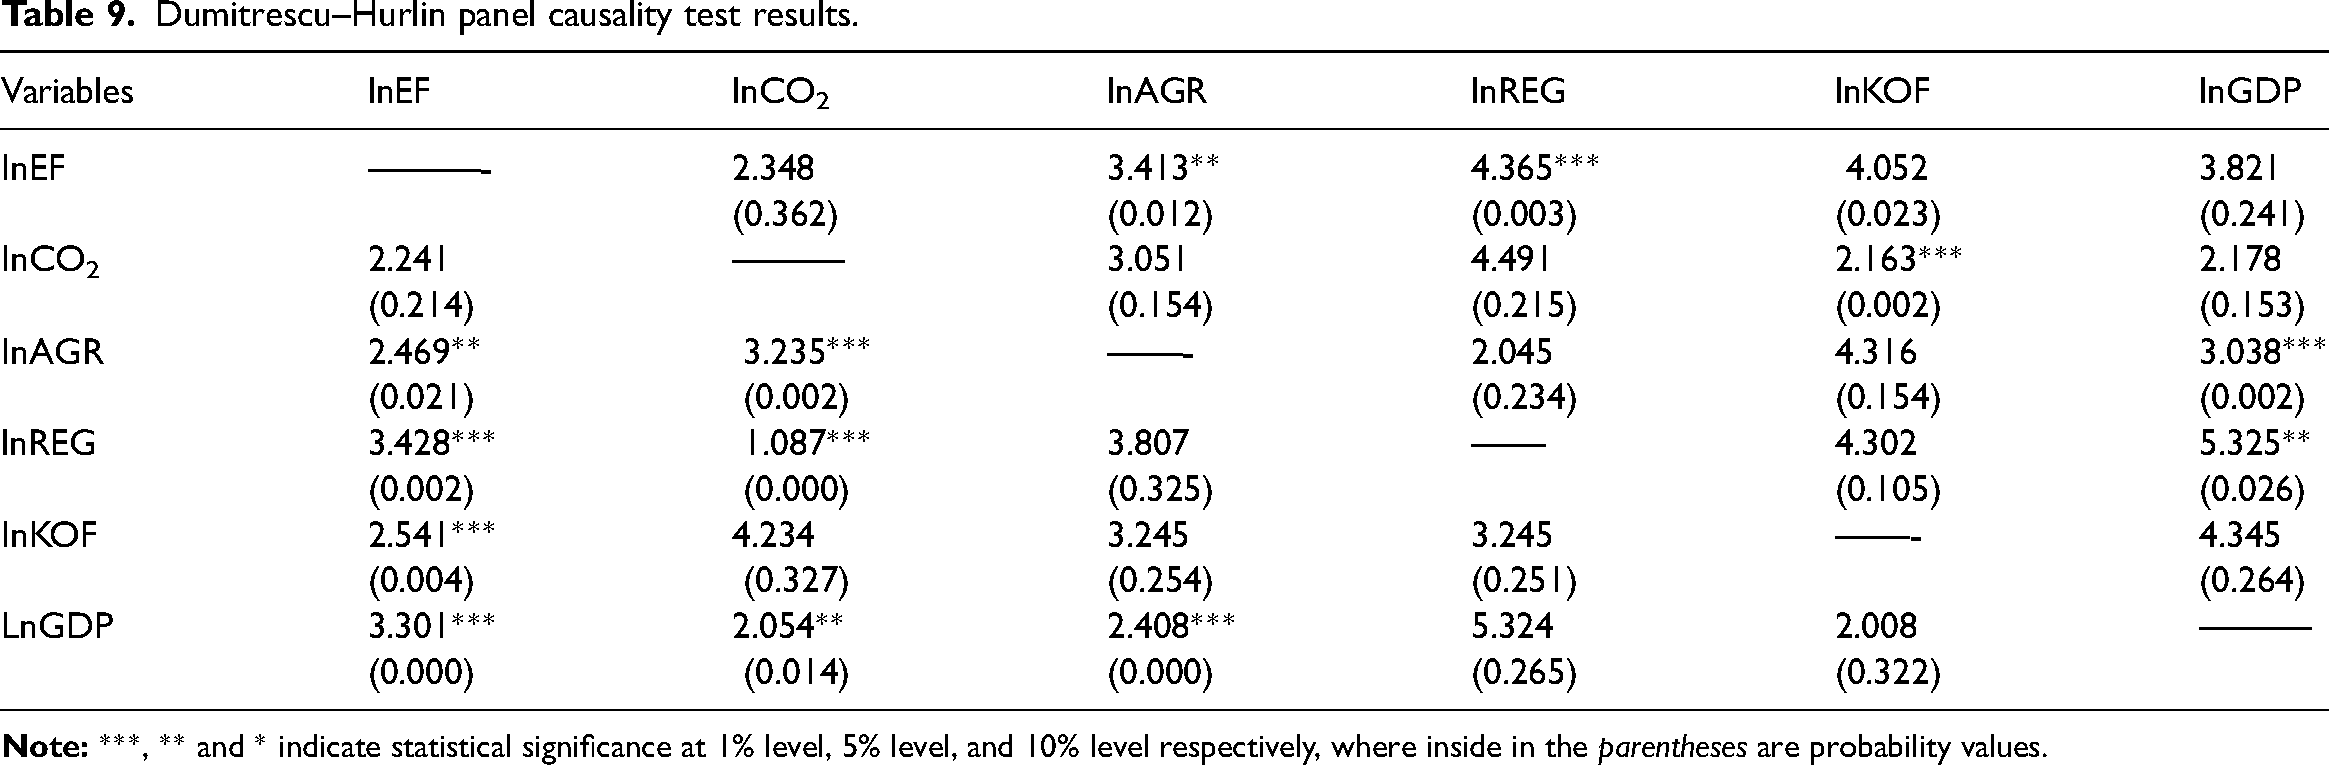
Next, the Dumitrescu–Hurlin causality method was applied to examine the causality among the variables we were interested in for the specific Asian densely populated countries, and the results are shown in Table 9. Renewable energy generation and ecological footprint have bidirectional causality, thus supporting the feedback hypothesis. There is also a two-way causal relationship between agricultural value added and ecological footprint. Moreover, there are one-way causal relationships from carbon emissions to globalization, from agricultural added value to GDP, and from renewable energy power generation to carbon emissions and GDP. There is also a unidirectional causality from globalization to ecological footprint, from GDP to ecological footprint, carbon emissions and agricultural added value.
Dumitrescu–Hurlin panel causality test results.
Discussion
This study aims to be inquisitive about a vital theme in sustainable development research based on the upgrading of renewable energy production systems to mitigate carbon dioxide and GHG emissions. Countries such as China, India, Pakistan, Indonesia, and Bangladesh were chosen because these countries are considered to be the largest consumers of fossil fuels in the world. These countries must replace fossil fuels with renewable energy sources such as solar, wind, and biomass to reduce pressure on the environment.
The results are consistent with the international literature, provocative statements of scholars and experts, and the performance of various countries. Agricultural value addition contributes significantly to the ecological footprint and carbon emissions of the five most populous countries in Asia. This finding is consistent with the studies by Abbasi et al. (2021), Usman et al., 90 Adekoya et al., 91 and Muoneke et al. 92 However, this result contradicts the studies of Raihan and Tuspekova, 93 Anwar et al., 44 Raihan and Tuspekova, 94 and Raihan and Tuspekova. 95 The result reflects that agricultural vegetation based on fossil fuel inputs and outdated technologies exacerbates environmental quality and hinders achievement of SDGs.
An increase in renewable energy generation can significantly reduce ecological footprint and carbon emissions. This result is in good agreement with the studies by Ramzan et al., 34 Chien et al., 79 Abbasi, Kirikkaleli, and Altuntaş, 122 Omri et al., 80 Usman, Alola, and Sarkodie, 81 Ahmad et al., 82 Suki et al., 83 and Kartal. 84 A technically feasible and economically effective strategy to reduce environmental pollution is to use renewable energy. Renewable energy can reduce dependence on fossil fuels, thereby ensuring energy security and preventing air pollution. Moreover, the use of renewable energy sources, such as solar energy, geothermal energy, biomass energy, wind energy, and hydropower, are all renewable energy sources that can be used to reduce costs associated with energy imports.
The rise of globalization can significantly increase ecological footprints and carbon emissions. This finding is in good agreement with studies by Jahanger, 76 Farooq et al., 77 Usman et al., 99 and Adebayo and Kirikkaleli, 96 also contradicted by Usman et al. 98 Higher CO2 emissions and ecological footprints are directly affected by production and consumption activities. Environmental conditions may worsen as production technologies remain unchanged in the process of globalization. Conversely, if economic globalization provides environmentally friendly technologies, it can improve environmental quality as foreign direct investment and trade volumes increase.
The impact of GDP on ecological footprint and carbon emissions is significantly positive, while the impact of GDP2 on ecological footprint and carbon emissions is significantly negative, thus validating the EKC hypothesis for specific Asian populous countries. This result is consistent with the studies by Liu et al., 65 Luo et al., 52 Liu et al., 53 and Ali et al. 54 However, this result contradicts studies by Zeraibi et al., 55 Murshed, Haseeb, and Alam, 56 Dai et al., 57 and Jahanger et al. 58 Moreover, renewable energy generation and EF have bidirectional causality, thus supporting the feedback hypothesis. There is also a two-way causal relationship between agricultural value added and ecological footprint.
Conclusion and policy recommendation
Deforestation, water pollution and global warming are environmental issues that threaten the sustainable production of natural resources and consumption by future generations. Several international conferences have been held on mitigating environmental problems and achieving SDGs. However, despite pledges to reduce emissions under the Kyoto Protocol and the Paris Conference, the ecological footprint and CO2 emissions of developing countries are still rising. Thus, innovative research is needed to detect factors affecting environmental pollution and implement further policy actions. In this regard, this study examines the impact of agricultural value added, renewable energy, and globalization on CO2 emissions and ecological footprints in selected Asian densely populated countries. In performing this task, the Westerlund cointegration test, the MG, AMG, and CCEMG estimators for the long-run coefficient elasticity, and the Dumtrescu–Hurlin causality test are applied.
Westerlund's cointegration test shows that agricultural value added, renewable energy generation, globalization, GDP, and pollution indicators have long-term cointegration relationships. The long-term resilience results clearly show that agricultural value added and globalization make significant contributions to the ecological footprint and carbon emissions of the five most populous countries in Asia. However, renewable energy generation significantly reduces the ecological footprint and carbon emissions. Moreover, the impact of GDP on ecological footprint and carbon emissions is significantly positive, while the impact of GDP2 on ecological footprint and carbon emissions is significantly negative, thus validating the EKC hypothesis for specific Asian populous countries. The results of the causality test indicated a two-way causality between renewable energy generation and ecological footprint, supporting the feedback hypothesis. There is also a two-way causal relationship between agricultural value added and ecological footprint. Moreover, there are one-way causal relationships from carbon emissions to globalization, from agricultural added value to GDP, and from renewable energy power generation to carbon emissions and GDP. There is also a uni-directional causality from globalization to ecological footprint, from GDP to ecological footprint, carbon emissions and agricultural added value.
Based on the above empirical findings, this study provides some key policy implications. For the densely populated countries in Asia, renewable energy generation is the best strategy to fight environmental pollution. The bidirectional causality of the relationship between agricultural added value and environmental pollution shows that agriculture is the main determinant of environmental pollution, and environmental problems affect agricultural activities. Certain densely populated countries in Asia (China, India, Bangladesh, Pakistan, and Indonesia) should encourage clean energy production and consumption in the agricultural sector, and increased investment in renewable energy can improve environmental quality and agricultural production. In densely populated countries, rational use of fertilizers and pesticides, as well as environmentally friendly and advanced technologies can help reduce carbon dioxide emissions. Carbon dioxide emissions can also be reduced as agricultural areas are used more efficiently, producing more crops with less soil. In addition, governments with large populations must promote modern farming techniques, such as tunnel farming and organic farming, to help reduce pressure on the environment. Moreover, farmers must be aware of environmental issues, encouraging the use of animal fertilizers, preventing forest encroachment, providing clean inputs in farming activities and rewarding low-carbon-intensive agricultural production will help specific Asian countries to achieve SDGs. Sustainable development policies must be revised on the basis of the conflict between globalization and environmental pollution. In addition, sustainable development policies in densely populated countries in Asia are not conducive to the environment, as these regions rely heavily on fossil fuel energy consumption. These countries can overcome environmental degradation through regional, economic, and social cooperation.
As a future research direction, the impact of renewable energy, globalization and agriculture on environmental pollution could be examined by considering the subcomponents of globalization and ecological footprint. The study could also be expanded to cover more populous countries outside of Asia. Thus, more comprehensive information and a higher level of knowledge can be obtained on the impact of agriculture and renewable energy on environmental pollution.
Footnotes
Availability of data and material
The data that support the findings of this study are openly available on the World Development Indicator page published by World Bank
40
at https://databank.worldbank.org/source/world-development-indicators. Infrastructure investment data are available online on the OECD page published by OECD
107
retrieved from  .
.
Declaration of conflicting interests
The authors declared no potential conflicts of interest with respect to the research, authorship, and/or publication of this article.
Funding
The authors received no financial support for the research, authorship, and/or publication of this article.
Appendix: Description and measurement of variables and data sources.

| Variables | Description | Measurment | Sources |
|---|---|---|---|
| GDP | Gross domestic product | Constant 2015 US$ | WDI 39 |
| AGR | Agriculture value added | Percentage of GDP | WDI 39 |
| REC | Renewable energy consumption | Million tons of oil equivalent (Mtoe) | 107 |
| CO2 | Carbon dioxide emission | Million metric tons (Mmt), | WDI 39 |
| KOF | Globalization | Globalization index | 109 |
| EF | Ecological footprint | Global hectares | 108 |