



Abstract
To promote low-carbon development of the construction industry and popularize green buildings (GBs), considering the influence of marketing efforts and innovation capability on GB market demand, this paper constructs multiple incentive decision models based on contract theory, analyzes developers’ decision-making behaviors for incentivizing contractors’ green technology innovation (GTI) under different incentive decision models; and explores the impacts of greenness preference and service quality preference on contract prices, sales prices, innovation levels and marketing effort levels. In addition, the impacts of marketing effort cost coefficient and innovation capability on innovation levels, marketing effort levels and developers’ profits are simulated through parameter assignment and computer software. The results show that greenness preference and service quality preference have positive impacts on developers’ and contractors’ decisions and profits; under the decision model based on innovation level, the developers maximize profits, but the developers’ marketing effort levels and contractors’ innovation levels are lower at this time; under the decision model based on cost-sharing, the contractors have the highest innovation levels and achieve optimal profits, while the innovation capability can promote innovative activities. The results of the study have guiding significance for enhancing the levels of GTI and promoting the development of GBs.
Keywords
Introduction
Human social and economic activities have led to global warming and an energy crisis, 1 and how to coordinate the relationship between these activities, save energy and emissions reduction and environmental protection has become an important issue faced by countries around the world in the process of development. 2 In particular, environmental protection, climate warming and solid waste pollution have become urgent environmental issues that need to be addressed. According to the report “Carbon dioxide emissions from fuel combustion 2018: a review” published by the International Energy Agency, in 2016 the world consumed 13.276 billion tons of primary energy, emitted 32.31 billion tons of carbon dioxide and produced 2.01 billion tons of solid waste. In response, governments are actively promoting the concept of green development to protect the environment and conserve resources. 3 For example, as the official goal of China's “dual carbon” strategy, the Chinese government announced that “China will further strengthen its capability for innovation, and adopt more proactive and effective policies and measures, and strive to achieve carbon peaking by 2030 and carbon neutrality by 2060”. 4
Compared to other industries, the construction industry accounts for a large share of carbon dioxide emissions and solid waste.2,5 By the end of 2019, China's carbon emissions from the construction industry had reached a record high of 10 billion tons, which accounts for 28% of global carbon emissions. 6 Traditional buildings with high pollution and energy consumption no longer fit into the new concept of green development, 7 especially in the process of achieving the “double carbon” strategic goal. With the advantages of environmental adaptation, eco-friendliness, 8 green buildings (GBs) have become a key pathway for saving energy, reducing emissions and transformation in the construction industry. 9 Green buildings can maximize resource conservation, reduce pollution and protect the environment, and provide a healthy living space throughout a buildings’ life cycle. 10 When comparing life cycle carbon dioxide emissions, GBs emit 10% less carbon dioxide than nongreen residential buildings and 32% less than traditional commercial buildings. 11
Despite the benefits associated with GBs can be classified into three broad categories: economic, 12 social 13 and environmental, 14 the development of GBs is hindered by complex construction methods, 15 GB rating systems, 16 high costs 17 and lack of personal GB knowledge and skills. 18 In addition, Ofek et al. 19 explored factors influencing the investment decisions of three GB interest groups—consumers, architects, and building developers in Israel. They found that energy price increases and striving for innovation are the main factors influencing developers’ decisions. Due to the dramatic construction boom and rapid urbanization, the development of GBs is of great significance not only in China but also in the world. 20 Therefore, to mitigate the problems associated with GB development, a number of studies have been conducted in academia. Government subsidies, tax policies 21 and economic benefits 22 have been used to promote GB development. With further research, scholars have found that stakeholders are the fundamental driving force of the GB development, 23 which involves developers, design units, and construction units and suppliers. 24 They promote the GB development through different green behavior (i.e., taking measures from different angles). 25 What's more, Sparrevik et al. 26 found that once green technologies had been integrated into the design and procurement phase, the development of GBs would be promoted. Meanwhile, with the development of the new generation of information technology, consumers’ requirements show the diversified trend. 27 It has forced developers to carry out technology innovation to keep up with demand. Research on GB technology innovation mainly involves green innovation resources and innovation capability. Green innovation resources include intellectual resources, financial resources, existing technical resources and cultural resources. 24 Green innovation capability contains green innovation resource inputs, green innovation resource management and environmental protection, and emphasizes the significance of government subsidies.28,29
In addition, marketing efforts such as advertising, channel expansion and salesperson explanations, have been the subject of inquiries by many scholars, given that this could create higher demand. 30 For instance, Dai and Meng 31 discovered that marketing efforts can increase consumer demand with the price remaining unchanged. Song et al. 32 considered the impacts of different power structures on manufacturers’ and retailers’ production decisions when product quality and sales efforts affected demand simultaneously. Lu et al. 28 analyzed the impacts of product experience and marketing efforts on demand in different channels from the perspective of consumer utility, and explored the impacts of product experience and marketing effort on the choice of different distribution channels based on three distribution channel cooperation strategies. Xing et al. 33 constructed a profit function for the members of the live e-commerce service supply chain, studied the quality effort strategy problems and explored the impacts of the commission ratio of the host and the draw ratio of the live service platform on the optimal strategy and optimal profit of the service supply chain.
Research results from government subsidies, tax policies and other external policies to promote GB development and green technology innovation (GTI), have provided valuable reference points for stimulating GB technology innovation. However, fewer scholars have analyzed developers’ incentive for contractors’ innovation decisions from the perspective of GB products’ innovation subjects, especially considering both marketing efforts and innovation capability to explore how developers can stimulate contractors’ GB technology innovation. In order to fill in the gaps, this study aims to construct a model that portrays the incentive process of developers towards GTI by contractors, based on the perspective of different types of contracts. More specifically, it is committed to answer the questions: (1) How do marketing efforts and innovation capability affect developers’ and contractors’ decisions; (2) What contracts can developers choose to achieve win–win results? (3) How does consumer behaviors influence decision-making?
The rest of this paper is arranged as follows: The next section describes the decision model and formulates basic assumptions. Then incentive decision models under different contracts are constructed, and optimal decision levels of developers and contractors are obtained. “Comparative analysis” section explores the impacts of relevant parameters, including greenness preference and service quality preference. The impacts of marketing effort cost coefficient and innovation capability on innovation levels, marketing effort levels and developers’ profits are simulated in “Numerical simulation” section. In the final section, conclusions are drawn, and recommendations are provided.
Model description and assumptions
This study focuses on developers (D) and contractors (C) as research subjects, investigating the simultaneous impact of marketing efforts and innovation capabilities on market demand. It analyzes the decision model through how developers encourage contractors to engage in green technological innovation under different incentive contracts. The fundamental pattern of how developers incentivize contractors’ green technological innovation is examined in Figure 1, which can be described as follows: (1) the developers offer the contractors incentive contracts, then contractors accept it and invest financial resources to engage in GTI; (2) the contractors decide the innovation levels and contract prices of GBs; (3) the developers decide the sales prices and marketing effort levels based on the contractors’ decision. In practice, consumers generally tend to purchase products that have high greenness and can provide superior services. That is, consumers have consumption preference. This paper defines consumption preference as greenness preference and marketing service quality preference. Greenness preference is a measure of consumers’ preference for the innovation levels of GB products. Marketing service quality preference indicates that consumers are more inclined to buy products that can provide quality service. For subsequent analysis, some assumptions are made.
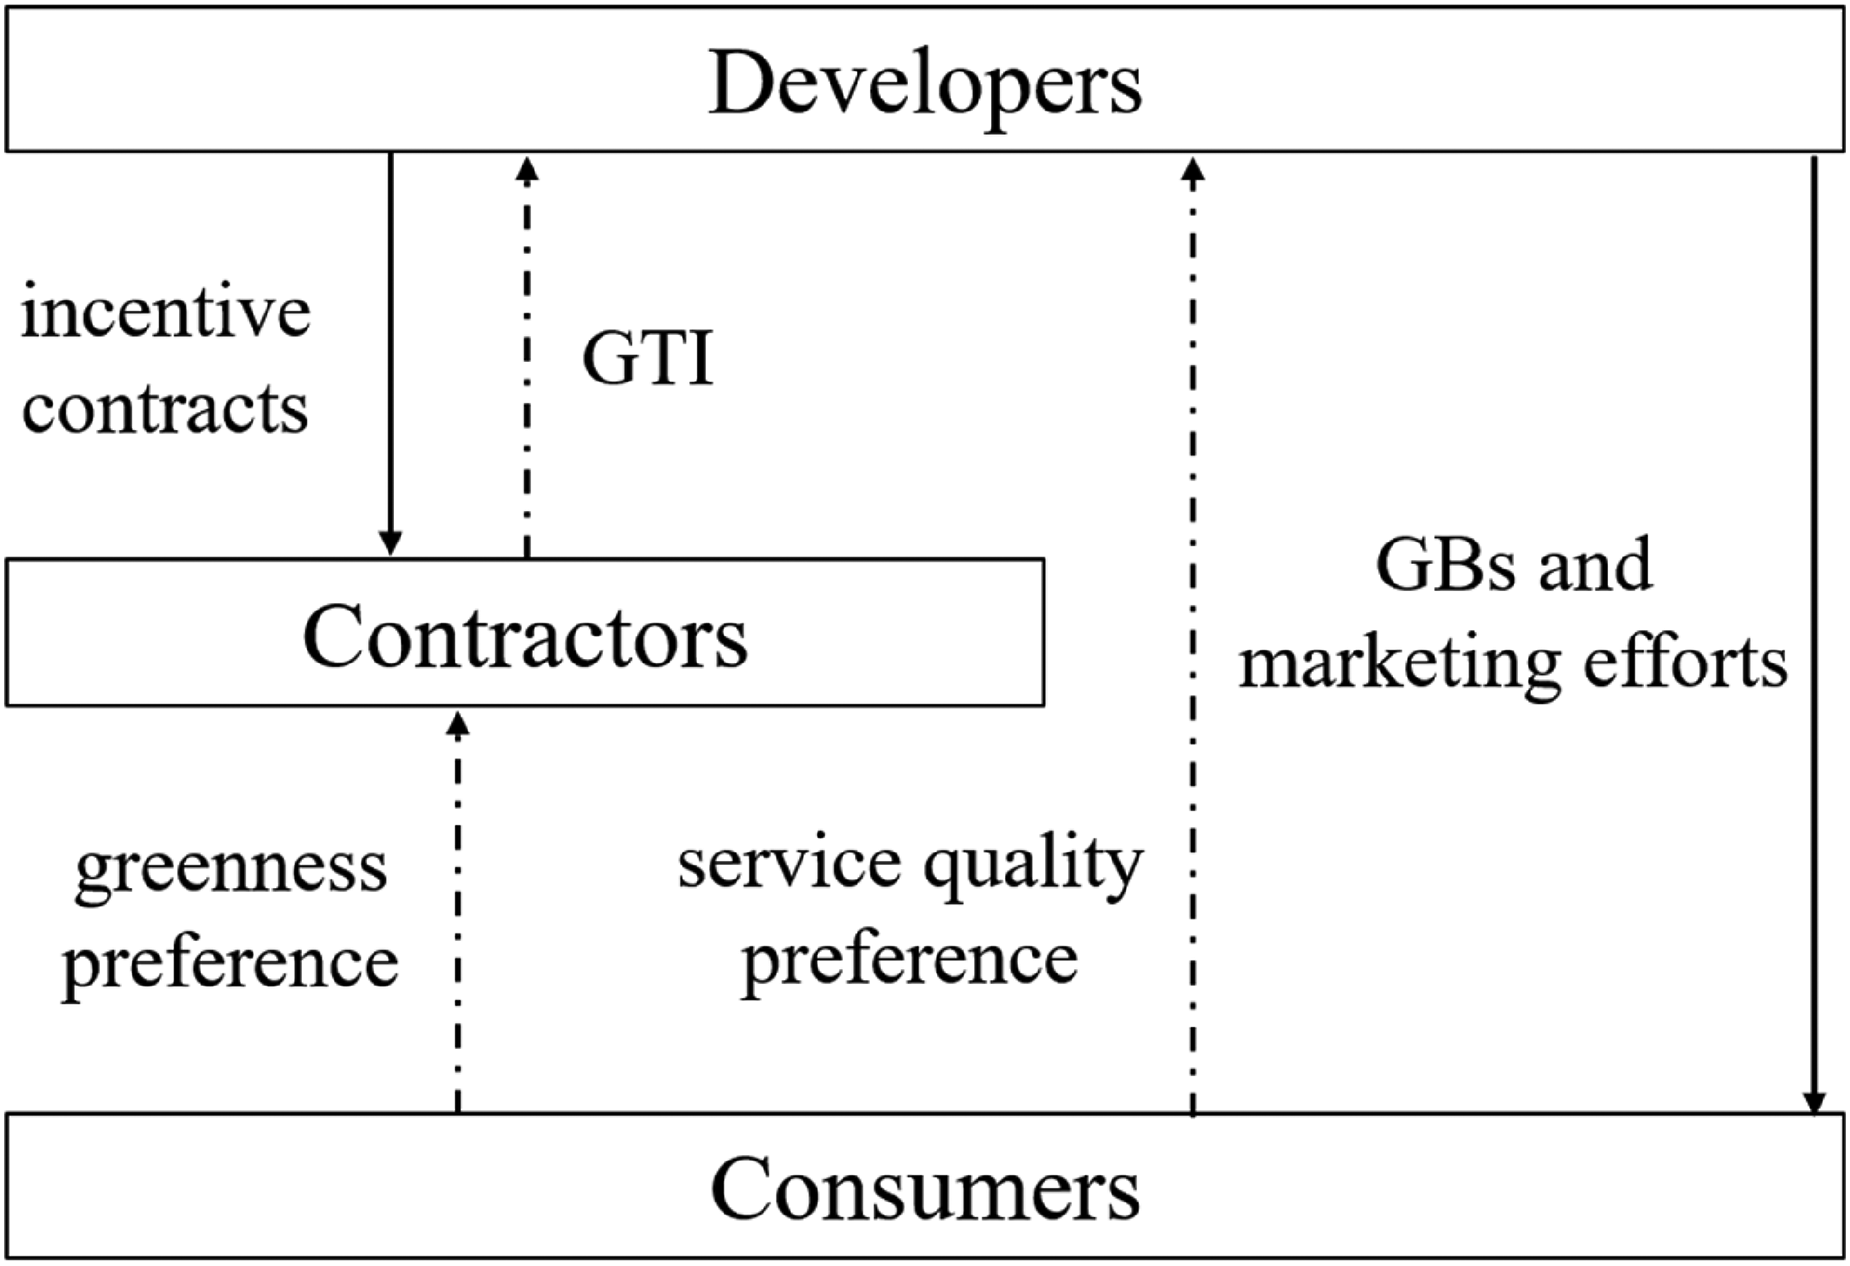
Basic model for developers to motivate contractors in green technology innovation (GTI).
Assumption 1: According to different contract models in construction sectors such as unit price contract, fixed total price contract and cost-plus-fee contract, the decision model has been developed for developers to incentivize contractors to undertake GTI, considering contract base price, innovation level and cost-sharing.
Assumption 2: Contractors accept the incentive contracts and invest to engage in GTI. The input cost is CI = a2 /2c, where a (a > 0) represents the innovation level and directly determines the greenness of GB products. A similar innovation cost function was used by Gurnani et al. 34 and Liu et al. 35
Assumption 3: In order to expand market demand, developers use advertising and other means to promote GB products. The marketing efforts cost is 1/2kb2. Such cost functions are also used by Cárdenas-Barrón and Sana, 36 Song et al. 32 and Pal et al. 37
Assumption 4: Market demand of GB products is influenced not only by the contract prices but also by greenness and service quality. Let the market demand function be D = π0–αp+βa+γb. The larger the β, the more inclined consumers are to buy GB products with higher innovation level. Similarly, the larger the γ, the more inclined consumers are to buy products with higher marketing effort level. This type of demand function has also been approximated in previous studies (e.g., Ghosh & Shah, 38 Ma et al. 39 and Dabaghian et al. 40 ).
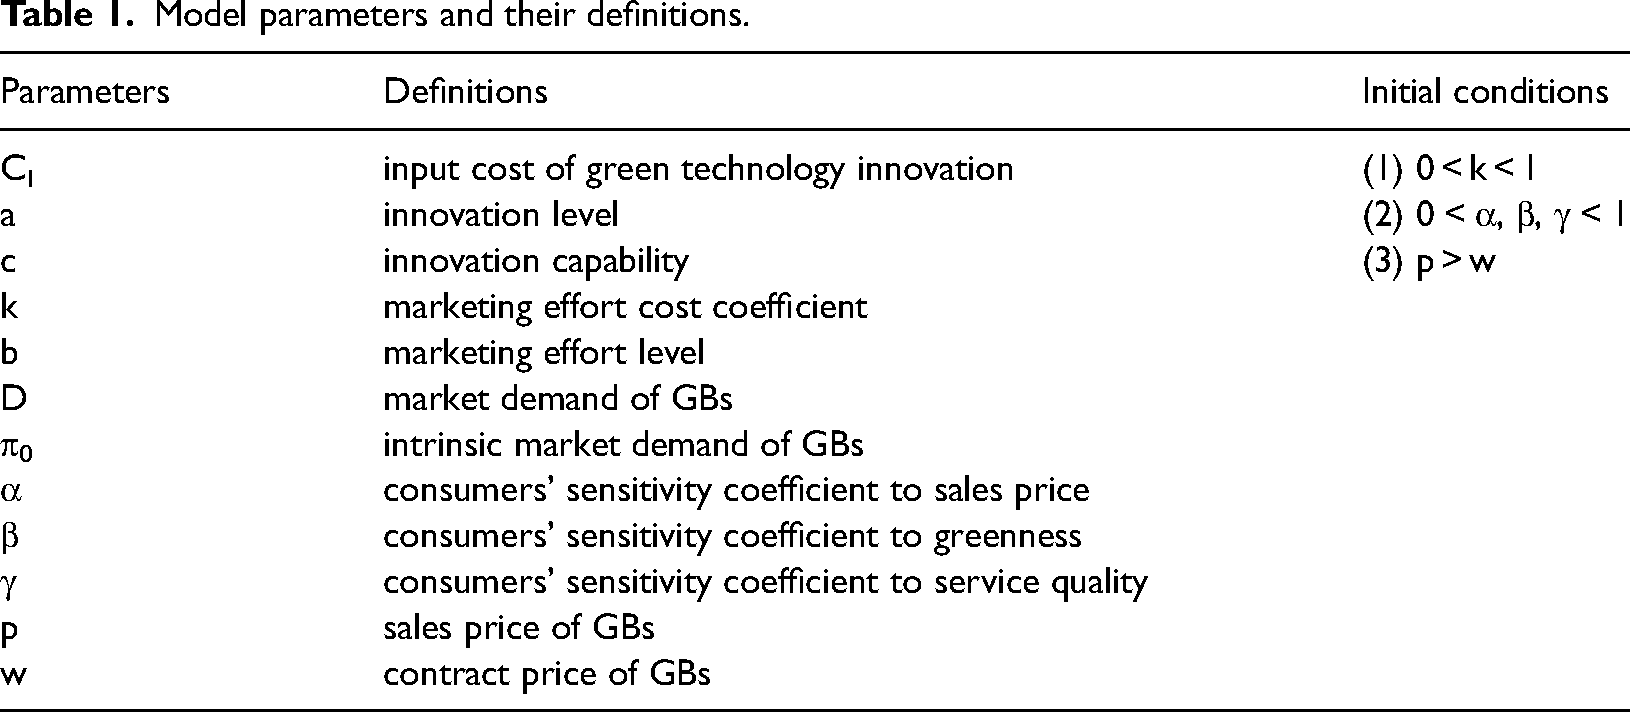
The related parameters and their definitions are shown in Table 1. The superscripts 1, 2 and 3 represent three different models.
Model parameters and their definitions.
Multicontract incentive model for GTI decisions
The decision model of GTI based on contract price
Manufacturers’ preference for wholesale price contract can be interpreted as their concern that end-of-season payment contracts will hinder retailers’ marketing efforts. Additionally, profit under wholesale price contracts has nothing to do with demand, so they are widely used. 41 For example, Xu et al. 42 studied the coordination of wholesale price contracts on manufacturers and retailers under a control-and-trade system for carbon aggregates. Taleizadeh et al. 43 studied the coordination of wholesale price contracts on green supply chain and found that wholesale price contracts were the most effective in coordinating green supply chains.
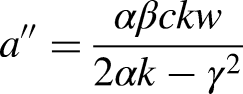
In this paper, we introduce a decision model based on contract price (abbreviation: CP) to analyze the impacts of contract price on the decision levels of developers and contractors. Under this model, the developers determine the sales price and marketing effort level, and the contractors determine the innovation level and contract price. The developers’ and contractors’ profit functions (WD1, WC1) are






The decision model of GTI based on innovation level
However, the wholesale price contract often does not motivate channel partners to reach optimal levels of profit.
44
Therefore, scholars have explored other incentive mechanisms, such as Wang et al.
45
and Liu et al.
35
found that manufacturers were able to make optimal profits under a quality-based wholesale price contract. In this paper, we introduce a decision model based on innovation level (abbreviation: IL), and study the decision levels. Firstly, the developers pay the contractors a fixed fee π1 and offer an incentive contract; secondly, the contractors innovate GTI and decide the innovation level. Then the developers decide the sales price, contract price and marketing effort level. Assuming that the profit of contractors from the non GTI process is π2. The developers’ and contractors’ profit functions (WD2, WC2) are









The decision model of GTI based on cost-sharing
In the supply chain management literature, cost-sharing contracts are widely used by firms to mitigate or eliminate the double marginalization problem.46,47 In addition, cost-sharing contract result in higher profits for individual firms and an increase in supply chain profits. 48 Therefore, cost-sharing contracts have received wide attention. For instance, Wu et al. 49 and Li et al. 50 studied how cost-sharing contracts influence optimal decision-making and found that the use of cost-sharing contracts can achieve decision-making and overall profit optimization.
This paper introduces a decision model based on cost-sharing (abbreviation: CS). Under this model, developers share part of the contractors’ innovation costs, and the cost-sharing coefficient is η (0 < η <1). Then contractors carry out GTI and decide the innovation level and contract price. Finally, developers decide the sales price and marketing effort level. The developers’ and contractors’ profit functions (WD3, WC3) are







Comparative analysis
Based on the above content, we can obtain the following Lemmas by comparing the optimal levels of decision-making under three models and analyzing the impacts of relevant parameters, including greenness preference and service quality preference on the decision-making behaviors of developers and contractors.
Lemma 1: Under any kinds of models, sales prices, marketing effort levels, contract prices and innovation levels all increase as the innovation capability increases and decreases as the marketing effort cost coefficient increases.
Proof: Since the optimal decision changes are the same under three incentive decision models, we take the decision model on CP as an example for validation.
(1) The first partial derivatives of p1, b1, w1 and a1 with respect to c can be expressed Lemma 2: Under three incentive decision models, the sales prices and contract prices are increasing functions with respect to greenness preference and service quality preference.



Proof: We also take the decision model on CP as an example for validation.
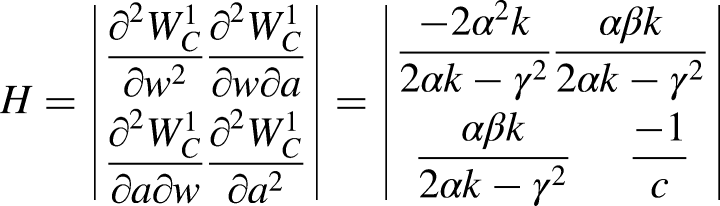
(1) The first partial derivatives of p1 and w1, respectively, with β can be expressed as Lemma 3: Under the decision model on IL, when 

Proof: (1) Under the decision model on IL, the first partial derivative of b2 with respect to β can be expressed
Let
(2) Under the decision model on CP and CS, the first partial derivatives of b1, b3 with respect to β are obtained as Lemma 4: The cost-sharing coefficient increases with greenness preference and service quality preference.
Proof: For equation (11), the first partial derivatives of η with respect to β and γ can be expressed as
Lemma 4 shows that an increase in greenness preference and service quality preference can motivate developers to share more innovation costs. According to Lemma 2, the increase in greenness preference leads to an increase in sales prices. And that increased revenue for developers makes them to be willing to share more innovation costs.
58
When service quality preference increases, developers increase marketing investment in order to expand market demand. In the same way, the increased service quality preference is also driving developers to bear more innovation costs. Although the proportion of innovation cost sharing is minimized when service quality preference tends to zero, developers still choose to share innovation costs with contractors due to the presence of greenness preference.
Lemma 5: The relationships between developers’ profits, marketing effort levels and innovation levels in the three incentive decision models are as follows.
(1) The relationships between developers’ profits and marketing effort levels in the three incentive decision models are
When
When
(2) The relationships between innovation levels in the three incentive decision models are a2 < a1 < a3
Proof: (1) Firstly, by making the difference between b1, b2 and b3 in order, we get

Similarly, we can prove that b2 > b1.
Therefore, when
Lemma 5 shows the relationships between marketing effort levels, innovation levels and developers’ profits under three incentive decision models. From the comparison, it can be found that (1) developers have higher profits under the decision model on IL, while the contractors have the lowest innovation level. This is because, on the one hand, the developers determine the sales price, contract price and marketing effort level, and contractors only determine the innovation level. Contractors have less information, resulting in the increased market uncertainty. And the increased market uncertainty exposes GTI to high risks. 59 Therefore, contractors are less willing to innovate, which leads to less innovation levels. On the other hand, under the decision model on IL, the developers’ marketing effort level is higher. When greenness preference is certain, the developers’ profits increase as service quality preference increases, so the developers gain higher profits. (2) Contractors have the highest innovation level under the decision model on CS. Because the developers share part of innovation costs, contractors invest less in GTI. Therefore, contractors increase investment to achieve higher innovation level.
Numerical simulation
Based on comparative analysis, this section adopts a parameter assignment method to analyze the trend of innovation levels and marketing effort levels when greenness preference and service quality preference change, and further analyzes the impacts of changes in the relevant parameters on innovation levels and marketing effort levels as well as developers’ profits. In accordance with Liu et al. 35 and Hao et al., 60 this paper assigns values to the relevant parameters. The specific values are shown in Table 2.
Assignment of model-related parameters.

Sensitivity analysis of innovation levels and marketing effort levels to greenness preference and service quality preference
Sensitivity analysis of innovation levels and marketing effort levels to service quality preference. Based on Table 2, the impacts of changes in service quality preference on innovation levels and marketing effort levels are given in Table 3.
Sensitivity analysis of variables a and b to service quality preference.

Table 3 reflects the changes in marketing effort levels and innovation levels with service quality preference when β = 0.5 and 0.1 ≤ γ ≤ 0.8. The variation of the data in the table shows that: (1) the innovation levels increase with service quality preference under three models, but the overall variation is small. The lowest innovation level is found under the decision model based on contract price and the highest under the decision model on CS, which validates Lemma 5. (2) Under three models, the marketing effort levels increase with the increase in service quality preference, and the overall variation is higher. (3) An increase in service quality preference shows that consumers tend to purchase products that provide superior services. Also, as the innovation levels increase, developers are willing to invest more into marketing. 57
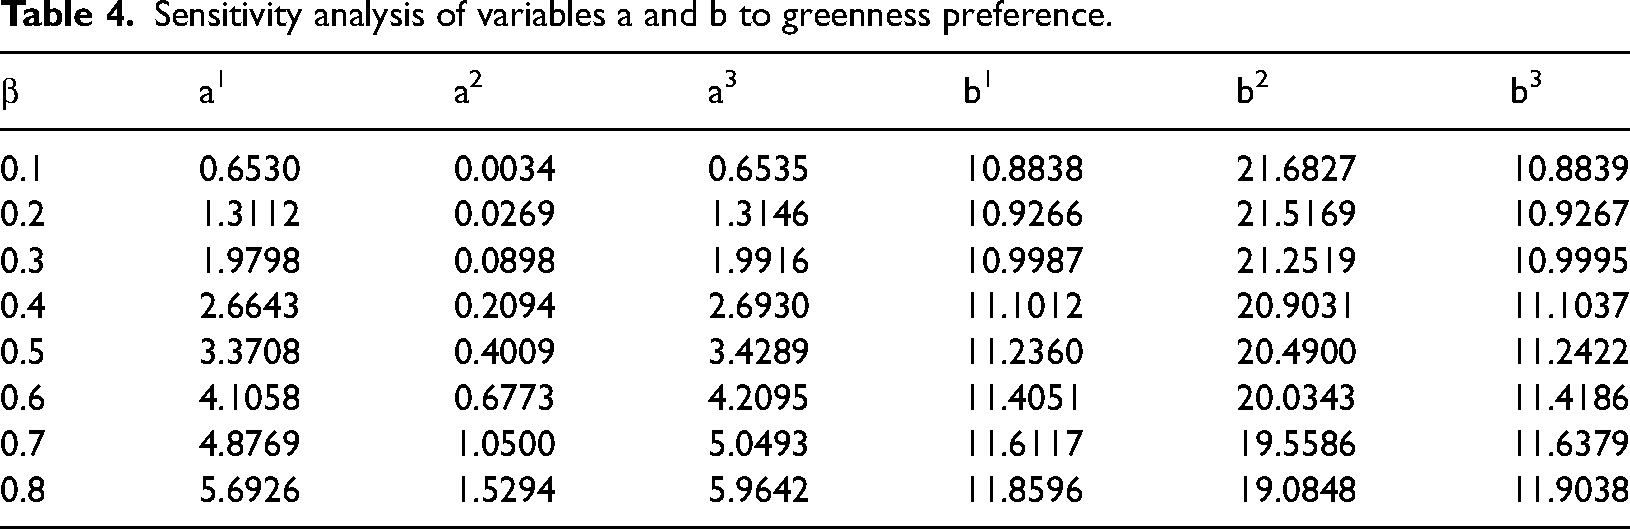
Sensitivity analysis of innovation levels and marketing effort levels to greenness preference. Table 4 reflects the changes in marketing effort levels and innovation levels with greenness preference when γ = 0.4 and 0.1 ≤ β ≤ 0.8. The variation of the data in the table shows that: (1) innovation levels increase with the increase in greenness preference under three models. Marketing effort levels improve with the increasing greenness preference under the decision model on CP and CS, while marketing effort levels decrease with the increasing greenness preference under the decision model on IL, thus validating Lemma 3. (2) Higher greenness preference shows that consumers tend to purchase products with higher greenness, and this will increase the market demand. The increased market demand stimulates contractors to input in GTI, and the increased innovation levels also incentivize developers to market and promote their products, which in turn leads to increased marketing effort levels.
Sensitivity analysis of variables a and b to greenness preference.
The impacts of innovation capability and marketing effort cost coefficient on variables
The impact of innovation capability on innovation levels, marketing effort levels and developers’ profits. Figure 2 reflects the changes in innovation levels, marketing effort levels and developers’ profits under different incentive models when 0 < c < 1 and k = 0.6. From the figure, we can conclude that: (1) innovation levels increase with an increase in innovation capability. The comparison of three models reveals that contractors have the highest innovation levels under the decision model on CS and the lowest innovation levels under the decision model on IL. This is because on the one hand developers occupy an absolutely dominant position in IL. There are more uncertainties of contractors in the GTI processes, resulting in lower willingness to innovate. On the other hand, the developers share part of innovation costs under the decision model on CS, thus contractors invest less costs for the same levels. Therefore, contractors are more motivated to innovate green technology, which leads to the highest innovation levels. (2) Under the decision model on CP and CS, innovation capability has greater influence on marketing effort levels than the marketing effort levels under the decision model on IL. This is because under the decision model on IL, the developers are fully informed of innovation levels and can make sensitive adjustments to marketing effort levels. (3) Under the decision model on CP and CS, developers’ profits increase as innovation capability increases, whereas under the decision model on IL, developers’ profits decrease as innovation capability increases. This is because under the decision model on CP and CS, as innovation capability increases, both innovation levels and marketing effort levels increase, market demand increases, and in turn profits increase. In contrast, under the decision model on IL, innovation levels change less and marketing effort levels tend to decrease, with lower market demand for GB products. In the meantime, the developers pay a fixed fee to the contractors, resulting in a decrease in developers’ profits.
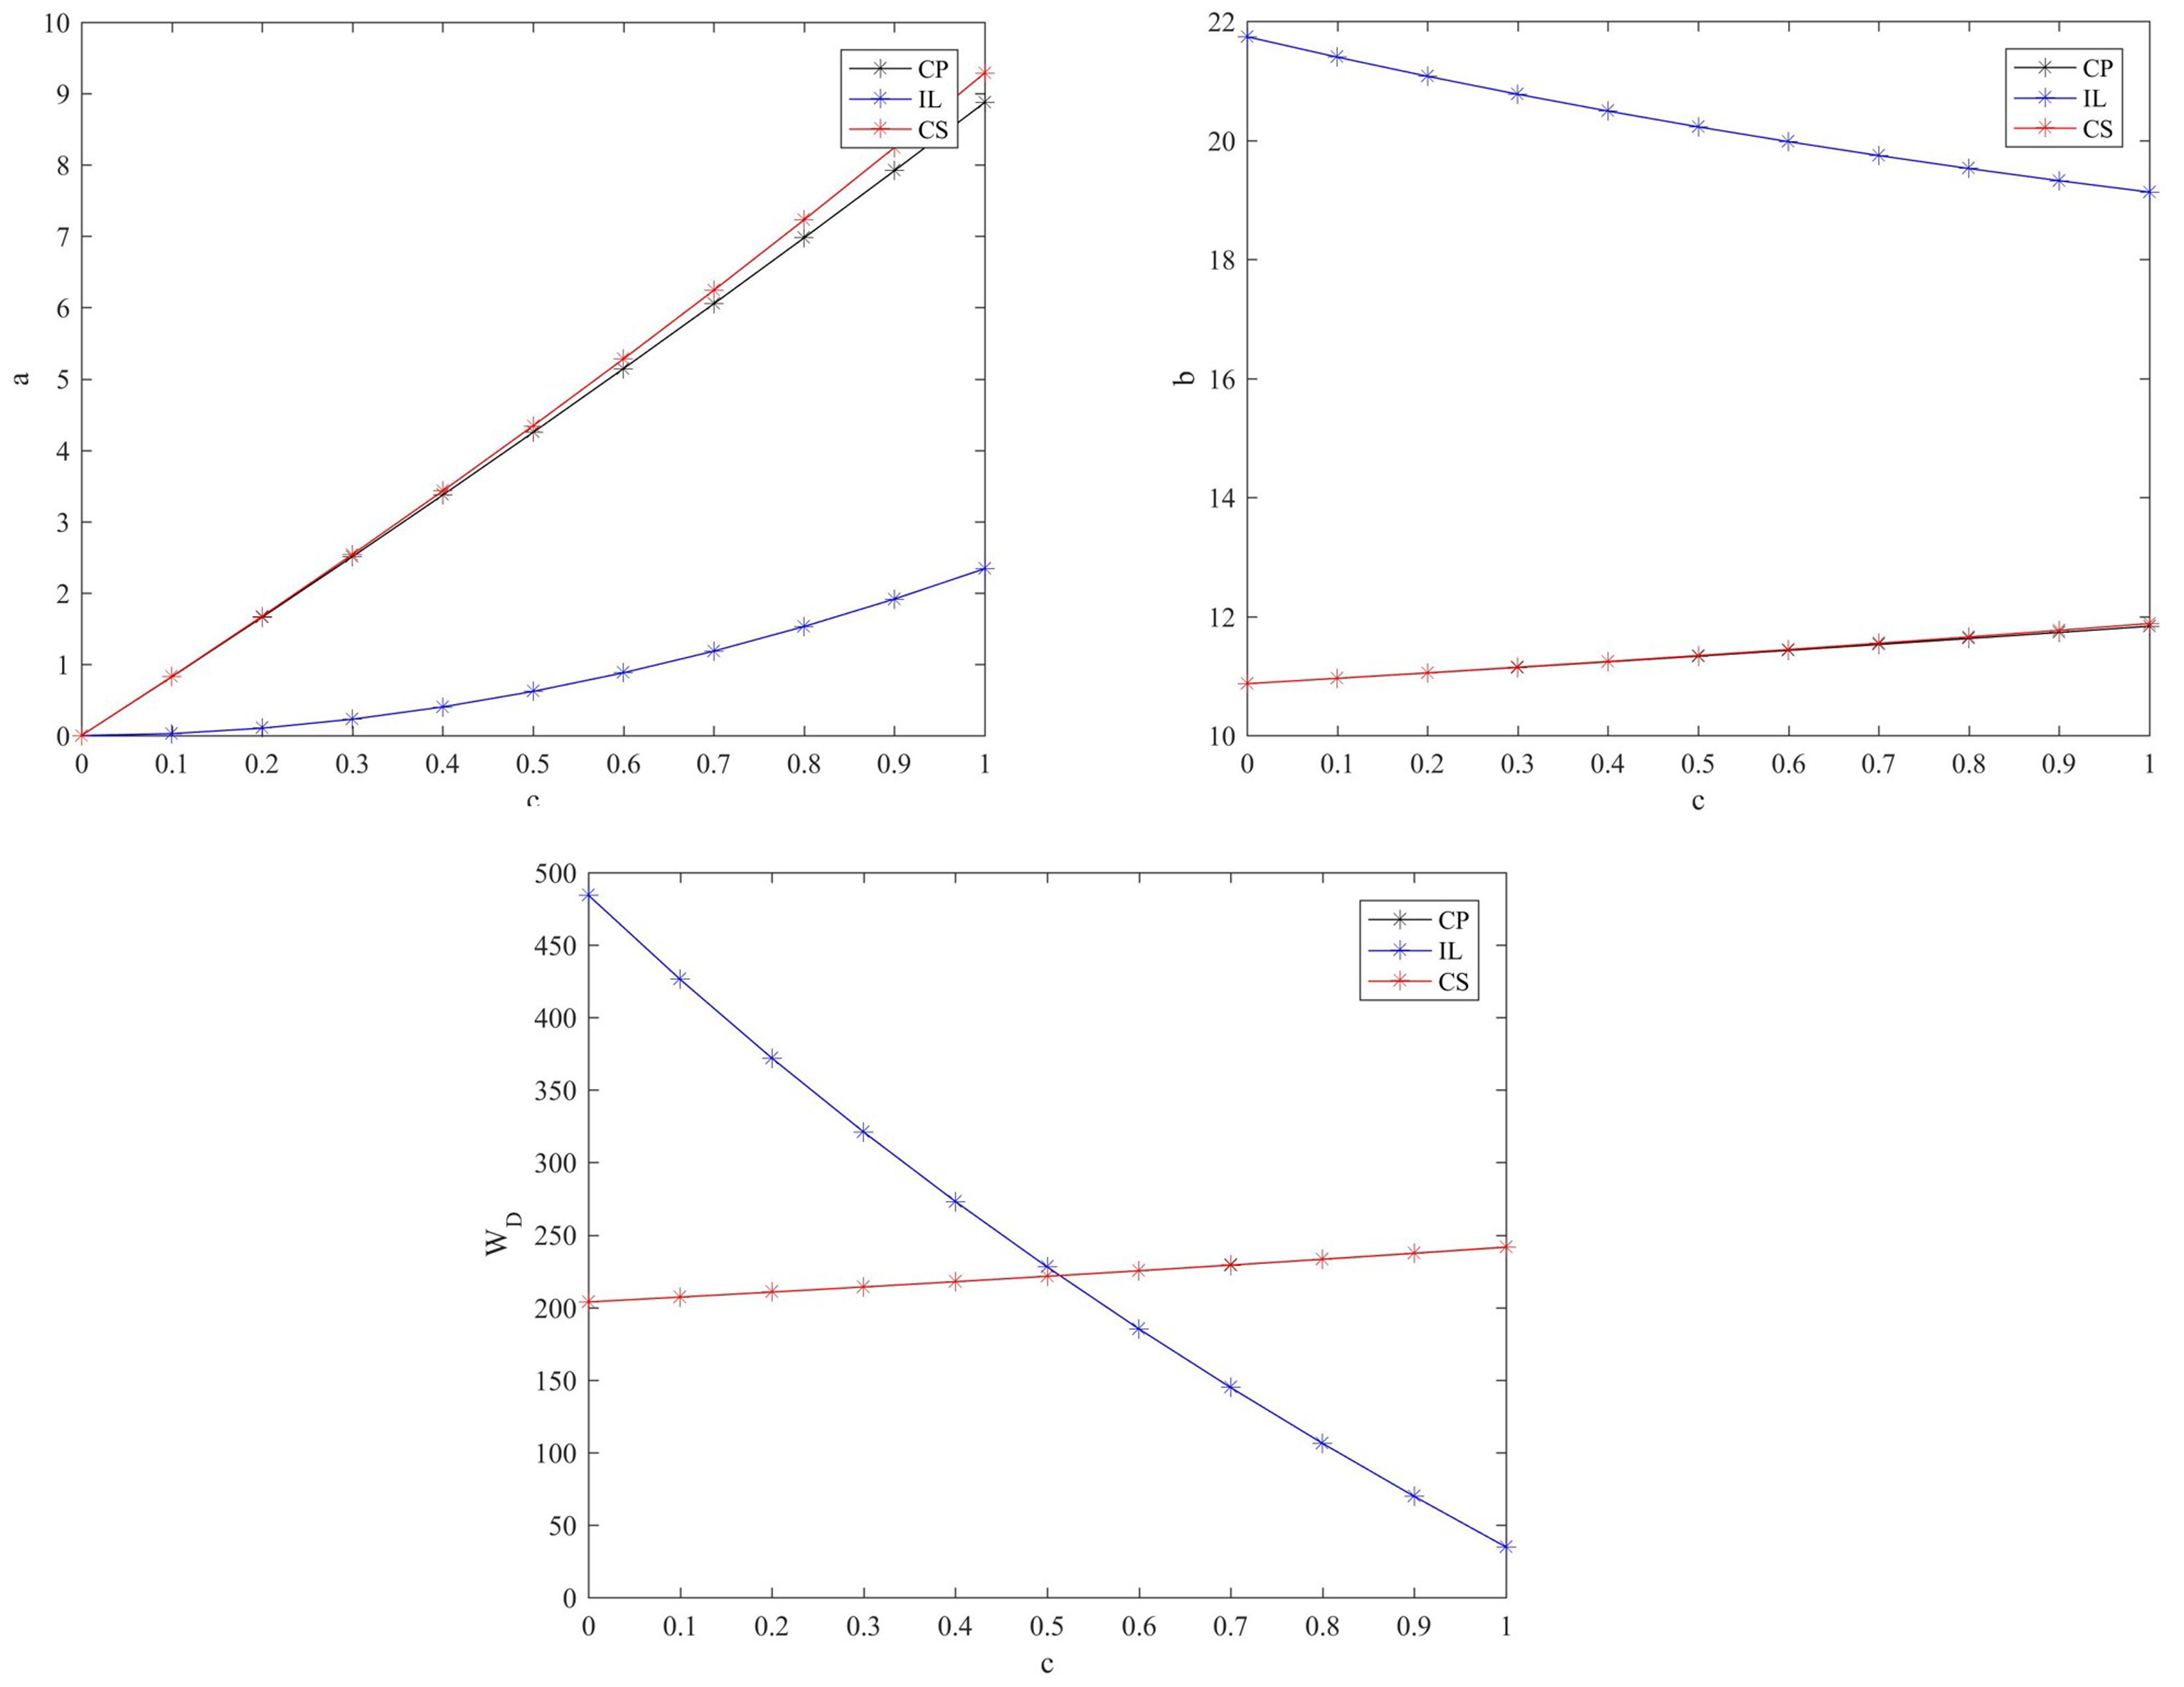
The impacts of innovation capability on innovation levels, marketing effort levels and developers’ profits.
The impacts of marketing effort cost coefficient on innovation levels, marketing effort levels and developers’ profits. Figure 3 reflects the changes in innovation levels, marketing effort levels and developers’ profits when 0 < k < 1 and c = 0.4. The figure shows that: (1) innovation levels decrease as marketing effort cost coefficient increases, and innovation level under the decision model on CS is the highest. But innovation levels show a downward trend under three models. This is because as marketing effort cost coefficient increases, the developers need to invest more for the same marketing effort levels, resulting in lower willingness. In addition, when contractors perceive developers’ lower willingness, they will invest less. (2) From the trend of the curve in Figure 3(c), we can see that as the marketing effort cost coefficient increases, the developers’ profits under the decision model on CP and CS tend to decrease. This is due to the increase in the marketing effort cost coefficient leads to a decrease in innovation levels and marketing effort levels, which in turn leads to a decrease in market demand and therefore a decrease in the developers’ profits. Under the decision model on IL, developers’ profits tend to increase. This is because the developers will pay significantly less in fixed fees to the contractors, resulting in a relative increase in the developers’ profits.

The impacts of marketing effort cost coefficient on innovation levels, marketing effort levels and developers’ profits.
The joint effects of innovation capability and marketing effort cost coefficient on innovation levels, marketing effort levels and developers’ profits. When π0 = 50, α = 0.9, β = 0.5 and γ = 0.4, Figures 4–6 reflect the impacts of k and c on innovation levels, marketing effort levels and developers’ profits under three models. In these figures, the red area indicates the decision model on CP, the green area indicates the IL and the blue area indicates the decision model on CS. Combining Figures 4–6, it can be concluded that: (1) marketing effort levels decrease when the marketing effort cost coefficient increases and increase with the innovation capability increases. However, there is an overall decreasing trend in marketing effort levels. As the marketing effort cost coefficient has a greater effect on the marketing effort levels than on innovation capability, then we can see that there is a decreasing trend in marketing effort levels. (2) Innovation levels decrease with marketing effort cost coefficient increases and increase with the innovation capability increase. However, innovation levels tend to increase. This is because the influence of innovation capability on innovation levels is greater than the influence of the marketing effort cost coefficient on innovation levels. Thus, incentivizing contractors to innovate in green technology relies on innovation capability, while the developers’ marketing efforts can further promote contractors’ innovation. (3) Developers’ profits increase when innovation capability increases and decrease with marketing effort cost coefficient increases. Under the decision model on CP, marketing effort cost coefficient and innovation capability have greater influence in developers’ profits. Since innovation capability and marketing efforts affect the market demand, developers should increase marketing effort levels and incentivize contractors to input more into GTI in order to maximize profits.
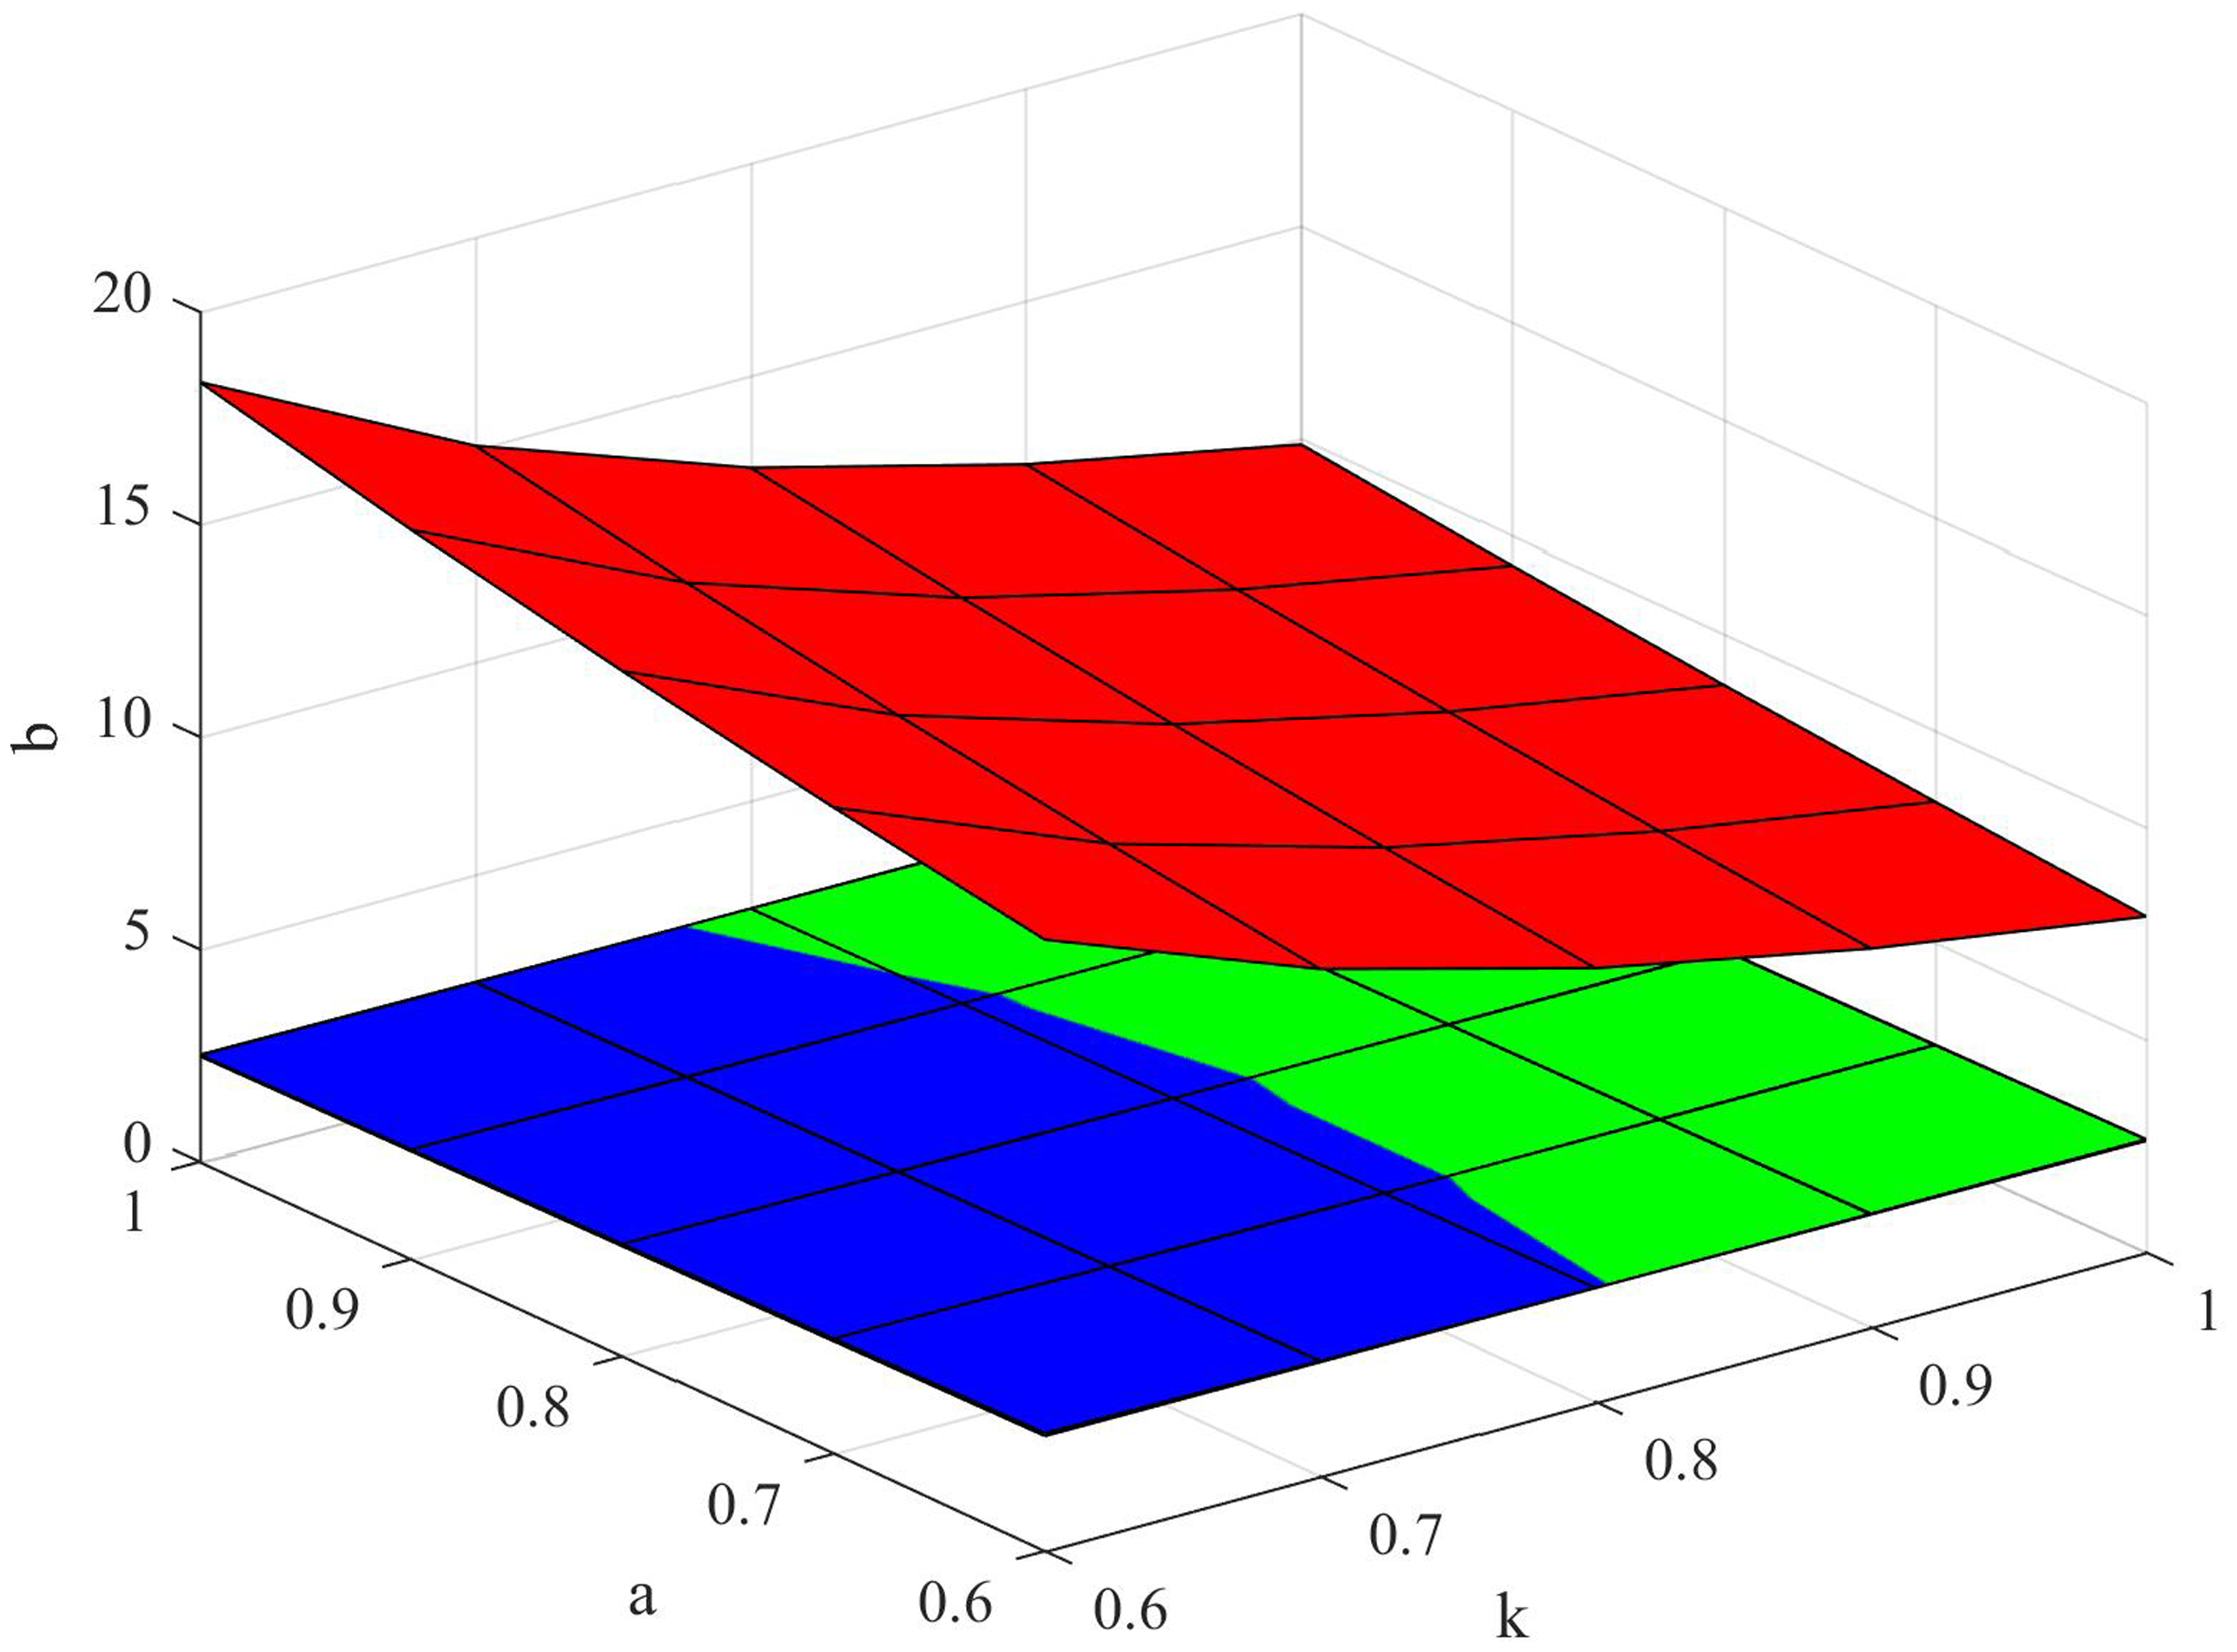
The joint effects of marketing effort cost coefficient and innovation capability on marketing effort levels.
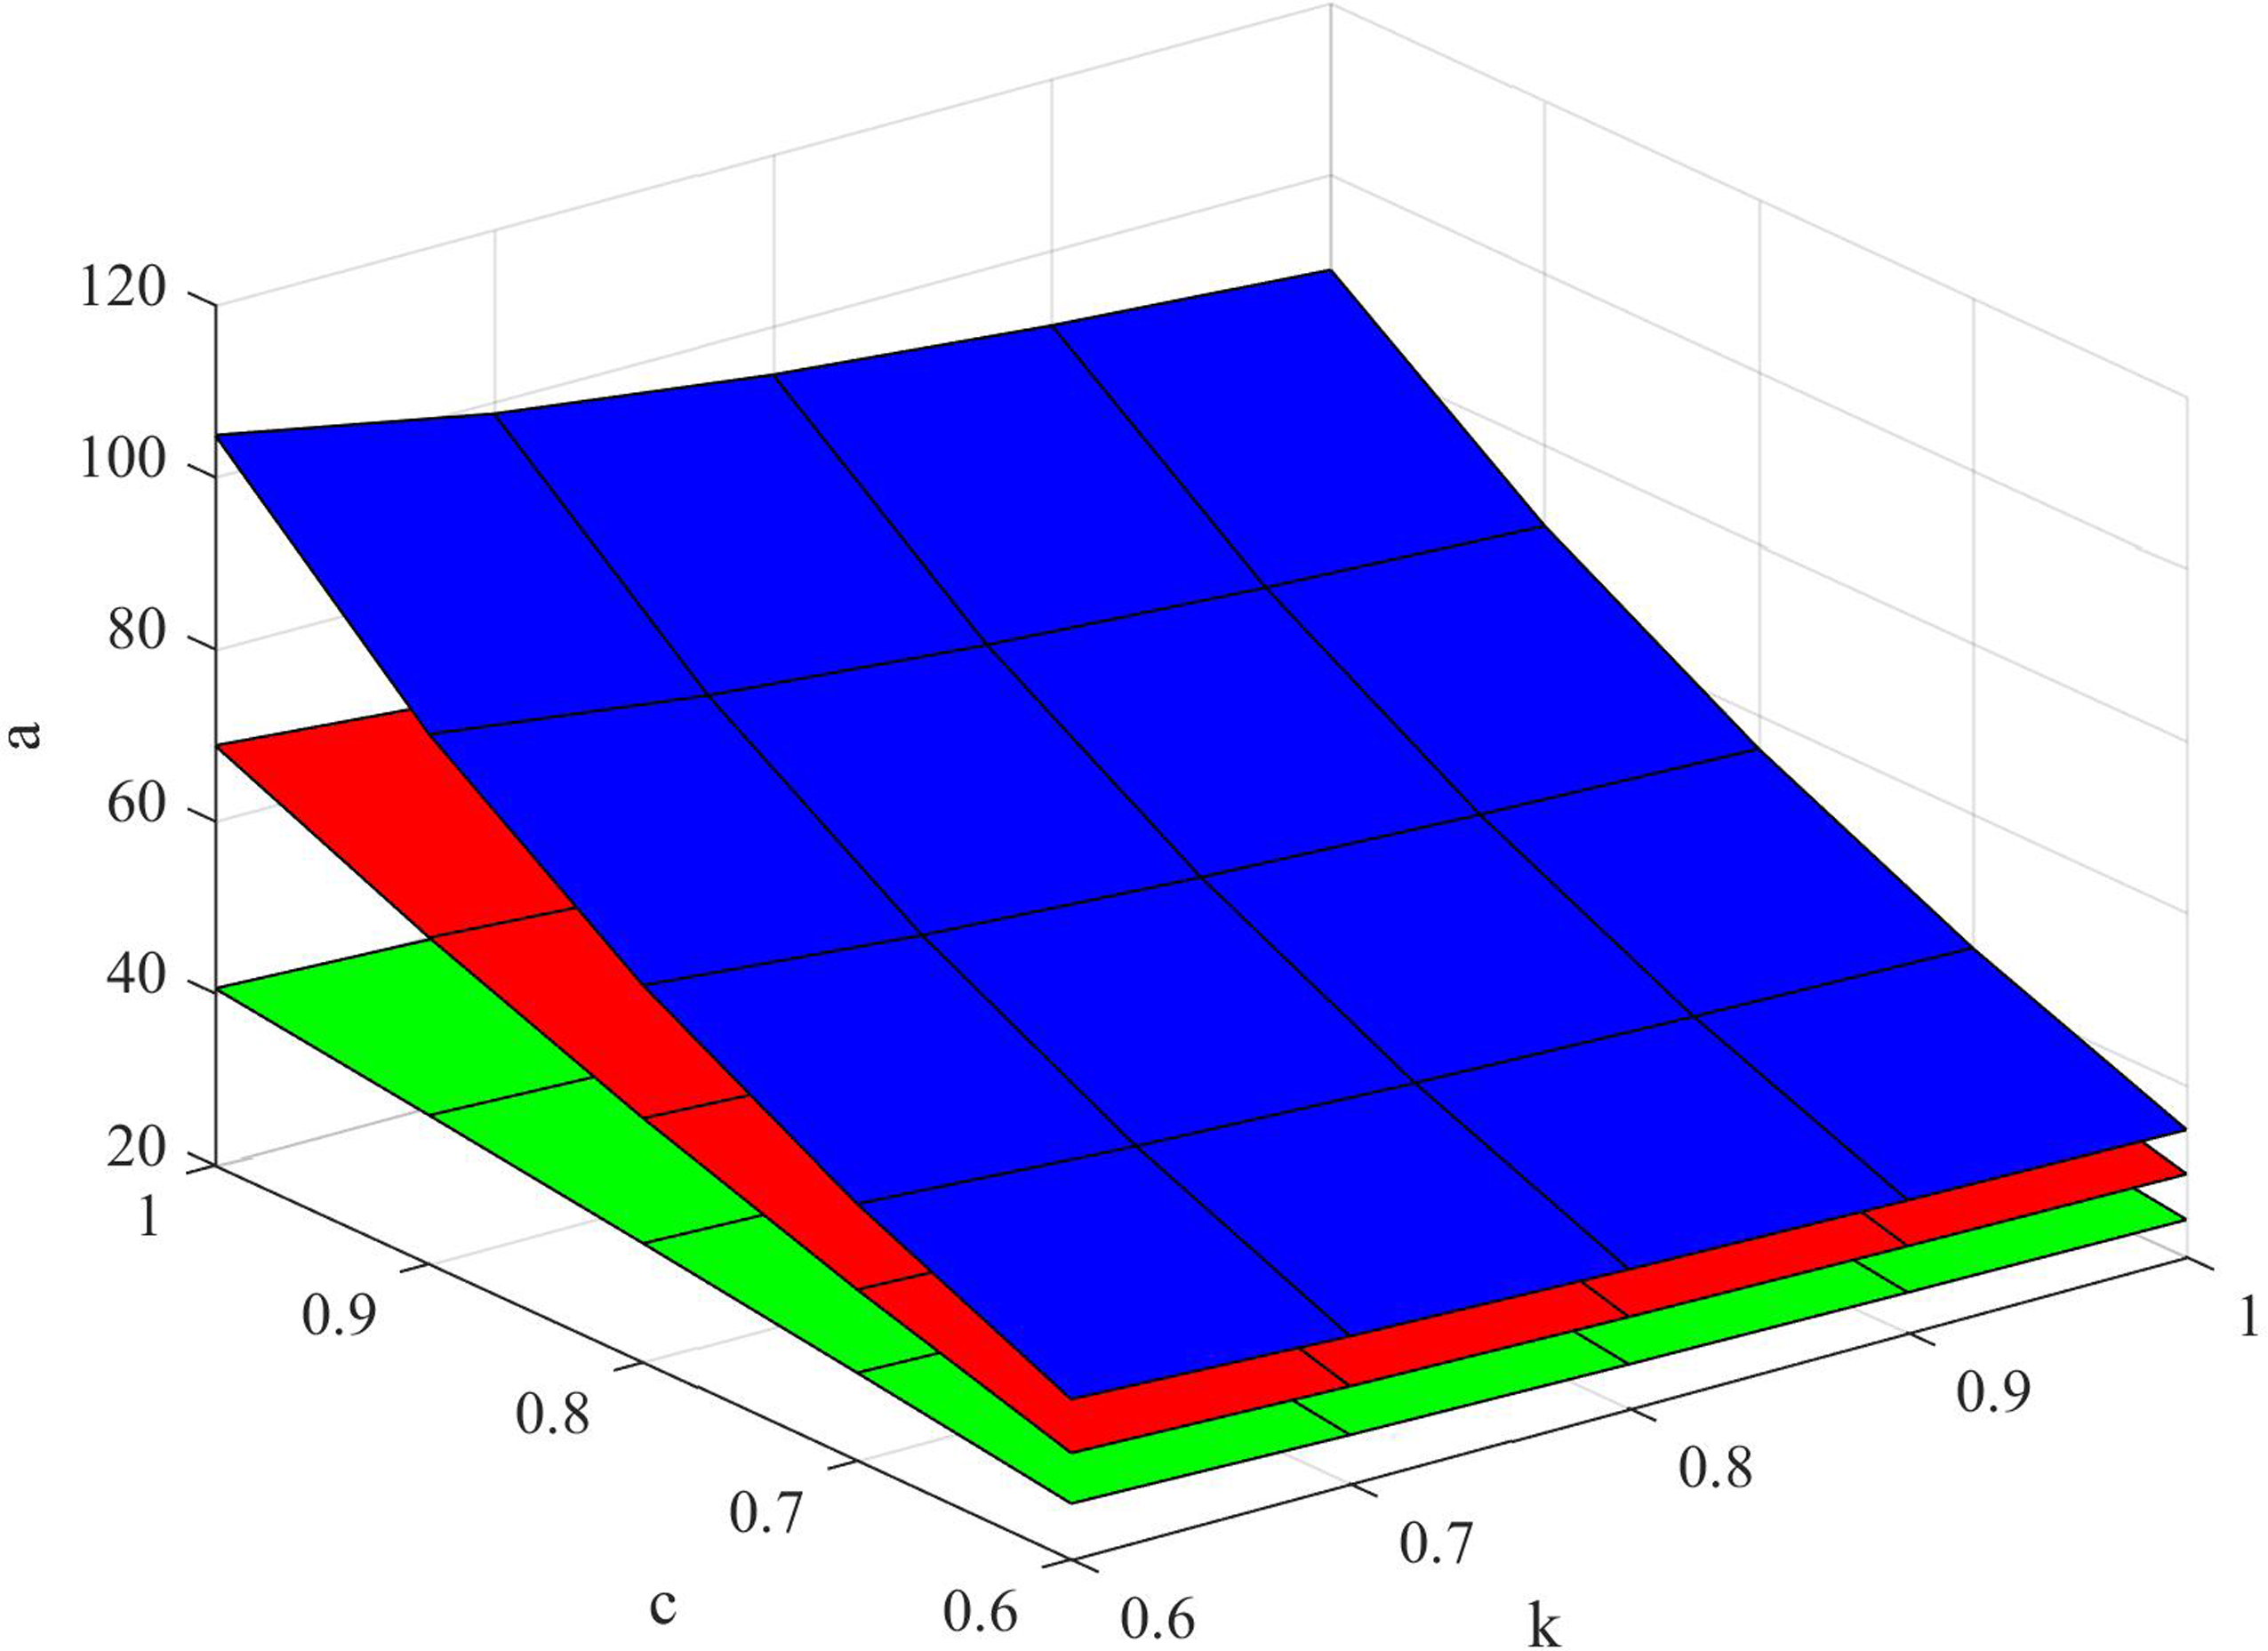
The joint effects of marketing effort cost coefficient and innovation capability on innovation levels.
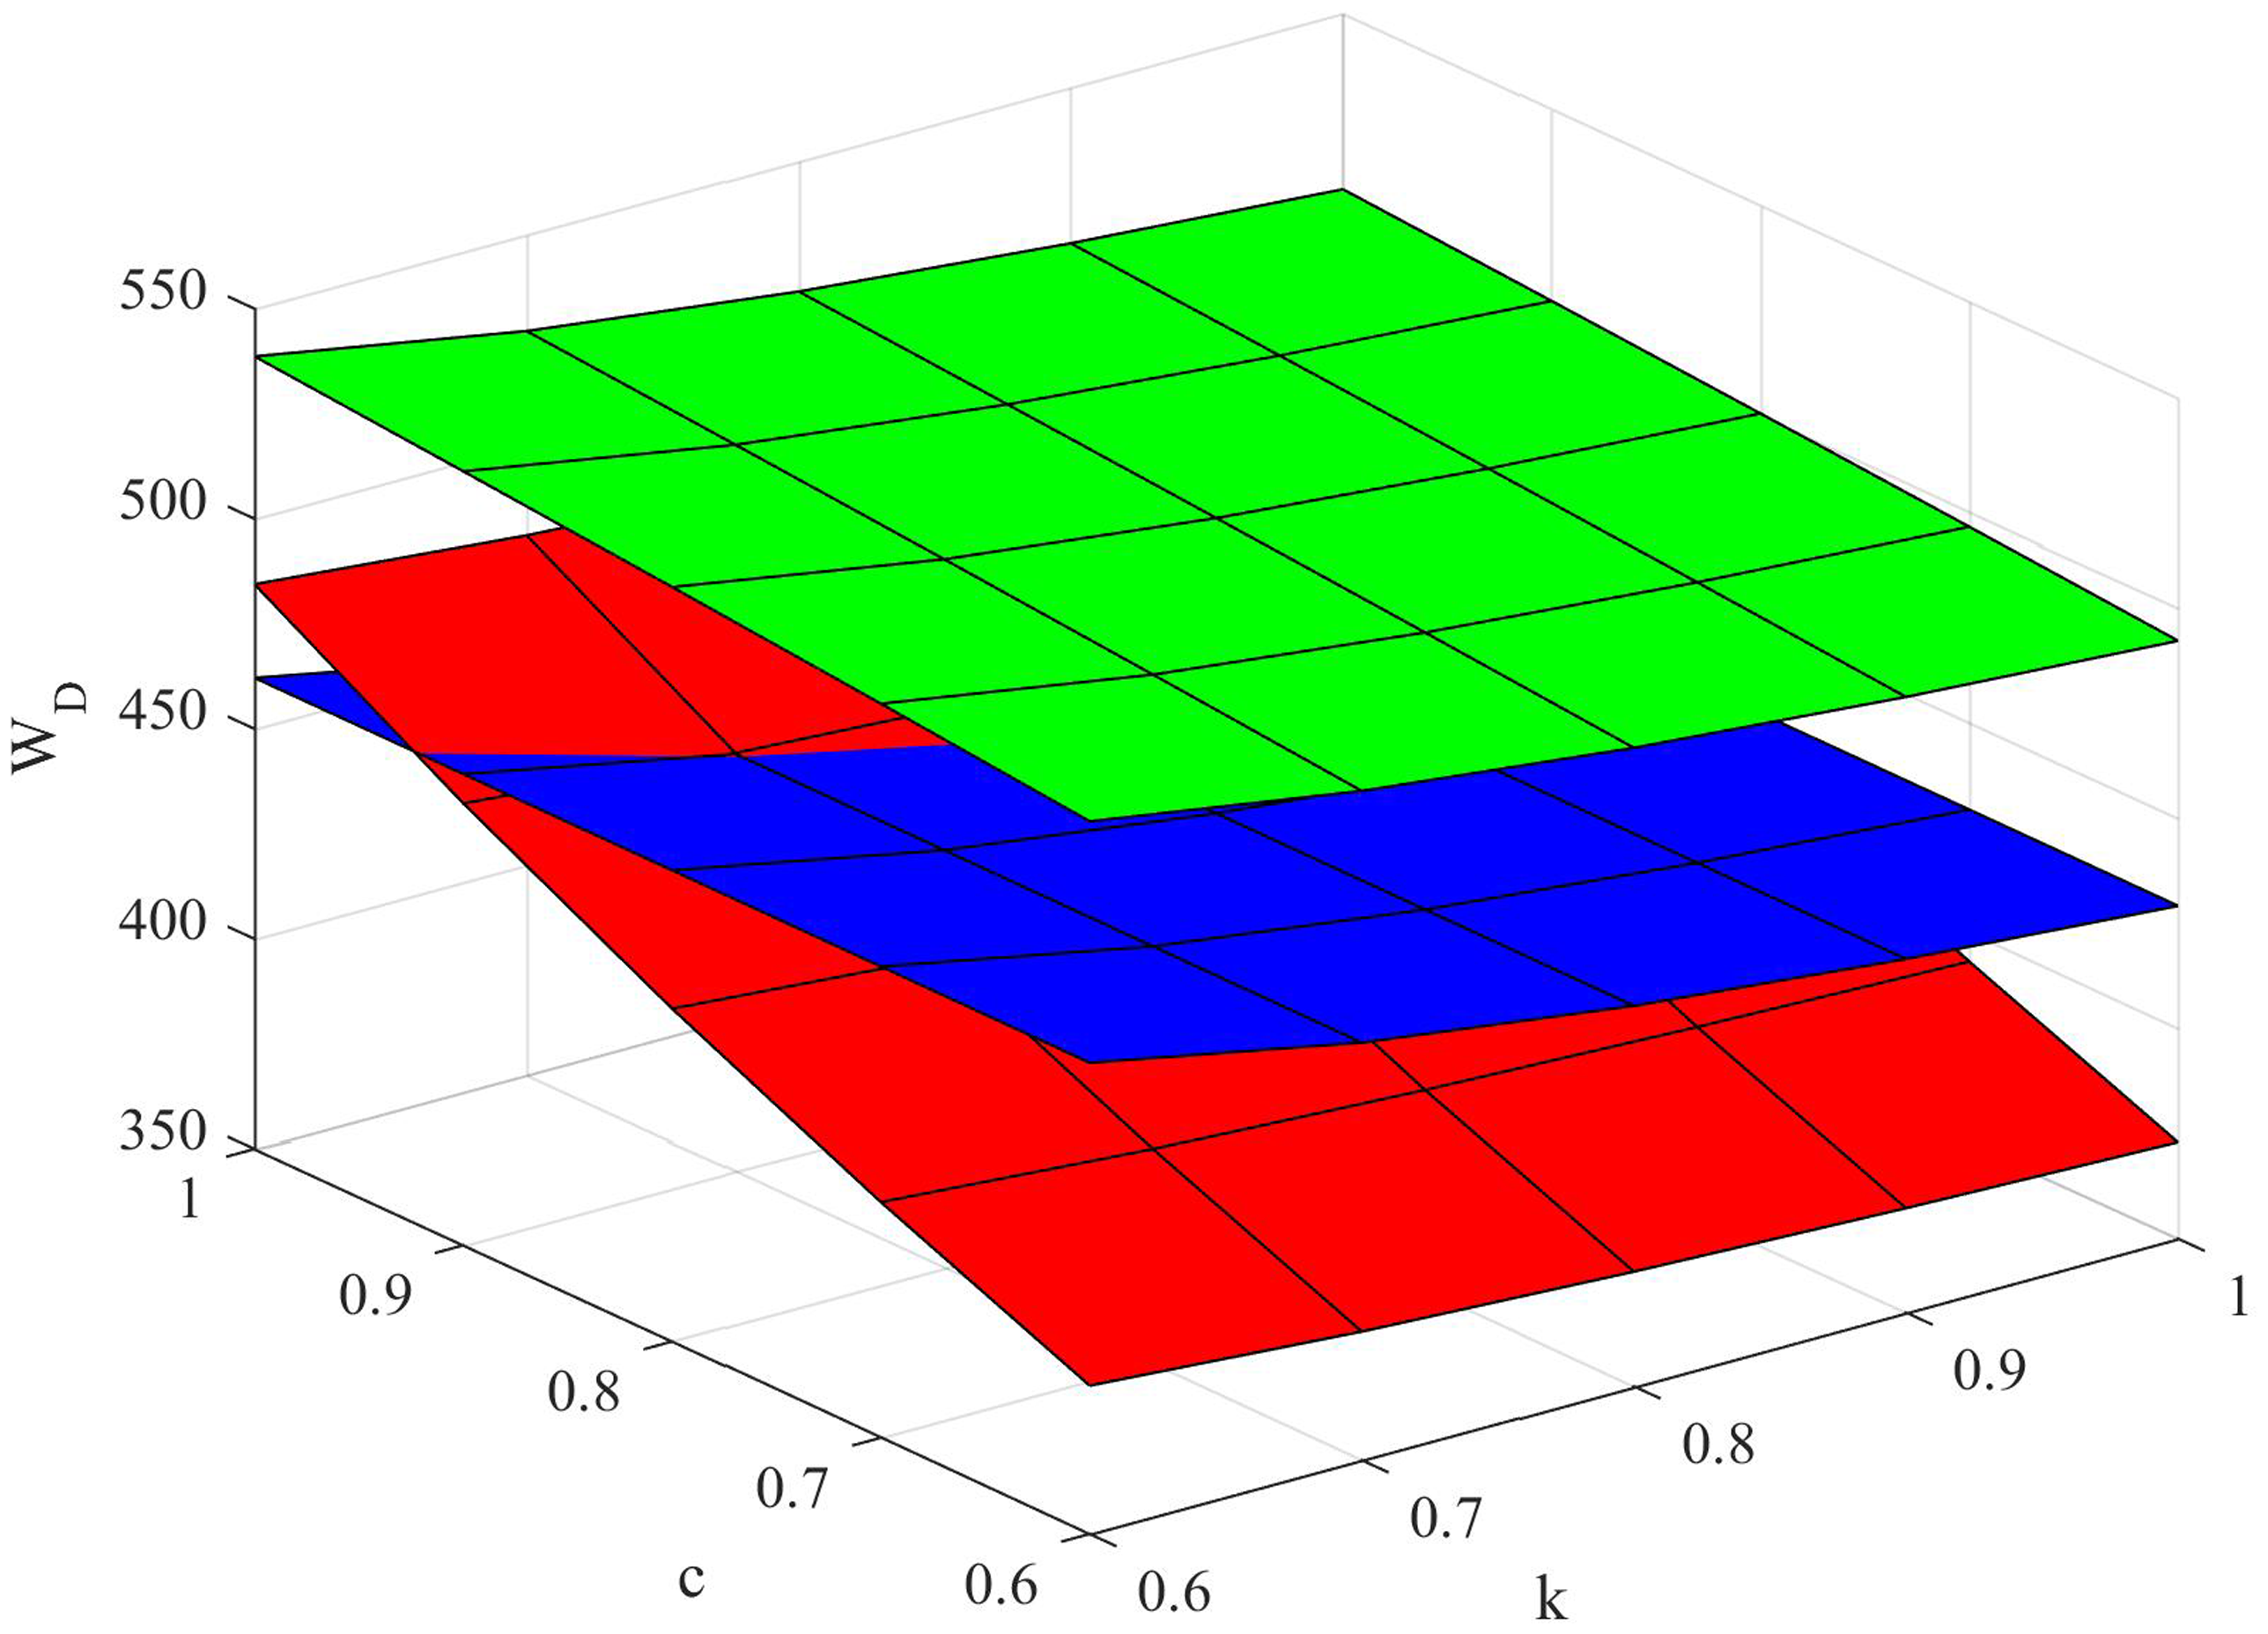
The joint effects of marketing effort cost coefficient and innovation capability on developers’ profits.
Conclusion and managerial implications
Main conclusion
Based on the existing research results, this paper utilizes game theory to explore the decision-making behaviors of developers in motivating contractors to carry out GTI activities under three incentive models and to compare and analyze the effects of greenness preference and service quality preference on decision-making. Through numerical simulation, the effect of parameter changes is described more intuitively. The research conclusions are as follows. (1) Under three models, contract prices, and sales prices are incremental functions with respect to innovation capability, greenness preference and service quality preference. (2) Under the decision model on IL, the developers’ profits are the highest, but the innovation levels and marketing effort levels are both the lowest at this time. (3) Under the decision model on CS, contractors have the highest innovation level and the innovation level increases with innovation capability and decreases with the increase in the marketing effort cost coefficient, but the innovation level tends to increase overall. In addition, as greenness preference and service quality preference increase, developers will share innovation costs. (4) Changes in service quality preference have smaller impacts on innovation levels and larger impacts on marketing effort levels, while changes in greenness preference have smaller impacts on marketing effort levels and larger impacts on innovation levels.
Managerial implications
To promote the low-carbon and green transformation of the construction industry, some managerial implications from the perspective of developers, contractors and consumers are put forward.
Various incentive contracts and consumer preferences should be given sufficient attention by developers. Goal conflict is an inevitable phenomenon in the decision-making process,
61
and incentive contracts can coordinate decision makers with different goals.
62
For example, Blockbuster video rental company first hired a revenue-sharing agreement, and achieved great success. However, decisions under different incentive contracts are different.
63
Therefore, developers should be aware of the different types of contracts, such as quantity discount,
64
end-of-season payment
41
and two-part pricing.
65
In addition, consumer preferences also influence decision-making behavior. In Australia, Vanclay et al.
66
studied the sales data of high-carbon and low-carbon products and found that the sales volume of low-carbon products was higher than that of high-carbon products. Similarly, according to the Top 10 Global Consumption Trends 2021 released by Euromonitor International, 58.8% of the respondents showed a willingness to choose green and low-carbon products. Therefore, paying attention to consumer preferences will help companies make decisions in line with market developments. Enhancing innovation capabilities is the core challenge faced by contractors. With the increasingly fierce competition, innovation capability has arisen as an essential prerequisite for a nation's attainment of sustainable development, and this situation is equally applicable within the corporate enterprises.
67
GTI can not only improve the efficiency of existing technologies
68
but also an important means to develop a low-carbon economy.
69
The potency of innovation capability plays a pivotal role in bolstering GTI.
70
In other words, the stronger the innovation capability, the higher the possibility of GTI. Hence, contractors ought to intricately interconnect the enhancement of innovation capability with enterprises’ green development through talent acquisition,
71
governmental policies
72
and digital prospects,
73
as these factors have been demonstrated to foster innovation capability. Furthermore, amid the rapid evolution of the new generation of information technology, an avenue for enhancing innovation capability lies in the integration of technologies such as big data and artificial intelligence into the innovation process. Consumer awareness of green consumption is stimulated to cultivate consumer green preferences. As the main body of the market, consumers’ have evolved into a significant determinant influencing enterprises’ decision-making.
48
It is found that consumer preference will wield an impact on GTI, and consumer demand for green products directly affects enterprises’ GTI efforts.
74
In addition, consumer green preferences have been proven to play an important role in driving changes in overall environmental preferences.
75
Meanwhile, in the context of advocating green consumption, governments can also play an important role. Some scholars suggest that subsidies should be given to consumers to increase market demand for green products so as to promote firm innovation.76,77 Aside from the prevailing viewpoints, we propose that the government should propagate the concept of green consumption through slogans, advertisements and other means.
Limitations and future research directions
There are several limitations in our works. Based on contract theory, this paper analyzes the changes of developers’ and contractors’ decision behaviors under different incentive models, and explores how the factors such as marketing effort cost coefficient and innovation capability to influence innovation levels, marketing effort levels and developers’ profits. However, the market demand function is linear. In practice, market demand is unpredictable and influenced by many factors. It is interesting to explore nonlinear demand function and various factors. Furthermore, in reality, there are more than just three contracts between developers and contractors, and the study of other contracts deserves further discussion.
Highlights
The research focus centers on decision-making behaviors related to innovation subjects within the context of GBs, involving developers incentivizing contractors to participate in green technological innovation.
This paper constructs the innovation decision-making models for developers to incentivize contractors to engage in green technological innovation under three different contract types.
By mathematically deriving formulas, a comparative analysis of relevant parameters among the three models is conducted.
Both marketing effort and innovation capability are incorporated into the model, and the joint effects of marketing efforts and innovation capability are discussed.
Footnotes
Declaration of conflicting interests
The author(s) declared no potential conflicts of interest with respect to the research, authorship, and/or publication of this article.
Funding
The author(s) disclosed receipt of the following financial support for the research, authorship, and/or publication of this article: This work was supported by the Youth Project of Natural Science Foundation of Anhui Province (2108085QG297), “Four New” Research and Reform Practice Project of Higher Education Quality Project in Anhui Province (2021sx005;2022sx002), “Six Excellence and One Top” Project of Higher Education Quality Project in Anhui Province(2022zybj001), Anhui University key project of scientific research and social Sciences(2022AH050542), and Graduate Research and Innovation Fund of Anhui University of Finance & Economics (ACYC2021423).
