



Abstract
An important part of environmental pollution has resulted in energy consumption, the level of environmental pollution varies across sectors, and energy R&D investments have been strategic tools in this respect. Considering this fact, the research studies the role of R&D investments in energy on CO2 emissions by focusing on the USA case as pioneering R&D investing country in energy technologies. In this context, the study makes a disaggregated level analysis and performs various nonlinear methods to data between 1975/Q1 and 2020/Q4. The nonlinear empirical results demonstrate that (i) R&D investments have a strong dependency on sectoral CO2 emissions across times and frequencies; (ii) at higher quantiles, R&D investments in nuclear energy have a generally declining impact on power and building sector CO2 emissions, whereas R&D investments in renewable energy stimulate sectoral CO2 emissions; (iii) R&D investments are causally effective on sectoral CO2 emissions across various quantiles; (iv) R&D investments in total curb generally sectoral CO2 emissions. The research demonstrates that R&D investments in energy on sectoral CO2 emissions have a varying heterogonous impact based on time, frequency, quantile, and R&D types. Thus, USA policymakers should include time, frequency, quantile, R&D types, and sector-based differentiating impacts to curb sectoral CO2 emissions in re-formulating energy environmental policy framework as a critical issue for ensuring sustainable development. Accordingly, various policies (e.g. relying on nuclear R&D investments, re-balance distribution of the R&D investments among the alternatives, consideration of sectoral differences) are discussed.
This is a visual representation of the abstract.
Introduction
The issues in economy area are always important for countries throughout history, whereas environmental concerns have been developing recently due to their adverse impacts on humankind including countries, societies, and people.1,2 In line with the increasing interest in the environment, international institutions have tried to develop roadmaps to show how countries can follow a sustainable development path. So, sustainable development goals (SDGs), which are a well-known lighthouse for countries to achieve sustainable growth without causing harmful impacts on the environment, are highly promoted.3,4 Consistent with SDGs 8, 7, and 13, countries can follow sustainable economic progress by benefitting from technological development, using clean energy for mitigation, and taking measures for climate action, in order.
Because environmental degradation has been increasing, an investigation into the causes of such negative progress has been developing. By considering the data of British Petroleum 5 and World Bank, 6 environmental degradation has resulted from greenhouse gas emissions, CO2 emissions have a higher share in it, and economic growth and higher energy consumption, especially fossil one, causes higher CO2 emissions.7,8 Hence, the research have studied the relationship of energy use with the environment. Earlier studies uncovered fossil fuel energy's impact on the environment. However, much newer studies have concentrated on clean (i.e. renewable and nuclear) energy impact on environmental degradation.
Also, various research has taken into account CO2 emissions as an environmental indicator (e.g. Ramzan et al. 9 ), whereas much newer researchers have worked with the LCF (e.g. Wang et al. 10 ). In addition to various factors that have either proxied the environment (e.g. CO2, LCF) or have an impact on the environment (e.g. economic growth, energy consumption), according to the literature, R&D investments can be a significant option to combat environmental degradation because they search for new ways to decrease the negative impacts of energy use on the environment focusing on technologies in renewable and nuclear energy. Some countries have been increasing R&D investments continuously. Especially, the USA has been allocation an important budget that makes the USA the leading R&D investing country in energy technologies. 11
Supplementary Figure S1 demonstrates the development of total and sectoral CO2 emissions in the USA. As presented, CO2 emissions have not been so much decreased that have a relatively horizontal trend over the years. Also, the power sector has caused the highest CO2 emissions followed by the transport and building sectors. By considering the environmental problems as well as the importance of technologies in the energy area, the USA has been allocating an important budget for R&D investments, which is presented in Supplementary Figure S2, to search for potential solutions. As shown, total energy R&D investments have been an important progress trend since the 2000s. Especially, they increased in 2009, which can be attributed to the 2008 global crisis and the increasing importance of energy savings. Also, nuclear energy R&D investments have had a high amount, although they have been decreasing over the years. Besides, renewable energy R&D investments have been increasing since the 2000s.
The studies have examined the impacts of R&D investments. Such studies have included various scopes (e.g. Japan, United Kingdom). Also, some studies have examined the USA case (e.g. Ahmed et al., 12 Çağlar and Uluğ 13 ). When such studies are examined in detail, it can be stated that R&D investments are mainly considered at the aggregated (i.e. total) level in exploring their impacts on the environment. Hence, the literature has a gap, which is that a much more detailed analysis at a disaggregated level is required for further investigation.
Considering that the USA has not been successful in increasing environmental quality over the years 14 as well as the leading position of the USA in R&D investments 11 and is one of the five top CO2 emitting countries, 5 examination of the USA is highly important for the environmental degradation in the world. Also, there is a literature gap in the examination of the USA case. Hence, the research investigates R&D investment impact on sectoral CO2 emissions in the USA through including data at disaggregated levels. Examination of the USA is significant since it is the pioneering country in R&D investments in energy technologies. So, the outcomes for the USA can be evaluated as a lighthouse for other high amount R&D investing countries as well as all other countries to consider R&D investments as a strategic weapon in sustaining environmental degradation.
While the LCF is a more comprehensive indicator for the environment, unfortunately, data on LCF ends before the data on CO2 emissions. So, the study uses CO2 emissions as the environmental proxy since it enables researchers to work with the most up-to-date data. Moreover, differentiating from the present studies, this research sectoral CO2 emissions to consider sectoral differences. Furthermore, the study includes renewable, nuclear, and total R&D investments to analyze disaggregated levels. In doing so, the research uses quarterly data from 1975/Q1 to 2020/Q4 and applies the time series methods (WC, QQ, and GQ as the main methods and QR for robustness). Hence, the study searches for the answers to how R&D investments have an impact on the environment through using data at disaggregated levels. Empirical outcomes demonstrate the time, frequency, sector, and quantile-varying impacts of R&D investments on sectoral CO2 emissions. So, the impacts are heterogeneous in curbing environmental degradation. So, the study investigates the USA case by using disaggregated level data for both R&D and sectoral CO2 emissions, which is the most important difference from the present studies. Also, the study applies nonlinear methods to investigate the time, frequency, sector, and quantile-varying R&D investment impacts on the environment from 1975/Q1 to 2020/Q4. Thus, the study provides outcomes, which help develop policy inferences for the USA as well as other countries to succeed in carbon-neutrality targets.
Part II presents a theoretical model and literature. Part III explains methods. Part IV presents the outcomes. Part V presents the conclusion.
Theoretical model and literature
Theoretical model
According to the literature as well as data from BP 5 and World Bank, 6 a big share of environmental degradation results from higher energy consumption. For this reason, using fewer energy sources, especially fossil sources, obtaining higher energy is highly critical. Countries have been searching for new ways to produce higher energy with lower source use 11 and R&D investments in energy are highly critical tools to be considered.
R&D investments comprise “work undertaken on a systematic basis to increase the stock of knowledge, including knowledge of man, culture, and society, and the use of this stock of knowledge to devise new applications”. 15 Specifically, R&D activities in energy are the same as general R&D investments, but they focus on “energy efficiency, CCS, renewable energy sources, nuclear energy, hydrogen and fuel cells, other power and storage technologies, other cross-cutting technologies, and research”. 15 Hence, Energy R&D investments try to make contributions to curbing environmental degradation by focusing on the energy area rather than any other area. That is why the biggest share of CO2 emissions results in from energy consumption. 5
Energy R&D investments are evaluated as a strategic tool to fight environmental degradation because they research new ways to limit the adverse impacts of energy consumption. In this context, R&D investments have focused on various areas, but a big share of R&D investments are allocated to renewable and nuclear energy technologies. With the further development in technology, 16 it can be expected that the generation and consumption of either renewable or nuclear energy will increase much more. In this way, countries can decrease the amount of fossil fuel sources that they use. 17 In turn, the environmental degradation from dirty energy can be curbed by stimulating clean energy use through benefitting from R&D investments.
Literature review
The probable causes of degradation in the environment have been investigated by scholars. In this context, various indicators for the environment, such as CO2 emissions,18–24 ecological footprint25–27, and LCF,28,29 have been used in the studies. These indicators enable researchers to examine different sides of environmental changes. Scholars have used some of these indicators depending on research aims as well as data availability. The study prefers to use CO2 emissions because an empirical investigation is preferred by using the most recent available data and data for other environment indicators ends much old dates, whereas data for CO2 emissions is available until much recent dates. 5
Also, the literature is quite rich from an explanatory variable perspective. Scholars have included a variety of explanatory variables (e.g. income, human capital, urbanization) in investigating the causes of environmental degradation. It can be stated that such explanatory variables have been intensively used in the literature. On the other hand, in most recent studies, scholars have recently considered the impacts of technologies in energy (i.e. R&D investments) in examining environmental degradation.
There are different studies, which have uncovered R&D investment impacts on the environment. These studies have included various countries for empirical examination. For example, Ahmed et al. 12 examine Japan; Bicil et al. 30 for IEA countries; Voumik et al. 31 handle 34 countries in Europe; and Çağlar 32 analyze the United Kingdom. In the USA, the literature has some research, such as Ahmed et al., 33 Çağlar and Uluğ, 13 Koçak and Alnour. 3 According to these studies, R&D investments are mainly considered at an aggregated level in exploring their impacts on the environment. Even, this is valid for the USA case, of which Ahmed et al., 33 and Çağlar and Uluğ 13 have worked on searching the impacts of R&D investments and environmental degradation (i.e. CO2 emissions) by using aggregated level data for R&D investments rather than considering disaggregated level data.
Literature evaluation
Some studies have concluded that renewable energy R&D investments do not have an impact on the environment,12,34 but, other studies have defined that renewable energy 35 and nuclear energy 33 R&D investments help curb environmental degradation.
R&D investments can be generally thought to have a decreasing impact on degradation of the environment. An important question is how R&D investment can achieve such a benefit to the environment. The possible answer is to find new efficient ways of using energy through stimulating energy efficiency or decreasing the amount of energy sources used. However, as the literature implies, this is not the case for all R&D investing countries. While some of the countries can benefit from the R&D investments, some others cannot. So, examination of R&D investments in depth on a country basis by using disaggregated level data is needed. Among the countries, the USA is the pioneering country, which highly invests in R&D investments of energy technologies. 11 By considering this fact, handling the USA is highly meaningful to make an empirical investigation.
Overall, there is a literature gap for aggregated level data use rather than disaggregated data. Also, the USA is the leading R&D investing country and is among top CO2 emitters in the world. Hence, by considering such issues, the research comprehensively analyzes R&D investment impacts on CO2 emissions by using disaggregated level data. In doing so, the study considers R&D investments in renewable and nuclear energy on sectoral CO2 emissions. Also, through applying WC, QQ, GQ, and QR methods, this study proves the times, frequencies, sectors, and quantiles-based varying impacts of R&D investments on CO2 emissions, which increases the novelty of the study. Finally, benefitting from the outcomes of such a comprehensive theoretical and empirical methodology, this study presents insights for the USA policymakers. Furthermore, these insights can be considered by other countries as well.
Methods
Data
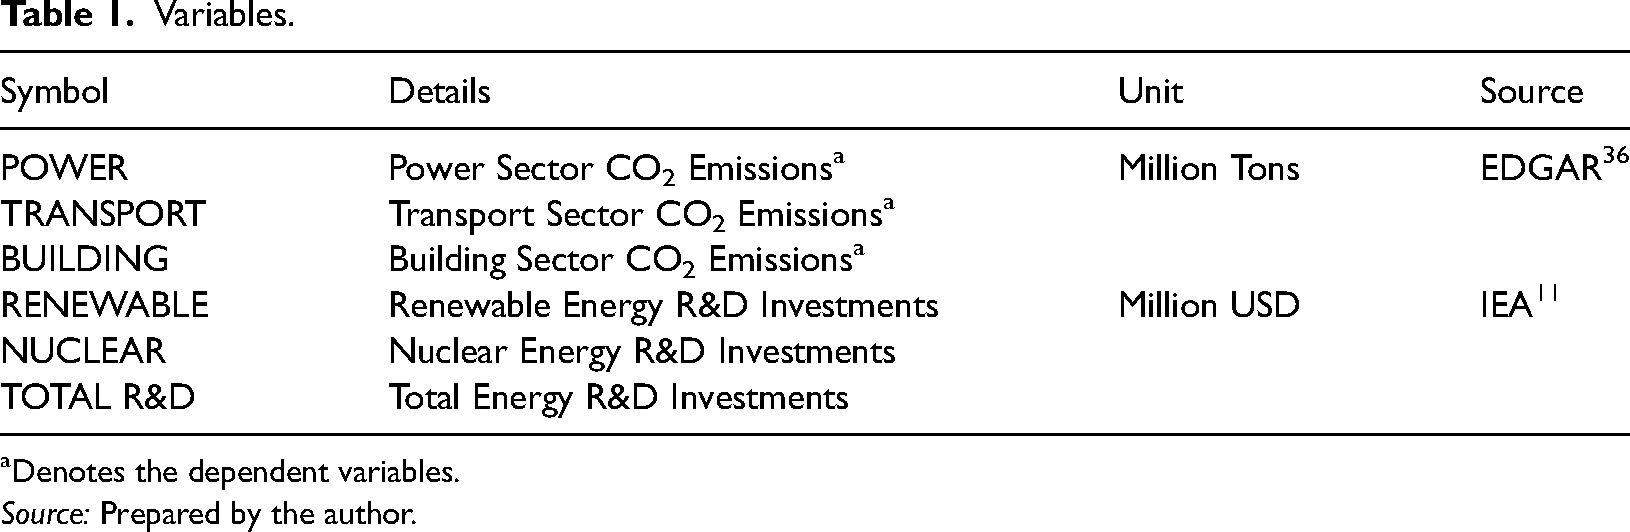
The study collects data from two main sources: (i) data for sectoral CO2 emissions are obtained from EDGAR 36 ; (ii) data for R&D investments are sourced from IEA. 11 Because the data are at annual frequency, the study converts data into quarterly data in consistent with the recent literature (e.g. Ayhan et al., 37 Ulussever et al. 38 ). Hence, the research uses data among 1975/Q1 and 2020/Q4.
Table 1 presents the main explanations for the variables.
Variables.
Denotes the dependent variables.
Source: Prepared by the author.
Empirical approach
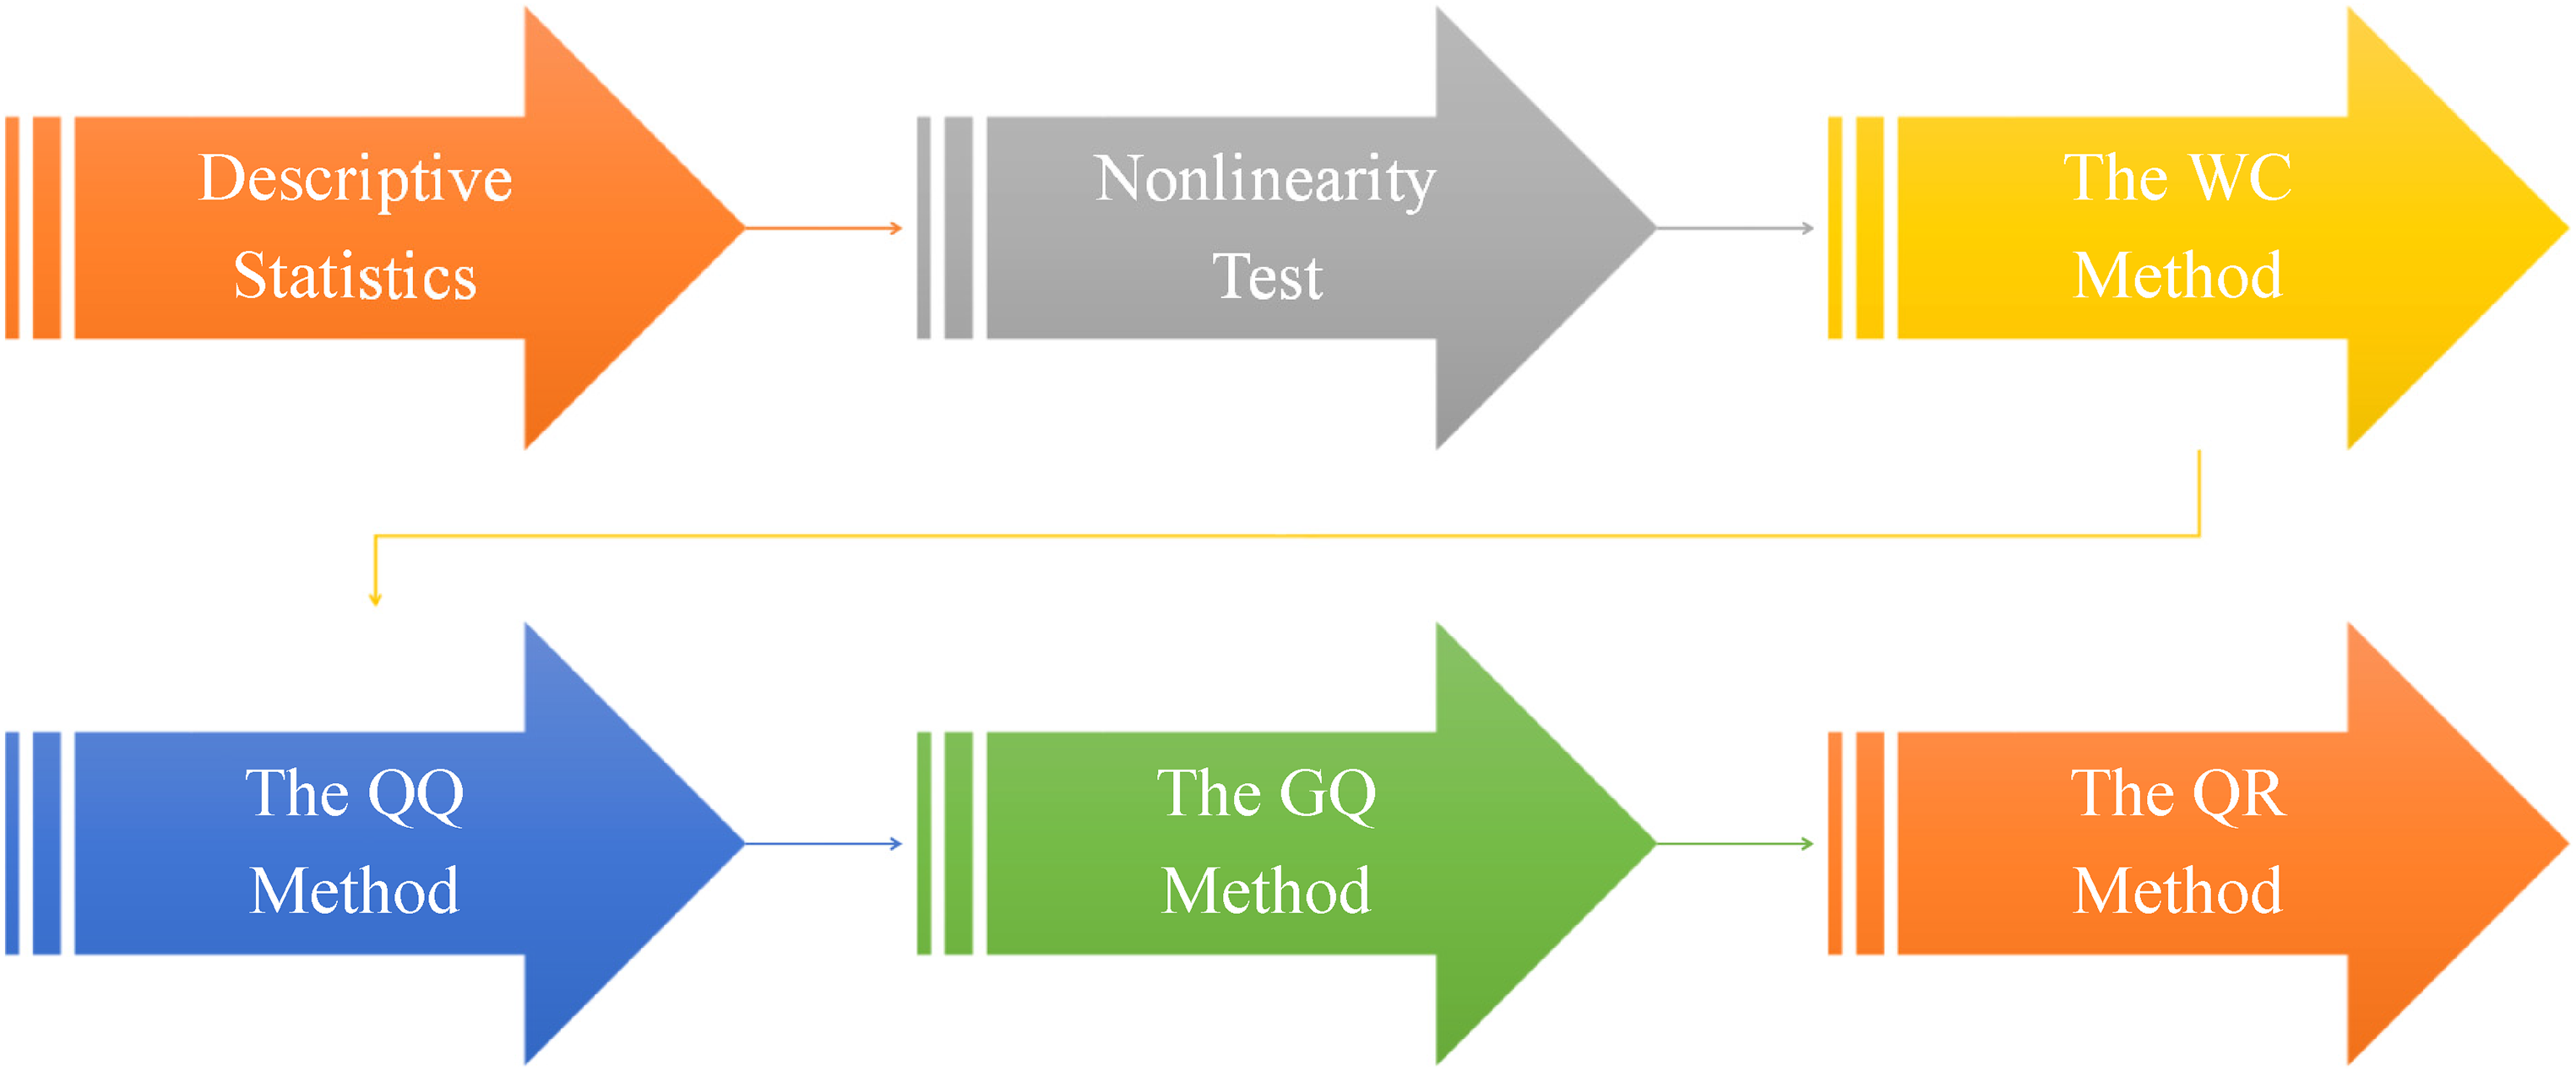
The research is constructed of a six-step methodology, which is detailed in Figure 1.
The flowchart of empirical methodology.
The empirical methodology begins with calculating fundamental statistics. So, main statistics for the variables are given. In addition, statistics (skewness, kurtosis, and Jarque-Bera statistics) showing the distributional characteristics of a variable are also given. In the second step, the assumption of nonlinearity is controlled by the BDS linearity test 39 to determine the relationship characteristic. In the third step, the WC method is used to represent the co-movement or relationship between variables over time and frequency ranges. 40 Followingly, the QQ analysis 41 measures R&D investment impacts on CO2 emissions at different quantiles. In the fifth step, the GQ method investigates the causality relationship between variables on a quantile basis. 42 Lastly, the QR method 43 is applied for the checking of the method consistency.
Overall, the study applies nonlinear methods (i.e. WC, QQ, GQ, and QR) that are selected based on data characteristics to make a time, frequency, and quantile-based empirical analysis. Further theoretical details about the methods may be acquired from the main sources.
In the empirical investigation, the study follows the equation (1):









Results
Descriptive statistics
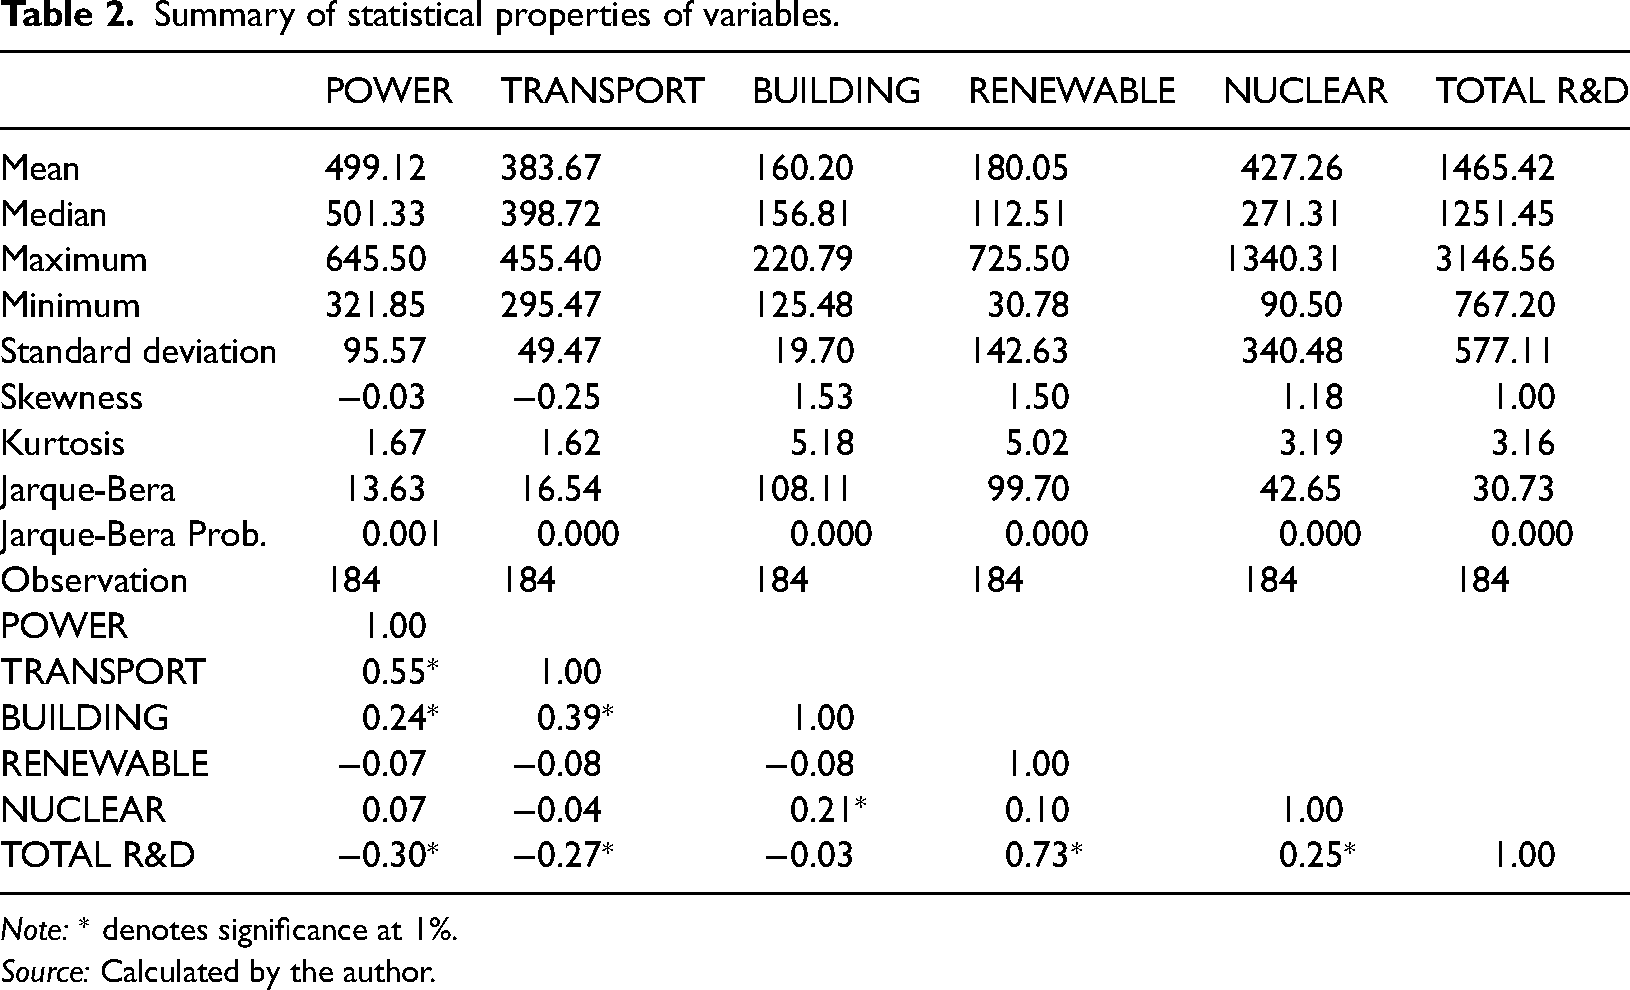
Table 2 indicates the fundamental statistics.
Summary of statistical properties of variables.
Note: * denotes significance at 1%.
Source: Calculated by the author.
According to Table 2, the coefficient of variation, which is also known as relative standard deviation, statistics of POWER, TRANSPORT, and BUILDING is relatively lower than RENEWABLE, NUCLEAR, and TOTAL R&D. This result shows that the relative dispersion of data points in RENEWABLE, NUCLEAR, and TOTAL R&D around the mean value is higher than the dispersion of POWER, TRANSPORT, and BUILDING. In addition, BUILDING, RENEWABLE, NUCLEAR, and TOTAL R&D have a right-skewed distribution. Based on the kurtosis statistics, it is clear that BUILDING and RENEWABLE have a leptokurtic distribution but POWER and TRANSPORT have a platykurtic distribution. Furthermore, the normality assumption, which is needed for many statistical analyses, is not met for the all variables.
The direction and strength of relationships between the two variables are analyzed with the correlation matrix as shown in Table 2. Table 2 provides evidence that the correlation between POWER versus TRANSPORT, BUILDING versus TRANSPORT, and TOTAL R&D versus RENEWABLE are strongly positive. The relationship between POWER versus TOTAL R&D, RENEWABLE versus TRANSPORT, RENEWABLE versus BUILDING, and TRANSPORT versus TOTAL R&D are negative.
Linearity test
The BDS test is offered to determine the nonlinear dependence and Table 3 presents the outcomes.
Linearity results.

Note: Values indicate the p-values.
Source: Calculated by the authors.
The BDS test expresses that nonlinear relationship between variables should be used for obtaining robust results. Thus, the WC, QQ, and GQ methods are conducted to method the nonlinear relationship.
WC result
Once the aim is to estimate the co-movement between variables over time and frequency bands, the WC method can be displayed as heatmaps. In the all WC plots, “the black cone represents the influence area, and the areas in red show a higher degree of correlation between the two variables. The left and right axes indicate the short/long term and low/high frequency in WC plots, respectively. In addition, 0–8, 8–16, 16–32, and 32–64 scales show short-term, medium-term, long-term, and very long-term, in order. Besides, 0.0–0.4, 0.4–0.6, and 0.6–1.0 show low-frequency, medium-frequency, and high-frequency, in order. In all WC plots, the first variable is sectoral CO2, while the second one is the relative energy R&D investment indicator.” In line with these information, the WC outcomes are displayed in Figure 2.

The WC results. (a) RENEWABLE on POWER. (b) R& RENEWABLE on TRANSPORT. (c) RENEWABLE on BUILDING. (d) NUCLEAR on POWER. (e) NUCLEAR on TRANSPORT. (f) NUCLEAR on BUILDING. (g) TOTAL R&D on POWER. (h) TOTAL R&D on TRANSPORT. (i) TOTAL R&D on BUILDING.
RENEWABLE has a positive correlation with POWER, and RENEWABLE causes POWER until the first quarter of 1990 for each frequency. However, this relationship turns negative in the long term between 1990/Q1 and 2007/Q4. Also, during this period, POWER causes RENEWABLE. Finally, after 2008, a positive relationship occurs between RENEWABLE and POWER and RENEWABLE causes POWER. When the relationship between RENEWABLE versus TRANSPORT and BUILDING is examined, there is a negative correlation between RENEWABLE versus TRANSPORT and BUILDING in the short term. In the medium term, RENEWABLE has a negative relationship with TRANSPORT and RENEWABLE causes TRANSPORT after 2000/Q1. RENEWABLE has also a negative relationship with BUILDING in the medium term after 1990/Q1, but it turns positive but causality does not change in the long term, RENEWABLE causes BUILDING.
The correlation between NUCLEAR and POWER is negative until 1995/Q1, and it turns positive after 1995/Q1 in the short term. However, the correlation between NUCLEAR and TRANSPORT is negative while the correlation between NUCLEAR and BUILDING is positive in the short term, and NUCLEAR causes POWER in the short term after 2005/Q1. In addition, after 2005/Q1, it can be said that POWER and BUILDING cause NUCLEAR in the medium term. However, TRANSPORT causes NUCLEAR in the very long term in all periods.
There is a negative correlation between POWER and TOTAL R&D in the short term, and generally, TOTAL R&D causes POWER before 2005/Q1. However, in the medium and long term after 1990/Q1, POWER causes TOTAL R&D. Similar to the relationship between POWER and TOTAL R&D, the relationship between TRANSPORT and TOTAL R&D is negative in the short term in all periods. However, there are two areas where the relationship between two variables is statistically significant. The time and frequency of these areas are from 1980/Q1 to 1995/Q4 in the long term, and from 1995/Q1 to 2015/Q4 in the medium term, respectively. In both areas TRANSPORT causes TOTAL R&D. In addition, there is a negative correlation between TOTAL R&D and BUILDING in the short term until 1995/Q4 while this impact turns positive after 2005/Q1. There are two major areas where the causality from BUILDING to TOTAL R&D is statistically significant. The first area is in the short and medium term before 1995/Q4, and the correlation between these two variables is negative. However, the correlation between the two variables turns positive after 2000/Q1 in the long term.
QQ results
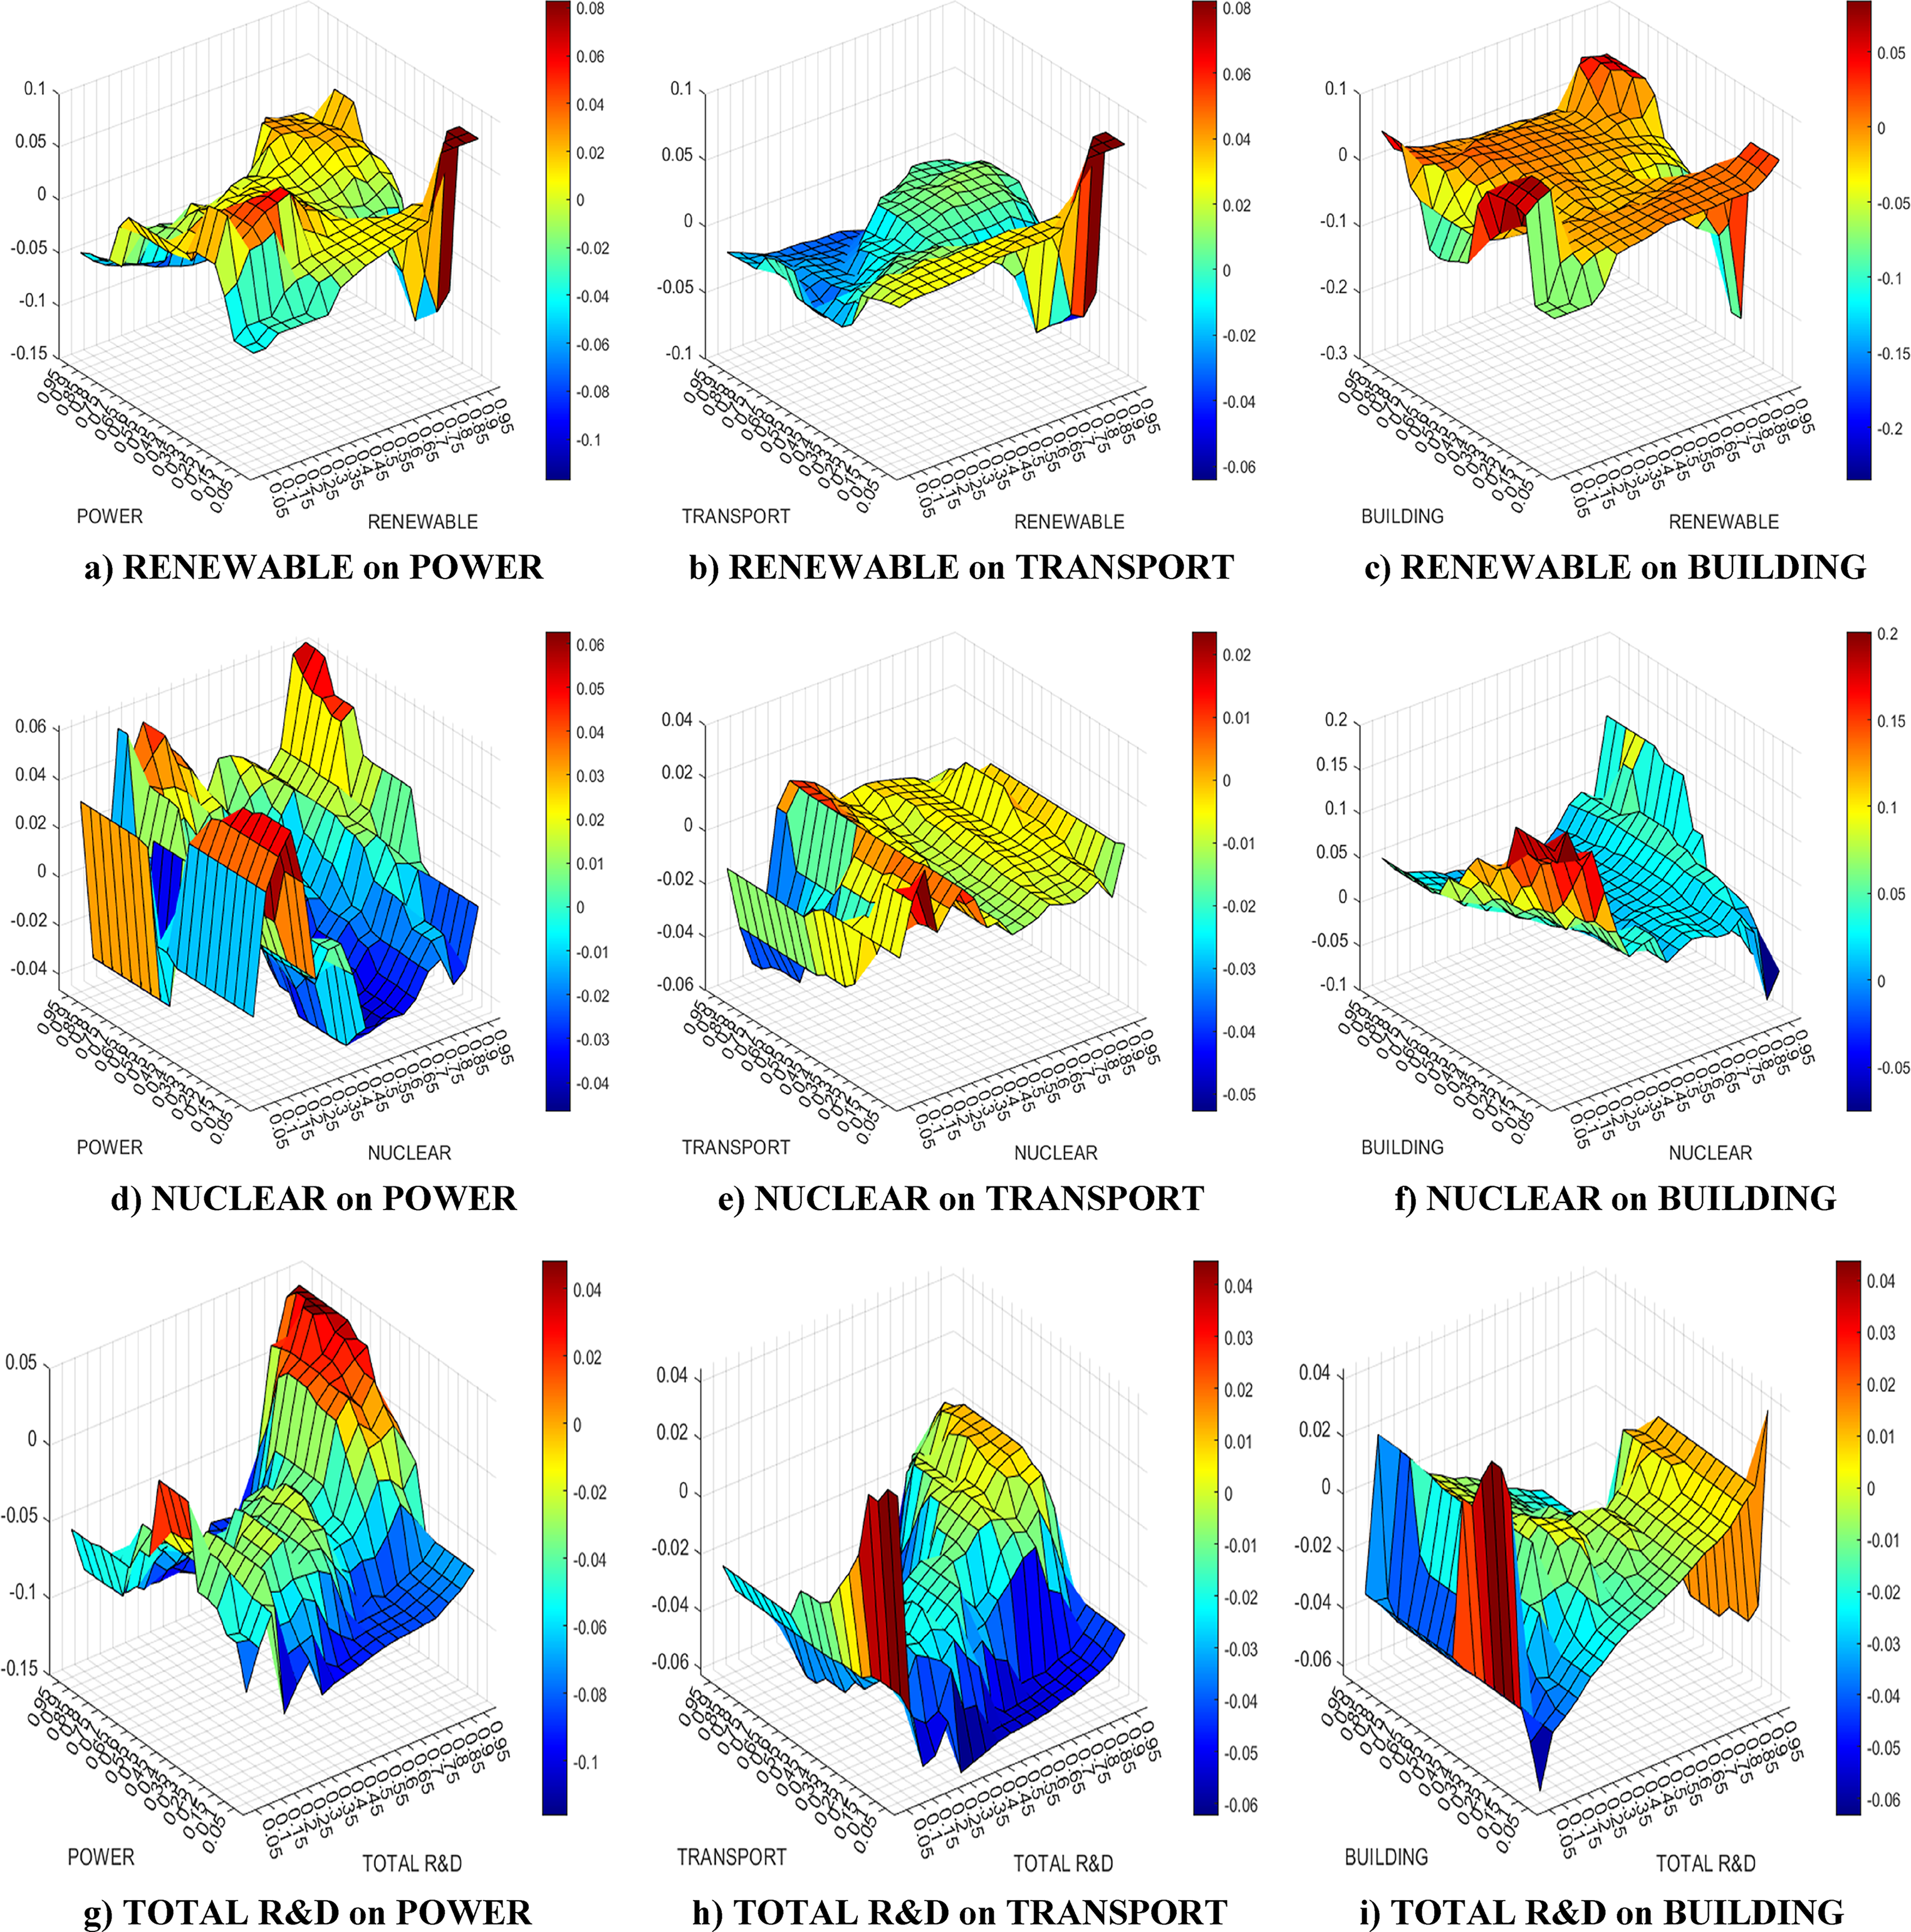
On sectoral CO2 emissions, R&D investment impact are analyzed using the QQ method at different quantiles. The outcomes are indicated in Figure 3.
The QQ results. (a) RENEWABLE on POWER. (b) RENEWABLE on TRANSPORT. (c) RENEWABLE on BUILDING. (d) NUCLEAR on POWER. (e) NUCLEAR on TRANSPORT. (f) NUCLEAR on BUILDING. (g) TOTAL R&D on POWER. (h) TOTAL R&D on TRANSPORT. (i) TOTAL R&D on BUILDING.
Figure 3(a)–(c) illustrate the interdependence structure between RENEWABLE versus POWER, TRANSPORT, and BUILDING at different quantiles. The relationship between the two variables has a complex pattern that has a different interaction impact on RENEWABLE at several quantiles. In the relationship between RENEWABLE and POWER, it can be said that there are four areas where the impact is significant and cannot be ignored. In the first area where the quantiles from 0.90 to 0.95 in POWER and the quantiles from 0.05 to 0.70 in RENEWABLE, the impact of POWER on RENEWABLE is strongly negative. However, the impact of POWER on RENEWABLE is strongly positive in case of the quantiles of POWER are under 0.20 and the quantiles of RENEWABLE are upper than 0.85, the quantiles from 0.20 to 0.40 in POWER and the quantiles from 0.15 to 0.35, and the quantiles from 0.65 to 0.80 in POWER and the quantiles from 0.75 to 0.85 in RENEWABLE.
Once the link between TRANSPORT and RENEWABLE is revealed at different quantiles, it is determined there are two areas where the impact of TRANSPORT on RENEWABLE is significant. The impact is significantly negative in the triangle area where the quantiles are lower than 0.40 in TRANSPORT and the quantiles lower than 0.50 in RENEWABLE. However, the impact is positive in the area where the quantiles are lower than 0.15 in TRANSPORT and the quantiles are higher than 0.80 in RENEWABLE. The impacts differ from −0.3 to 0.1 at different quantiles in the relationship between RENEWABLE and BUILDING. In addition, the impact in the area where the quantiles from 0.25 to 0.40 in BUILDING and the quantiles from 0.70 to 0.95 in RENEWABLE is strongly negative. The impact in other areas is around 0.05 level.
Besides, the relationship between NUCLEAR and sectoral CO2 emissions is detailed in Figure 3(d)–(f). The impact in the areas where the quantiles are lower than 0.40 in POWER and the quantiles between 0.10 and 0.25 in NUCLEAR, and the quantiles are higher than 0.70 in POWER and the quantiles are higher than 0.85 in NUCLEAR is relatively higher and positive, but, the impact is strongly negative when the quantiles of POWER are less than 0.50 and the quantiles of NUCLEAR are among 0.45 and 0.75. Once the link between NUCLEAR and TRANSPORT is examined, the impact is generally between −0.01 and 0.01, the impact is negative in the area composed of the quantiles of NUCLEAR are less than 0.25 and the quantiles of TRANSPORT are lower than 0.60. Similar to the relationship between NUCLEAR and TRANSPORT, the impact between NUCLEAR and BUILDING is around −0.05 and 0.05 in all quantiles, except where the quantiles are lower than 0.50 in both NUCLEAR and BUILDING.
The relationship between TOTAL R&D versus POWER, TRANSPORT, and BUILDING at different quantiles is seen in Figure 3(g)–(i). Impacts of TOTAL R&D on sectoral CO2 emissions are differentiated from -.015 to 0.05 for POWER, from −0.06 to 0.04 for TRANSPORT, and from −0.06 to 0.04 for BUILDING. The impact is negative at the highest and the lowest quantiles in POWER, but the impact is positive in the area where the quantiles are higher than 0.70 in TOTAL R&D and the quantiles are higher than 0.60 in POWER. For the relationship between TRANSPORT and TOTAL R&D, similar to the link between POWER and TOTAL R&D, the impact is negative. However, the impact turns to positive from the lower levels to the higher levels in TOTAL R&D in the area where the levels are lower than 0.30 in BUILDING, and vice versa in the area where the levels are higher than 0.60 in BUILDING.
GQ results
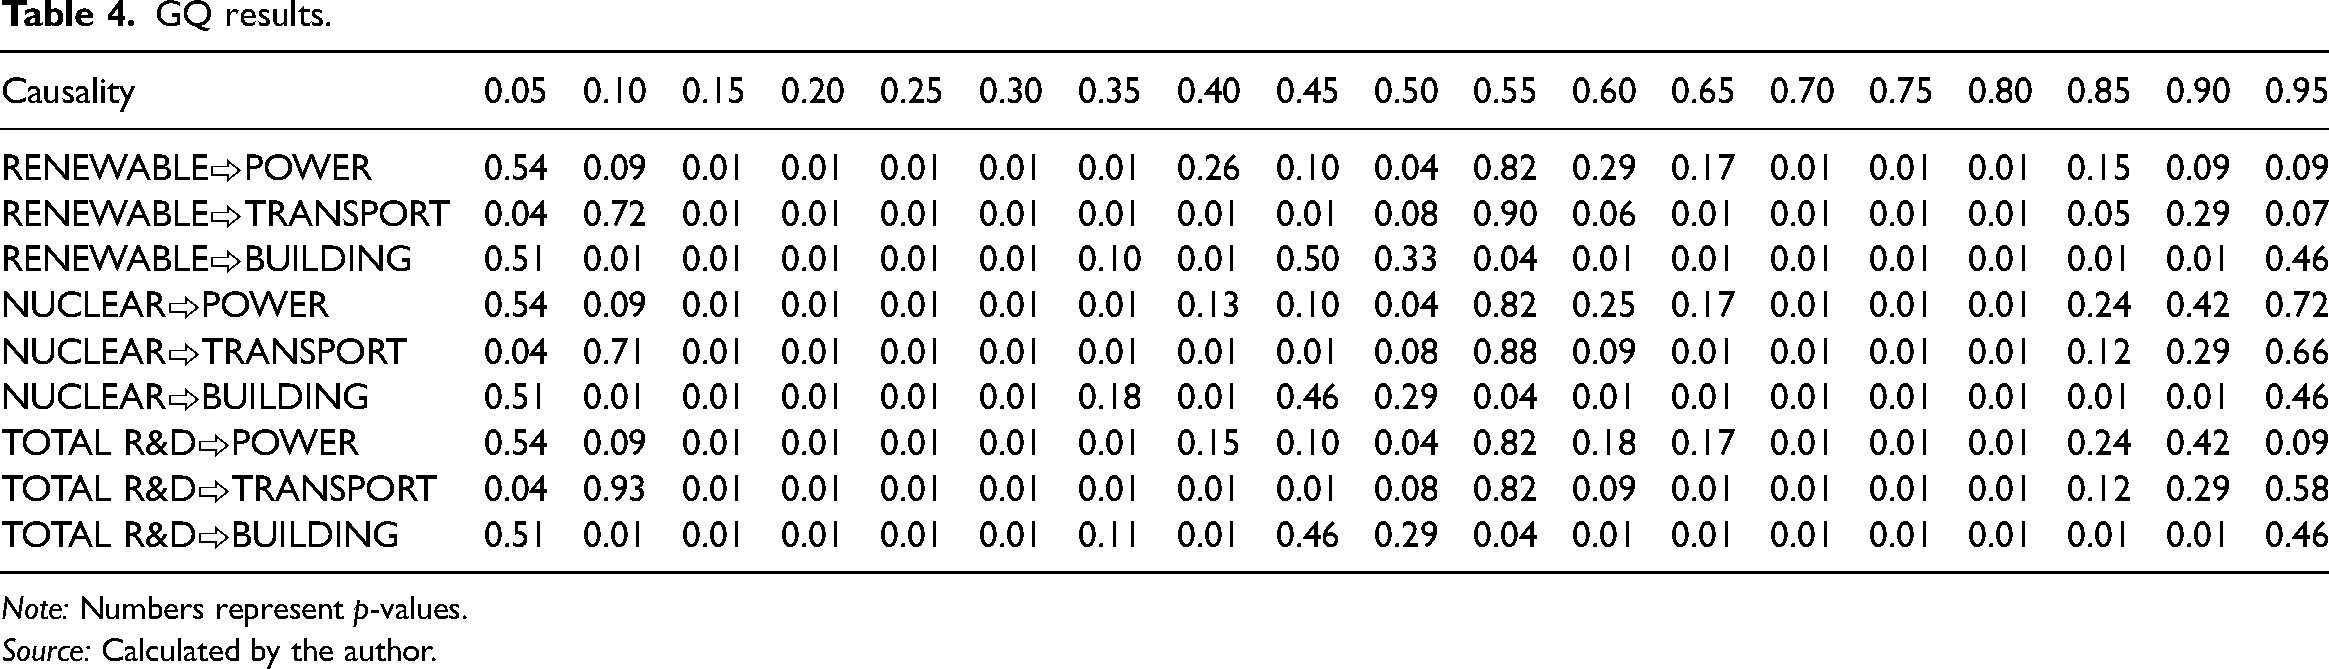
A nonlinear causality relationship at different quantiles is searched by GQ method and Table 4 reports the outcomes.
GQ results.
Note: Numbers represent p-values.
Source: Calculated by the author.
According to Table 4, the causalities from RENEWABLE, NUCLEAR, and TOTAL R&D to POWER are statistically significant at the quantiles from 0.15 to 0.35, and from 0.70 to 0.80. Similar to the relationship between RENEWABLE, NUCLEAR, and TOTAL R&D versus POWER, there are two areas, where the causalities from RENEWABLE, NUCLEAR, and TOTAL R&D to TRANSPORT have a significant relationship statistically. These areas are at lower (0.15–0.45) and higher (0.65–0.80) quantiles. Besides, the causalities from RENEWABLE, NUCLEAR, and TOTAL R&D to BUILDING are statistically significant at the quantiles from 0.10 to 0.30, and from 0.55 to 0.90. These results show that RENEWABLE, NUCLEAR, and TOTAL R&D do not have the same impact on the different quantiles of the related variables. Thus, the causality should be interpreted by quantile on quantile in detail.
Robustness
The validity of the outcomes from QQ method is performed with the QR method. Also, plots showing the coefficients for each quantile obtained from QQ and QR methods are provided in Supplementary Figure S3. Based on these visualizations, the QQ and QR coefficients are close to each other, which is strong evidence for co-movement. Besides, the correlations between QQ and QR methods’ outcomes are calculated, which are given in Table 5.
Correlations between QQ and QR methods.

Source: Calculated by the author.
The correlation coefficients between the QQ and QR coefficients at different quantiles are higher than 70%, which reaches approximately 88% at some variable pairs. Thus, the outcomes of the both methods confirm each other and the outcomes can be used to argue various policy inferences.
Conclusion and policy inferences
Conclusion
In the world, environmental degradation has been increasing, which has caused also an increasing interest of societies in environmental issues due to increasing adverse impacts. To curb environmental degradation, all actors have been searching for ways. In this context, energy R&D investments are critical tools that can be beneficial to develop better techniques for obtaining energy generation or ways to ensure energy efficiency because energy use is one of the main drivers of degradation in the environment. In this context, various countries have been allocating a higher amount to energy R&D investments. Among all, the USA is the pioneering country that has been allocating the highest budgets. So, considering these points, the study assesses R&D investment impact in nuclear and renewable energy on sectoral CO2 emissions in the USA, applies WC, QQ, GQ, and QR methods by using the most up-to-date dataset.
The outcomes show that there is a strong dependency between R&D investments and sectoral CO2 emissions at different times and frequencies, which is revealed by WC analysis. This argues that the way of correlation and magnitude differ at different times and frequencies. Moreover, it is also proved that nuclear, renewable, and total energy R&D investments have a causality nexus with sectoral CO2 emissions, which is determined by quantile-based causality by the GQ method, while the causality relationship varies across quantiles. Furthermore, the impact of nuclear energy R&D investments has a declining impact on power and building sector CO2 emissions while it has an increasing impact on transport CO2 emissions at higher quantiles. According to the analysis on determining the impact of renewable energy R&D investments on sectoral CO2 emissions, it is shown that there is a positive correlation between renewable energy R&D investments and sectoral CO2 emissions at higher quantiles of renewable energy R&D investments, whereas it turns negative at lower quantiles.
When the outcomes of the study are compared with the current studies, the following statements can be made. Renewable energy R&D investments have an increasing impact on power, transport, and building sectors’ CO2 emissions. Some research have either argued the declining impact (e.g. Usman et al. 35 ) or insignificant impact (e.g. Koçak and Ulucak, 34 Ahmed et al. 12 ) of renewable energy R&D investments on the environment. So, the study differs from these. One of the main causes of this condition is the low share of renewable energy use in the total energy mix. So, it is critical to increase the share of renewable energy in the total energy mix in the USA. Nuclear energy R&D investments have a stimulating impact on the transport sector’ CO2 emissions, whereas they have a curbing impact on the power and building sectors’ CO2 emissions. This finding is similar to Çağlar, 32 who defines a negative shock in nuclear energy R&D investments as causing an increase in environmental degradation in the United Kingdom. Also, Kartal et al. 44 define an insignificant impact of nuclear energy R&D investments on the environment for Japan and Germany, in order. Total energy R&D investments have a curbing impact on the power and transport sectors’ CO2 emissions, whereas they have an increasing impact on the building sector’ CO2 emissions. This determination is also consistent with Koçak and Alnour, 3 who define that a negative shock causes an increase in CO2 emissions in the USA. Similarly, Voumik et al. 31 define a declining impact of R&D investments on CO2 emissions in European countries.
As can be seen from the comparison taking place above, while the study confirms the findings in the present studies in some way, it is also differentiated in some other ways. The main cause of the differences between the results is that this research uses disaggregated level data for R&D investments and sectoral CO2 emissions. Hence, the results vary across sectors and R&D investment types. Also, another reason is for the use of econometric methods because this study applies nonlinear time, frequency, and quantile-based methods rather than a mean-based econometric estimation approach. Hence, the results obtained in this study vary across time, frequency, quantile, R&D types, and sectors.
Overall, the main contribution of the study is that the importance of the time, frequency, sector, and quantile-based analysis to uncover the impacts of R&D investments are explored by using disaggregated level data for both R&D investments and CO2 emissions, which is the main shortcomings in the literature, by examining the USA case as the leading R&D investing country among all countries.
Policy inferences
The study mainly defines time, frequency, quantile, R&D type, and sector-based differentiating impact of energy R&D investments on sectoral CO2 emissions. R&D investments are crucial for the USA as well as other countries to reach a high-level environmental performance. Therefore, policymakers should take into account these varying impacts, design ready-to-action plans by following the empirical findings of this study, and incorporate measures into eco-friendly plans. Accordingly, some policy inferences can be argued that are thought to be helpful for the USA policymakers.
The outcomes show that the results for aggregated and disaggregated level R&D investments in environmental degradation differ from each other. Hence, USA policymakers should consider also the impact of R&D investments at the disaggregated level in addition to the aggregated level. Otherwise, there will be a lack of analysis of the current situation and new plans to develop the environment further in the USA.
Also, the impact of R&D investments on CO2 emissions changes according to sectors. So, thinking that an increase in R&D investments has a good impact on curbing CO2 emissions in all sectors is a misleading attitude. Hence, USA policymakers should avoid such a wrong approach in developing environmental policies as well as allocating R&D investments among alternatives.
Besides, the impact of energy R&D investments on sectoral CO2 emissions has a nonlinear structure. The impact of energy R&D investments has different characteristics at different quantiles of sectoral CO2 emissions. Therefore, USA policymakers should monitor continuously the usage of energy R&D investments usage and their impacts on sectoral CO2 emissions. When a type of energy R&D is evaluated as insignificant (renewable energy R&D investments in this study), immediate corrective actions should be taken on time. In this context, policymakers should carefully analyze why renewable energy R&D investments do not have a curbing impact on any sectoral CO2 emissions. Two potential causes of this condition are either the using less amount of renewable energy in the total energy mix or not allocating enough R&D investment budget. With further detailed analysis to be made by policymakers with the use of internal data that are not public, they should explore the root cause and take measures accordingly.
The magnitude of R&D investment impact in renewable and nuclear energy varies on sectoral CO2 emissions. Specifically, the role of renewable energy R&D investments in building CO2 emissions, and the role of total energy R&D investments in power, transport, and building CO2 emissions are negative (i.e. decreasing) at all quantiles. Moreover, an increase in renewable energy R&D investments causes a decrease in building CO2 emissions, whereas an increase in nuclear energy R&D investments causes an increase in building CO2 emissions. So, allocated budgets among renewable and nuclear energy R&D investments should be optimized to reduce power, transport, and building sector CO2 emissions. Hence, environmental degradation can be increased by optimizing renewable and nuclear energy R&D investments. For this purpose, USA policymakers should work on long-term action plans about installing and managing renewable and nuclear energy sources and stimulating clean energy production. Also, renewable energy R&D investments should be managed in a much better way because it has a damaging impact on power and transport sector CO2 emissions.
It is highly recommended to USA policymakers that they should continue to rely on nuclear R&D investments in decreasing environmental degradation, while they should think about much more efficient usage of renewable energy R&D investments. Lastly, it is crucial to prioritize improving environmental degradation as a macroprudential goal at the national level. Therefore, by accomplishing the SDGs, particularly those related to clean energy (SDG-7) and climate change (SDG-13), policymakers can reach their carbon-neutrality objectives up to 2050 while not damaging economic progress as well.
Future research directions
Although the study presents new insights and argues various policy inferences, there are still some limitations. In the first case, it focuses on only the USA, which is a leading R&D investing country in energy R&D investments. So, further studies can consider either examining or including other countries.
Secondly, two different sources, which are renewable and nuclear energy R&D investments, are considered to measure the impact of sectoral CO2 emissions. However, in further studies, investments in other energy R&D investments can be considered and different environmental indicators can be used for further investigation.
Thirdly, not only energy R&D investments but also other economic and social factors can used in the new studies since the research considers only renewable and nuclear energy R&D investments.
Finally, although novel nonlinear time series methods are used for empirical investigation in this study, forthcoming studies can perform different techniques (e.g. estimators with Fourier and wavelet transforms). Hence, the knowledge about R&D investment impact on the environment can be extended further.
Supplemental Material
sj-docx-1-eae-10.1177_0958305X241228508 - Supplemental material for Time, frequency, and quantile-based role of R&D investments in energy on sectoral degradation in the United States
Supplemental material, sj-docx-1-eae-10.1177_0958305X241228508 for Time, frequency, and quantile-based role of R&D investments in energy on sectoral degradation in the United States by Mustafa Tevfik Kartal in Energy & Environment
Footnotes
Abbreviations
Authors’ contributions
MTK prepared the article.
Availability of data and materials
Data will be made available on request.
Declaration of conflicting interests
The author declared no potential conflicts of interest with respect to the research, authorship, and/or publication of this article.
Ethics approval and consent to participate
Not applicable.
Funding
The author received no financial support for the research, authorship, and/or publication of this article.

Supplemental material
Supplemental material for this article is available online.
References
Supplementary Material
Please find the following supplemental material available below.
For Open Access articles published under a Creative Commons License, all supplemental material carries the same license as the article it is associated with.
For non-Open Access articles published, all supplemental material carries a non-exclusive license, and permission requests for re-use of supplemental material or any part of supplemental material shall be sent directly to the copyright owner as specified in the copyright notice associated with the article.
