



Abstract
In this study, we evaluated the material and environmental benefits of recycling materials collected at the University of Seoul. The waste composition was analyzed by sampling using the coning and quartering methods at the campus recycling center. The material cost was determined by comparing the prices of raw materials and recycled materials, while the environmental cost was calculated by estimating potential greenhouse gas emissions by incineration and multiplying this by the carbon price. It was analyzed that recycling rather than incineration can reduce greenhouse gas emissions up to 2.8 tCO2eq per tonne of waste. As a result, approximately 250 t of household waste is generated annually at the University of Seoul, with approximately 16% consisting of recyclable materials such as plastic and paper. Based on the carbon price of the Republic of Korea, the potential savings were around 608,000 USD/year. Using the current EU carbon price, the savings increased to 647,000 USD/year, and based on the 2030 target carbon price, the savings amounted to 677,000 USD/year. It represents that recycling not only minimizes natural resource depletion but also mitigates greenhouse gas emissions and results in significant economic cost savings. This research investigates specific methods for calculating monetary values to incentivize recycling and presents practical applications.
Introduction
Waste not only causes environmental pollution but also leads to depletion of resources and economic losses. According to the 2021 National Waste Generation and Disposal Status Report released by the Ministry of Environment and the Korea Environment Corporation, the total waste generated in 2021 was 197.38 million t, an increase of approximately 1.0% compared to the previous year, as shown in Table S1.1,2 Household waste, as depicted in Table S2 and Fig. S1, has been consistently increasing, similar to the increase in overall waste.1,2
The recycling rate in the Republic of Korea has significantly increased since the introduction of the Volume-based Waste Fee (VWF) policy in 1995. According to the Ministry of Environment (the Republic of Korea), the basic principles of VWF are as follows: (1) households (or small businesses) are required to purchase standardized plastic waste bags produced and sold by local governments, (2) wastes are to be put into the plastic bag and left for collection, (3) recyclables such as paper, plastic, and cans are collected from containers or bins placed near residences at no charge. 3
However, despite the implementation of additional environmental management measures such as the 4R (Reduce, Reuse, Recycle, Recovery) and Extended Producer Responsibility (EPR) systems, the recycling rate has not shown substantial improvement. 3 This stagnation indicates a need for alternative approaches to enhance the effectiveness of waste recycling policies. A study has suggested that providing monetary incentives for waste recycling can positively motivate recycling behavior. 4 Accordingly, this research investigates specific methods for calculating monetary values to incentivize recycling and presents practical applications.
As demand for resources is expected to increase in the future, a circular economy is considered an important means of sustainable growth. 5 A circular economy keeps materials and products in circulation for as long as possible. Material recovery has an important role in reducing the use of natural resources. The United Nations’ International Resource Panel concluded that natural resource extraction and processing contribute to about half of all global greenhouse gas emissions. 6 All CO2 emissions in the waste sector result from incineration, and greenhouse gas emissions by incineration are 40.1% of total emissions. 7
In the Republic of Korea, waste is classified under the Waste Control Act into household and industrial waste, further categorized based on source and amount. Household waste refers to waste typically produced in homes or offices. Industrial waste is defined as waste generated by a business that produces more than 300 kg/day or emits more than 5 t of waste during construction or operational activities. 8 Based on its characteristics, industrial waste is further divided into general, construction, and specified industrial waste. 9 Figure 1 shows the classification of organized waste in the Republic of Korea. As shown in Figure 2, household waste is categorized as general waste or recyclable waste based on the presence of recyclable materials such as paper, glass, and plastics.
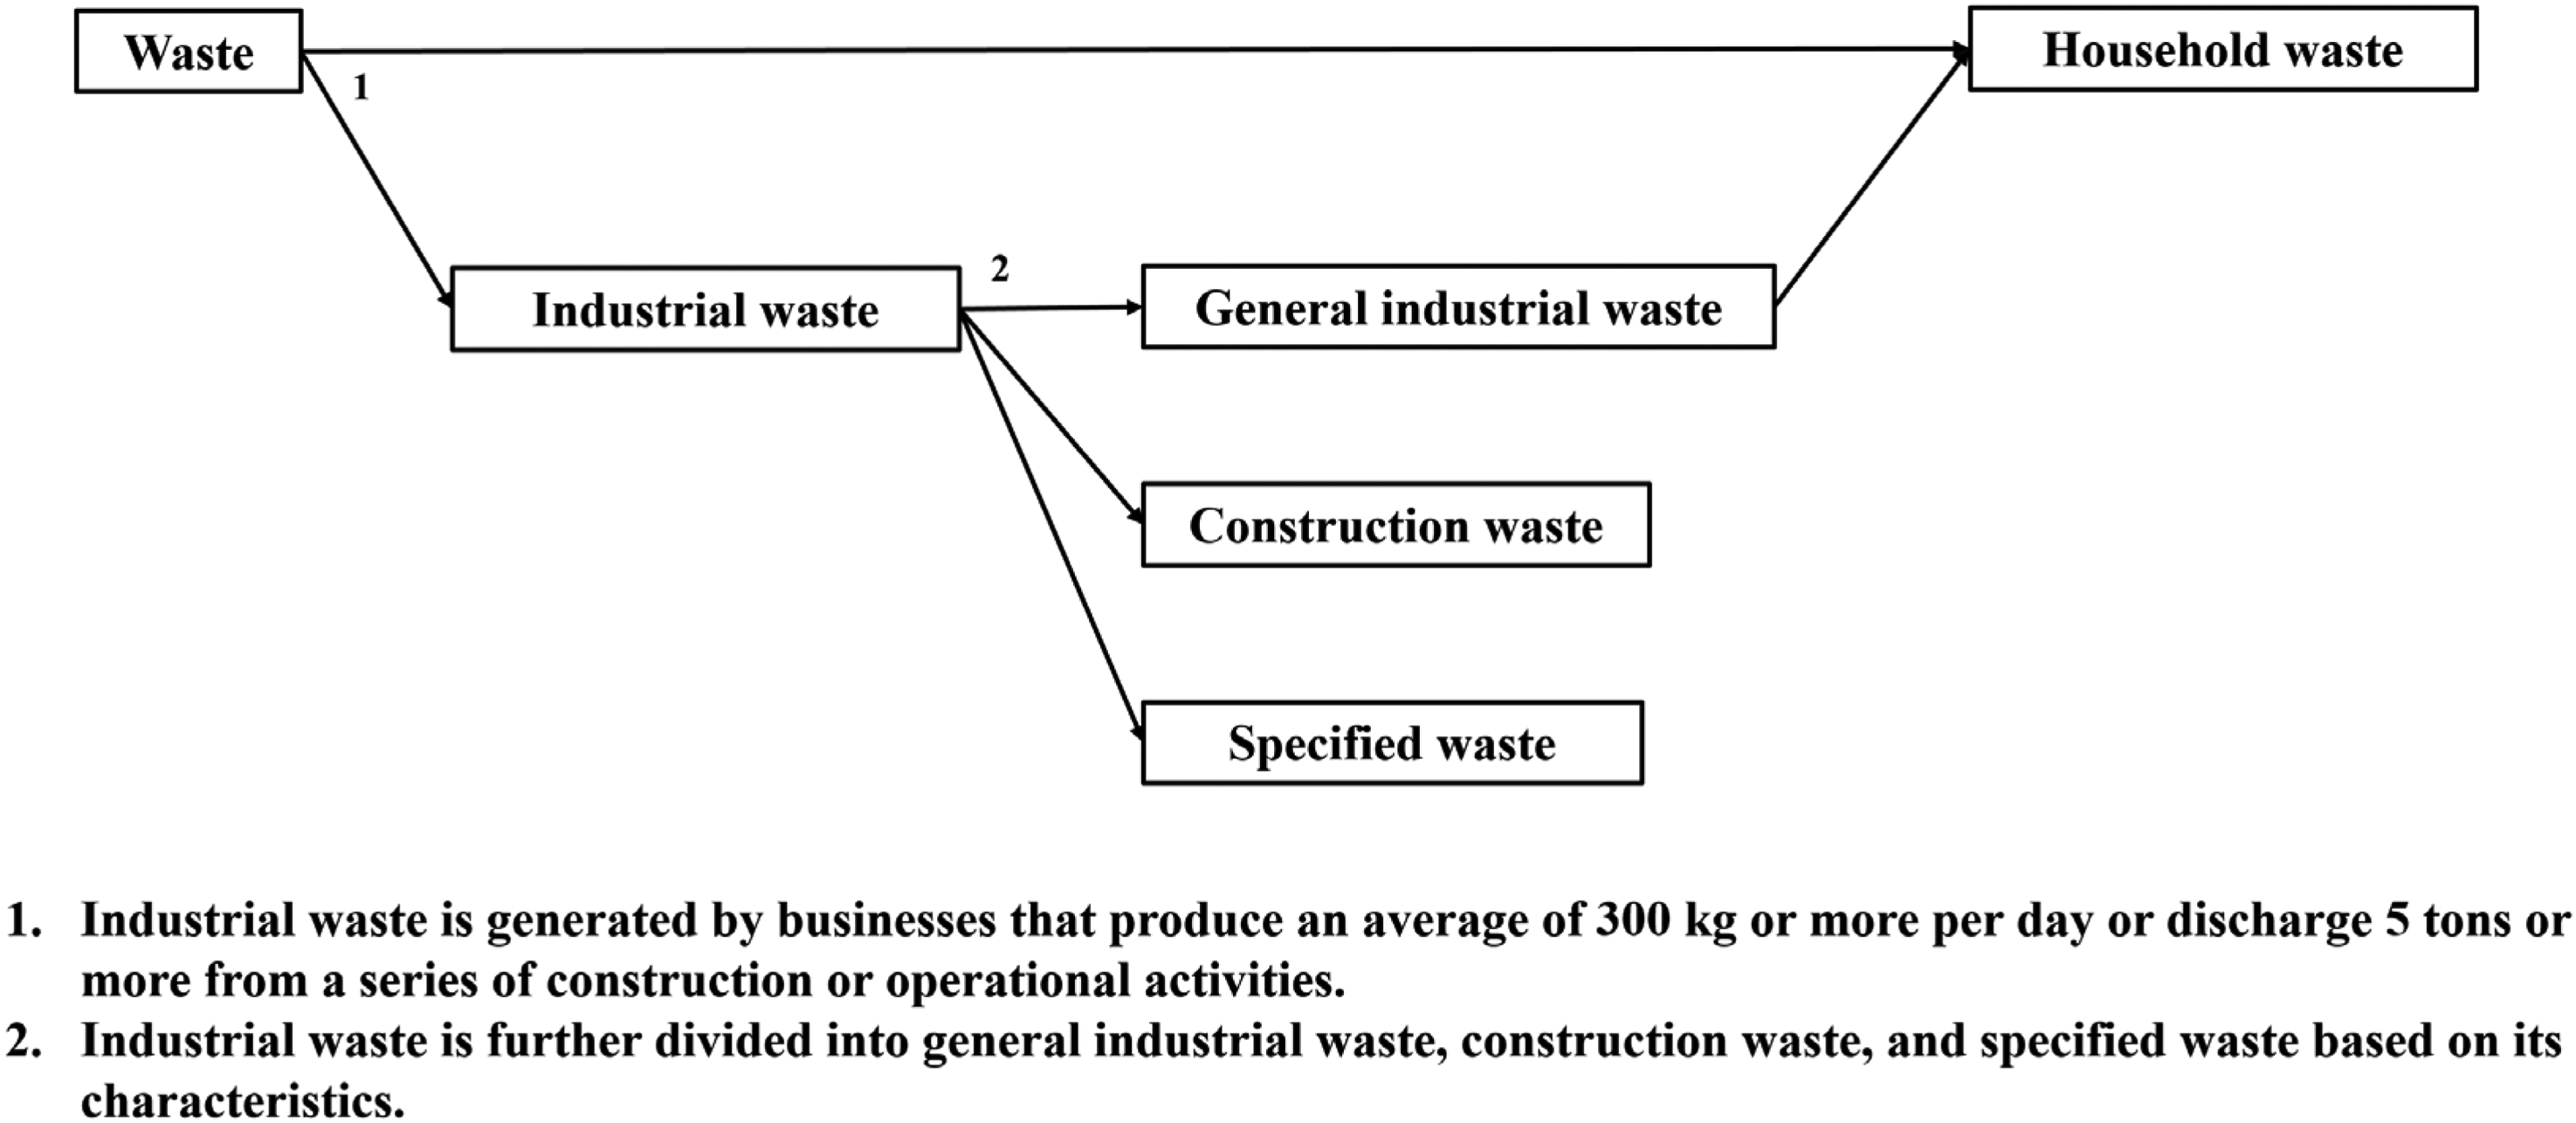
The waste classification system in the Republic of Korea. 32
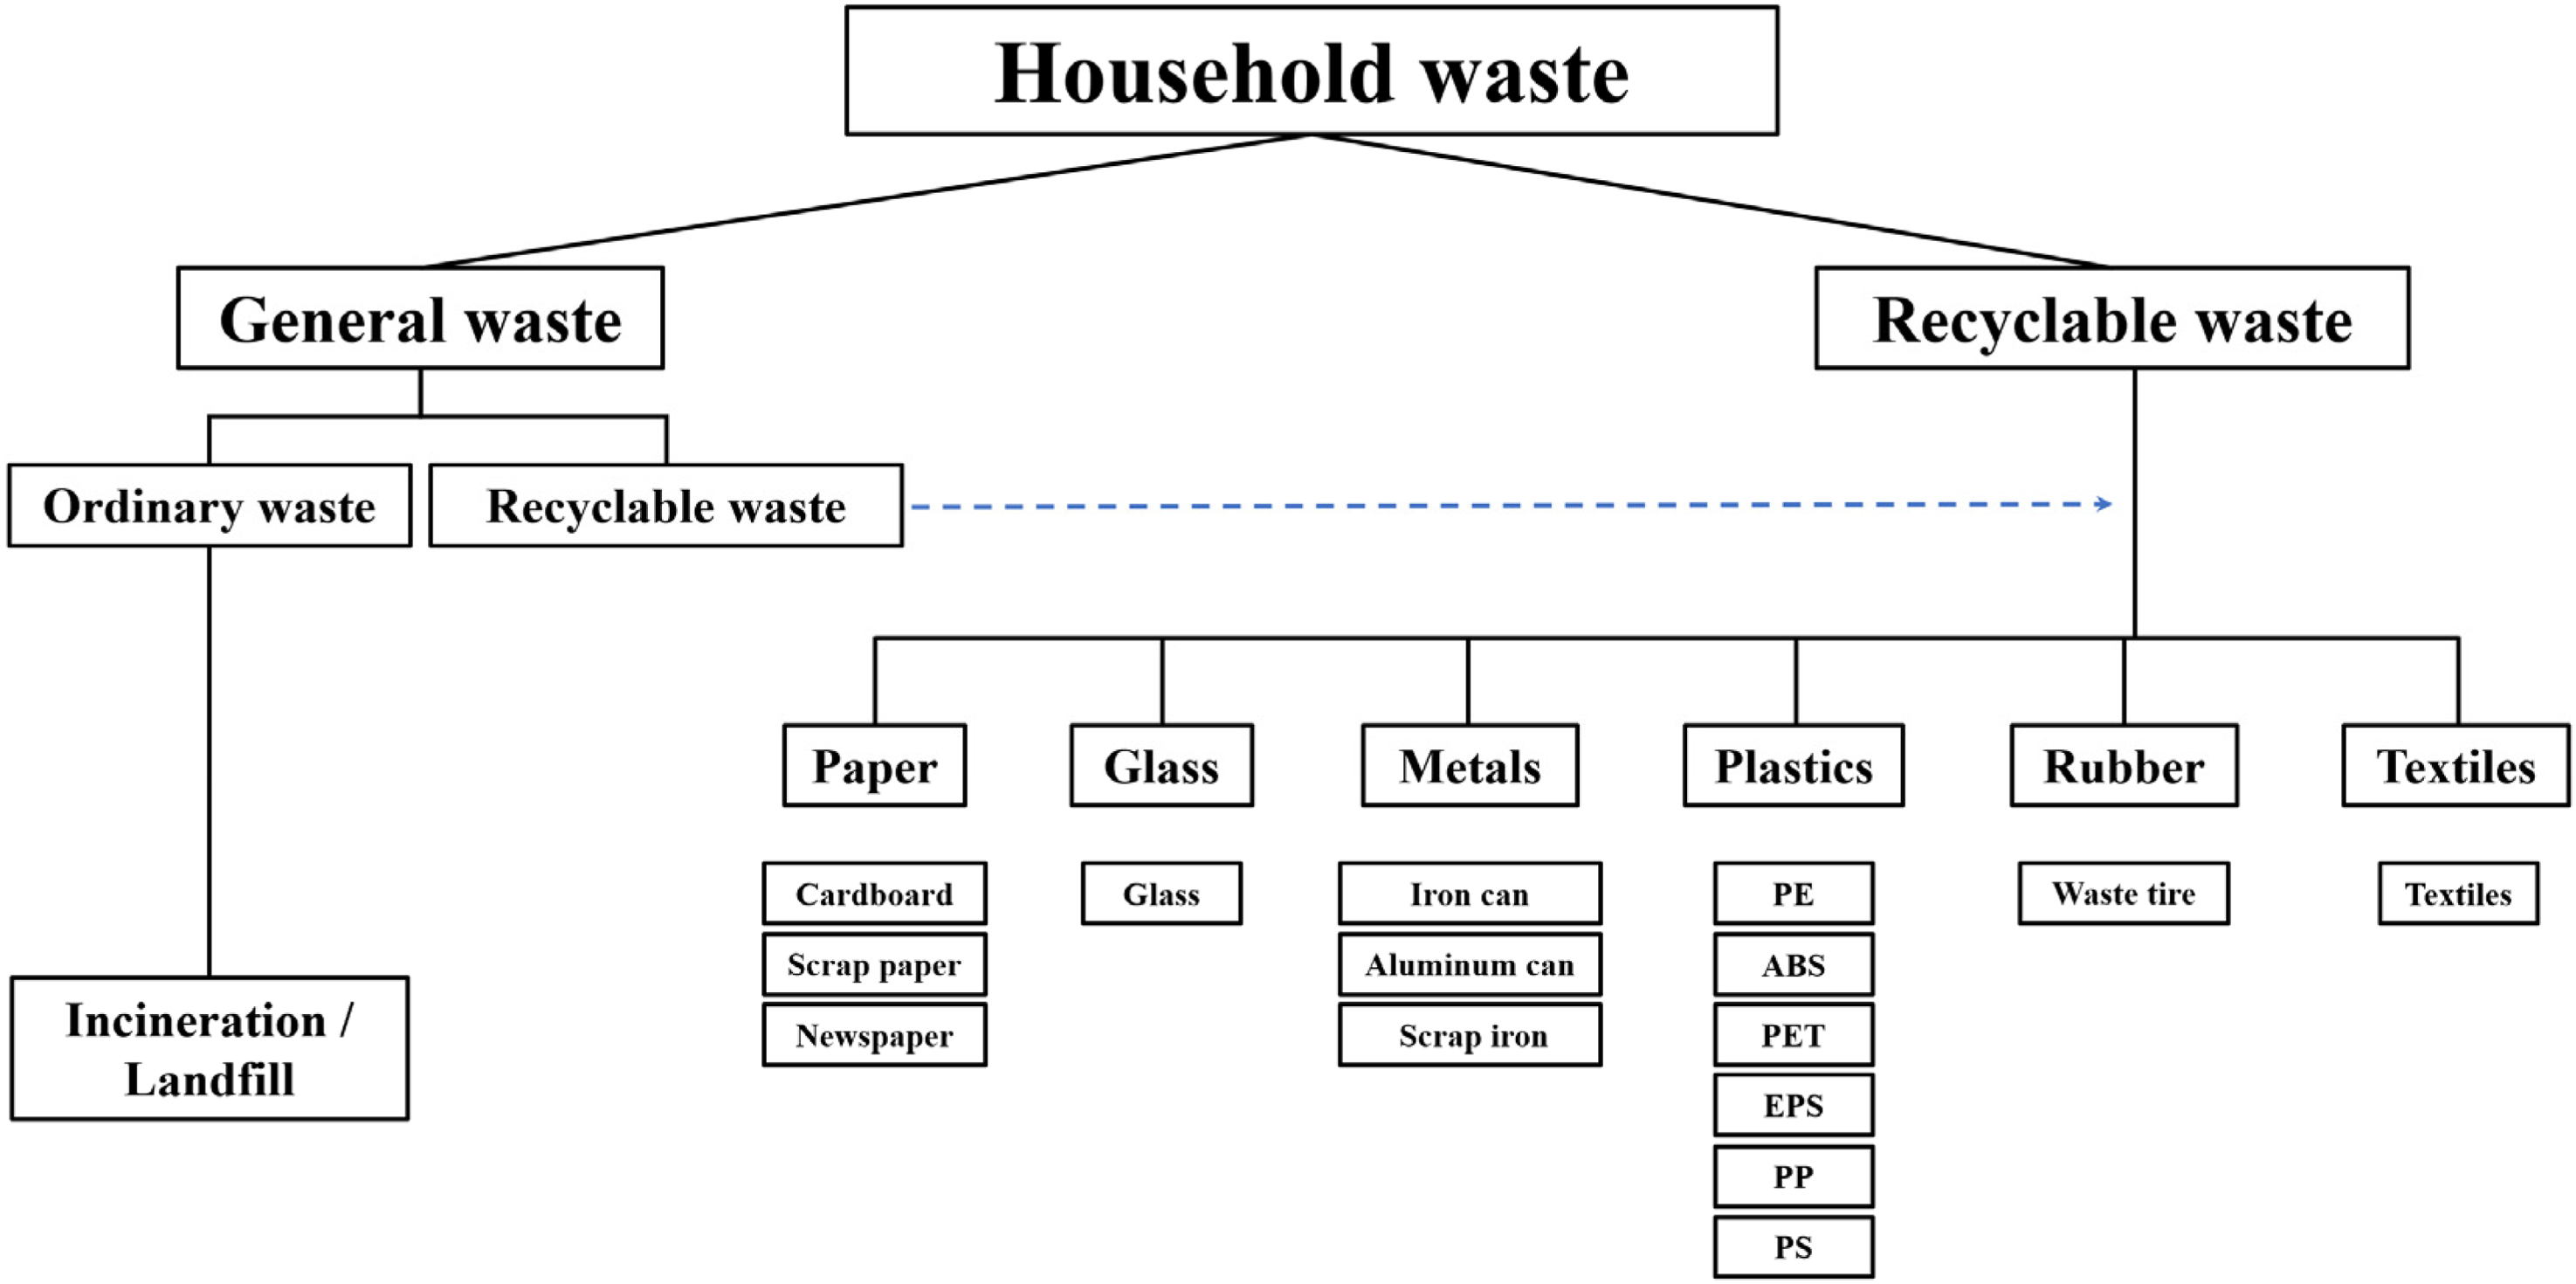
Classification of household waste and recyclable materials. 32
Universities in the Republic of Korea are designated as public institutions under administrative regulations and are mandated to contribute to greenhouse gas reduction by limiting the use of disposable products. However, as universities include diverse waste-emitting facilities, such as dormitories, cafeterias, laboratories, and offices, they face waste management challenges. 10 Evaluation of financial and environmental benefits from waste materials recycling in a university has not been previously studied. This study analyzes the waste generation characteristics of the university which we are affiliated with and calculates the environmental and financial value of recyclable resources. The findings of this research can aid in generalizing waste management practices to other public institutions and local regions and serve as foundational research for future studies aiming to apply these findings to public institutions and communities.
In this study, we aimed to analyze the composition of general and recyclable waste on the University of Seoul campus and calculate the carbon emissions and reductions for each item. Additionally, we calculated the amount of greenhouse gases emitted during incineration and the reduction achievable through recycling, and then converted the potential environmental value into a monetary value. Therefore, the study identifies the characteristics of waste generation on campus and presents the potential price for reducing the social costs of waste management through material recycling.
Material and methods
Characteristics of waste
General and recyclable waste generated was collected at the University of Seoul campus, one of the representative universities in the Republic of Korea. The collected waste was analyzed to determine the characteristics of the recyclable resources.
In composition analysis, the waste was categorized as general waste, plastic waste, paper waste, and ‘other waste’. The ‘other waste’ contains a large amount of recyclable resources such as plastic cups and food containers, but that is sent to incinerators and landfills for final disposal. The other waste primarily consists of single-use plastic cups from beverage shops. These cups are composed of various materials such as PET, PP, and PS, making them non-uniform in composition, and are often contaminated by food waste. Food waste adversely affects both the efficiency of plastic recycling and the quality of recycled products. 11 Consequently, due to the diminished value of recycled materials, other waste is rarely treated as recyclable and is instead disposed of along with general waste.
The samples were collected using coning and quartering methods. 12 The waste was mixed and evenly spread on a flat surface. It was then divided into four equal quarters, and two quarters were selected. These selected quarters were mixed again, and a second quartering was conducted. Consequently, the waste was collected to a measurable volume and one sampling was performed through the coning and quartering method. The analysis environment was carefully controlled to prevent the loss of fine particles.
Material price
We calculated the economic benefits of material recycling by distinguishing between material and environmental prices. Material prices represent the social profit that can be obtained using recycled materials and refer to the prices saved by separating recyclable resources. Therefore, material prices were determined by subtracting the price of the recycled materials from that of the raw materials. Environmental prices represent the monetary value of greenhouse gas emissions that would occur if waste were not recycled and incinerated instead. The greenhouse gases produced during incineration were calculated as CO2 equivalents (CO2eq), and this value was multiplied by the carbon price to express it in monetary value.



Recycled material price
We referenced the market price survey on recyclable materials conducted by the Korea Environment Corporation to determine the unit prices of each recycled material. The unit prices of the recycled materials in 2023 are listed in Table S3. 13 The prices of plastic waste vary depending on its form (compressed, flakes, and pellets), and it can be affected by market demand or material quality. Considering recent market prices, the average price of each form was used in this study. In this price survey, no data for textiles could be found because of the difficulty in finding statistics on recycled textiles, thus we used price information from major commerce platforms such as Alibaba. Alibaba is a B2B platform that hosts suppliers from around the world, providing prices that reflect actual transactions. 14 These prices are frequently referenced in other market research and analysis reports.15–17
Raw material price
Raw materials refer to the initially produced materials used to manufacture goods such as natural pulp. Raw material prices were determined using statistical data from sources such as the Korea Price Research Center and the London Metal Exchange.18,19 The types of raw materials surveyed were categorized according to the items mentioned in the Korea Environment Corporation's price survey. 13
Environmental price
The amount of greenhouse gases varies depending on the material and was calculated using the Greenhouse Gas Calculation Manual from the Korea Environment Corporation. 20 Additionally, to convert the calculated amount of greenhouse gases into monetary value, we used the international standard of emission trading system (ETS). 21
Greenhouse gas emissions
Greenhouse gas emissions were estimated based on household waste. Due to the amendment of the Waste Management Act Enforcement Rules, policies are being implemented to minimize landfills by 2030. 22 Therefore, landfills were excluded and only incineration was considered. As of 2021, among the 71 household waste incineration facilities nationwide, 66 were continuous fixed-bed incinerators. 23 This study calculated emissions of greenhouse gas based on the continuous fixed-bed incinerators. 20
We calculated the emissions of CO2, CH4, and N2O, which are the major components of greenhouse gas, from waste incineration, and determined the CO2eq with the Global Warming Potential (GWP). Equations (4)-(7) are followed by the Greenhouse Gas Calculation Manual from the Korea Environment Corporation.




Determination of carbon price
Carbon price refers to the cost associated with the right to emit a certain amount of greenhouse gases over a specified period within an ETS. According to the International Carbon Action Partnership (ICAP), the average carbon price in the Republic of Korea in 2023 was 17,617 KRW/tCO2eq. However, the Republic of Korea's carbon market is unstable and not fully active. 24 Accordingly, carbon prices of the Republic of Korea are expected to exhibit fluctuation in the future, and scenarios were established to evaluate various potential carbon prices. Each scenario adopts the carbon prices of the EU which is a major international market, and expected carbon prices for 2050 when carbon neutrality is targeted to be achieved.
Results and discussion
Characteristics of waste
Estimation of waste generation
The waste generated at the University of Seoul moves sequentially from trash bins to storage areas, and then to a recycling center. During the waste sorting process, waste is separated into general waste, plastic waste, paper waste, and other waste. Recyclable resources are first sorted into storage areas and then subjected to a second sorting step at the recycling center before being transported to recycling companies. Although other waste is separately sorted during the collection process, it is transported to incineration or landfill facilities along with general waste. Waste generated from 33 buildings on the campus is collected daily at a single recycling center. Therefore, a substantial amount of waste accumulates, and the second sorting step conducted at the recycling center is estimated to be marginal at the University of Seoul.
The amount of general and recyclable waste generated at the University of Seoul is shown in Table S5, Figure 3, and Figure 4. According to the Department of Facility Management in the university, waste generation is largely influenced by campus construction schedules. Therefore, the waste generation data may have limitations in identifying cyclical patterns. However, waste generation can potentially be predicted and managed according to campus construction schedules, and multi-year data will be essential for accurate predictions. For the reduction of potential limitations or uncertainties in the waste generation data, the application of various collection methods or seasonal fluctuations can be suggested.
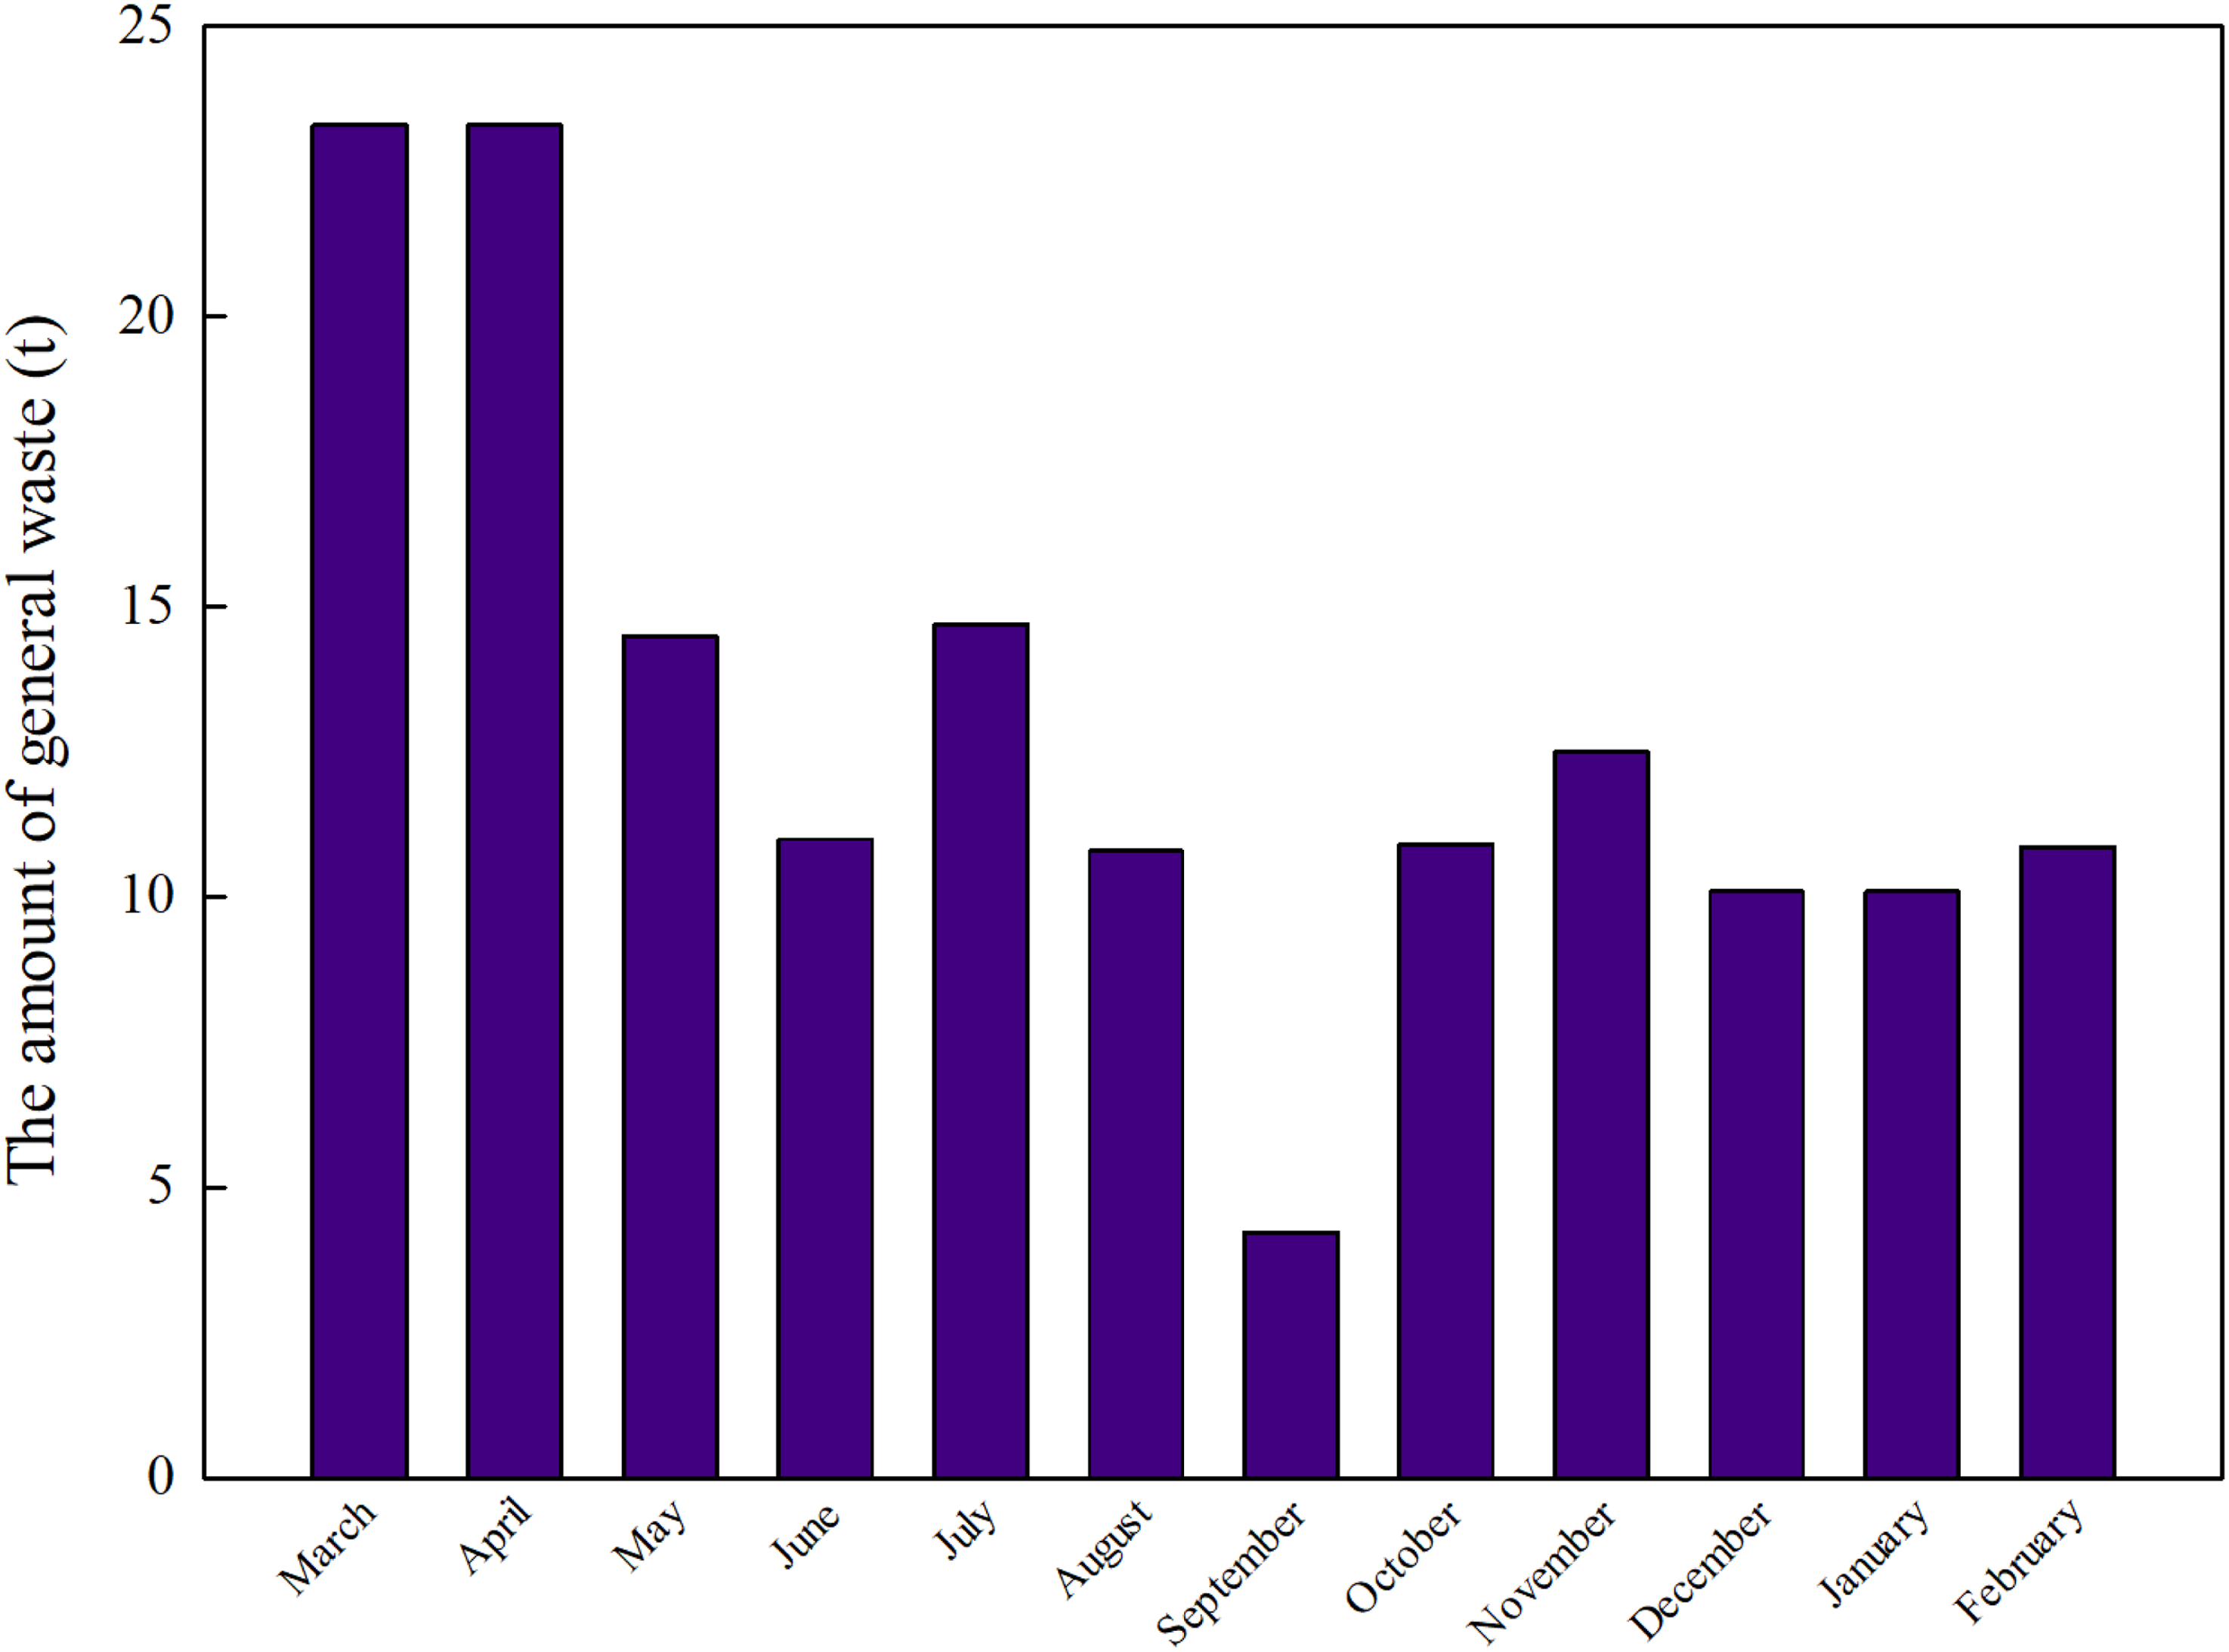
Graph depicting the general waste generated at the University of Seoul between March 2022 to February 2023.
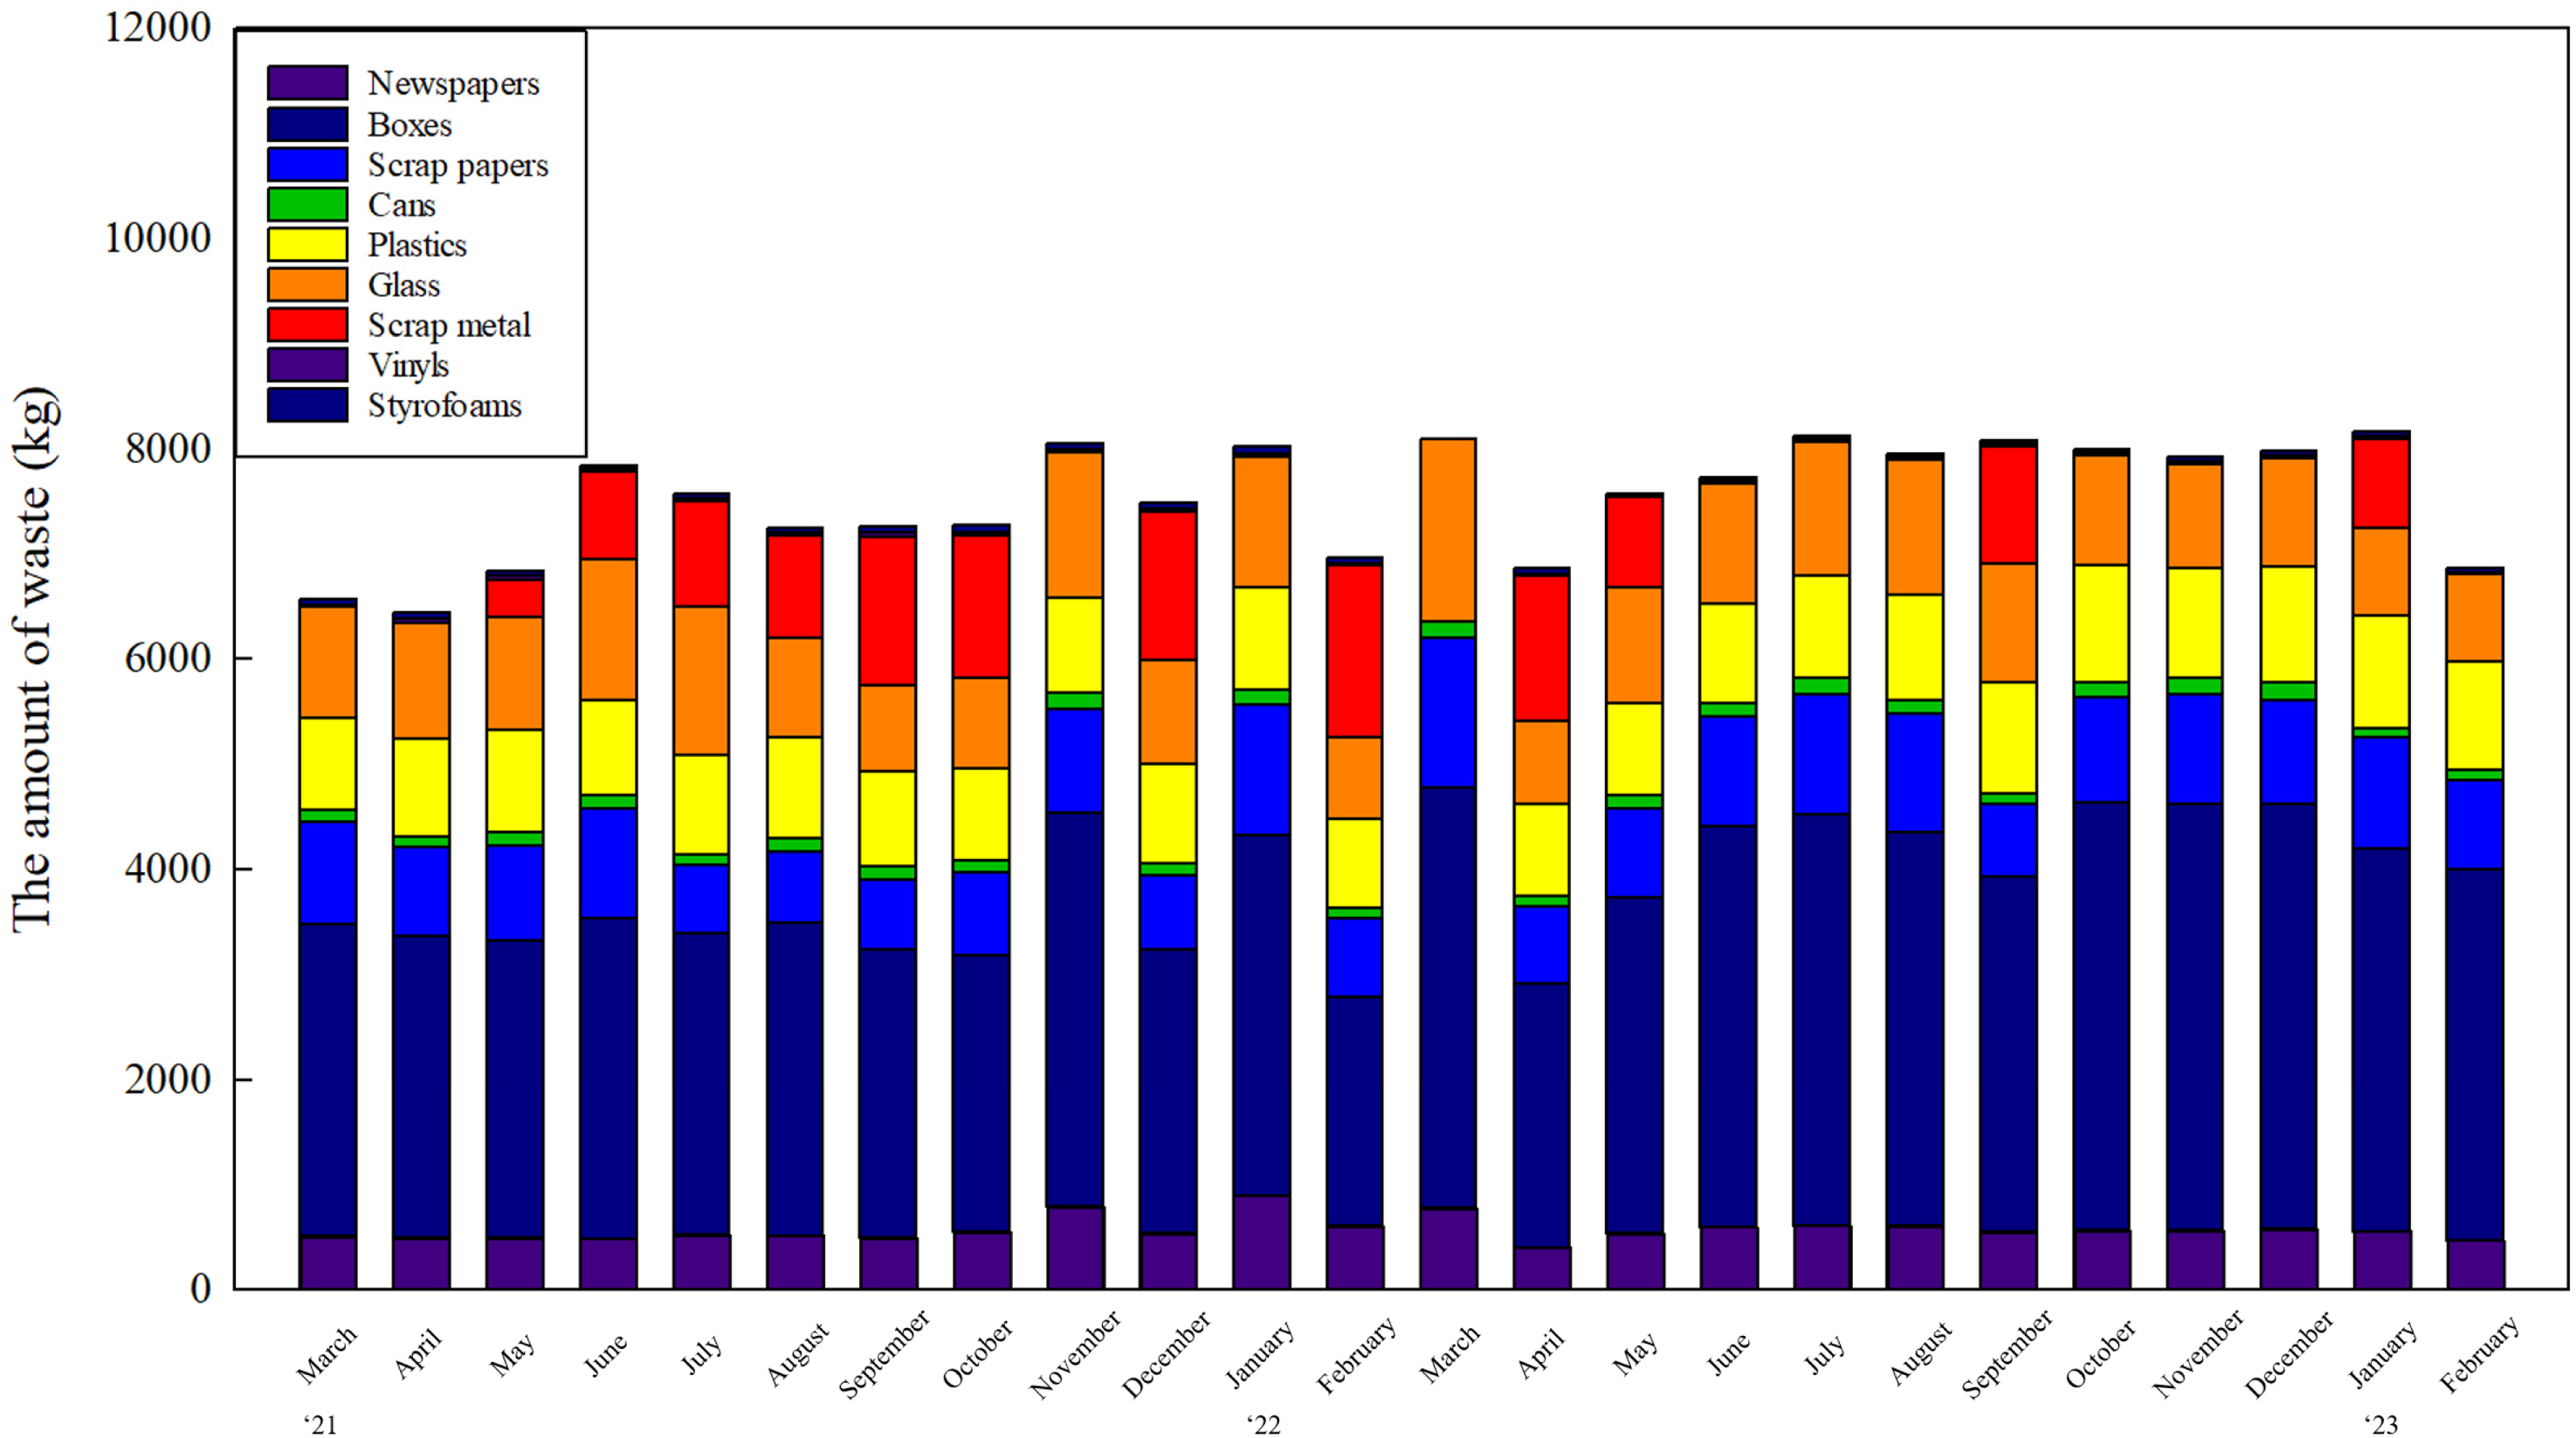
Graph depicting the recyclable waste generated at the University of Seoul between March 2021 to February 2023.
Waste composition analysis
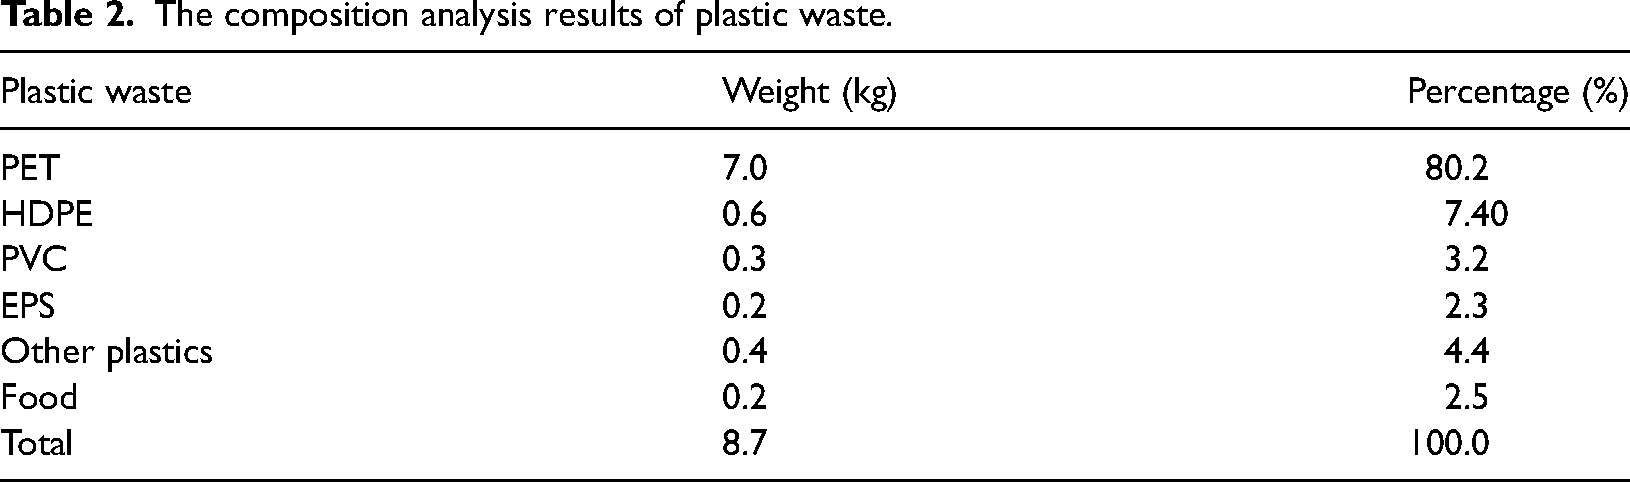
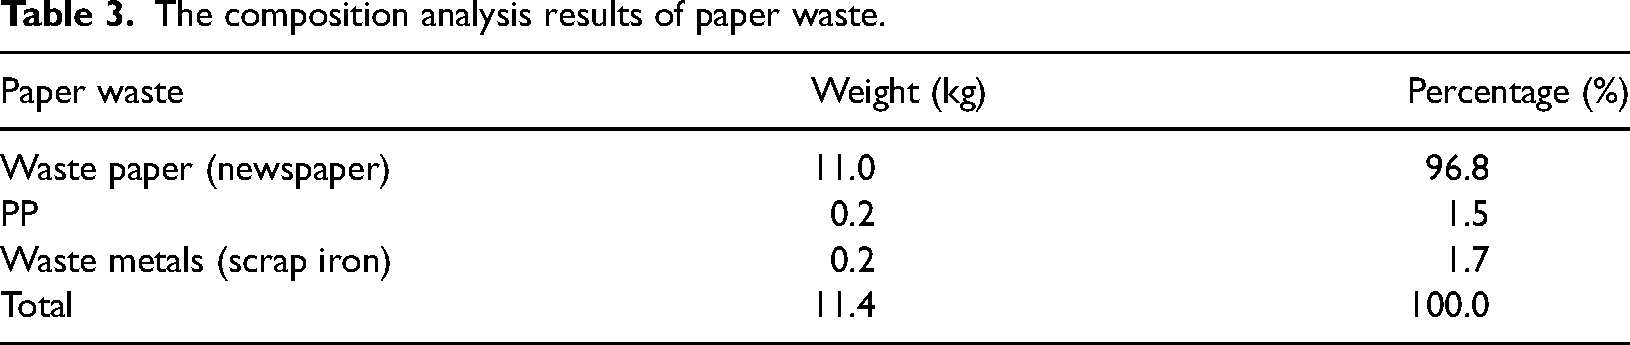
The quantity of waste obtained from the composition analysis was investigated by waste type in Figure 5. The general, plastic, paper, and other waste were 24 kg, 8.68 kg, 11.39 kg, and 4.71 kg, respectively in Table S6. The results of the waste composition analysis are presented in Tables 1, 2, 3, and 4. Among the 24 kg of general waste sampled, ordinary waste which is hardly recycled was 19.46 kg, constituting the largest proportion of the total general waste as shown in Table 1.
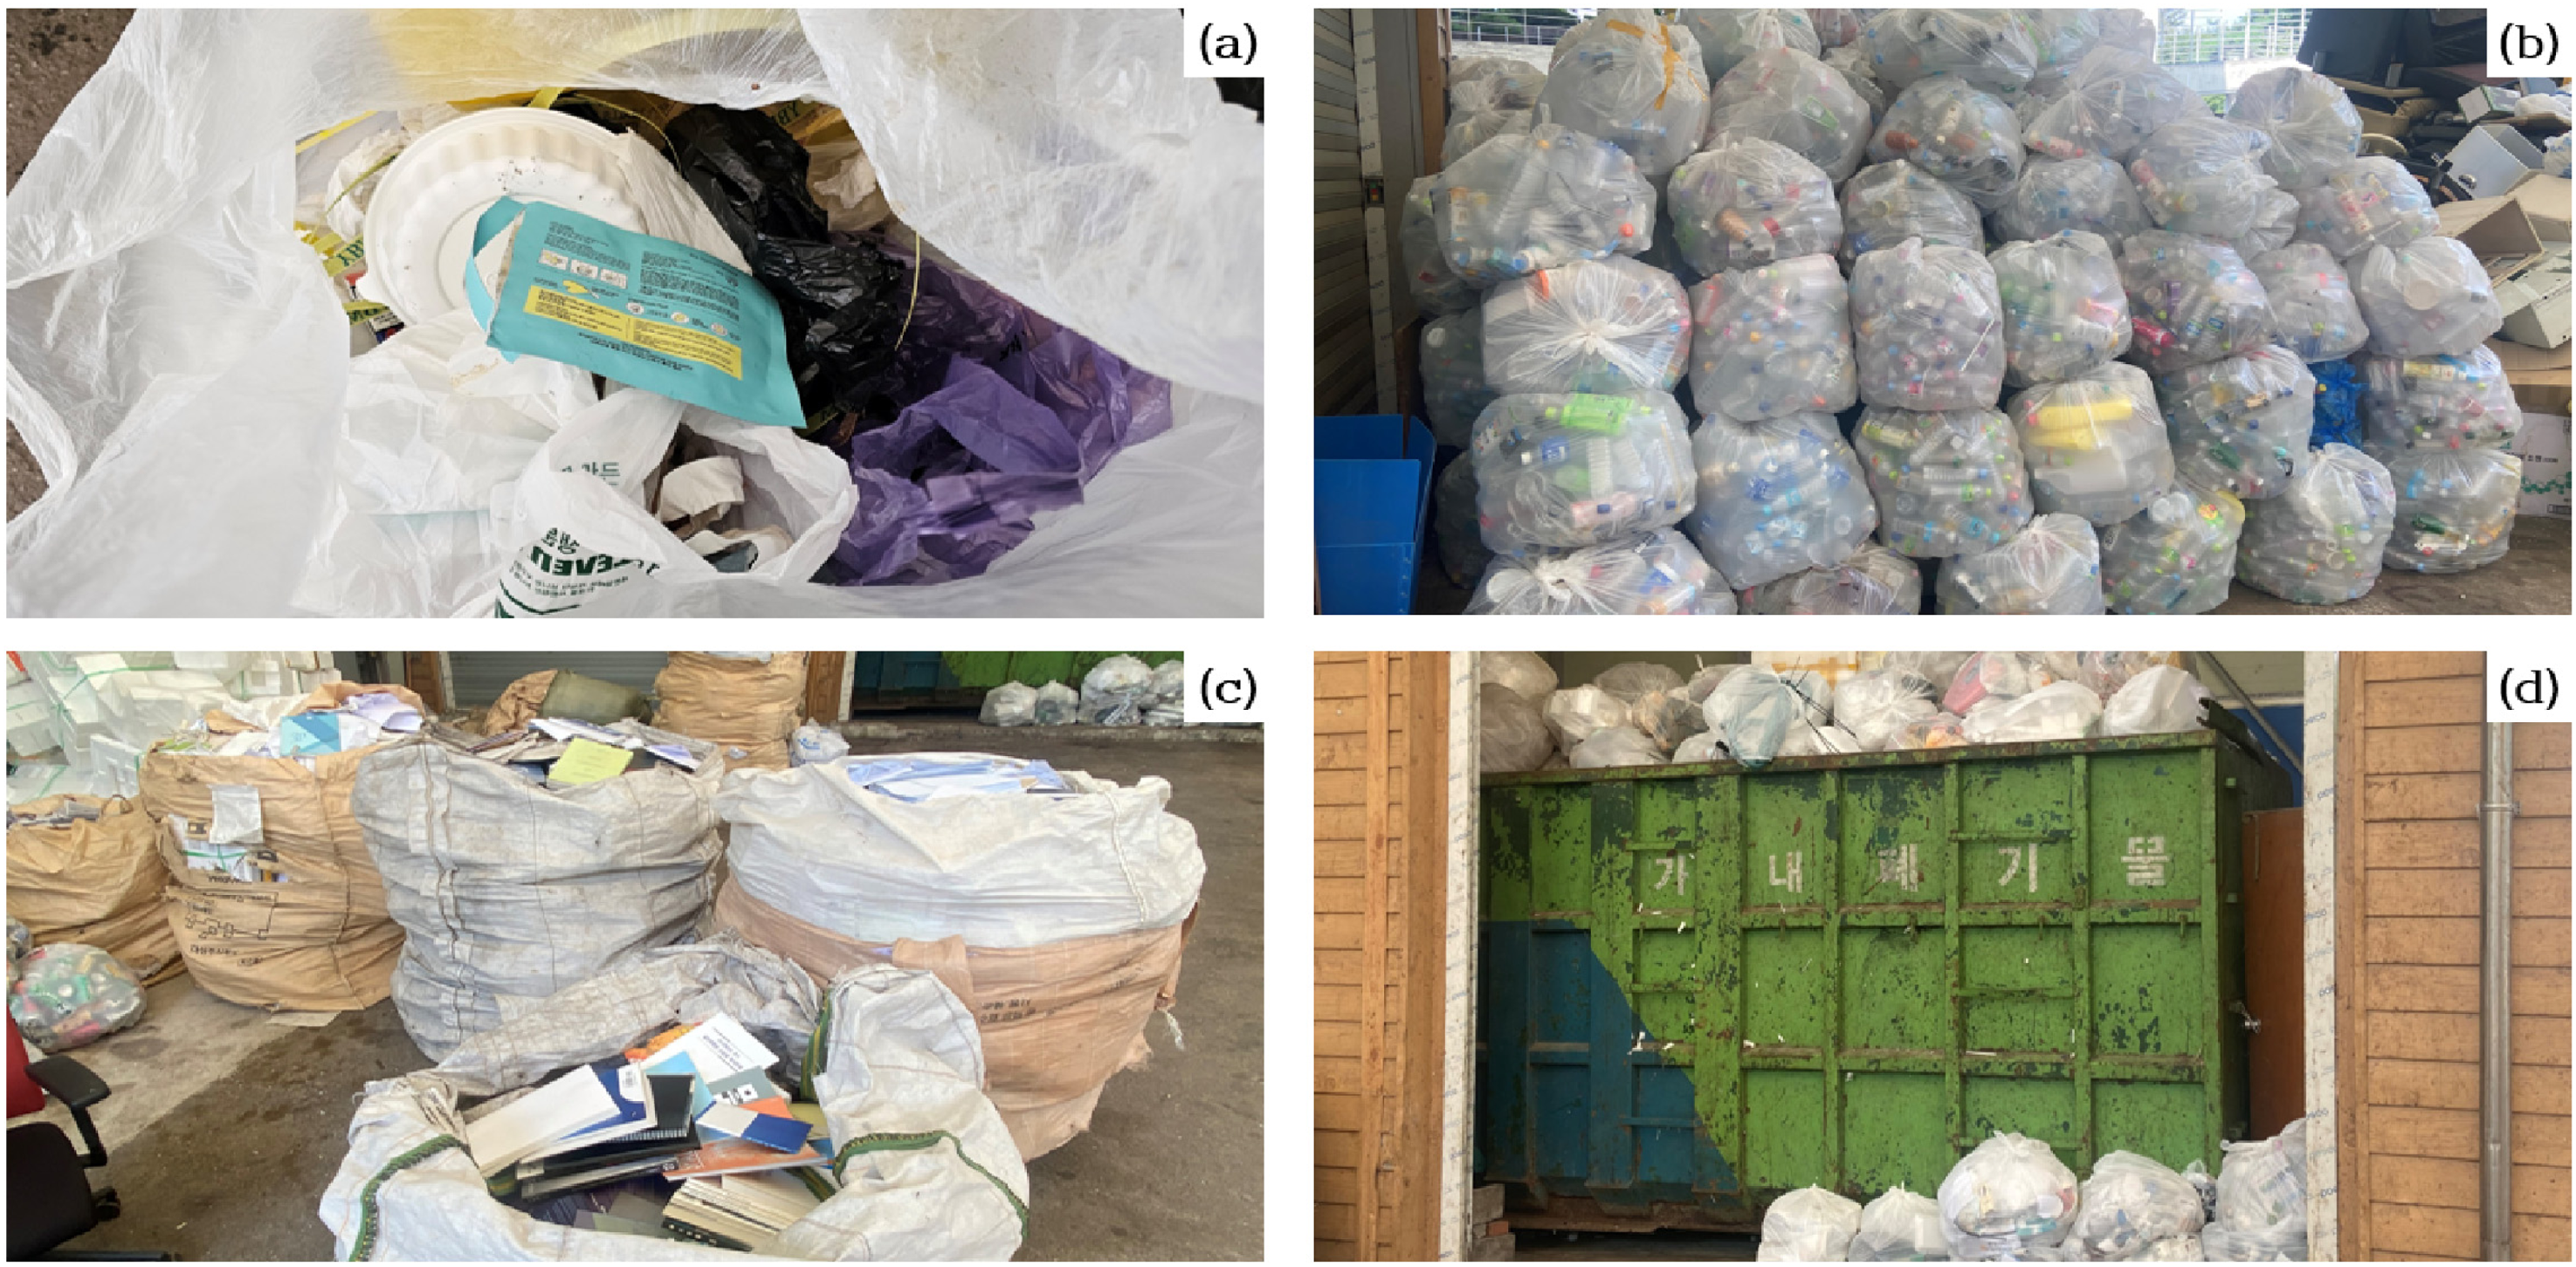
Waste generated at the University of Seoul subjected to investigation. (a) general waste, (b) plastic waste, (c) paper waste, and (d) other waste.
The composition analysis results of general waste.

The composition analysis results of plastic waste.
The composition analysis results of paper waste.
The composition analysis results of other waste.
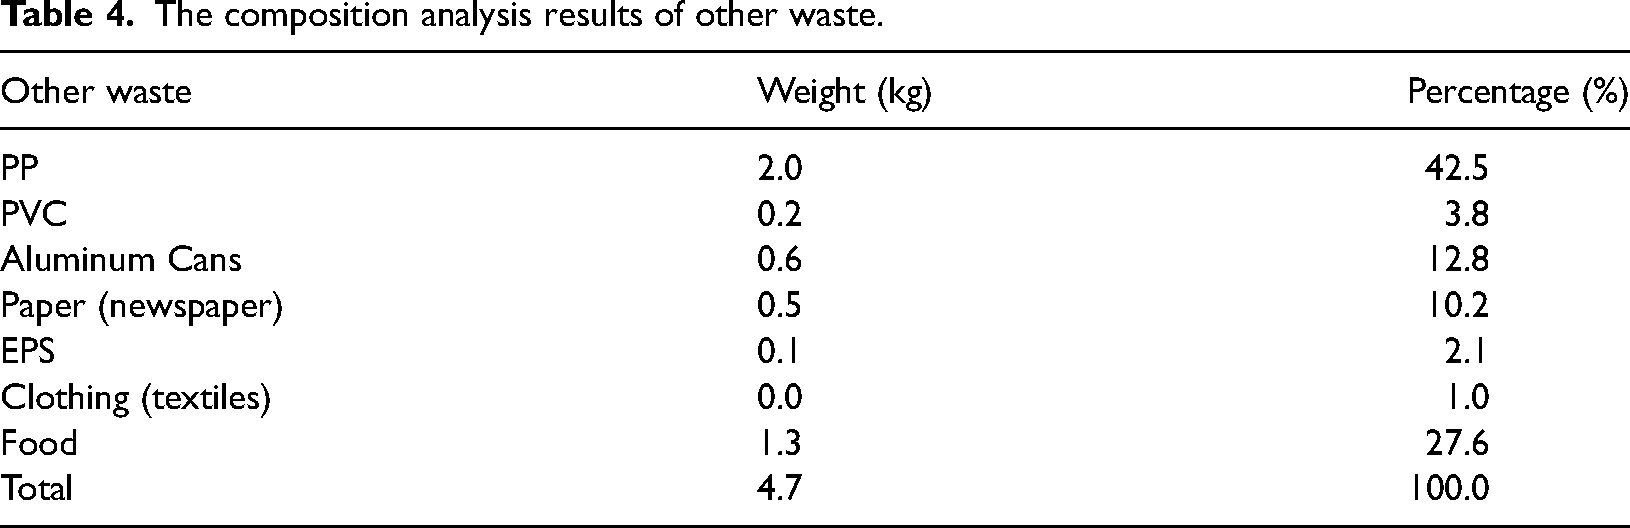
In the 8.68 kg plastic waste sampled, the weight of PET was 6.96 kg, accounting for the largest proportion as shown in Table 2. Plastics were categorized based on the information written on the surface of products and classified according to the common types of plastics used in products. The products corresponding to each material are as follows: PET is primarily used in plastic bottles; HDPE is used for bottle caps and detergent containers; PVC is found in vinyl and coated materials; EPS is used in StyrofoamTM; other plastics refer to mixed plastics that are difficult to identify; and food waste generally refers to food leftovers on plastic surfaces. In the 11.39 kg of paper waste sampled, the weight of the newspaper as the waste paper was 11.02 kg, which accounted for the largest proportion as shown in Table 3. PP and metals were primarily found as materials used in binding rings or the covers of bound books. Among the 4.71 kg of other waste, the weight of PP was 2 kg, comprising the largest proportion as shown in Table 4. In other waste, disposable plastic cups and food packaging were frequently observed and it was assumed that their primary material composition was PP.
The general waste composition analysis for the University of Seoul was compared with the average composition of general waste data from five universities within Seoul in Table 5. 10 While ordinary waste comprised 81.2% of general waste at the University of Seoul, the average proportion of ordinary waste at the five universities was only 69.4%. Compared to other universities, the University of Seoul demonstrated effective sorting of paper and glass waste, though plastic and textile waste were observed at higher than average levels. Consequently, the proportion of recyclable materials mixed within general waste at the University of Seoul was relatively low. This suggests that the recycling process at the University of Seoul has been generally effective. Nevertheless, the recyclable materials in the general waste are not completely separated.
The comparison of the composition of general waste with the five universities in Seoul.
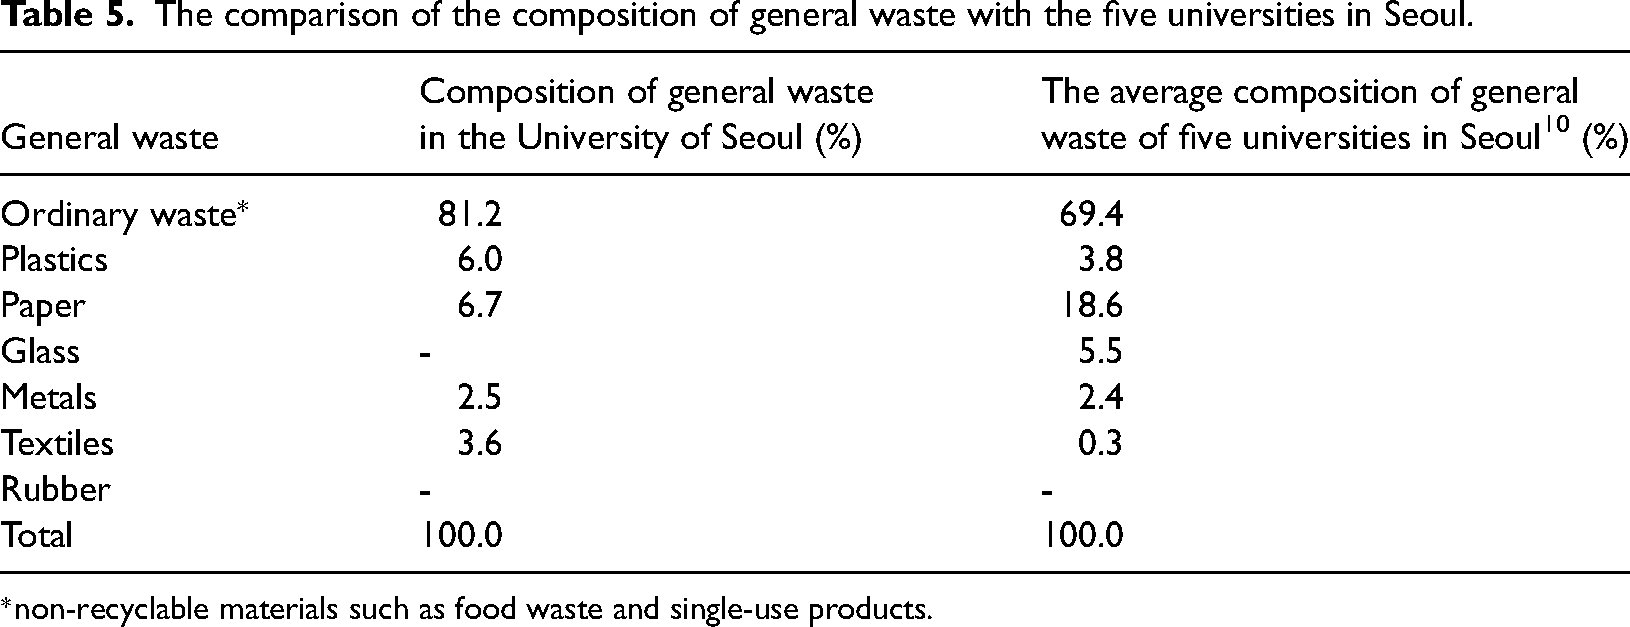
*non-recyclable materials such as food waste and single-use products.
Material price calculation
Raw material price
The price of the raw materials for newspaper as waste paper was determined using the average market transaction price of 1705.1 KRW/kg as provided by the Korea Price Research Center. 18 For cardboard as waste paper, the raw material price was set at the average market transaction price of 693.4 KRW/kg.
Data from BusinessAnalytiq were used for the raw material prices of plastic waste, owing to excessively high market transaction prices. 25 All types of waste glass bottles (clear, brown, and green) were assessed based on the price of the clear glass, which is produced without the addition of Silicon or other metals. The raw material price for the waste glass bottles was calculated at 844.9 KRW/kg.
The price of raw materials for waste metal (iron scrap and iron cans) was set at an average market price of 415.0 KRW/kg. For waste metals (aluminum cans), the raw material price was based on the assumption that aluminum cans primarily consist of aluminum. 26 The London Metal Exchange collected international standard prices of aluminum in 2023. The offer price was 2.1 USD/kg, equivalent to 2904.2 KRW/kg. 19
The price of the raw rubber material is based on the price of natural rubber. According to BusinessAnalytiq, the price of natural rubber is 1.45 USD/kg, which converts to 1896.5 KRW/kg. 25 Regarding textiles, Allied Market Research (2020) identified polyester, nylon, and cotton as the most recycled textiles. 27 Using data from BusinessAnalytiq, the average raw material price for textiles calculated from these three textiles was 1722.7 KRW/kg. 25
Recycled material price
The recycled material prices were as follows: polyester at 1448.1 KRW/kg, nylon at 3321.4 KRW/kg, and cotton at 956.56 KRW/kg. The average recycled material price for textiles was calculated to be 1908.7 KRW/kg. All calculation results for material prices by waste classification are summarized in Table 6.
Material prices by classification of waste.
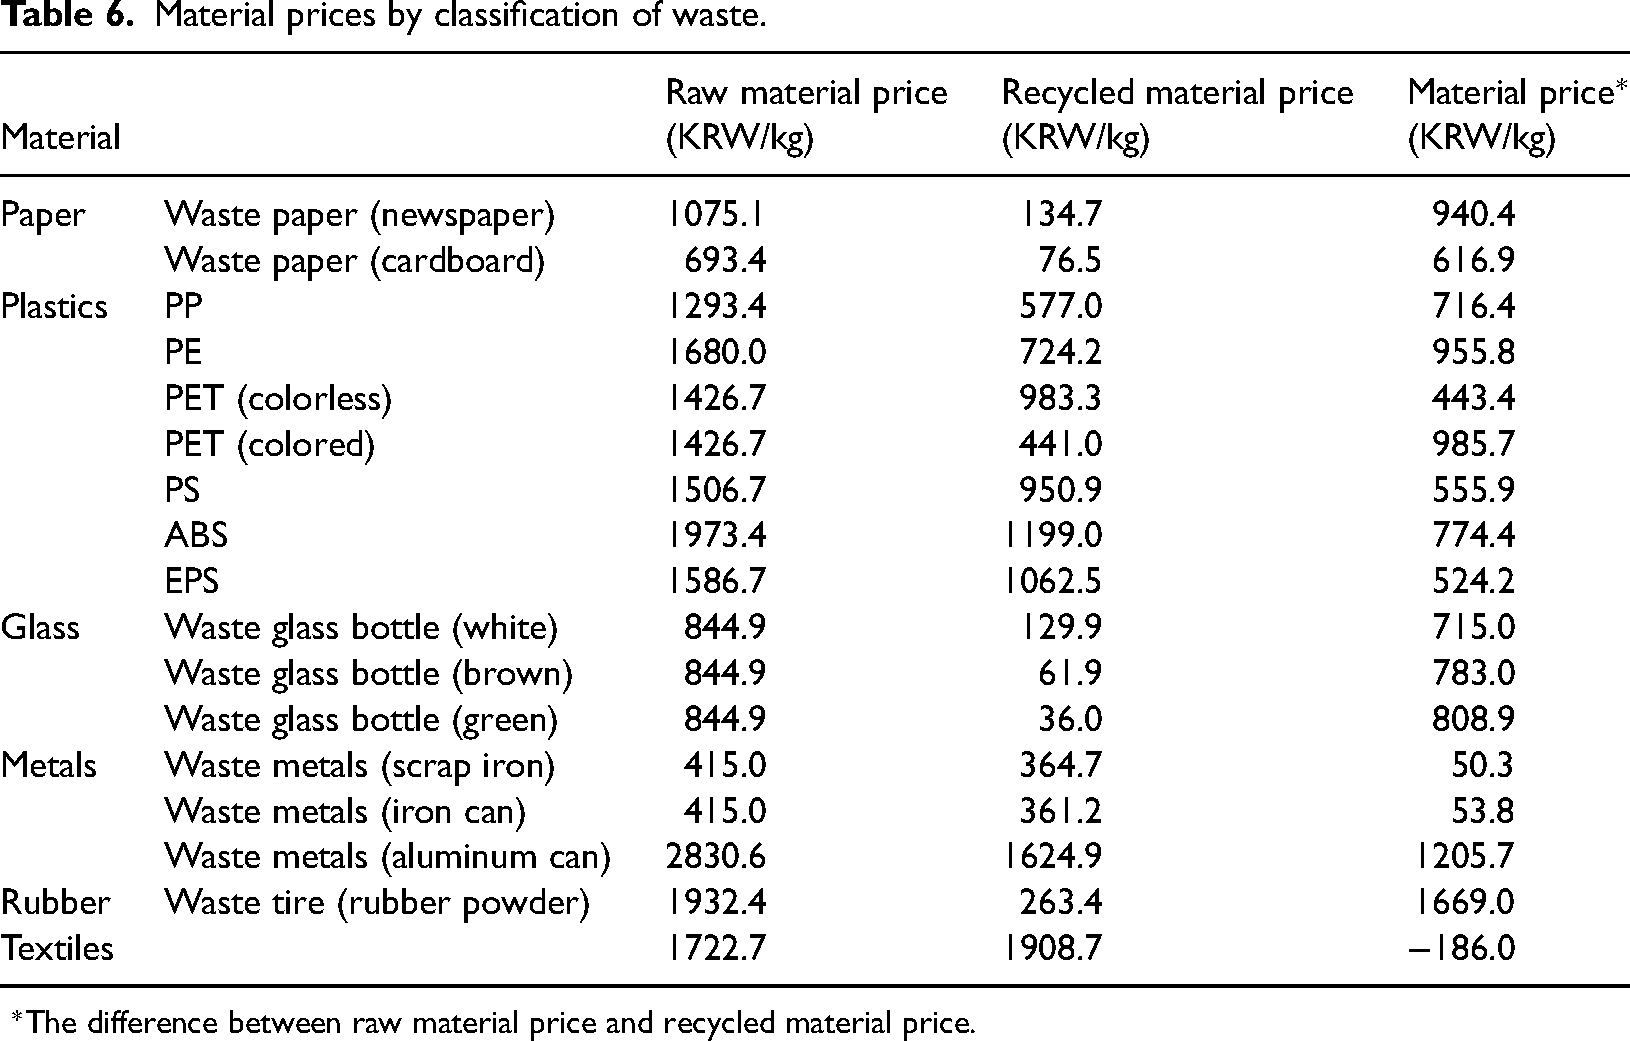
*The difference between raw material price and recycled material price.
The prices of raw and recycled materials can be influenced by market demand, material quality, and other factors, leading to variability in material prices. In particular, market prices for raw materials are highly fluctuating due to imbalances in supply and demand, energy costs, and geopolitical factors. 28 However, with the depletion of natural resources and advancements in recycling technologies, cost savings from recycling are expected to increase. Consequently, the economic value of recycling will be more important in the future.
In this study, it was assumed that all recyclable materials in waste could be sorted and fully recycled. However, not all materials are recyclable in reality, especially those contaminated such as other wastes. The actual recycling rates by material type have not yet been researched deeply. Applying the actual recycling rate by material type will change the price of recycling. For example, when the actual recycling rate of plastic is 60%, the price of general waste in this study decreases to 93.3%. Further studies are needed to determine these recycling rates by material type and to develop policy measures aimed at increasing actual recycling rates.
Environmental price calculation
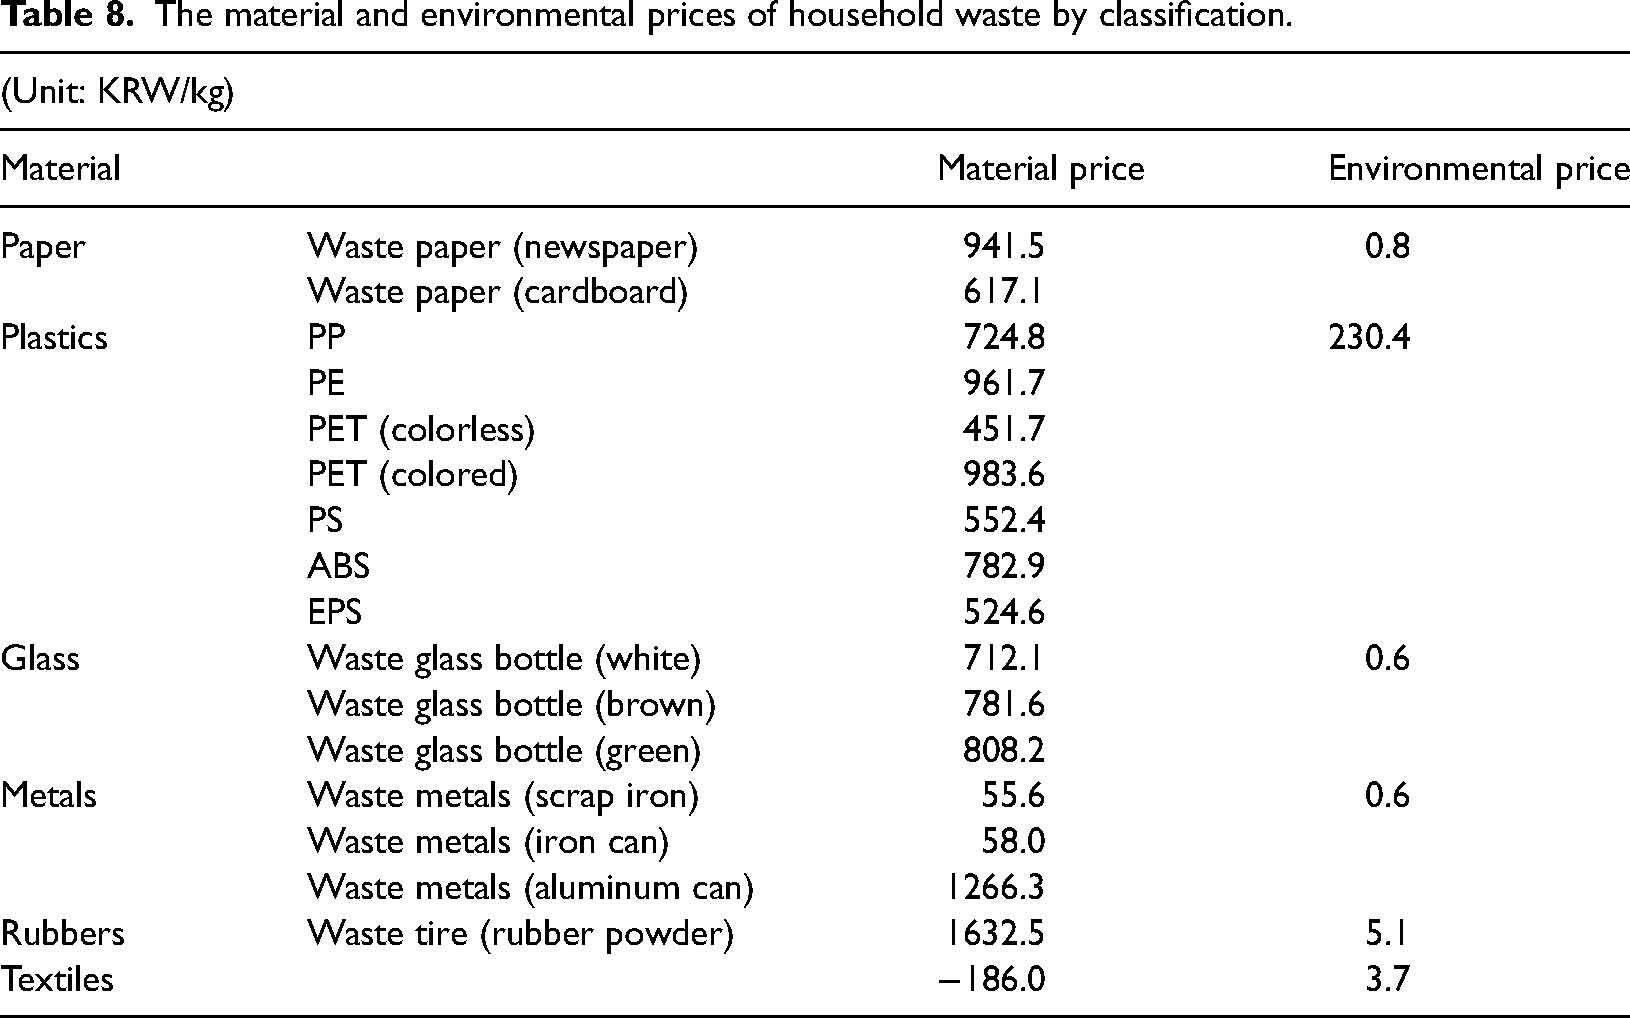
Among the materials, plastics showed the highest value of 0.0028 tCO2eq/kg-Waste, while glass and metals showed the lowest values of 0.000016 tCO2eq/kg-Waste. Using the average carbon price of 17,617 KRW/tCO2eq as reported by the ICAP for the Republic of Korea in 2023, environmental prices were calculated based on CO2 equivalent emissions. Environmental prices were generally much lower than material prices. Specifically, the paper displayed an environmental price of 0.6 KRW/kg, plastics 48.7 KRW/kg, glass and metals 0.3 KRW/kg, rubbers 7.6 KRW/kg, and textiles 5.5 KRW/kg as shown in Table 7. The calculated environmental prices were then added to the material prices to calculate the total prices, as listed in Table 8.
The calculation of the CO2eq and the environmental price.
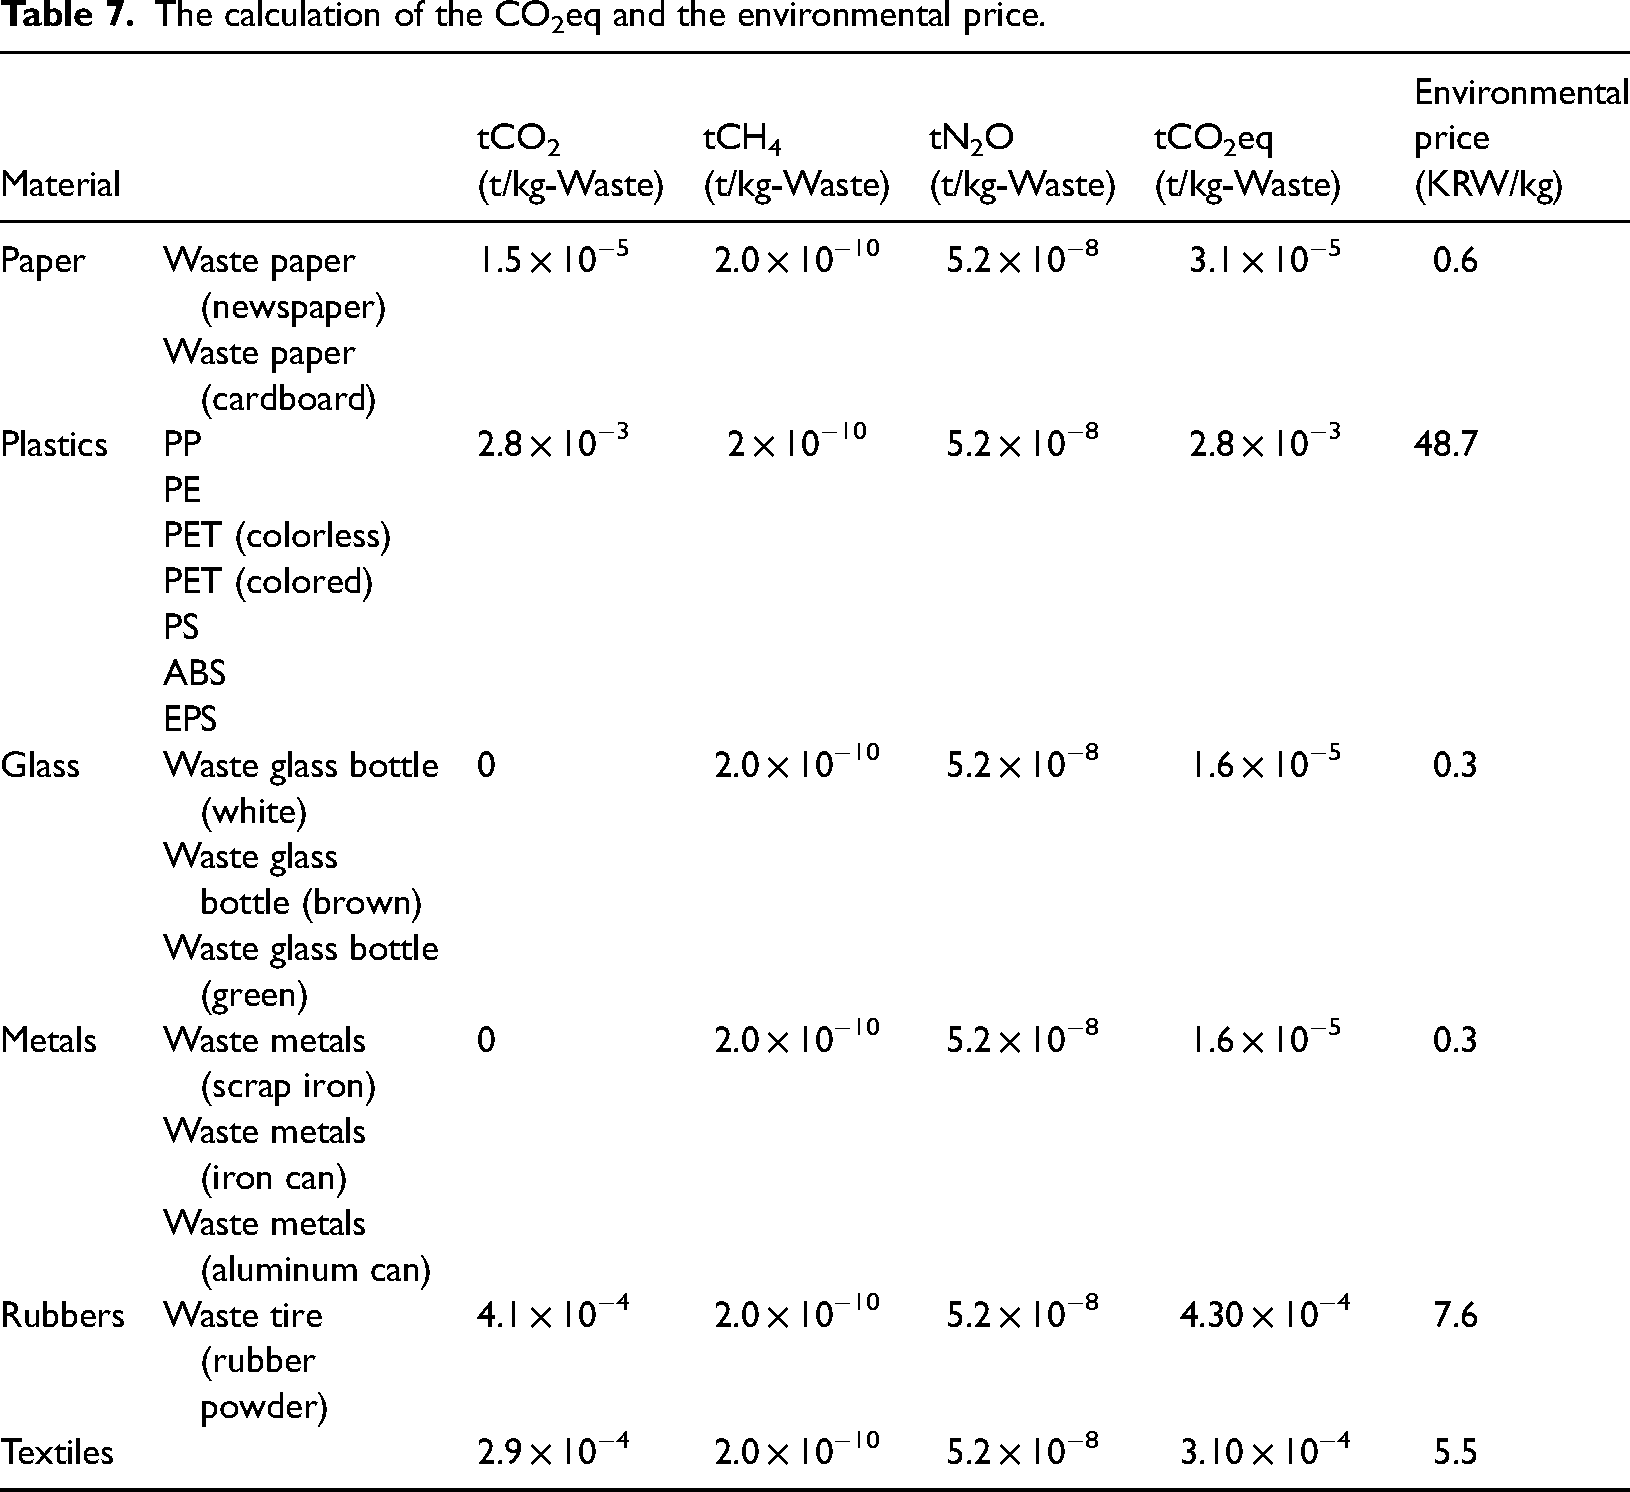
The material and environmental prices of household waste by classification.
Application to waste of the University of Seoul
Assuming that all waste generated at the University of Seoul was converted from incineration to recycling, both material and environmental prices were calculated with various scenarios. Based on the composition analysis shown in Tables S6, 1, 2, 3, and 4, the calculations were done for general waste at 24.0 kg, plastic waste at 8.7 kg, paper waste at 11.4 kg, and other waste at 4.7 kg.
The total price of general waste was 2464.4 KRW. Additionally, the plastic waste displayed a total price of 4204.3 KRW, paper waste 10520.2 KRW, and other waste 2808.4 KRW as shown in Tables 9, S7, S8, and S9. The price per weight of each waste is presented in Table 10. Among the various types of waste, paper waste had the highest value of 922.8 KRW/kg.
The material and environmental prices of general waste generated at the University of Seoul.

The results of calculating the cost per weight of utilizing waste data at the University of Seoul.

We found that approximately 156.29 t of general waste will be generated from March 2022 to February 2023, as shown in Figure 3. If the general waste was perfectly recycled, it could save 16.1 million KRW annually, which is approximately 123,000 USD per year. Also, among the recyclable waste, plastic waste amounted to 110.95 t over the same period, indicating a potential savings of 5.8 million KRW or 44,000 USD per year. Paper waste has the highest price per unit weight and is the most recyclable waste generated, which results in significant savings. Fully recycling paper waste could reduce prices by 57.8 million KRW per year, equivalent to approximately 442,000 USD per year. On the other hand, the other waste did not have any quantitative data; therefore, its data could not be calculated. The calculation results revealed that the University of Seoul could recycle resources worth approximately 79.6 million KRW or 608,000 USD through recycling.


Carbon price scenario application
Despite the goals of global greenhouse gas reduction being raised in 2020 and 2021, causing major carbon prices to increase sharply by two to three times, the domestic carbon price in the Republic of Korea has declined, showing the lowest level among the major ETS. 29
In Scenario 1, the Republic of Korea's carbon price was assumed to be at the international trading price level. Unlike the unstable carbon credit market in the Republic of Korea, the European Union (EU) has achieved price stabilization in its carbon credit market. 30 By 2023, the EU's carbon credit market will account for 87% of the global market. Therefore, we applied the EU's 2023 average carbon credit price, which was 83.5 EUR. 21 This was 118,079 KRW, which is more than six times the average price in the Republic of Korea in 2023, as shown in Fig. S2.
Scenario 2 predicts a future increase in carbon prices. 29 To achieve carbon neutrality by 2050, The Network for Greening the Financial System estimates that the Republic of Korea needs to raise the carbon price from the current 7 USD/t to 150 USD/t by 2030, which is approximately 11 times the current carbon price. 31 By considering these scenarios, we aimed to provide a comprehensive estimate of the economic value of recycling in terms of greenhouse gas reduction under both current and potential future market conditions.
Using the carbon price of the Republic of Korea in 2023, the values ranged from 0.3 KRW/kg to 48.7 KRW/kg, depending on the material. Scenario 1 showed values ranging from 1.9 KRW/kg to 326.4 KRW/kg, and Scenario 2 showed values from 3.2 KRW/kg to 542.3 KRW/kg.
In Scenario 1, the environmental price for general waste, plastic waste, and paper waste generated at the University of Seoul in 2023 increased from 890,600 KRW/year to 6.0 million KRW/year. Therefore, the total price saw a notable increase, rising from 79.6 million KRW/year to 84.6 million KRW/year. This can be represented by an increase from 608,000 USD/year to 647,000 USD/year, a 6.3% increase.
In Scenario 2, the environmental price increased by 11.1 times, reaching 9.9 million KRW/year, and the total price rose to 88.6 million KRW/year. This can be represented by an increase from 608,000 USD/year to 677,000 USD/year, which is an 11.3% increase. This indicates that as carbon prices increase owing to international circumstances, the value of recycling can significantly increase.
The findings of this study could serve as a basis for waste management policies and recycling recommendations. This study discusses a method for calculating the potential carbon emissions that could be reduced through recycling, using statistical surveys and composition analyses of waste generated by regions or institutions. Carbon emissions were calculated by determining CO2, CH4, and N2O emissions from incineration for each waste type and then applying the GWP. However, marginal uncertainties remain in price determinants, such as carbon pricing and the emission trading system. If these factors are adjusted in terms of global standards in the Republic of Korea, the application of this study's results would become more effective. Consequently, it would be possible to quantitatively demonstrate the value of waste recycling in waste management policies and practices.
Conclusion
This study aimed to calculate the revenue obtained from recycling the waste generated at the University of Seoul. Between March 2022 and February 2023, the University of Seoul generated approximately 250 t of household waste. The price of the waste was calculated at approximately 79.6 million KRW/year (608,000 USD/year), including material and environmental prices. When applying the EU carbon price and the 2030 target carbon price, the values were 84.6 million KRW/year (647,000 USD/year) and 88.6 million KRW/year (677,000 USD/year), respectively.
This study has limitations due to the specific waste composition of the University of Seoul, which may not be representative of other institutions, and the potential variability in material market prices. Therefore, further research is necessary to validate the findings in diverse contexts and to refine the economic and environmental models employed in this study. For the practical application of this study, various policies must be implemented, including stricter recycling mandates for academic institutions, incentives for reducing waste generation, and the adoption of carbon pricing mechanisms that reflect the true environmental costs of waste management practices. Further studies could include analyzing various types of waste or extending the research to other institutions. Through such efforts, the long-term economic and environmental impacts of improved recycling programs could be examined, and the effectiveness of waste reduction strategies could be assessed across different institutional settings. The methods and findings of this study could be applied to other universities, cities, or regions to achieve similar environmental and economic benefits. It will be essential to adapt the approach to account for variations in waste composition, local regulations, and market conditions.
Supplemental Material
sj-docx-1-eae-10.1177_0958305X251315404 - Supplemental material for Evaluation of material and environmental price through material recycling of waste collected at the University of Seoul
Supplemental material, sj-docx-1-eae-10.1177_0958305X251315404 for Evaluation of material and environmental price through material recycling of waste collected at the University of Seoul by Tae Hwi An, Chan Young Lee, Ye Eun Kim, Se Yeon An, Ga Eun Yang, Doyeon Lim, Gihyun Jeon and Myung Won Seo in Energy & Environment
Footnotes
Abbreviation
Declaration of conflicting interests
The authors declared no potential conflicts of interest with respect to the research, authorship, and/or publication of this article.
Funding
The authors disclosed receipt of the following financial support for the research, authorship, and/or publication of this article: This work was supported by the Korea Ministry of Environment (YL-WE-22-001), National Research Foundation of Korea (RS-2024-00416414), and Seoul Upcycling Plaza.

Supplemental material
Supplemental material for this article is available online.
References
Supplementary Material
Please find the following supplemental material available below.
For Open Access articles published under a Creative Commons License, all supplemental material carries the same license as the article it is associated with.
For non-Open Access articles published, all supplemental material carries a non-exclusive license, and permission requests for re-use of supplemental material or any part of supplemental material shall be sent directly to the copyright owner as specified in the copyright notice associated with the article.
