
Abstract
Climate change mitigation in small, resource-intensive economies remains a significant policy challenge, especially where financial systems, technological innovation, and energy transitions are not fully aligned. This study addresses this gap by investigating the dynamic interrelationships between financial development (FD), renewable energy consumption (REC), environmental-related technologies (ERTs), and energy efficiency (measured through coal and gas efficiency) in shaping greenhouse gas (GHG) emissions in Iceland a country with near-total renewable electricity generation but persistent sectoral emissions. Using a triangulated econometric approach including Kernel-Based Regularized Least Squares, Fully Modified Ordinary Least Squares, Dynamic Ordinary Least Squares, and frequency domain Granger causality analysis the study captures both non-linear interactions and short- vs long-term causal dynamics. Results reveal that while REC has a statistically significant negative effect on GHG emissions, the environmental effectiveness of FD and ERT depends on the regulatory environment and sectoral application. Notably, the frequency domain analysis shows that REC and ERT exert stronger long-term causal effects on emission reduction, while FD's impact is more pronounced in the short run and context-dependent. This research contributes to the literature by integrating financial, technological, and energy efficiency dimensions within a unified empirical framework tailored to the institutional characteristics of small economies. The findings suggest that decarbonization policies must go beyond energy supply transformation to include financial mobilization strategies, sector-specific regulatory incentives, and sustained investment in enabling infrastructure such as smart grids and storage. For policymakers, the results underscore the importance of aligning green finance mechanisms with targeted technological deployment to ensure comprehensive and equitable emissions reduction.
Keywords
Introduction
Climate change poses an existential risk to ecological systems, human welfare, and global economic stability. While advanced economies have made notable strides in decarbonizing electricity generation, the efficacy of broader systemic transitions particularly in financial flows, technological diffusion, and cross-sectoral energy efficiency remains contested within both academic and policy arenas. 1 A growing body of literature argues that carbon neutrality is unattainable without the active engagement of financial institutions, environmental innovation systems, and coherent fiscal governance. 2 However, existing frameworks often overlook the differentiated capacities of small open economies with limited diversification and high-resource dependency.
This study contributes to that debate by asserting that financial development (FD), when strategically aligned with environmental-related technologies (ERTs) and renewable energy consumption (REC), can produce synergistic outcomes that significantly reduce greenhouse gas (GHG) emissions. Yet, such outcomes are highly path-dependent contingent on a country's institutional strength, sectoral mix, and macroeconomic stability. Without tailored fiscal frameworks, sustainable finance mechanisms, and regulatory innovation, the climate-finance-technology nexus risks remaining aspirational rather than actionable.
Iceland provides a compelling empirical laboratory to explore this nexus. As a high-income, resource-abundant Nordic country with a population of just 375,000, Iceland's GDP stood at approximately $29 billion in 2023 (World Bank, 2024),3,4 with key contributions from tourism (8.4%), aluminum smelting (13.5% of exports), and fisheries (6.8%). The country boasts a nearly carbon-free electricity system powered 73% by hydropower and 27% by geothermal but still grapples with persistent GHG emissions in transportation, marine logistics, and aviation. Emissions from these fossil fuel-reliant sectors accounted for over 40% of national GHGs in 2022, with road transport alone rising by 20% since 2010 despite electric vehicle subsidies. 5 While Iceland is lauded for its renewable leadership, a closer analysis reveals a critical policy gap: the disconnect between clean electricity generation and carbon-intensive consumption patterns across downstream sectors.6,7 Fiscal rigidity, dependence on volatile aluminum exports, and constrained institutional capacity for implementing environmental taxes limit the government's ability to scale up climate mitigation policies. Iceland's environmental paradox exemplified by high per capita energy consumption despite renewables raises important theoretical and empirical questions about the coherence of sustainable transitions in small economies. 6
Most existing studies7–11 treat FD, REC, ERT, and energy efficiency (measured via coal and gas efficiency factor (GASEF) indicators) as discrete explanatory factors. However, such atomized approaches fail to capture the interactive mechanisms through which financial infrastructure supports the deployment of green technologies and sectoral decarbonization.12,13 Furthermore, little attention has been paid to time-variant dynamics for instance, how short run shocks (e.g. tourism collapses, energy price volatility) versus long-run investments (e.g. in carbon capture and storage (CCS) or grid modernization) shape the emissions trajectory in small, export-led economies. 14
This study challenges these methodological and theoretical gaps. It contends that effective GHG reduction in economies like Iceland requires an integrated strategy where financial systems are mobilized to internalize environmental externalities, reduce adjustment costs for firms, and facilitate intertemporal alignment between innovation and regulation. Iceland's case further highlights the importance of customizing environmental governance strategies to contexts characterized by scale vulnerability, narrow export bases, and concentrated industrial structures. 15
Theoretically, this study draws from ecological modernization theory which posits that environmental improvement and economic development can be mutually reinforcing through institutional innovation and sustainable finance paradigms, which emphasize the redirection of capital toward low-carbon technologies. However, the Icelandic case complicates this optimistic framing. 16 The small size of its financial sector (with total bank assets representing 120% of GDP compared to over 300% in Norway) limits its capacity to independently drive systemic green investment. Furthermore, Iceland's fiscal policy constrained by low-tax revenues relative to GDP (36%, vs. Nordic average of 42%) offers limited space for large-scale green subsidies or infrastructure upgrades without risking debt sustainability.17–19
Against this backdrop, this study proposes a nuanced theoretical argument: Only when FD is institutionally embedded and fiscally reinforced can it become a meaningful lever for environmental transformation particularly in small economies facing sectoral rigidity and constrained diversification.
To empirically validate this claim, the paper applies a triangulated methodology: Kernel-Based Regularized Least Squares (KRLS) to capture non-linear interactions and heterogeneous marginal effects; Fully Modified Ordinary Least Squares (FMOLS) and Dynamic Ordinary Least Squares (DOLS) to model long-run cointegrated relationships; and frequency domain causality analysis to distinguish short-term shocks from long-term drivers. The integrated empirical model is guided by a conceptual framework (Figure 1) that maps how FD influences REC, ERT, and sectoral efficiency, which in turn affect GHG emissions. The framework also acknowledges moderating factors such as fiscal stance, regulatory alignment, and innovation capacity.
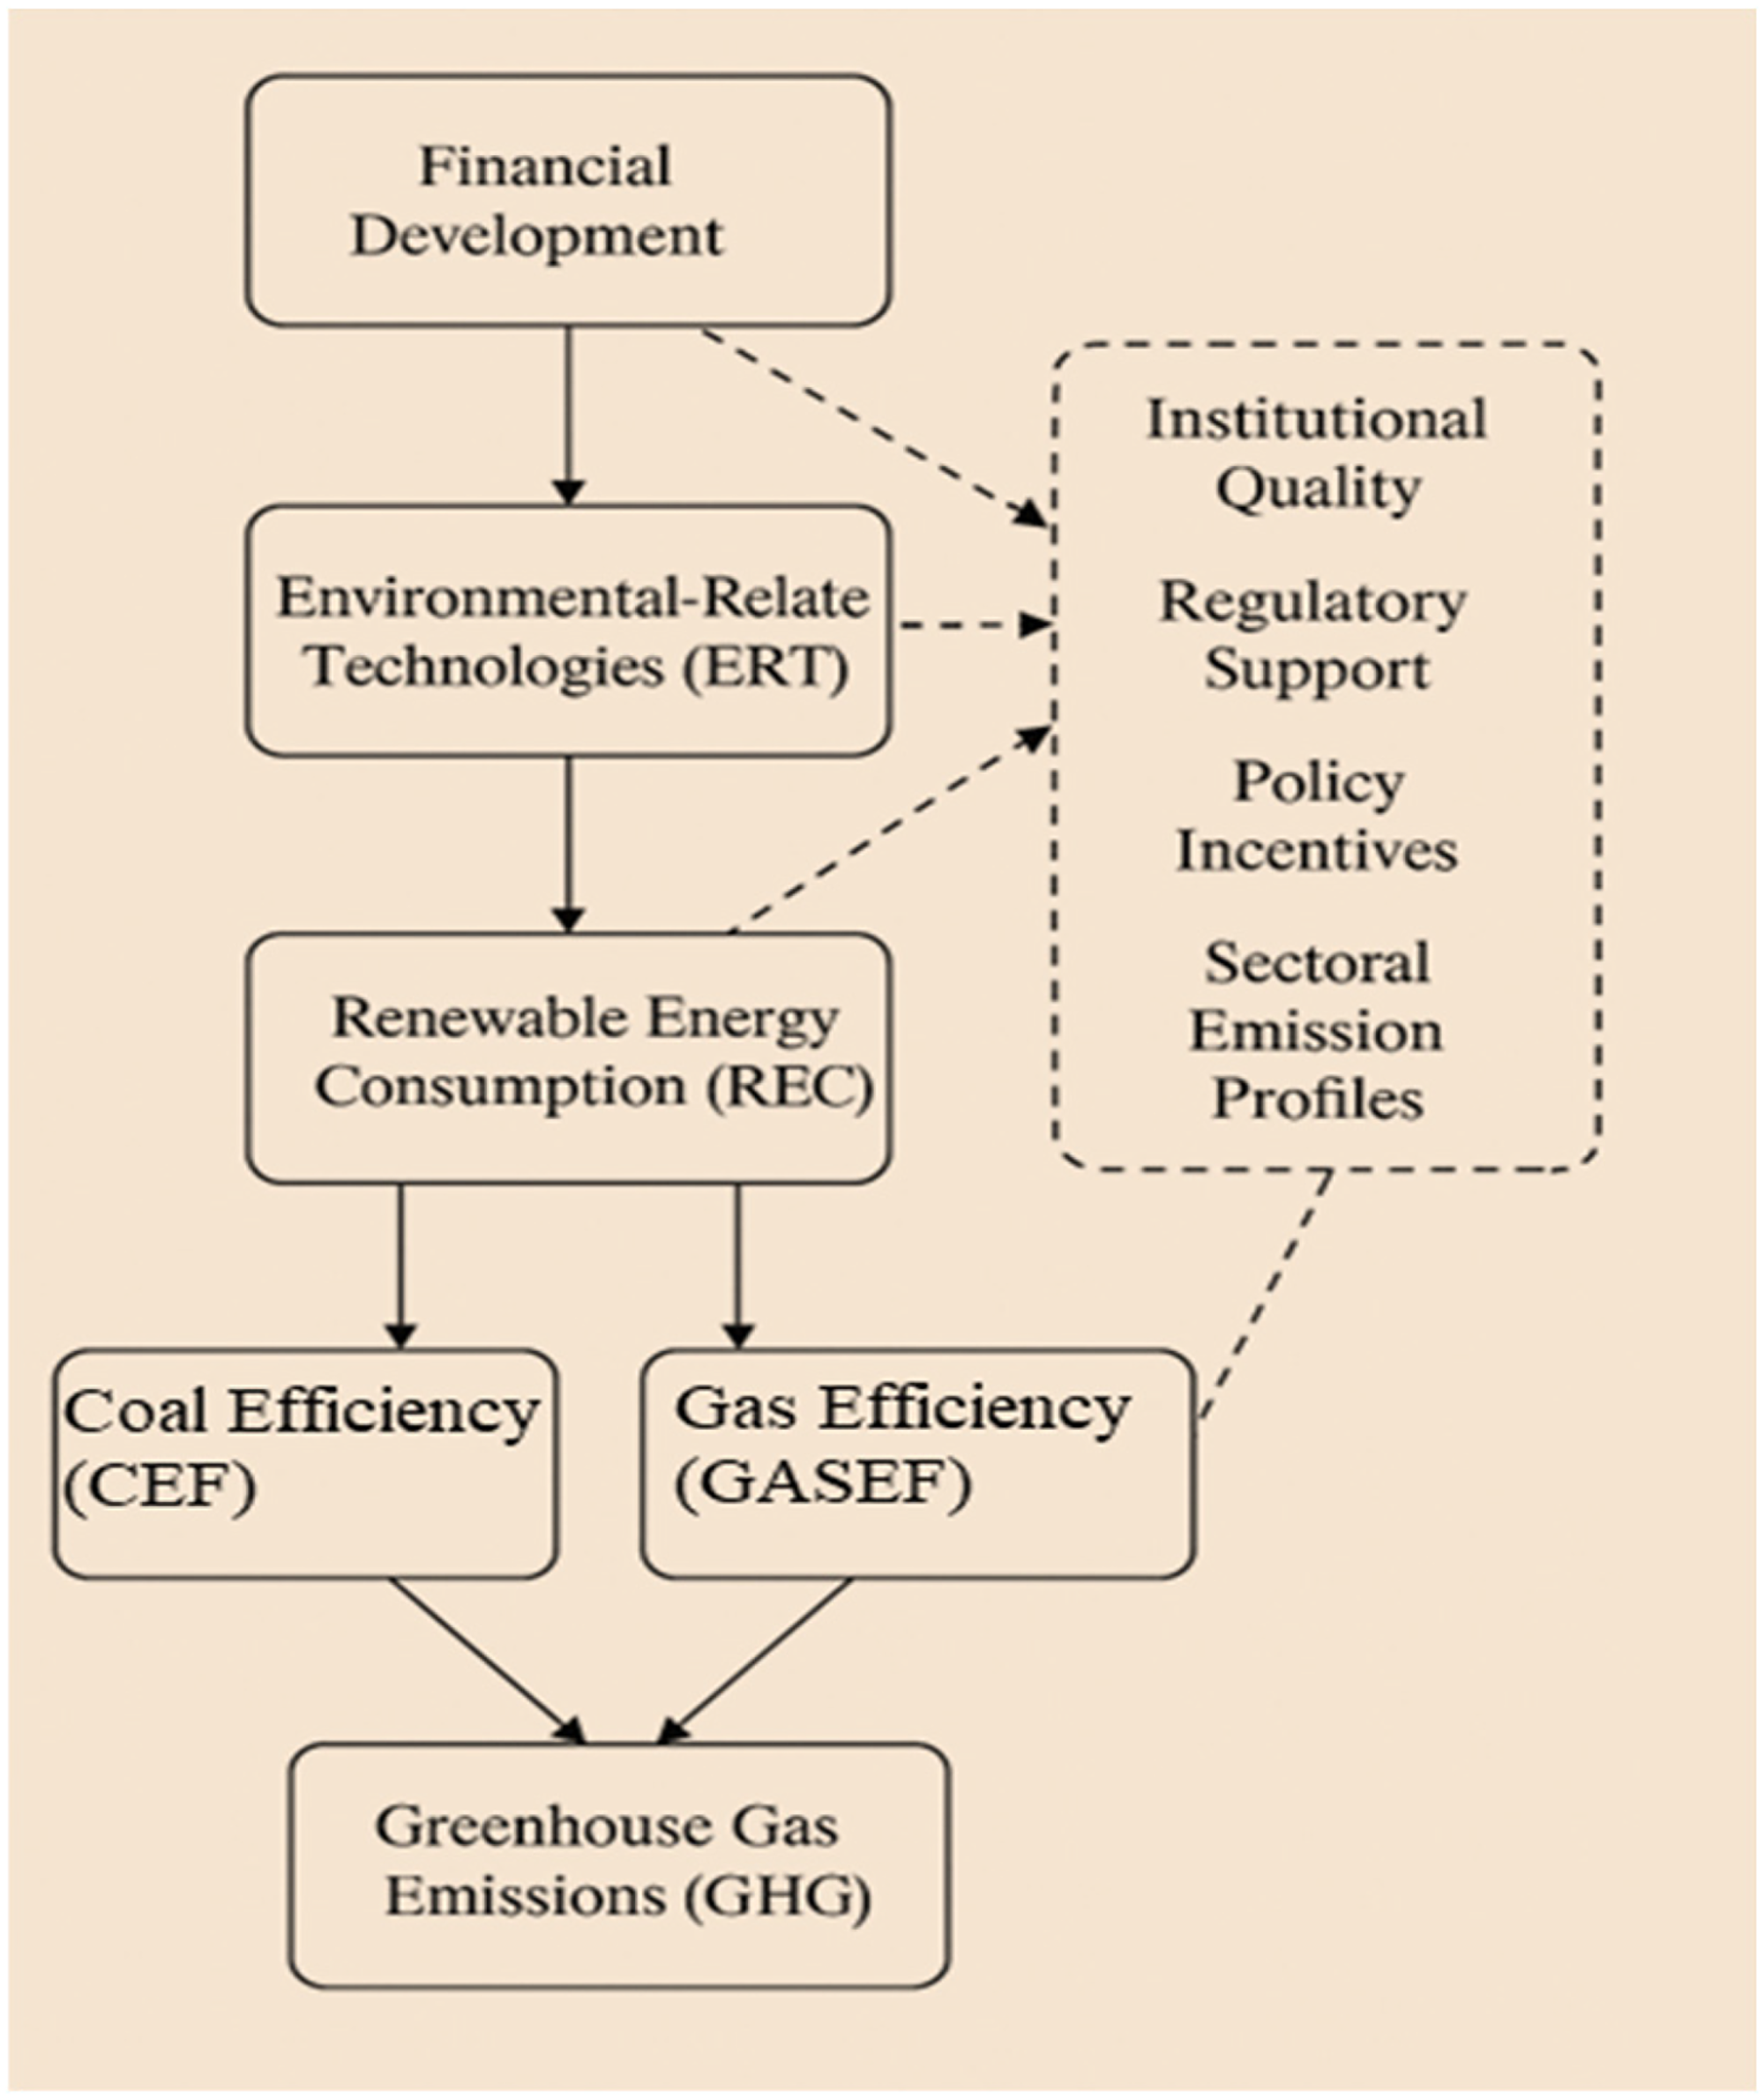
Conceptual framework.
This approach allows for a more comprehensive assessment of whether Iceland's climate-finance-technology nexus is functioning as a coherent system or whether it remains fragmented, with sectoral silos undermining long-term emissions reductions. The findings have broader relevance for similarly structured economies (e.g. Finland, Newzealand, Ireland),20,21 where decarbonization pathways must navigate small domestic markets, fiscal constraints, and high environmental exposure.
The manuscript is structured as follows: Literature review Section analyzes published sources before Material and methods Section demonstrates data selection along with empirical methodology. This section presents the research findings together with their comparison against previously published work. Policy implications and Conclusions and recommendation Sections of this investigation offers a summary that combines essential findings and implications together with policy guidelines.
Literature review
Addressing GHG emissions amid accelerating climate threats demands not only a reassessment of individual policy levers such as FD, REC, and ERTs but a deeper exploration of how these mechanisms interact in context-specific and systemic ways. The dominant body of empirical research has largely approached these variables in isolation, emphasizing their unidirectional effects on environmental outcomes. Yet, in the context of complex and evolving policy environments particularly in small, resource-rich economies like Iceland, there is an urgent need to theorize and empirically examine their synergistic, moderating, and possibly offsetting dynamics. This literature review thus goes beyond mere aggregation of findings: it synthesizes competing perspectives, engages with ongoing academic debates, and explains how the design of this study explicitly responds to enduring gaps and contradictions in the field.
While previous studies20–24 in small or advanced economies such as Norway, Finland, and Denmark have explored the links between FD, renewable energy adoption, and GHG emissions, they often focus on countries with significantly different institutional, industrial, and energy-sector configurations compared to Iceland. For instance, Norway's emissions are heavily influenced by its oil and gas exports, while Finland's energy system relies more on biomass and nuclear power. 25 These structural differences limit the generalizability of their findings to Iceland, which has a unique energy profile dominated by geothermal and hydropower and a relatively small, open economy with limited industrial emissions but growing concerns in transportation and tourism-related sectors. Moreover, most existing studies in these countries adopt linear or parametric estimation techniques, which may overlook the non-linear and context-dependent interactions among financial, technological, and regulatory variables. By integrating non-parametric KRLS with FMOLS and DOLS estimators and applying frequency domain causality analysis, this study captures both short- and long-term causal structures and allows for heterogeneous effects across Iceland's distinct policy and economic landscape. In doing so, it fills a critical gap by offering a context-sensitive, methodologically advanced, and policy-relevant analysis tailored to Iceland's specific sustainability challenges.
Theoretical perspective
Conventional environmental economics has long operated on the tension between economic expansion and ecological limits, often captured by the Environmental Kuznets Curve hypothesis. However, recent scholarship has increasingly challenged this simplistic view, arguing for a systems-oriented framework where financial systems, technological innovation, and institutional quality dynamically shape environmental performance.26,27 In this regard, FD is not an exogenous growth factor but a structuring force that determines the types of investments, technologies, and industrial practices that take root. Likewise, energy transition policies are embedded within regulatory ecosystems that vary in ambition and enforcement. Thus, this study adopts a multi-actor, multi-channel framework, theorizing that the effectiveness of any single variable (e.g. REC or ERT) is conditioned by the presence and design of others (e.g. FD and policy instruments). This relational perspective directly informs the construction of our empirical models (M2–M6), which are designed to test both direct and interaction effects under complex policy feedbacks.
Financial development and emissions
The literature on FD and GHG emissions reveals a conceptual bifurcation. On one side, proponents argue that FD enables decarbonization by enhancing capital allocation efficiency, reducing financing constraints for clean energy projects, and stimulating innovation through green bonds and ESG instruments.28,29 On the other, critics caution that unchecked financial expansion may exacerbate emissions by fueling consumption, industrial production, and fossil fuel investments especially in the absence of green regulation. 30 This duality underscores the contingency of FD's environmental impact on the regulatory environment, market maturity, and the nature of financial instruments available. Yet empirical studies have not consistently captured this complexity, often using linear models that mask heterogeneity across contexts and time horizons. By incorporating KRLS and frequency domain causality analysis, our study moves beyond average effects to explore how the marginal impact of FD varies depending on the level of REC, ERT, and energy efficiency a significant methodological advancement.
Renewable energy
While REC is widely heralded as a cornerstone of climate mitigation, the effectiveness of REC in lowering emissions is far from uniform. Although studies confirm a negative correlation between REC and emissions in many OECD countries,31,32 others have noted diminishing returns, rebound effects, or infrastructural constraints that reduce REC's overall effectiveness. 33 In particular, the integration of renewables into fossil-dominant grids without simultaneous improvements in grid stability, energy storage, and transport sector decarbonization may lead to suboptimal results. This literature suggests that REC's success is conditional on financial flows, policy support, and technological readiness an insight we embed directly in our modeling strategy by testing REC's impact under different levels of FD and ERT. In doing so, we reject the overly linear and deterministic treatment of REC common in the literature and instead emphasize policy complementarities as the true driver of emission outcomes.
Coal and gas efficiency
Energy efficiency improvements in coal and gas systems often framed as pragmatic, transitional strategies have sparked intense scholarly debate. Advocates highlight that higher fuel efficiency can significantly reduce emissions per unit of output, 34 particularly in developing countries or sectors where rapid decarbonization is infeasible. However, critics argue that such gains may be offset by lock-in effects, delaying the transition to zero-carbon alternatives and perpetuating dependency on fossil infrastructure. 35 Moreover, efficiency improvements can trigger the Jevons Paradox, whereby cost savings from efficiency stimulate increased usage. This ambivalence is particularly salient in Iceland, where transportation and shipping sectors still rely on fossil inputs despite a renewable-heavy power sector. Our inclusion of coal efficiency factor (CEF) and GASEF in the higher order models (M5–M6) allows us to empirically assess whether such efficiency gains contribute to sustained reductions or merely reflect short-term technical fixes.
Environmental technologies
ERTs ranging from smart grids and carbon capture to clean production methods are often positioned as game-changers in climate policy discourse. Yet, their real-world impact remains constrained by diffusion lags, high upfront costs, and institutional inertia. 36 Moreover, existing studies often treat ERT as a monolithic category, overlooking differences in readiness level, sectoral applicability, and dependence on financial markets. For example, the impact of grid-level digitalization differs substantially from that of industrial CCS in both scale and cost. This underscores the need for disaggregated, policy-sensitive modeling of ERT effects. Our model captures ERT's contribution while also testing how FD and REC may condition its effectiveness, thereby moving toward a more holistic understanding of climate technology deployment under financial and institutional constraints.
Despite considerable progress in understanding the determinants of GHG emissions, most existing studies continue to suffer from fragmented conceptualizations and oversimplified empirical designs. Few explicitly model the multi-level interactions between financial structures, energy systems, and technological innovation. Even fewer apply flexible estimation techniques capable of capturing non-linear dynamics, threshold effects, or frequency-specific causalities. Moreover, the literature remains biased toward large, industrialized economies, with little attention paid to small, resource-rich nations like Iceland, where the policy and energy context is qualitatively different. By employing an integrated framework combining KRLS, FMOLS, DOLS, and frequency domain causality and testing a series of nested models (M2–M6), this study directly addresses these gaps. It contributes novel insights into how financial and technological systems must co-evolve to achieve ambitious environmental goals, offering evidence-based guidance for policy integration and climate-finance design.
Material and methods
Variables description and data sources
This study investigates the impact of GHG emission control on FD using annual time-series data for Iceland from 1990 to 2021, GHGs as the dependent variable. The analysis seeks to understand how various economic and financial factors influence GHG emissions over time. FD, measured by domestic credit to the private sector by banks as a percentage of GDP, while the explanatory variables include ERTs, measured by patents in ERTs as a percentage of total patents 37 ; CEF, calculated as GDP, PPP (constant 2017 international $) per unit of coal energy (Author's calculation); REC, measured as per capita in kWh 4 ; GASEF, calculated as GDP, PPP (constant 2017 international $) per unit of gas energy (Author's calculation); and GHG emissions, measured per capita in CO2 equivalent. 38 The data sources and their descriptions are summarized in Table 1 below.
Variables sources and measurement.
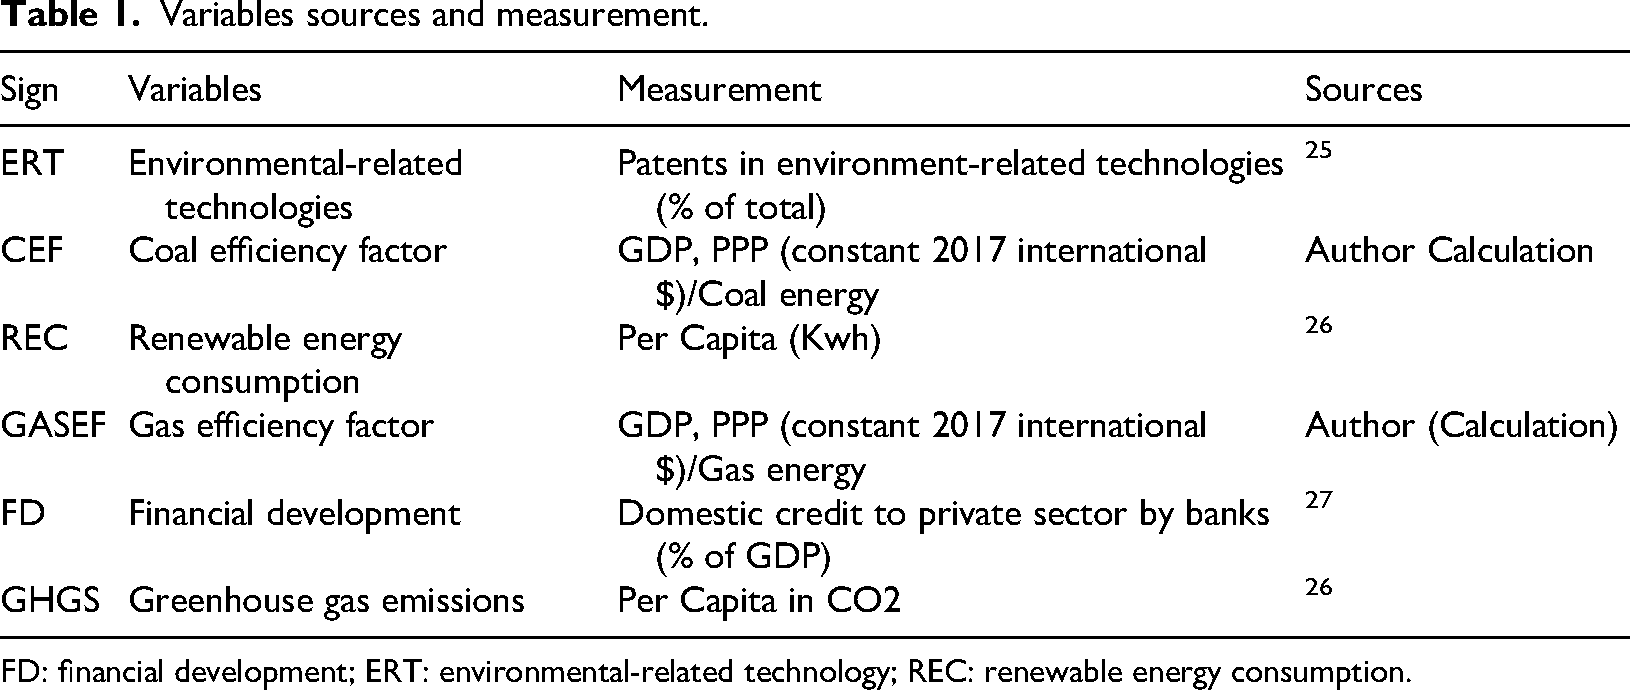
FD: financial development; ERT: environmental-related technology; REC: renewable energy consumption.
Table 2 presents the descriptive statistics for the variables under study, including GHG emission, GASEF, CEF, REC, ERT, and FD. The mean values indicate the average levels of these variables over the period 1990–2021, with GHGS averaging 1.816 metric tons per capita, and GASEF representing 9.008% of total energy consumption. The variance values highlight the dispersion of the data, with CEF showing greater variability than REC. Skewness results reveal that GHGS is slightly positively skewed, indicating a higher frequency of extreme values on the higher end, while other variables like GASEF and CEF show negative skewness, 39 suggests a concentration of values at the higher end of their ranges. Excess kurtosis values for CEF, ERT, and FD are significantly negative, 40 suggests these distributions are flatter than a normal distribution. The Jarque-Bera statistic tests for normality, and while some variables (e.g. GHGS, REC) are normally distributed, others like ERT and FD deviate significantly from normality. The autocorrelation tests (Q and Q² statistics) indicate significant serial correlation in most variables, implying that past values influence future observations, which may require time-series modeling techniques for accurate analysis.
Descriptive statistics.
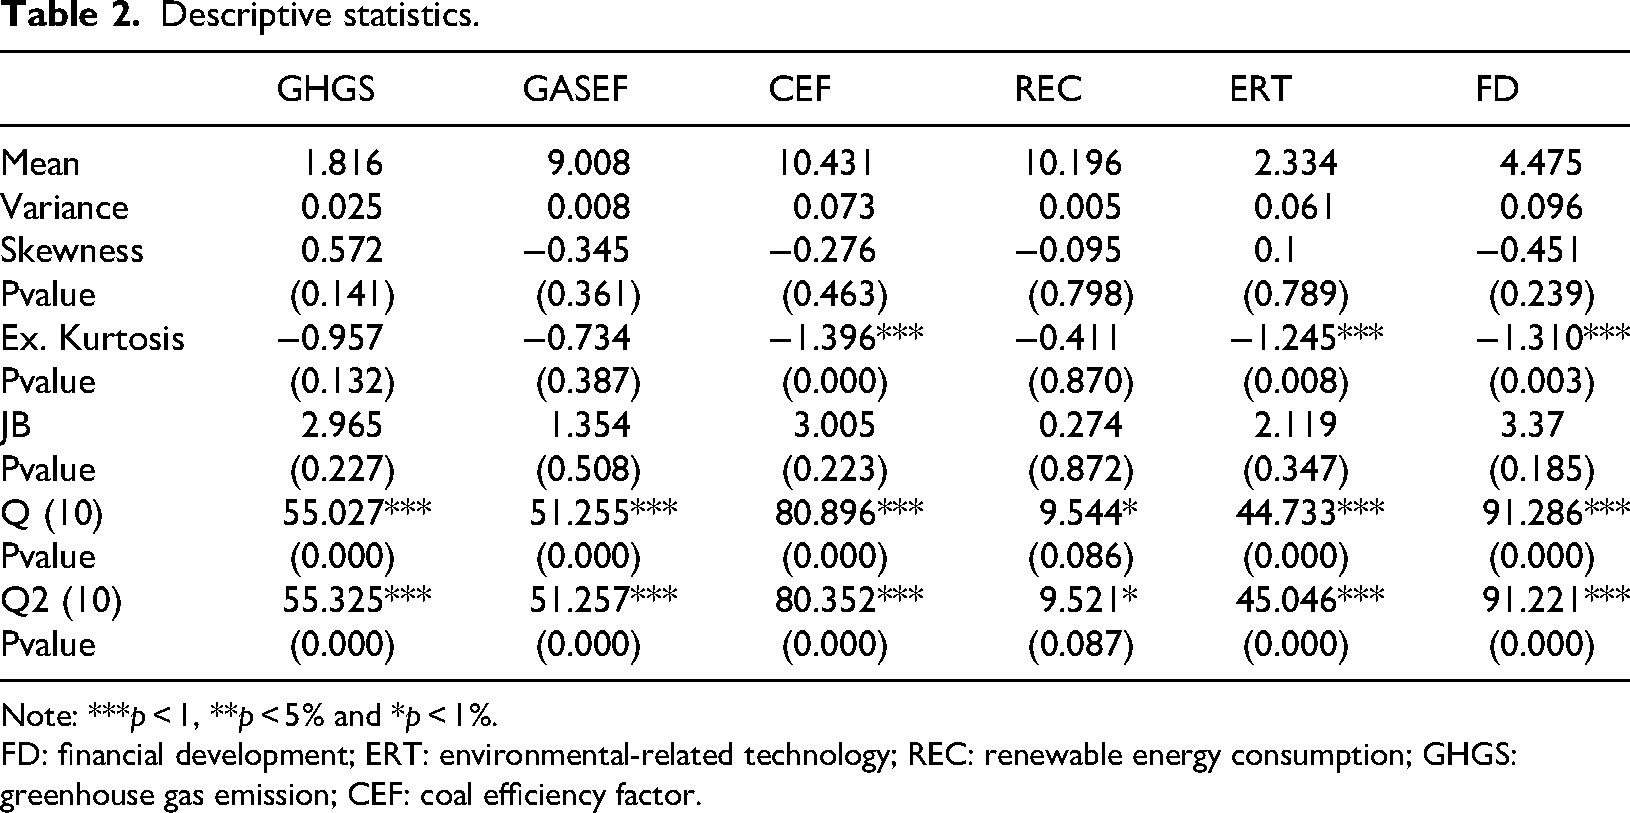
Note: ***p < 1, **p < 5% and *p < 1%.
FD: financial development; ERT: environmental-related technology; REC: renewable energy consumption; GHGS: greenhouse gas emission; CEF: coal efficiency factor.
Empirical models
This study aims to assess the impact of pollution and greenhouse emission control on FD and environmental technologies in Iceland. In empirical analyses involving multiple-related independent variables such as FD, ERTs, REC, GASEF, and CEF, the presence of multicollinearity and endogeneity can bias coefficient estimates and weaken the interpretability of causal relationships. While the study appropriately applies advanced methods such as KRLS, FMOLS, and DOLS to address these concerns, further statistical refinements can enhance robustness. To mitigate multicollinearity, diagnostic tools such as the Variance Inflation Factor can be employed to identify highly collinear predictors, and variable selection strategies like principal component analysis can be used to construct orthogonal composite indices that capture shared variance while reducing dimensionality. Additionally, ridge regression or Least Absolute Shrinkage and Selection Operator can be considered as penalized regression techniques that stabilize estimates in the presence of correlated regressors. In addressing endogeneity, where one or more explanatory variables may be correlated with the error term due to reverse causality or omitted variable bias, instrumental variable approaches such as Two-Stage Least Squares can be applied provided that valid external instruments (strongly correlated with the endogenous regressor but uncorrelated with the error term) are available. Moreover, generalized method of moments estimators, particularly in dynamic panels or time-series settings, offer a flexible framework for correcting endogeneity by using internal instruments derived from lagged values. These complementary methods can jointly ensure more accurate and policy-relevant estimations, especially when dealing with complex interdependencies among financial, technological, and energy-related variables in sustainability-focused models.
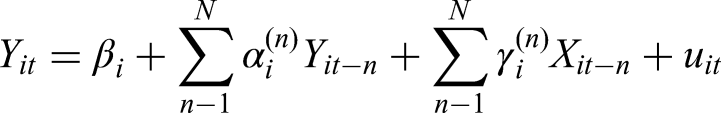
To empirically examine the relationships between GHG emissions and multiple explanatory variables including FD, REC, ERTs, GASEF, and CEF, we specify a series of extended regression models (M2 to M6). Each model introduces one or more additional predictors to isolate and analyze their marginal and combined effects on GHG emissions. The empirical analysis is based on a sequence of nested models (M2-M6).
M2 estimates GHG emissions as a function of FD:
M3 adds ERTs:
M4 incorporates REC:
M5 includes GASEF:
M6 presents the full specification by adding CEF:
To ensure the robust estimation of long-run relationships between GHG emissions and key explanatory variables such as FD, REC, and ERTs, this study adopts a triangulated econometric strategy using KRLS, FMOLS, and DOLS. These methods are selected for their complementary capabilities in addressing common econometric challenges in time-series analysis, including non-linearity, cointegration, endogeneity, and serial correlation. KRLS, a non-parametric machine learning technique, does not impose a fixed functional form and is particularly effective in capturing complex, non-linear relationships and heterogeneous marginal effects among variables, thereby offering a flexible approach to modeling the intricate dynamics between financial and environmental factors. In contrast, FMOLS is a parametric estimator specifically designed for cointegrated systems; it corrects for endogeneity and serial correlation by employing semi-parametric adjustments to the long-run covariance matrix. DOLS complements this by incorporating leads and lags of the first-differenced regressors to eliminate dynamic endogeneity and small-sample bias, while also reducing multicollinearity and serial correlation. Together, FMOLS and DOLS provide robust parametric benchmarks for long-run equilibrium analysis, while KRLS enhances model flexibility and generalizability. Additionally, frequency domain causality analysis is employed to uncover time horizon-specific causal linkages between variables, offering deeper insights into both short-term fluctuations and long-term structural influences. This integrative approach ensures that the empirical findings are not only statistically rigorous but also resilient to model specification choices, enhancing their credibility for informing climate-related financial and energy policies. Together these analytical methods deliver optimal results for studying how mixed integration orders operate while obtaining reliable and robust estimate outcomes. The FMOLS estimator is expressed as follows: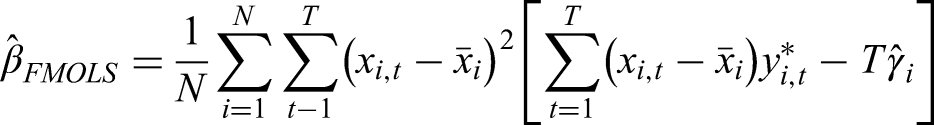
In order to upsurge the reliability of the results, the research uses Driscoll and Kraay standard errors as recommended by. 24 This method reports problems such as heteroscedasticity, and autocorrelation that are characteristic of annual time-series data analysis. It gives robust and unbiased estimates even when the data is unbalanced as pointed out by. 41
Causality test
The research analyzes Granger causality patterns between greenhouse emission control and environmental technologies together with FD by testing annual time-series data through the methods established by.
42
This method is relatively more reliable and especially appropriate for the unbalanced data set, which has the consideration of country characteristics. The causality test is specified as follows:
Where
Empirical analysis and discussions
The present research initiates the empirical analysis by comparing the trends in the environmental, energy, and FD indicators for the period 1990–2021 and identifying the key trends and underlying implications. GHG emissions present stable downward trends, allowing global mitigation approaches such as the Kyoto Protocol and development of cleaner technologies. On the other hand, the GASEF has a “U” shape to highlight the need to increase the use of natural gas to meet the rising energy demands. CEF gradually enhances, demonstrating the enhancement of output per unit of carbon, through energy-efficient technologies and sustainability management. REC varies, probably owing to policy adjustments, market factors, and infrastructure limitations, while ERTs exhibit a growth-inhibition-growth trend due to the development and transition phases of environmental technology. Figure 2 on the FD shows the continual improvement and highlights the improved financial systems, green financing, and digital banking. As such, these trends reveal interconnections between sustainability objectives, technological innovation, and economic stability to inform synergistic methods for development among policymakers.
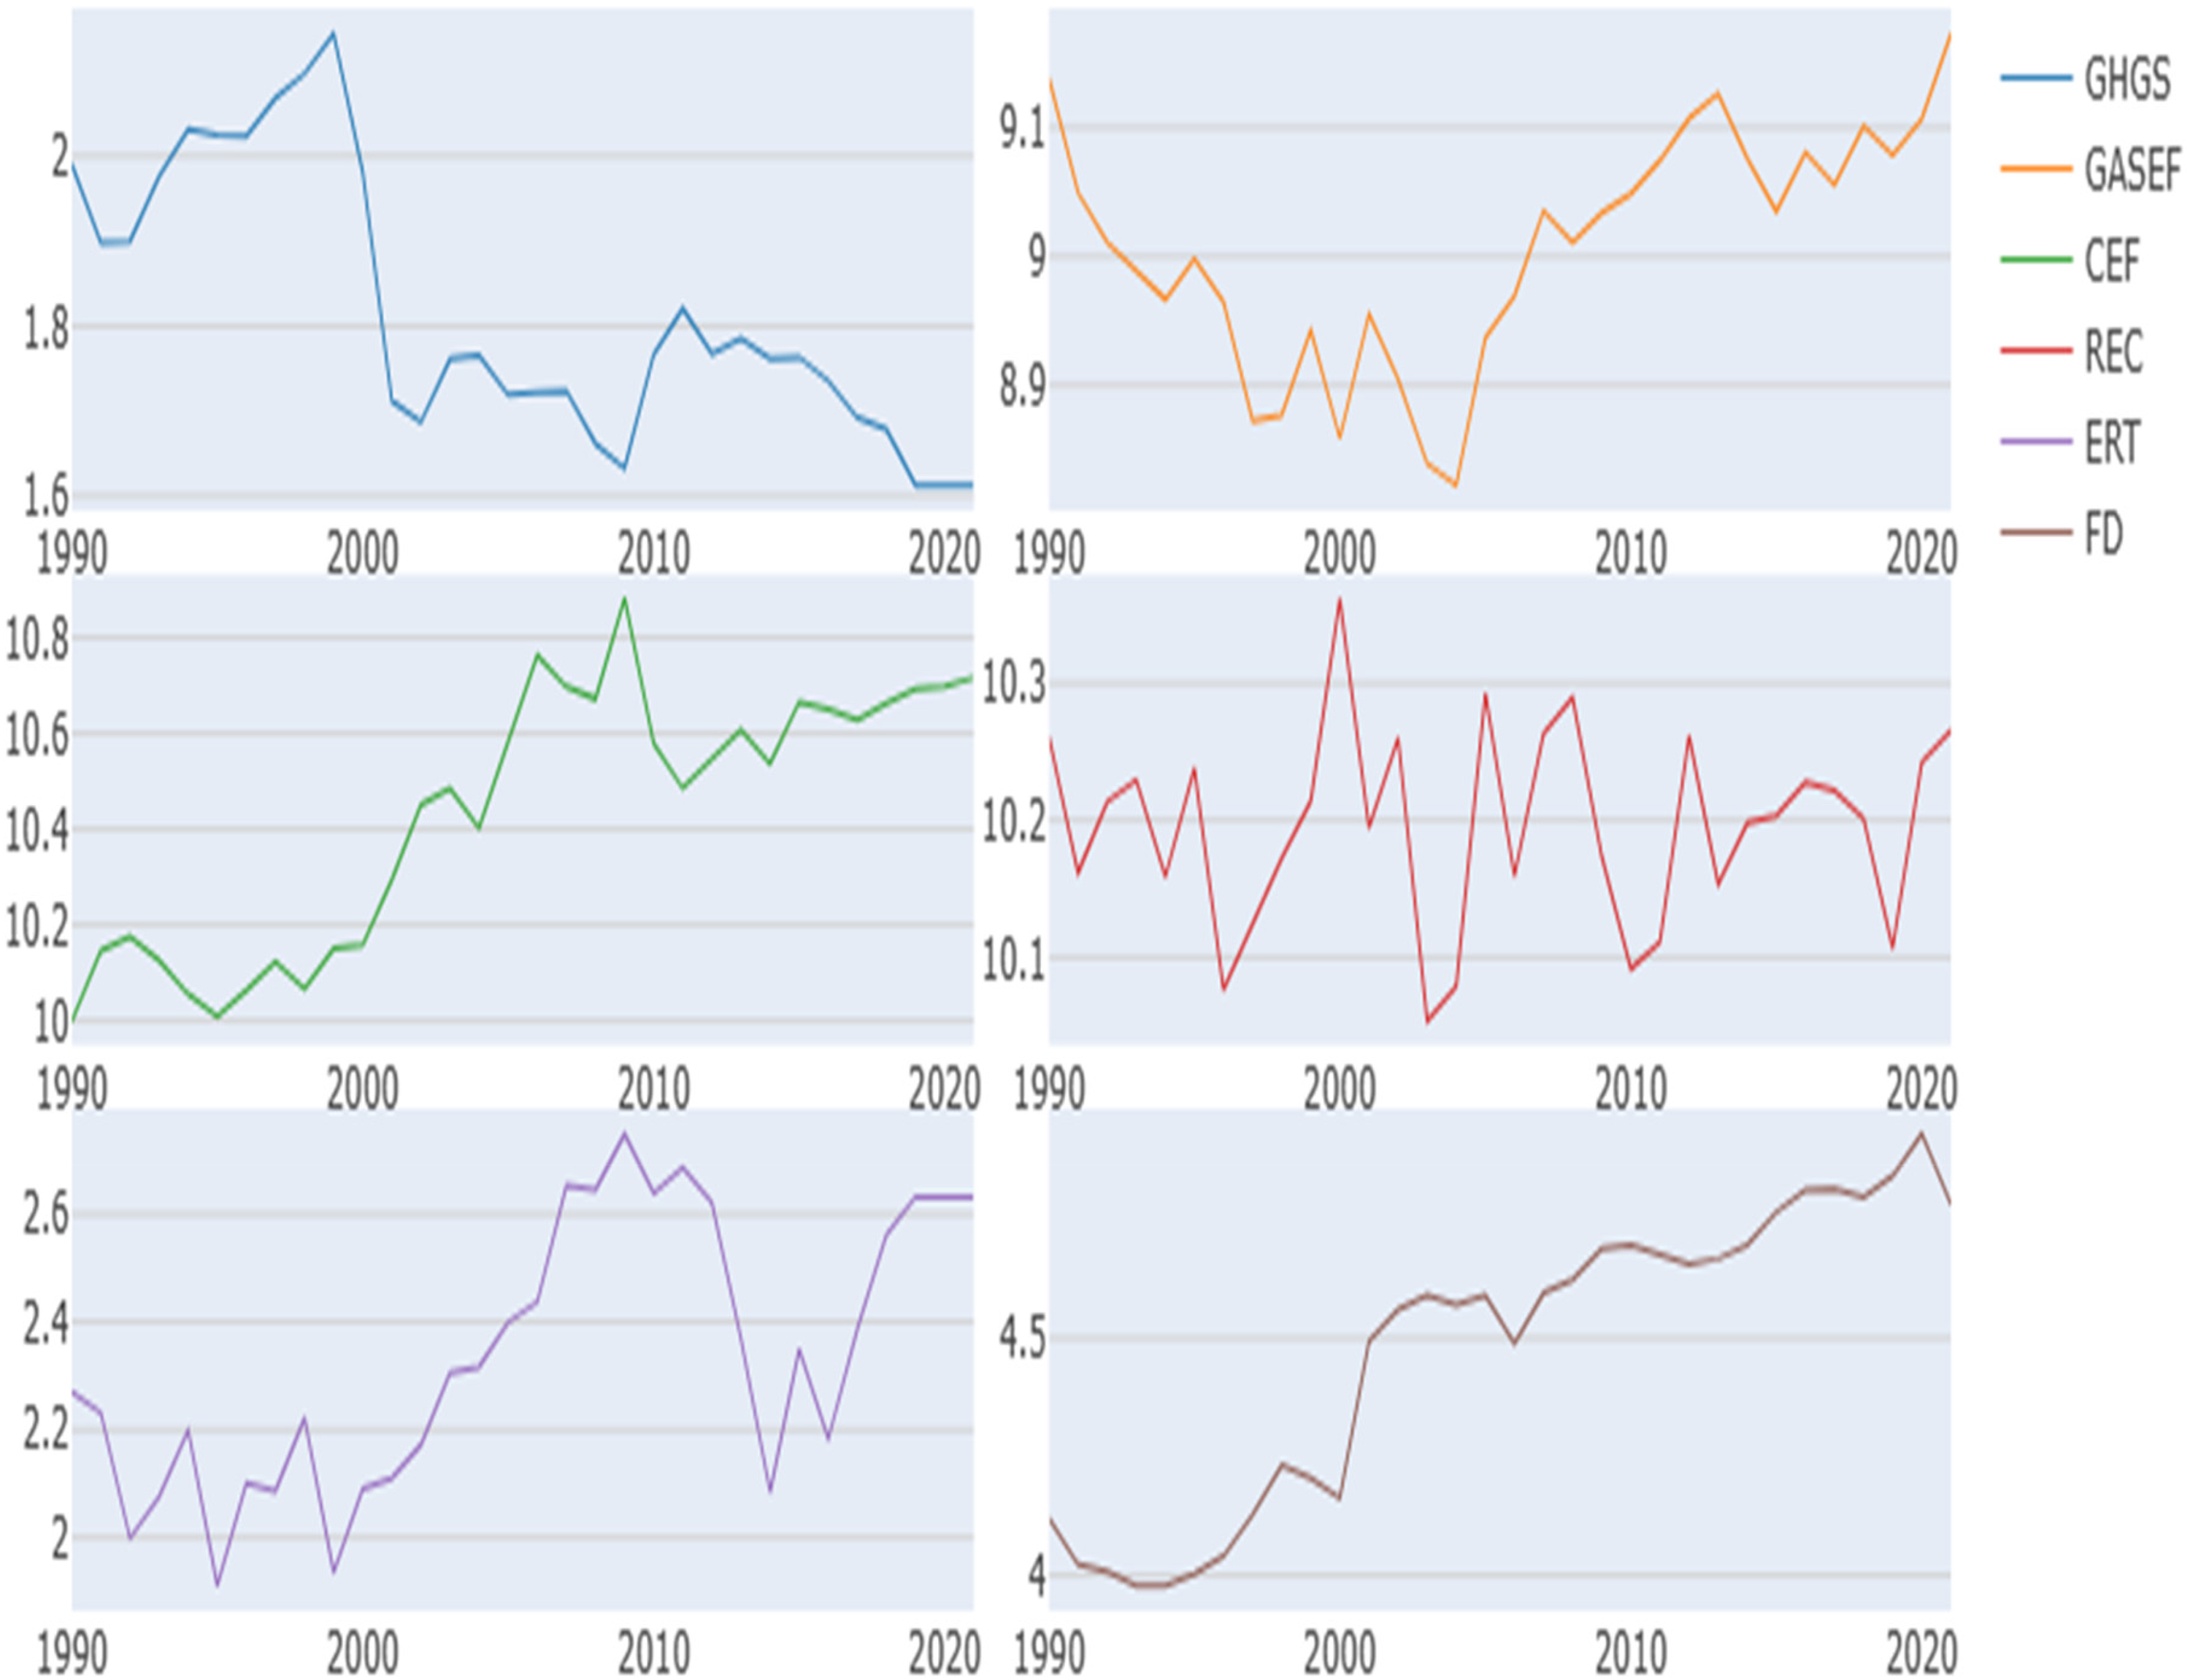
Trends in greenhouse gas emissions, energy, and financial indicators in Iceland: 1990–2021.
The next test that follows is the unit root tests such as the Augmented Dickey Fuller (1978), PP the Phillips-Perron (1988), and Zivot & Adrew (ZA) (1992) unit root tests. The results of the Zivot-Andrews (ZA) test indicate the presence of structural breaks in several key variables, suggesting that exogenous shocks such as policy reforms, technological transitions, or macroeconomic events have altered their underlying data-generating processes. To account for these structural changes and ensure robustness, the study employs econometric techniques that are either robust to structural breaks or explicitly incorporate them. For instance, the KRLS (KRLS) approach is non-parametric and flexible in capturing non-linear relationships and regime shifts, thus accommodating structural non-stationarities without requiring prior specification of break dates. Additionally, the use of FMOLS and DOLS estimators helps mitigate potential bias introduced by endogeneity and serial correlation, which are often exacerbated by structural breaks. Table 3 presents the unit root test, which tests for the presence of a unit root in the series, and thus, whether the series are stationary or non-stationary and thus whether they have to be differenced to make them stationary. For the variable GASEF, the ADF and PP tests suggest stationarity at the 1% confidence level, as the test statistics (−3.024) exceed the critical values at this level (−4.323 for ADF and −4.284 for PP). The ZA test, however, indicates a break year in 2005, 43 suggesting that there is a structural change in the series. For CEF, both the ADF and PP tests show that the variable is non-stationary at the 1% level, as their values (−2.123 and −2.162) do not exceed the critical values (−4.323 for ADF and −4.284 for PP). The ZA test, however, 32 suggests a structural break in 2001 and provides a more favorable test statistic (−3.973), which indicates that the series may be stationary after accounting for this break. REC exhibits stationarity at the 1% confidence level across all tests.
Unit root test results.
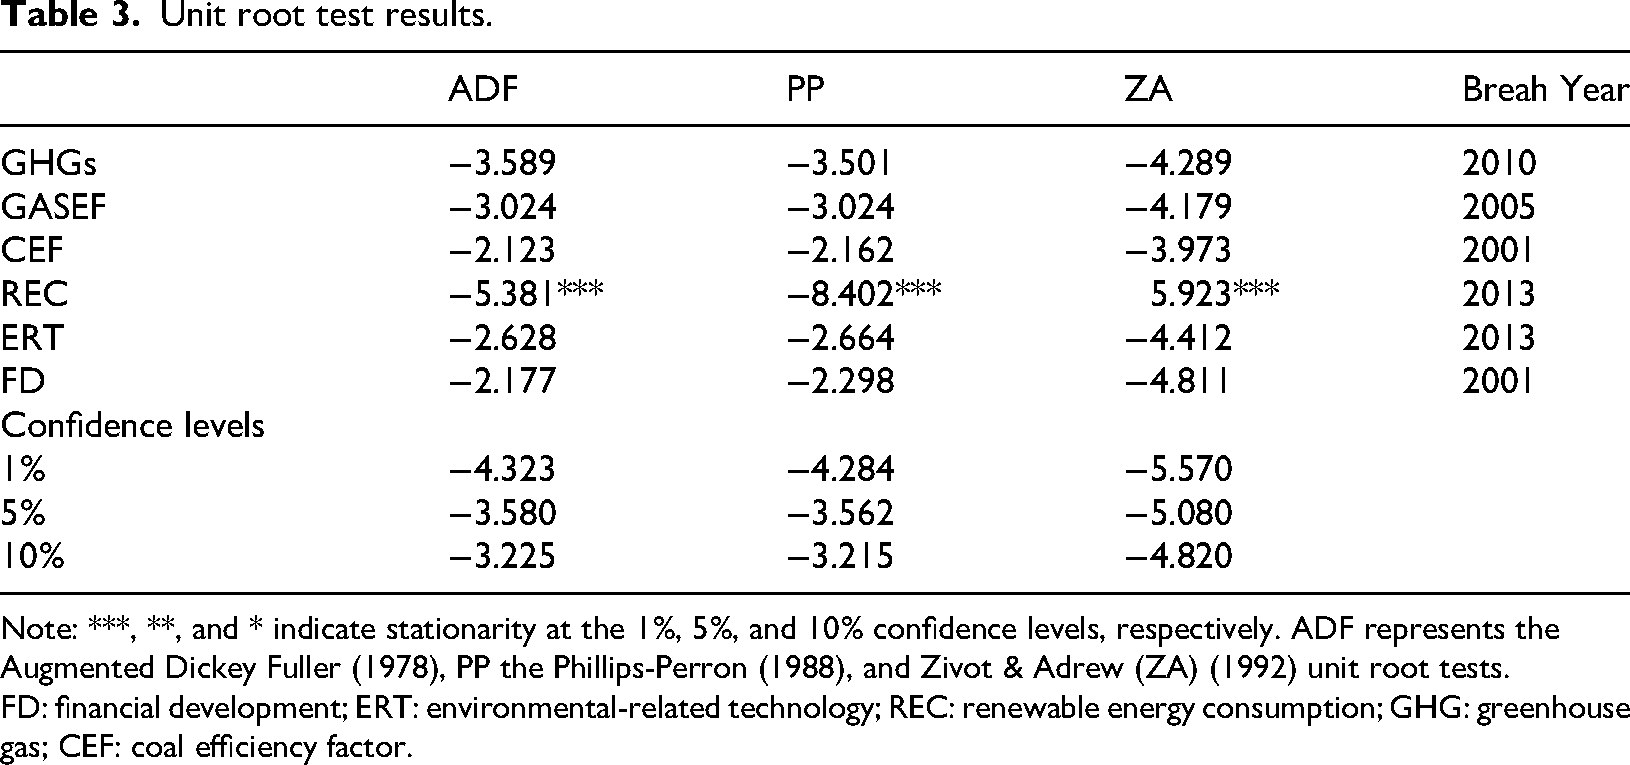
Note: ***, **, and * indicate stationarity at the 1%, 5%, and 10% confidence levels, respectively. ADF represents the Augmented Dickey Fuller (1978), PP the Phillips-Perron (1988), and Zivot & Adrew (ZA) (1992) unit root tests.
FD: financial development; ERT: environmental-related technology; REC: renewable energy consumption; GHG: greenhouse gas; CEF: coal efficiency factor.
The ADF, PP, and ZA tests all produce test statistics that surpass the critical values at the 1% level, with the most significant result being the PP test statistic (−8.402), which strongly supports stationarity. For ERT, the ADF and PP tests show the series is marginally non-stationary at the 1% level but may exhibit stationarity at a 10% level. The ZA test indicates a break year in 2013, which may be a contributing factor to its stationarity after accounting for structural changes. FD shows marginal stationarity at the 10% confidence level in the ADF and PP tests with test statistics of −2.177 and −2.298, respectively. These values are not significant at the 1% or 5% levels, but they exceed the 10% critical value (−3.225 for ADF and −3.215 for PP), indicating that FD might be stationary at the 10% confidence level, especially when considering the ZA test, which points to a break year in 2001. The results also show the critical values for the different tests at the 1%, 5%, and 10% confidence levels, with the series for REC being the most significant, showing stationarity at the 1% level across all tests. The other variables show mixed results but may become stationary after addressing structural breaks, as indicated by the ZA test. These findings suggest that the variables in the model require different treatment strategies for stationarity before proceeding with further analysis.
The Table 4 presents the results for the model parameters (M2 to M6) for various variables (ERTs, CEF, Renewable Energy, GASEF, FD, and GHG emissions), all of which show highly significant results with p-values of 0.000, indicating strong statistical significance at the 1% confidence level. 1 This suggests that the variables exhibit a strong relationship with the model's outcome across all the specified models (M2 to M6).
Non (linearity) test results.
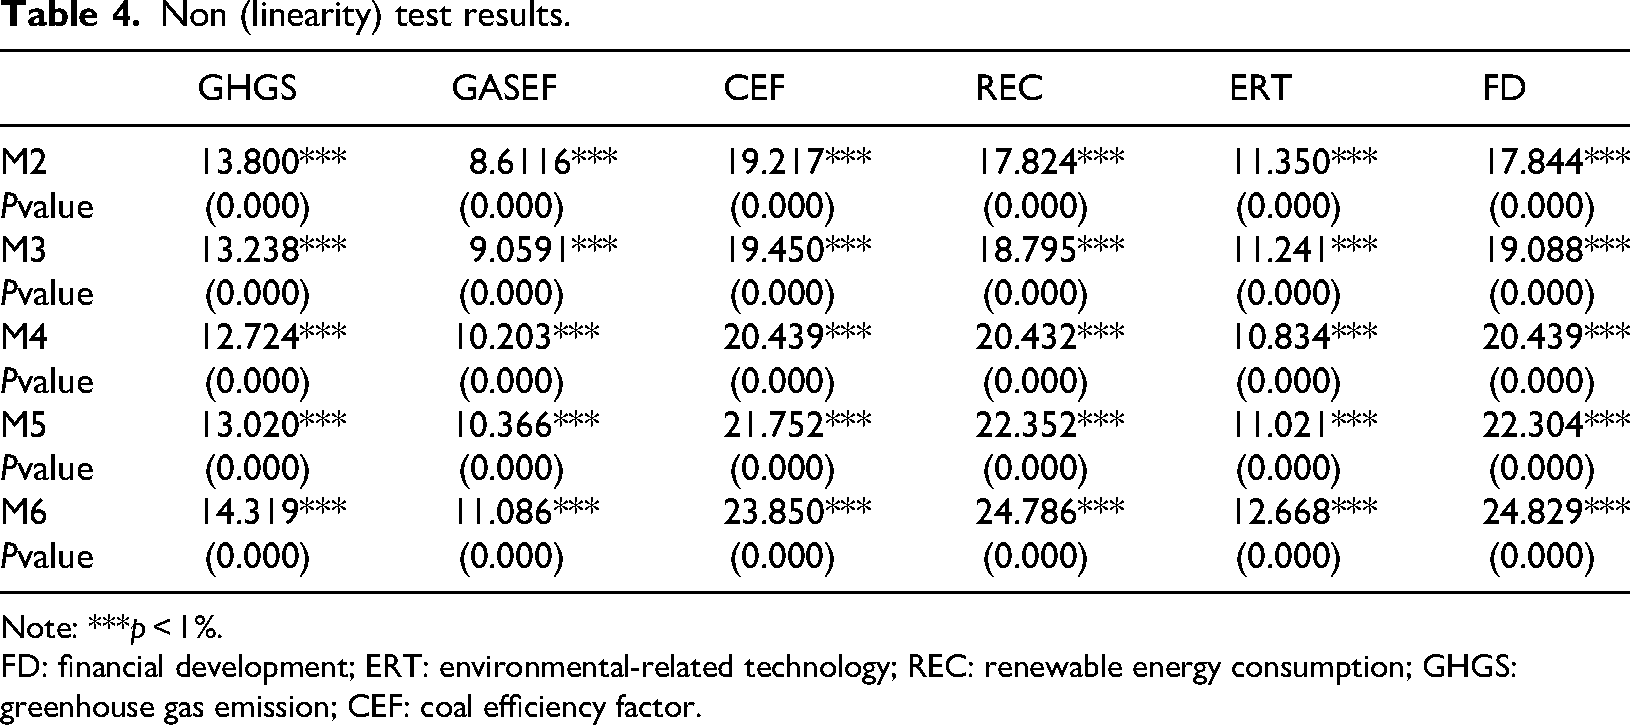
Note: ***p < 1%.
FD: financial development; ERT: environmental-related technology; REC: renewable energy consumption; GHGS: greenhouse gas emission; CEF: coal efficiency factor.
Table 5 presents the results of the KRLS analysis, highlighting the average marginal effects of various variables (GASEF, CEF, REC, ERT, FD). All coefficients are statistically significant at the 1% level, with negative values indicating an inverse relationship between these variables and the dependent variable. Specifically, GASEF and CEF show relatively stronger negative effects on the outcome, with marginal effects of −0.277 and −0.286, respectively, suggesting that increases in these variables lead to significant decreases in the dependent variable. REC, ERT, and FD also exhibit negative marginal effects, with values of −0.043, −0.085, and −0.146, respectively. The diagnostic results indicate a strong model fit (R² = 0.974) and a low leave-one-out loss of 1.256, suggesting that the model performs well in terms of prediction accuracy and generalization. The lambda value (0.0697) indicates the level of regularization applied, ensuring model stability by controlling for overfitting.
Average marginal effects in KRLS model.
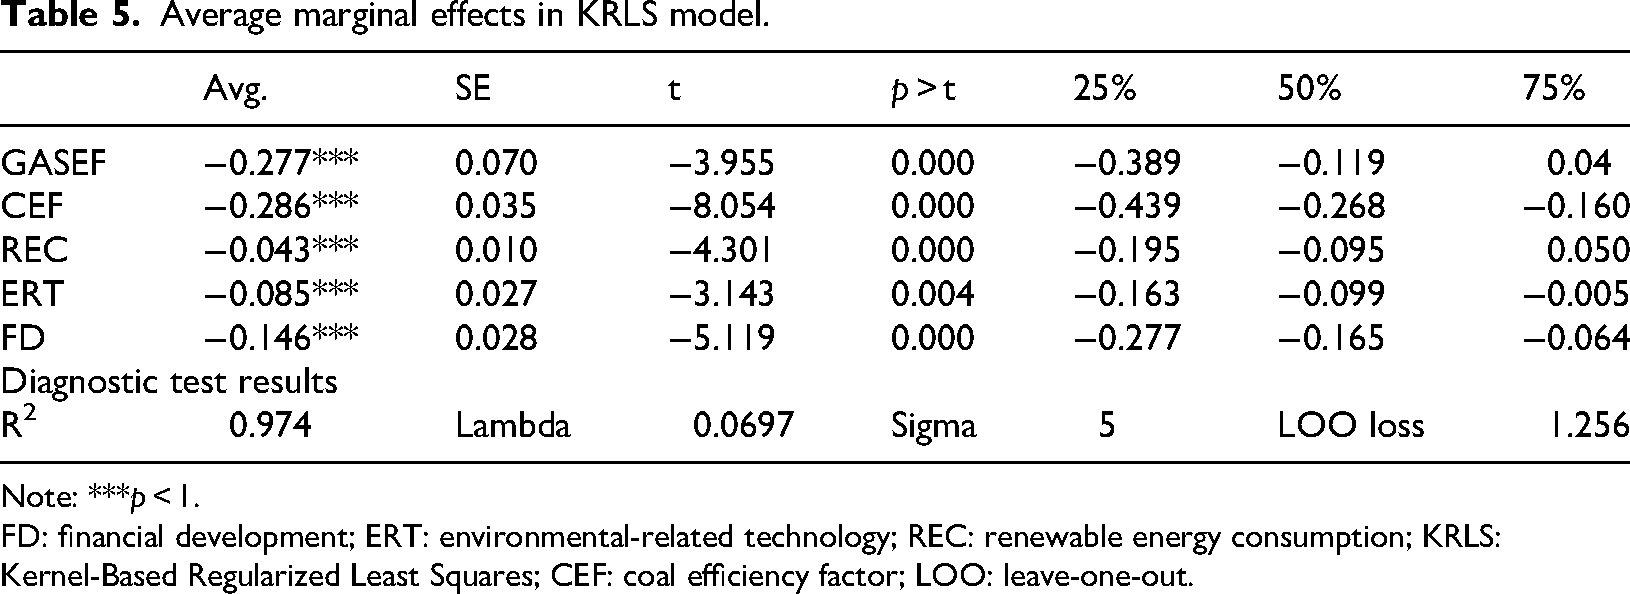
Note: ***p < 1.
FD: financial development; ERT: environmental-related technology; REC: renewable energy consumption; KRLS: Kernel-Based Regularized Least Squares; CEF: coal efficiency factor; LOO: leave-one-out.
The KRLS pointwise marginal effects graph visually represents how various explanatory variables impact GHG emissions at different points across the data range. Specifically, Figure 3(a) to (e) display the pointwise marginal effects of different variables (GASEF, CEF, REC, ERT, and FD) on GHG emissions, as derived from the KRLS model. The marginal effect of GASEF on GHGs is negative in Figure 3(a), and it decreases as GASEF rises, meaning that higher GASEF is accompanied by reduced GHG emissions. Likewise, Figure 3(b) shows that CEF has a negative impact on GHG emissions and the impact is much stronger at higher levels of CEF. Figure 3(c) shows that REC has a relatively weaker negative influence on GHG emissions, but the marginal effect decreases with the rise in REC levels, which means that the impact of REC is less at higher levels of REC. As shown in Figure 2(d), ERT has a negative impact on GHG emissions and the marginal effect is gradually declining, indicating that energy-related technology plays a significant role in reducing emissions. As seen in Figure 3(e), FD has a negative impact on GHGs, 28 suggest that as FD increases, the emissions of GHGs decrease but the impact is not as strong as the other variables. Altogether, these numbers suggest that all these variables have a strong and mainly unfavorable influence on GHG emissions and may play a part in reversing environmental deterioration.
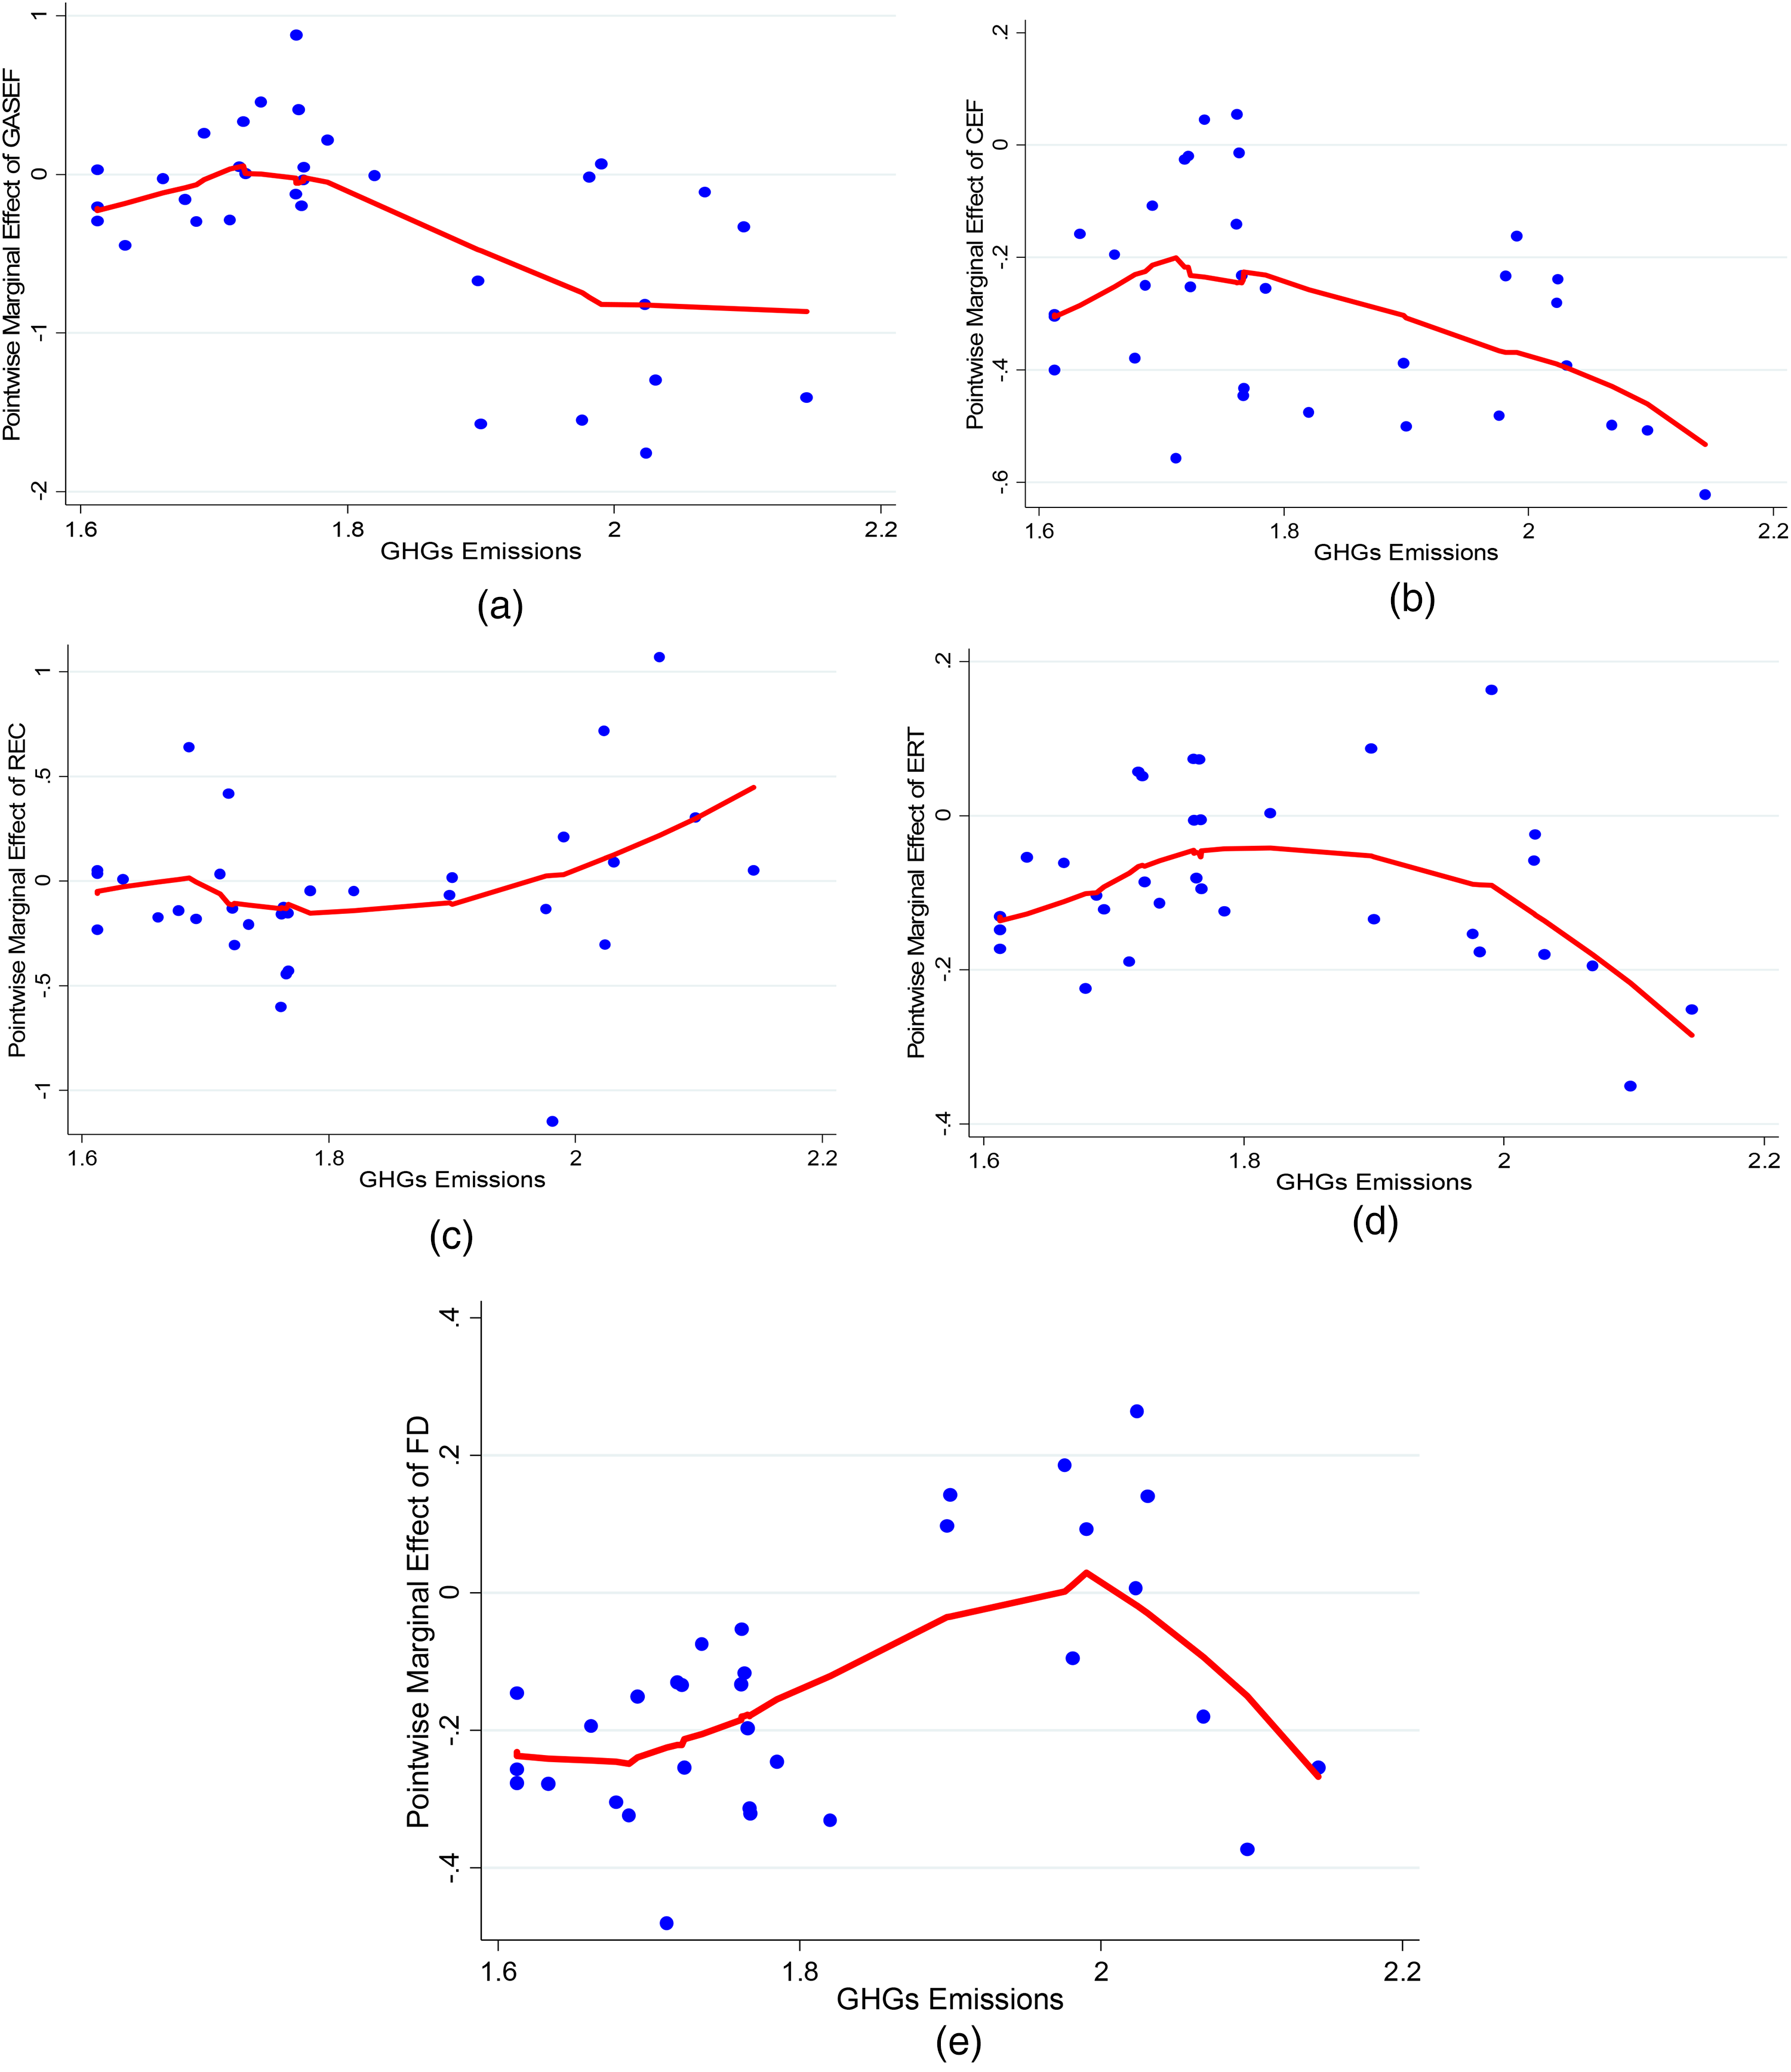
(a) Effect of GASEF on GHGs, (b) effect of CEF on GHGs, (c) effect of REC on GHGs, (d) effect of ERT on GHGs, and (e) effect of FD on GHGs. FD: financial development; ERT: environmental-related technology; REC: renewable energy consumption; GHG: greenhouse gas; CEF: coal efficiency factor; GASEF: gas efficiency factor.
The Long-run Estimators (Robustness Check) results presented in Table 6 reports FMOLS and DOLS to examine the association between REC, FD, energy-related technologies, GASEF, and CEF on GHG emissions. The findings show that REC has a negative and statistically significant relationship with emissions with FMOLS (−0.277) and DOLS (−0.287) estimates at 1% and 5% levels, respectively. FD also has a negative and highly significant impact on emissions with FMOLS and DOLS coefficients of −0.541 and −0.497, respectively, at 1% level. The estimates of ERT are −0.069 (FMOLS) and −0.065 (DOLS) which are marginally significant negative values. The results show that both GASEF and CEF present strong negative signs regarding emissions with FMOLS and DOLS estimates of −0.654 and −0.627 for GASEF and −0.525 and −0.506 for CEF, significant at 1% level. The R² values are high for both models, 0.934, and the Adjusted R² values are 0.924 for FMOLS and 0.919 for DOLS.
Long-run estimators (robustness check) results.
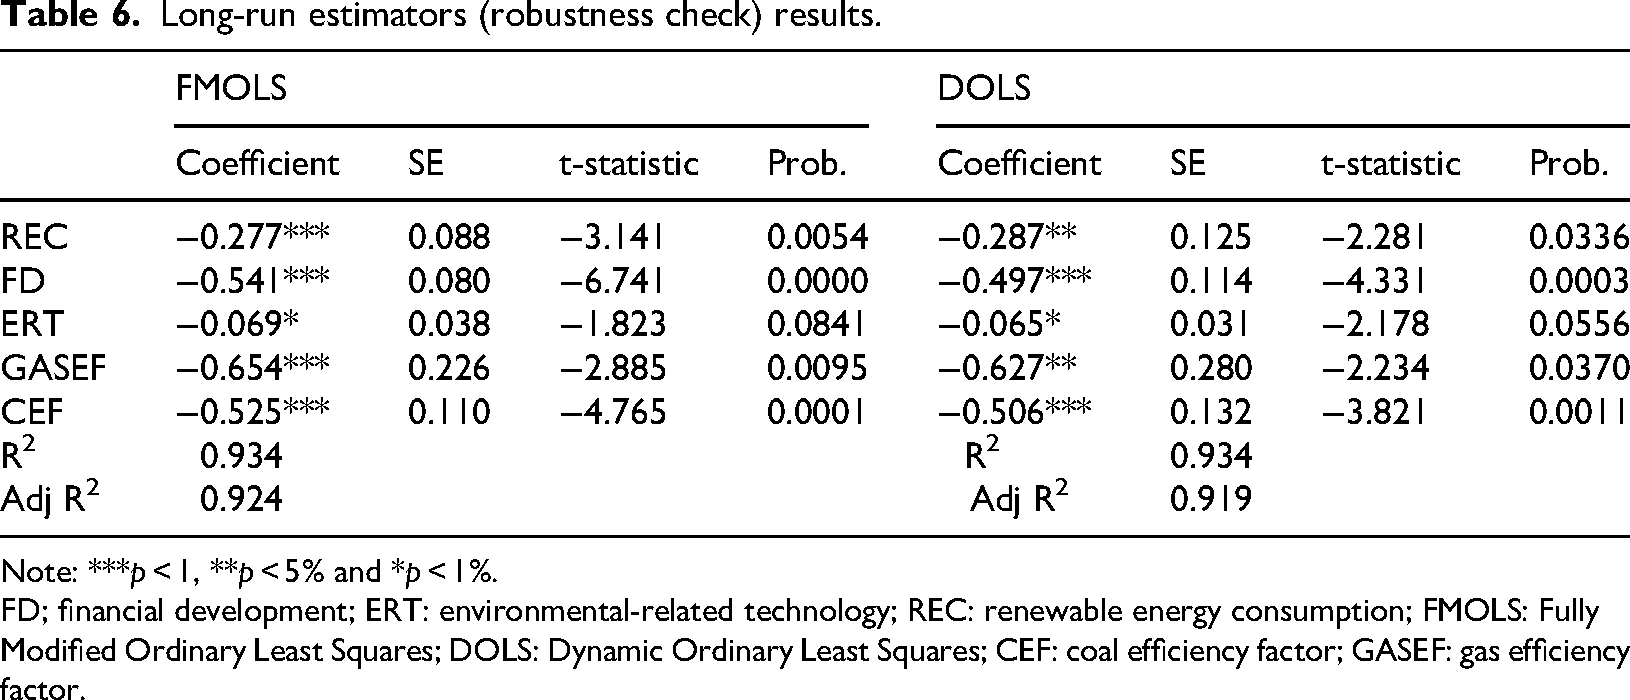
Note: ***p < 1, **p < 5% and *p < 1%.
FD; financial development; ERT: environmental-related technology; REC: renewable energy consumption; FMOLS: Fully Modified Ordinary Least Squares; DOLS: Dynamic Ordinary Least Squares; CEF: coal efficiency factor; GASEF: gas efficiency factor.
The frequency domain causality analysis provides nuanced insights into the temporal dynamics between key explanatory variables and GHG emissions, enabling a clearer distinction between short-term and long-term policy effects. As shown in Figure 4(a), the causal relationship between GASEF and GHG emissions is primarily concentrated at low frequencies, indicating that improvements in gas usage efficiency yield long-term reductions in emissions suggesting a policy focus on infrastructure modernization and cleaner fuel technologies. Figure 4(b) reveals that CEF influences GHG emissions across both short- and long-term frequencies, implying that while immediate regulatory measures (e.g. emissions standards) are effective, sustained investment in cleaner combustion technologies or CCS is necessary for enduring impact. In Figure 4(c), FD shows a medium- to long-term causal relationship with emissions, reinforcing the idea that robust financial systems contribute to emissions reduction over time by facilitating green financing and climate-aligned investments. Figure 4(d) demonstrates that REC affects GHG emissions predominantly at long-term frequencies, underscoring the delayed impact of expanding renewable capacity and integrating it into national energy systems. In contrast, Figure 4(e) illustrates that ERTs exhibit a more immediate (short- to medium-term) effect on emissions, suggesting that innovation in clean technology such as smart grids, energy storage, and low-emission industrial processes can produce faster environmental benefits. Together, these findings imply that Iceland's environmental strategy should be multi-tiered: combining quick-response policies targeting technological innovation with sustained structural reforms in energy systems and financial infrastructure to achieve long-term climate objectives.
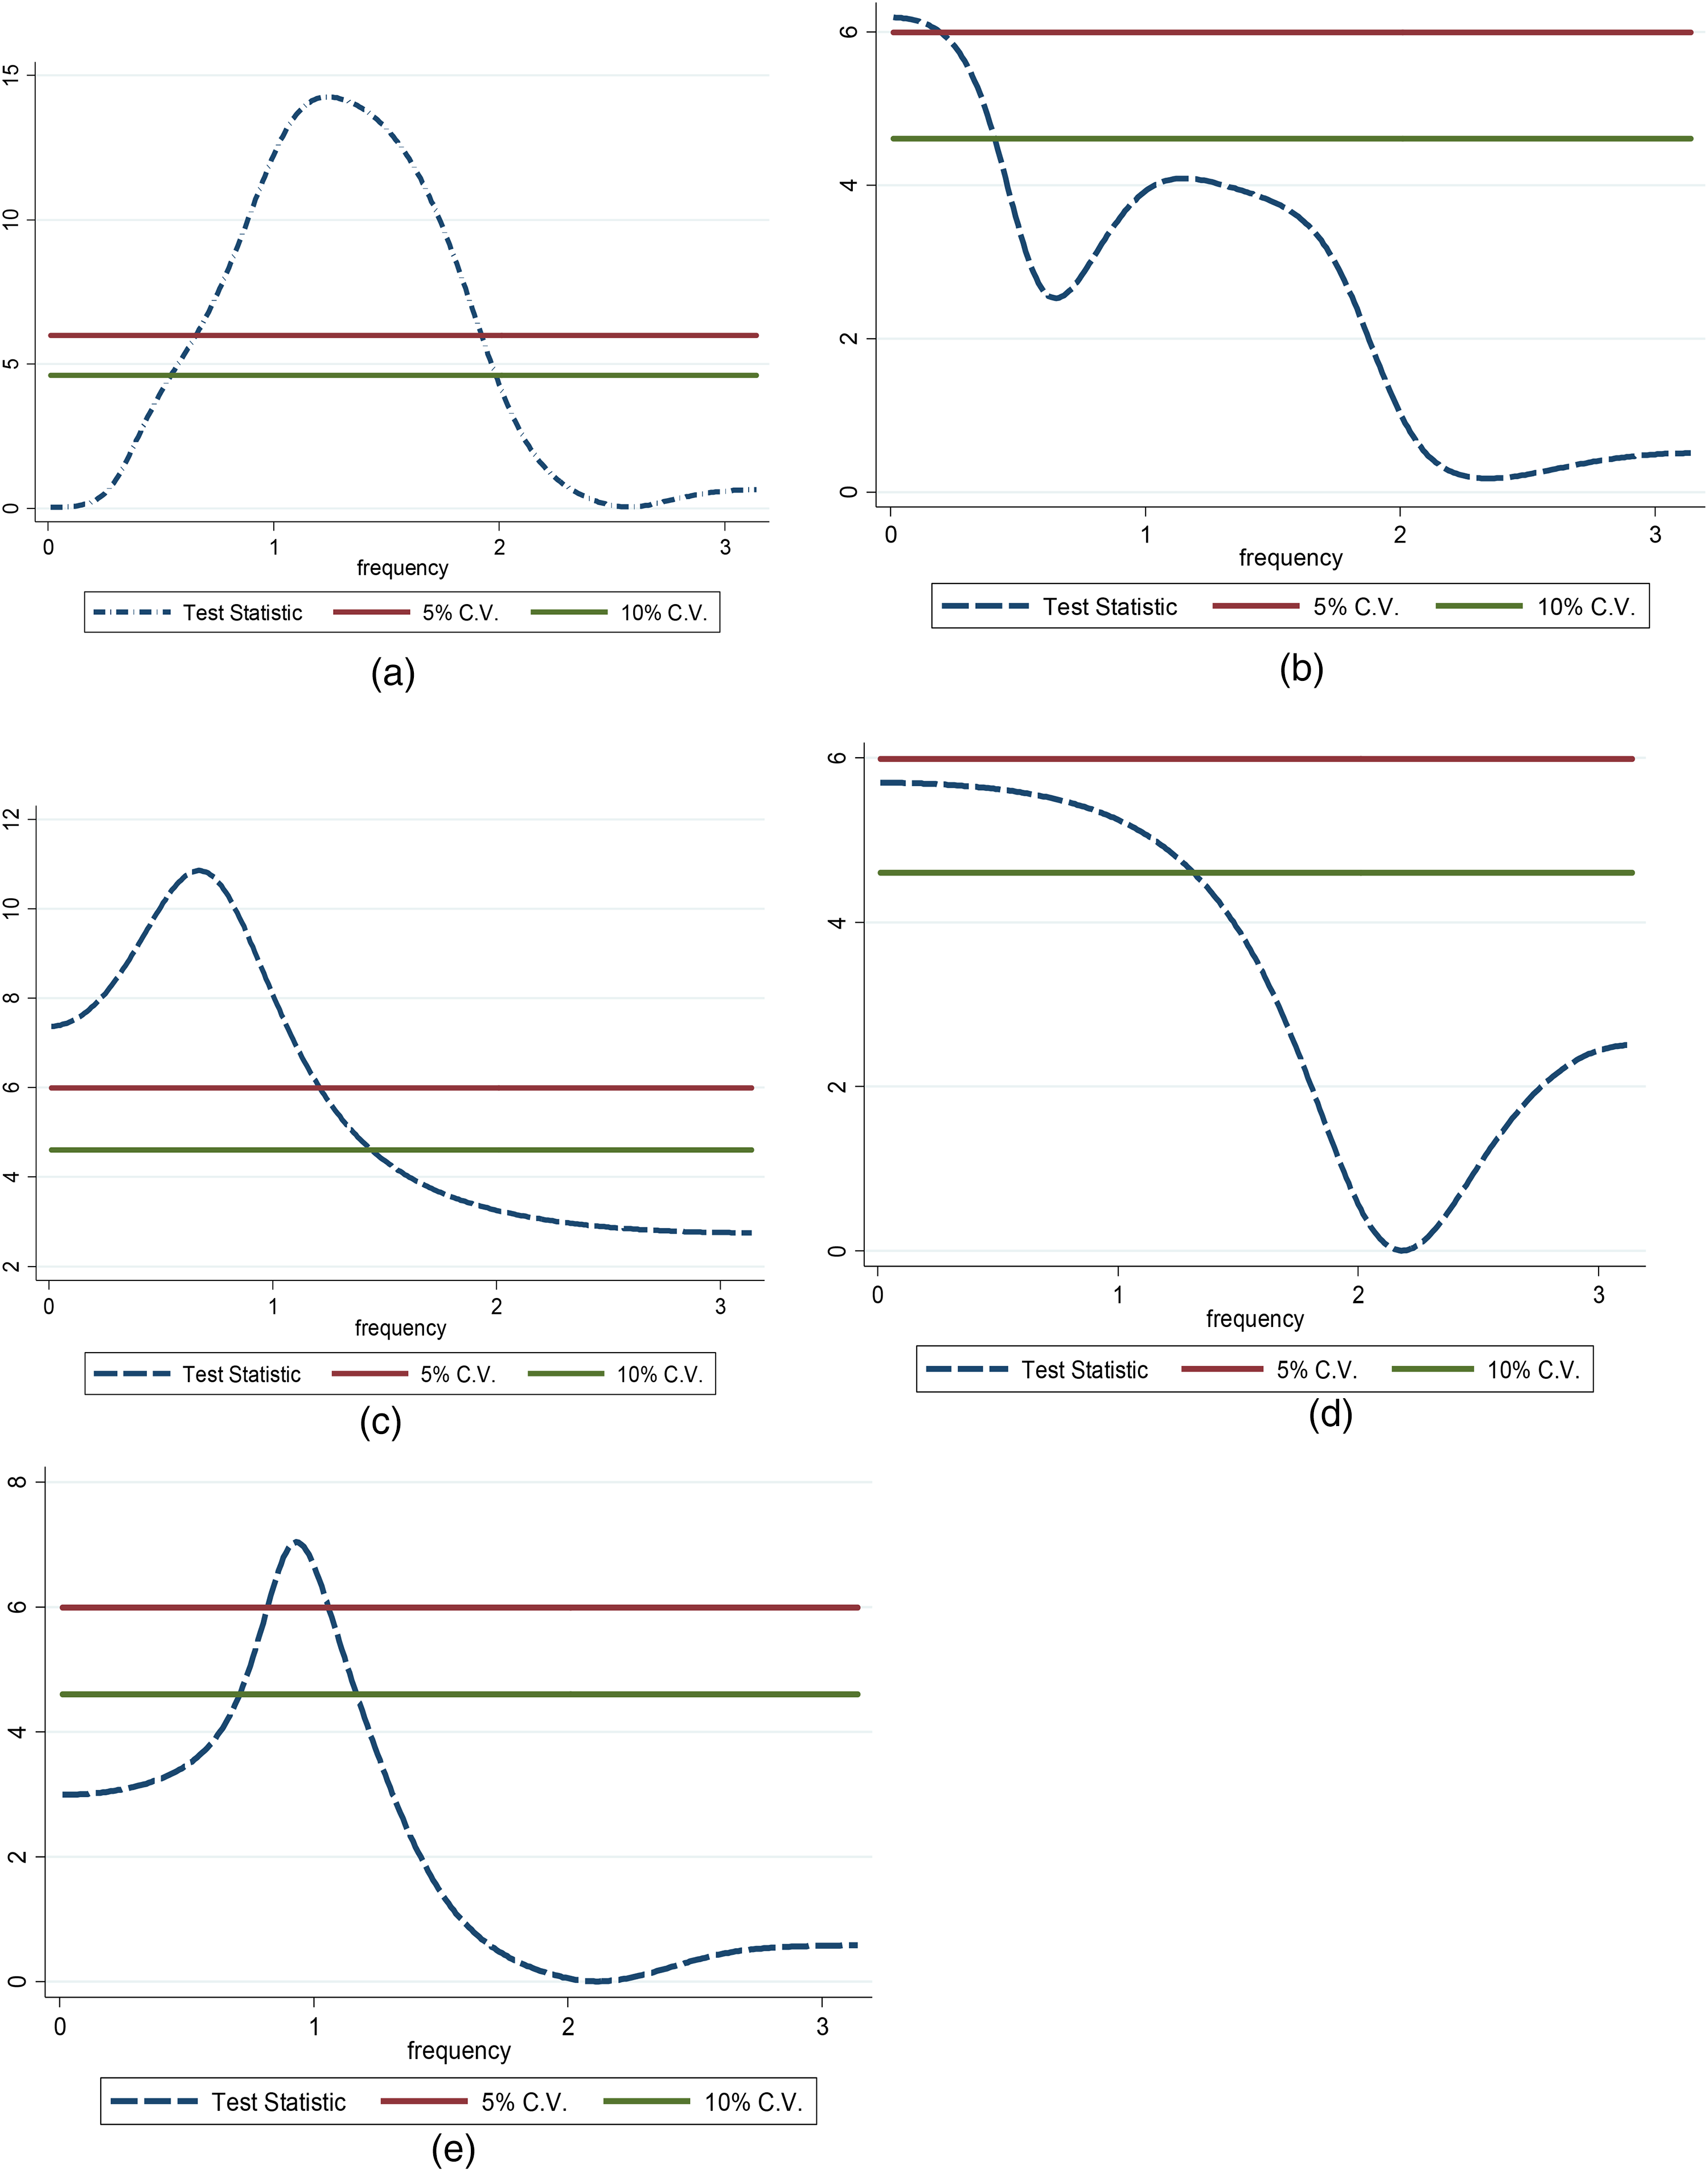
(a) Causality from GASEF to GHGs, (b) causality from CEF to GHGs, (c) causality from FD to GHGs, (d) causality from REC to GHGs, and (e) causality from ERT to GHGs. FD: financial development; ERT: environmental-related technology; REC: renewable energy consumption; GHG: greenhouse gas; CEF: coal efficiency factor; GASEF: gas efficiency factor.
Policy implications
The findings of this study offer important implications for Iceland's environmental policy framework, underscoring the need for strategic actions to reinforce the country's commitment to climate change mitigation and sustainable development.
First, given Iceland's heavy reliance on renewable energy mainly geothermal and hydropower there is a substantial opportunity to further reduce GHG emissions by increasing REC. The results from the Frequency Domain Causality Tests confirm a causal relationship between REC and GHG emissions, suggesting that expanding renewable energy sources is critical for sustained emission reductions. In addition to existing sources, the integration of offshore wind and solar power could diversify Iceland's energy mix, enhance resilience, and support a fully decarbonized energy system.
Second, while GASEF and CEF do not show a strong current correlation with GHG emissions in Iceland, their improvement remains strategically important. The transport sector, which continues to depend on fossil fuels, should prioritize greater fuel efficiency and accelerate the adoption of electric vehicles (EVs) and biofuels. Consistent with global research, enhancing efficiency in fossil fuel usage particularly in transportation and industry is essential for meeting long-term climate goals, even in countries with limited coal dependence.
Third, FD plays a pivotal role in enabling the transition to a low-carbon economy. Although modest in size, Iceland's advanced financial sector is well-positioned to support green investment. Policymakers should leverage this strength by directing capital toward sustainable technologies and infrastructure, such as smart grids, energy storage, and CCS. These technologies can mitigate emissions, improve energy efficiency, and address challenges related to the intermittency of renewable energy.
Notably, expanding financial support for the renewable energy sector will allow Iceland to maximize its natural resource potential while reducing residual fossil fuel use. Promoting the deployment of ERTs particularly in storage and smart grid systems will enhance the integration of renewable sources, ensuring more stable and efficient energy management.
Finally, a coordinated and holistic policy strategy is essential. Aligning technological innovation, green finance, and energy policy will strengthen Iceland's environmental sustainability agenda. By prioritizing climate-finance, incentivizing clean technology, and implementing robust emission standards, Iceland can consolidate its global leadership in renewable energy utilization while sustaining economic growth.
Conclusions and recommendations
This study provides a comprehensive understanding of how F
A key contribution of this research is the identification of the causal mechanisms through which FD facilitates emission reductions. Specifically, the results demonstrate that while increased financial activity supports investments in ERTs and energy efficiency measures, the immediate impact on GHG emissions remains modest. This suggests that financial systems must be strategically oriented towards green investments to realize their full potential in emission mitigation. The long-term evidence underscores that FD, when aligned with environmental objectives, can significantly accelerate shifts toward sustainable technologies.
Furthermore, our analysis reveals that sectors such as transportation and industry continue to contribute disproportionately to emissions, despite Iceland's dominant renewable energy use in power generation. This sectoral imbalance indicates that technological improvements and policies targeting renewable electricity are necessary but insufficient; targeted measures are essential to address emissions in other high-pollution sectors.
Another notable insight is the reinforcing role of ERTs in reducing emissions, emphasizing that innovation in environmental tech is a vital component of Iceland's sustainability pathway. Based on the empirical findings, several targeted policy measures are essential to enhance Iceland's emission reduction efforts. Strengthening sector-specific regulatory measures, particularly in transportation and industry, is crucial this includes expanding carbon pricing schemes and setting higher emission standards to address sectors where fossil fuel reliance persists despite the country's renewable energy proficiency. Aligning financial market incentives with environmental objectives is equally important; leveraging Iceland's advanced financial infrastructure to direct investments into high-impact environmental technologies such as electric vehicles, energy storage, and smart grids will magnify the positive effects seen in causality analysis. Additionally, promoting research, development, and deployment of ERTs across all sectors will maximize emission-saving potentials. Developing targeted green finance instruments and subsidies can accelerate these technological upgrades. Furthermore, integrating sectoral policies within a cohesive and long-term sustainable strategy that maximizes renewable energy benefits beyond power generation is vital. These combined measures, rooted in the causal relationships identified between FD, technological innovation, and emission reductions, can enable Iceland to maintain its environmental leadership while fostering sustainable economic growth.
Building on these findings, further research could explore microeconomic mechanisms such as firm-level analyses to better understand how FD and technological innovation translate into emissions reductions. Comparative studies involving other Nordic and European economies can also provide insights into best practices and policy transferability.
Footnotes
Author contributions
The idea of the original draft belongs to RZA and RQ. RZA wrote the introduction, literature review, and empirical outcomes sections. RQ helped in the collection and visualization of the data of the observed variables. All the authors read and approved the final manuscript.
Funding
The authors received no financial support for the research, authorship, and/or publication of this article.
Declaration of conflicting interests
The authors declared no potential conflicts of interest with respect to the research, authorship, and/or publication of this article.
Data availability
The datasets used during the current study are available from the corresponding on reasonable request.