



Abstract
This study explores the complex interplay between green energy policies (GEP) and foreign direct investment (FDI), comparing their impacts on achieving carbon neutrality and addressing clean energy poverty (CEP). The study employs a Driscoll–Kraay fixed-effects model, panel quantile regression, two-stage least squares, and panel structural vector autoregression across 77 high-income nations, utilizing data from 1995 to 2022. The results indicate that GEP positively influences FDI, with renewable energy promotion having a more significant impact compared to energy efficiency improvements. Additionally, the novel macroeconomic performance (MP) index mediates the relationship between GEP and FDI inflows, with stronger positive effects observed in countries with higher levels of FDI inflows. The study revealed heterogeneous transmissions of GEP, MP, and FDI on carbon neutrality and CEP. Specifically, FDI tends to undermine carbon neutrality policies, while MP plays a more significant role in reducing CEP. The findings suggest that countries should integrate more green energy incentives. They should enforce the mandatory adoption of clean technologies by foreign investors. They should also strengthen macroeconomic fundamentals and enhance green digital economy innovations based on FDI. These include encouraging FDIs that promote artificial intelligence and Internet of Things innovations. It can boost economy by optimizing resource use and enhancing productivity. At the same time, they control carbon emissions through real-time monitoring, predictive analytics, and efficient energy management.
Keywords
Introduction
The dual challenges of climate change and energy poverty are increasingly recognized as critical barriers to sustainable development. This climate change poses significant risks to ecosystems and human livelihoods, while energy poverty restricts access to essential services for millions. Despite extensive research on climate mitigation strategies, there remains a notable gap in understanding how green energy policy (GEP) and foreign direct investment (FDI) interact to influence both carbon reduction and energy access. Existing literature often treats these issues in isolation, failing to capture the synergies and trade-offs that may exist between them. This research aims to fill this gap by exploring how GEP can be leveraged to attract FDI, thereby fostering investments that not only promote carbon neutrality but also enhance access to clean energy solutions for underserved populations. By focusing on higher-income countries, this study seeks to provide insights that can inform policy-making and investment strategies, ultimately contributing to a holistic approach to tackling climate change and energy poverty. Addressing these intertwined issues is essential for creating sustainable and equitable energy systems.1–3
Although actions to alleviate the consequences of global warming and poverty through clean energy are urgent, they can also contribute to instability in the economies of some countries. 4 Therefore, the transition to a carbon-neutral world and minimum energy poverty requires an understanding of the effects of GEP on macroeconomic performance (MP).5,6 Due to rising global carbon emissions and persistent energy insecurity, many countries have prioritized the adoption of green-based climate initiatives in their economic plans so as to achieve sustainable development goals (SDGs). Those goals include SDG 7 of ‘access to sustainable, modern, and affordable energy for all’ and SDG 13, which emphasizes the necessity of ‘taking urgent actions to combat climate change and its impact’. 7 Moreover, a variety of studies suggest that FDI is essential as a driver of economic development and social progress. It contributes to higher incomes, better job opportunities, improved infrastructure, and enhanced quality of life for people worldwide.8–10 This aligns with the present SDG 17, which emphasizes the importance of global partnership. 7
Green energy climate policies are aspects that impact countries’ FDI inflows. Policymakers should therefore create appropriate policies to benefit from both green energy climate policies and FDI inflows.11–13 Even though there is a lot of literature discussing the factors that affect FDI, for example, economic growth,14,15 inflation rate,16,17 and exchange rate,18,19 extremely little is known about how GEP influences FDI, especially in high-income countries.13,20–22
A unique but also convincing justification for tackling this gap is offered by 77 high-income countries. These countries were chosen as the biggest economies and extremely effective GEP activists. 23 Consequently, we can gain insights into the beneficial effects of their actions and how these might influence MP. Additionally, the selection of these 77 countries was influenced by the data's availability. They are better candidates for analysing how such policies affect FDI due to the all-mentioned reasons. However, despite succeeding actors in GEP, the FDI% of GDP decreased from 5.9% in 2007 to 0.4% in 2018 and 1.9% in 2022. 24 In addition to FDI, which is the primary focus of the study, the implications of GEP and FDI for clean energy poverty (CEP) and carbon neutrality were compared. This is because estimates show that by 2030, 620 million people will lack access to electricity and 2.3 billion people will not have access to clean energy for electronics and cooking. 25 The high-income countries also did not achieve 100% clean energy accessibility. 24 In addition, fuel carbon emissions consumption continues to increase in high-income countries and other countries (see Figure 1(b)), from 2.24 billion metric tons in 1995 to 3.59 billion metric tons in 2020 and finally reaching almost 4.00 billion metric tons in 2022. 24 This represents a significant obstacle to the countries’ 2021 target of net zero and carbon neutrality by 2060. 26
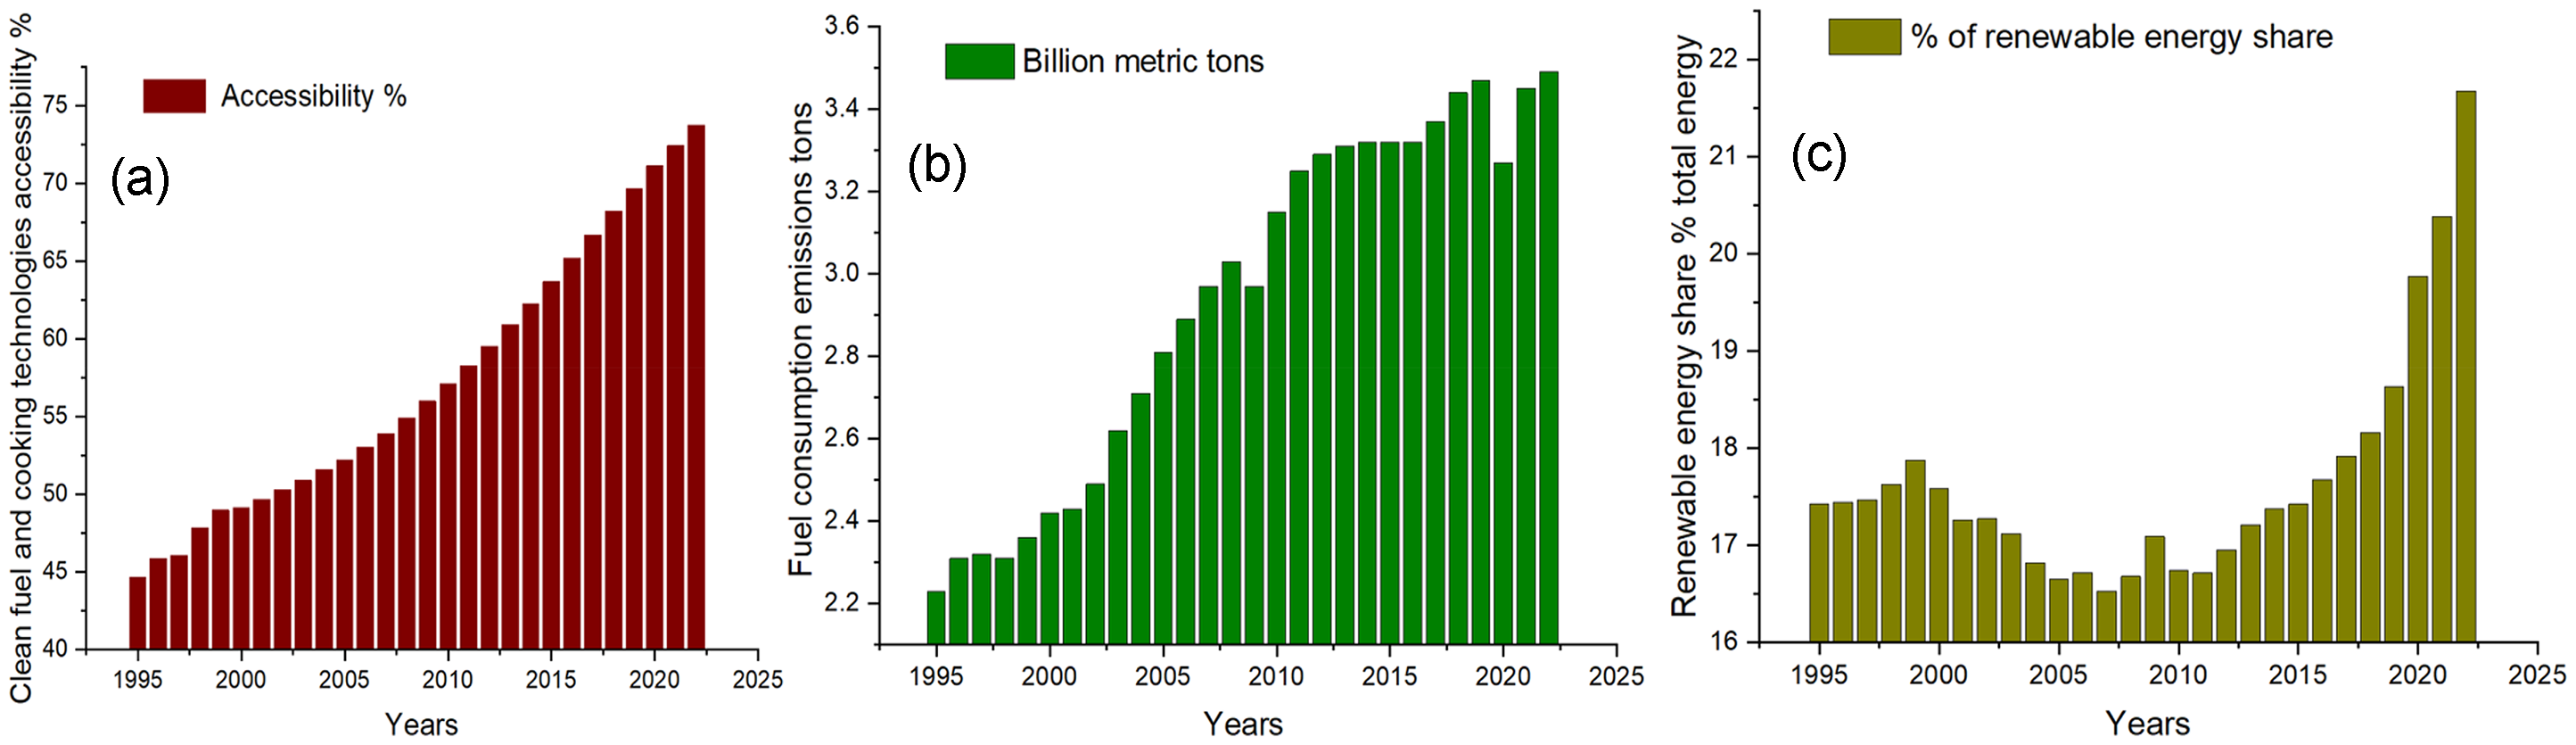
Global picture of clean fuel and cooking technologies accessibility per cent from 1995 to 2022 (a). Fuel consumption emissions tons from 1995 to 2022 (b). Renewable energy share per cent of total energy from 1995 to 2022 (c). Source: Authors’ illustration using the free online global change data lab platform, accessible at https://ourworldindata.org.
The study intends to determine the FDI effects as a result of green energy climate-related policies, consequently mediating the novel macroeconomic performance index (MPI) and looking into the transmission comparisons for clean energy-related poverty and carbon neutrality problems. The introduction of a novel MPI was claimed by Mohanty et al. 27 who have indicated that investors are looking beyond GDP indicators. They require a more comprehensive understanding of the economy instead of relying solely on GDP figures. Consequently, the new index offers a macroeconomic measure that reflects the overall economic landscape. This extensive framework enriches the field by providing a wealth of information about the impacts of green energy-related climate policies, specifically in high-income countries, on macroeconomic health and the environment as a whole. The research hypotheses are developed in accordance with the E3 model theories (energy–economy–environment), first proposed by Junankar et al. 28 in Cambridge econometrics. The global increase in renewable energies acts as evidence of the motivation behind this study 24 (see Figure 1(c)), and FDI% GDP are decreasing. 24 Nevertheless, neither the mechanisms behind the two variables’ interaction nor their transmission implications for CEP and carbon neutrality are explored, while the accessibility of clean energy is continuously rising globally 24 (see Figure 1(a)). Policymakers may become more motivated and aware worldwide those green energy climate policies do not have negative economic effects in nations with high-income levels, as was found in the top-generating renewable energy countries globally . 29
In several important aspects, first, our study contributes to the body of knowledge through integrating a novel MPI in the GEP–FDI nexus. This provides an expanded perspective on the GEP–FDI linkages beyond what is currently known, as existing literature has established a direct connection between GEP and FDI. In addition, the study examined the heterogeneity in their impacts to achieving carbon neutrality and addressing CEP. Second, to be the first to investigate this relationship in high-income nations using longitudinal data of nations (i.e. 1995–2022), our analysis comprises an extensive collection of green energy climate policy indicators (energy efficiency and renewable energy promotion (REP)). Third, by employing the Driscoll–Kraay fixed-effects model and panel structural vector autoregression (SVAR), the research provided an answer to the question concerning which one between GEP, MP, and FDI do have more transmission effects on CEP and carbon neutrality. For policy makers and planners, answering this question is essential to accomplishing SDGs 7, 13, and 17. Fourth, the approaches used in previous studies overlooked variable heterogeneities, collinearities, and endogeneity, which are crucial for expanding and strengthening the robustness of energy transition theory. This study's next sections are arranged as follows: literature review (second section), methodology and data (third section), empirical results (fourth section), and finally, conclusions, and policy recommendations.
Review of scientific literature and theoretical analysis
Green energy climate policies and FDI
While there is a limited amount of research on the relationship between green energy climate policies and FDI, the studies in this corpus do not provide the mechanisms through which these variables are linked. For instance, some studies have proven the existence of bidirectional causality between renewable energy utilization and FDI within South Africa.
22
Similarly, Wen et al.
12
revealed that renewable energy consumption and foreign capital flows have bidirectional causality in South Africa and several other countries in Asia. Additionally, Abbas et al.
30
found that green energy innovations enhance FDI in China, Russia, India, Brazil, and South Africa. Leitão et al.
31
indicated that renewable energy consumption increases FDI in Visegrad countries, and Pan et al.
21
found that carbon finance policies attract FDI in China. Zhang and Kong
20
indicated that GEP enhance outward FDI at the firm level in China. Bidirectional causality between energy efficiency and FDI was confirmed by Panait et al.
13
in Europe. Although FDI as per cent of GDP in high-income nations is still declining, nothing is known about how GEP affects FDI as per cent of GDP. The additional gap in research is examining the mechanisms by which GEP functions in relation to FDI, particularly in relation to CEP and carbon neutrality. This study aims to expand on this area by examining data on high-income nations from 1995 to 2022, highlighting the need to consider pathways when linking GEP and FDI. From these findings, we formulate the link between GEP and FDI as the first hypothesis. H1: Green energy policies enhances FDI.
Relevant mechanisms for GEP and FDI
Macroeconomic indicators mediating effects in the nexus between green energy climate policies and FDI
Concerning economic growth, in recent years, multiple studies have demonstrated evidence supporting a favourable consequence of climate change initiatives towards economic growth.23,29,32–35 Furthermore, a diversity of research has consistently demonstrated that FDI is enhanced by economic growth; for instance, Alshamsi and Azam 36 in the United Arab Emirates revealed that a market size approximation of GDP per person has a notably beneficial effect on FDI inflows. GDP attracts FDI in China; as mentioned by Encinas-Ferrer and Villegas-Zermeño, 37 GDP and FDI have bidirectional causality (Sijabat 38 in ASEAN; Talwar and Srivastava 15 in 10 countries). At this point, the gap arises because the total MP is much more than just GDP growth. It encompasses GDP growth, inflation, employment, exchange rates, and lending rate. 39 A policy might boost GDP growth but negatively affect other macroeconomic variables, ultimately making it less attractive for FDI than initially suggested by the growth numbers alone. Therefore, a comprehensive analysis is required.
About employment, recent research has extensively revealed a positive impact of climate change mitigation measures and employment. For instance, Dogan et al. 40 found that the adoption of renewable energy technologies in South Asian economies significantly boosts job opportunities. Similarly, Cui et al. 41 observed that green finance initiatives contribute to increased employment prospects in China. Further evidence from Liu et al. 42 demonstrated that the implementation of sustainable industrial technologies in China helps reduce unemployment rates. In addition, Saboori et al. 43 discovered that renewable energy adoption contributes to rising employment rates in certain US states. This finding aligns with research by Arvanitopoulos and Agnolucci 44 in the United Kingdom and Khobai et al. 45 in South Africa, which also identified similar positive effects. Additionally, Proença and Fortes 46 reported a strong relationship between the volume of electricity generated and job creation within the European Union (EU). About energy efficiency, Chen et al.47,48 highlighted that energy efficiency, measured as total energy consumption relative to GDP, contributes to job creation in China. Similarly, Hartwig et al. 49 and Cantore et al. 50 emphasized that improvements in energy efficiency, particularly through reduced energy costs, promote employment growth in Germany and Africa, respectively. In the construction sector, energy efficiency has significantly boosted job opportunities in various regions, including the United States, 51 Portugal, 52 and Germany. 53 In Greece, Mirasgedis et al. 54 demonstrated that enhancing energy efficiency in buildings leads to increased employment. Likewise, Lehr et al. 55 established a positive correlation between energy efficiency, renewable energy, and job creation in Tunisia. Another side, research consistently shows that increased employment opportunities play a significant role in attracting FDI, as they facilitate trade. This relationship has been highlighted in numerous review studies, including those by Xiong and Wan, 56 Yu and Li, 57 and Bai et al. 58 At present, while existing literature highlights the positive effects of green energy climate policies on FDI through increased employment, it falls short of addressing the broader macroeconomic implications of these policies. This gap is significant because a more holistic understanding of MP could provide nuanced insights into how these policies influence FDI beyond just employment metrics.
Regarding the link between inflation and climate change mitigation measures, researchers pointed out decreasing effects on inflation. For example, focusing on renewable energy in the United States, as shown by Akan, 59 policies have negative effects on interest rates and inflation. Again, Dinçer et al. 60 revealed that renewable energy investment reduces general price levels in Turkey. Some scholars pointed out that the main cause of inflation is an increase in energy prices, and the sustainable solution is promoting renewable energy policies.61,62 Additionally, a number of studies have consistently demonstrated that a high inflation rate prevents FDI (see, for instance, Ajide and Ibrahim 87 ). In Turkey, Coskun 16 and in United States, Trevino and Grosse 63 discovered an inverse connection between the rate of inflation and FDI. At this stage, inflation alone cannot fully capture the broader macroeconomic framework of countries, highlighting a gap in assessing the impact of GEP. To close this gap, an accurate measure of MPI accounting for the various macroeconomic indicators is needed in GEP and FDI nexus.
Concerning exchange rate, Deka et al. 19 in Brazil, argued that REP causes currency appreciation. Deka et al. 64 in seven emerging countries found that REP boosts the appreciation of the exchange rate. According to Deka and Dube, 18 in Mexico, renewable energy development decreases exchange rates. Deka and Cavusoglu 65 in Organization for Economic Co-operation and Development found that REP promotes currency appreciation.
Based on the findings from previous studies, a single indicator of MP cannot fully capture the broader macroeconomic framework of countries, highlighting a gap in assessing the impact of GEP. Therefore, this study requires a comprehensive analysis. Hence, based on the literatures presented above, we establish the relationship between GEP and FDI as our second hypothesis. H2: Green energy policies enhances FDI through rising macroeconomic performance.
Green energy climate policies, FDI, carbon neutrality, and CEP
In previous studies, where carbon neutrality was expressed as CO2 emissions, many scholars showed that the adoption of renewable energies promotes carbon neutrality (30,34,66,67 in five BRICS countries; Wen et al. 68 in five South Asian countries including Bangladesh, India, Pakistan, Sri Lanka, and Nepal; and 69,70). Energy efficiency was also found to have a good impact on carbon neutrality.47,48,71–73 Another side, recent studies have looked at the link between energy poverty and energy-related climate policies, and some results point to a reduction in energy poverty as a result of these policies.74–77
Concerning FDI, many previous studies have demonstrated that FDI increases CO2.78–81 Also, several studies have pointed towards how FDI lessens poverty in energy.82–86 After examining the previous literature, it is clear that the studies did not compare the impact of GEP and FDI on carbon neutrality and CEP alleviation, see the summary of previous literature in Table 1. Hence, there is a need to fill this gap in the literature in order to provide an effective solution to the twin energy problems of carbon emissions and energy poverty. From the above findings, we formulate the link between GEP, carbon neutrality, and CEP as the third hypothesis. Again, we formulate the link between FDI, carbon neutrality, and CEP as the fourth hypothesis. H3: Green energy policies enhance carbon neutrality and clean energy poverty alleviation. H4: FDI weakens carbon neutrality and enhances energy poverty alleviation.
Summary of empirical studies on the nexus among green energy policies, FDI, energy poverty and carbon neutrality.
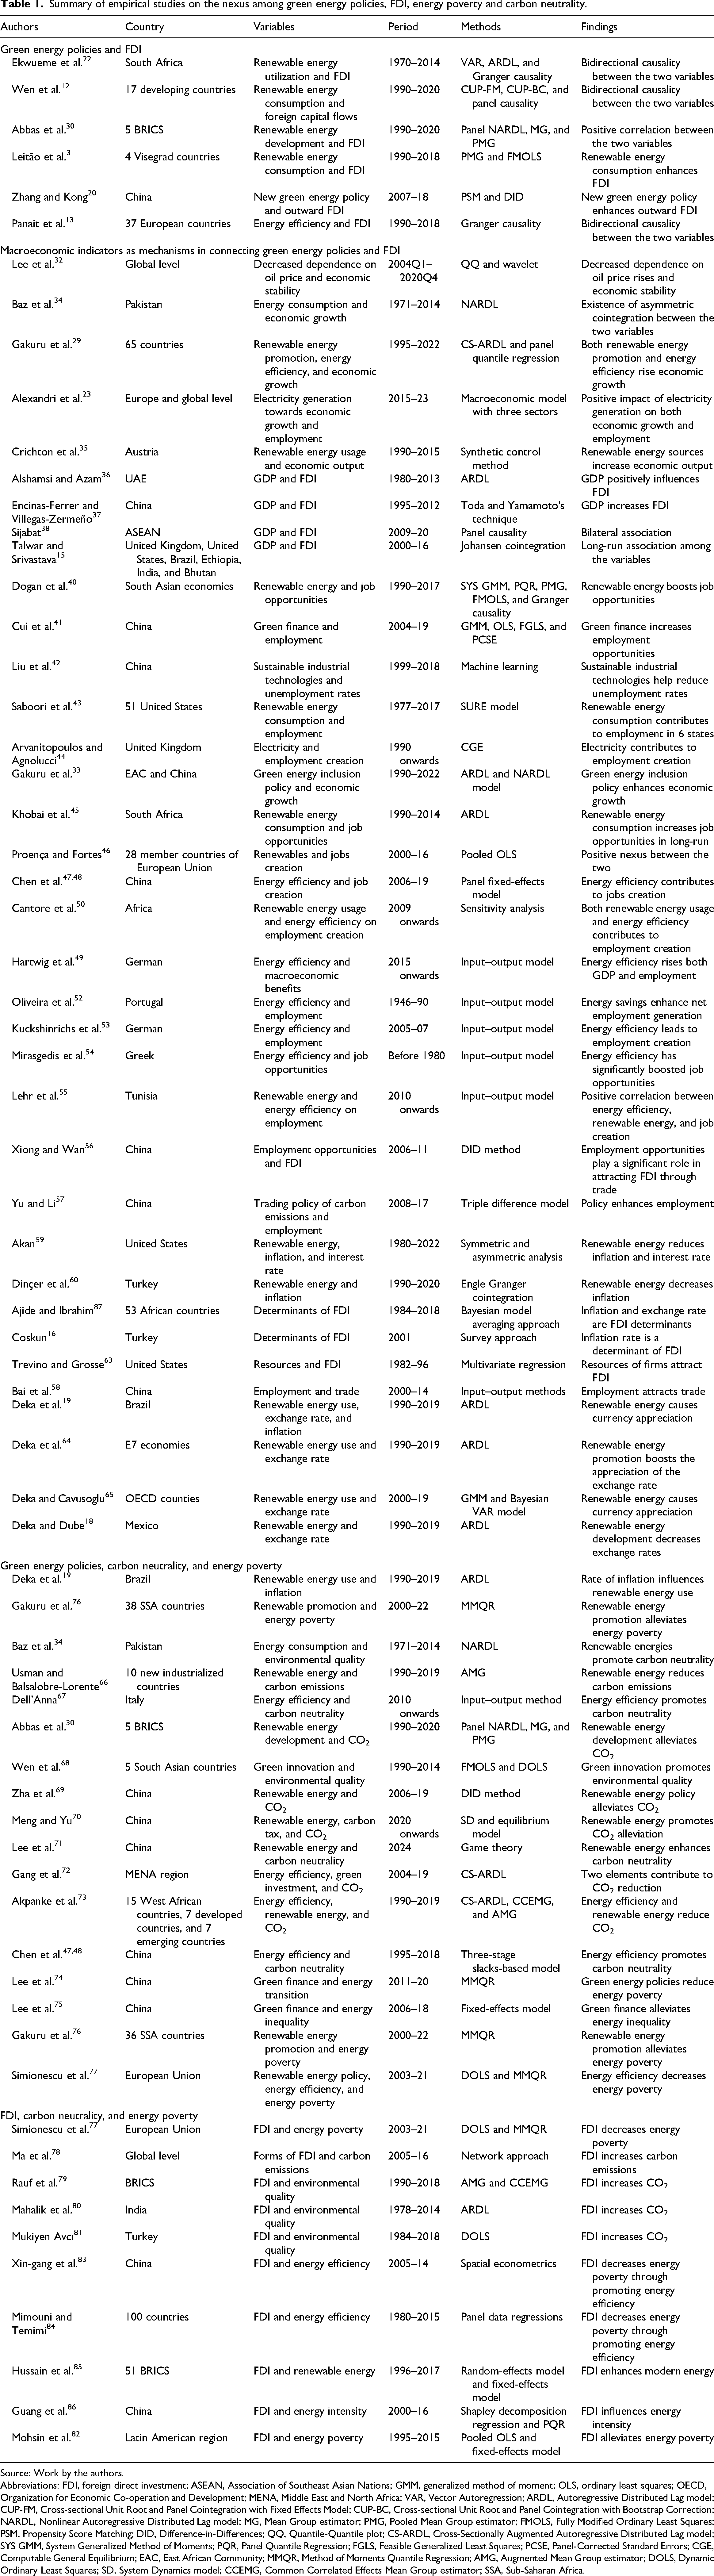
Source: Work by the authors.
Abbreviations: FDI, foreign direct investment; ASEAN, Association of Southeast Asian Nations; GMM, generalized method of moment; OLS, ordinary least squares; OECD, Organization for Economic Co-operation and Development; MENA, Middle East and North Africa; VAR, Vector Autoregression; ARDL, Autoregressive Distributed Lag model; CUP-FM, Cross-sectional Unit Root and Panel Cointegration with Fixed Effects Model; CUP-BC, Cross-sectional Unit Root and Panel Cointegration with Bootstrap Correction; NARDL, Nonlinear Autoregressive Distributed Lag model; MG, Mean Group estimator; PMG, Pooled Mean Group estimator; FMOLS, Fully Modified Ordinary Least Squares; PSM, Propensity Score Matching; DID, Difference-in-Differences; QQ, Quantile-Quantile plot; CS-ARDL, Cross-Sectionally Augmented Autoregressive Distributed Lag model; SYS GMM, System Generalized Method of Moments; PQR, Panel Quantile Regression; FGLS, Feasible Generalized Least Squares; PCSE, Panel-Corrected Standard Errors; CGE, Computable General Equilibrium; EAC, East African Community; MMQR, Method of Moments Quantile Regression; AMG, Augmented Mean Group estimator; DOLS, Dynamic Ordinary Least Squares; SD, System Dynamics model; CCEMG, Common Correlated Effects Mean Group estimator; SSA, Sub-Saharan Africa.
Theoretical analysis
Referring to the idea of Wang et al., 88 a theoretical analysis was conducted to provide a foundation for designing the conceptual framework (Figure 2). First, environmental Kuznets curve (EKC) is a theoretical model that suggests an inverted U-shaped relationship between environmental degradation and economic development. Initially, as an economy grows, environmental degradation tends to increase due to industrialization and urbanization. However, after reaching a certain level of income per capita, the trend reverses, and further economic growth leads to improved environmental quality. 89 This may occur because developed societies being examined in this study often have more resources to invest in cleaner technologies, stricter environmental regulations, and greater public awareness of environmental issues. Referring to this study, the EKC implies that MP can ultimately contribute to environmental sustainability, and it also highlights the need for effective policies to manage the transition.
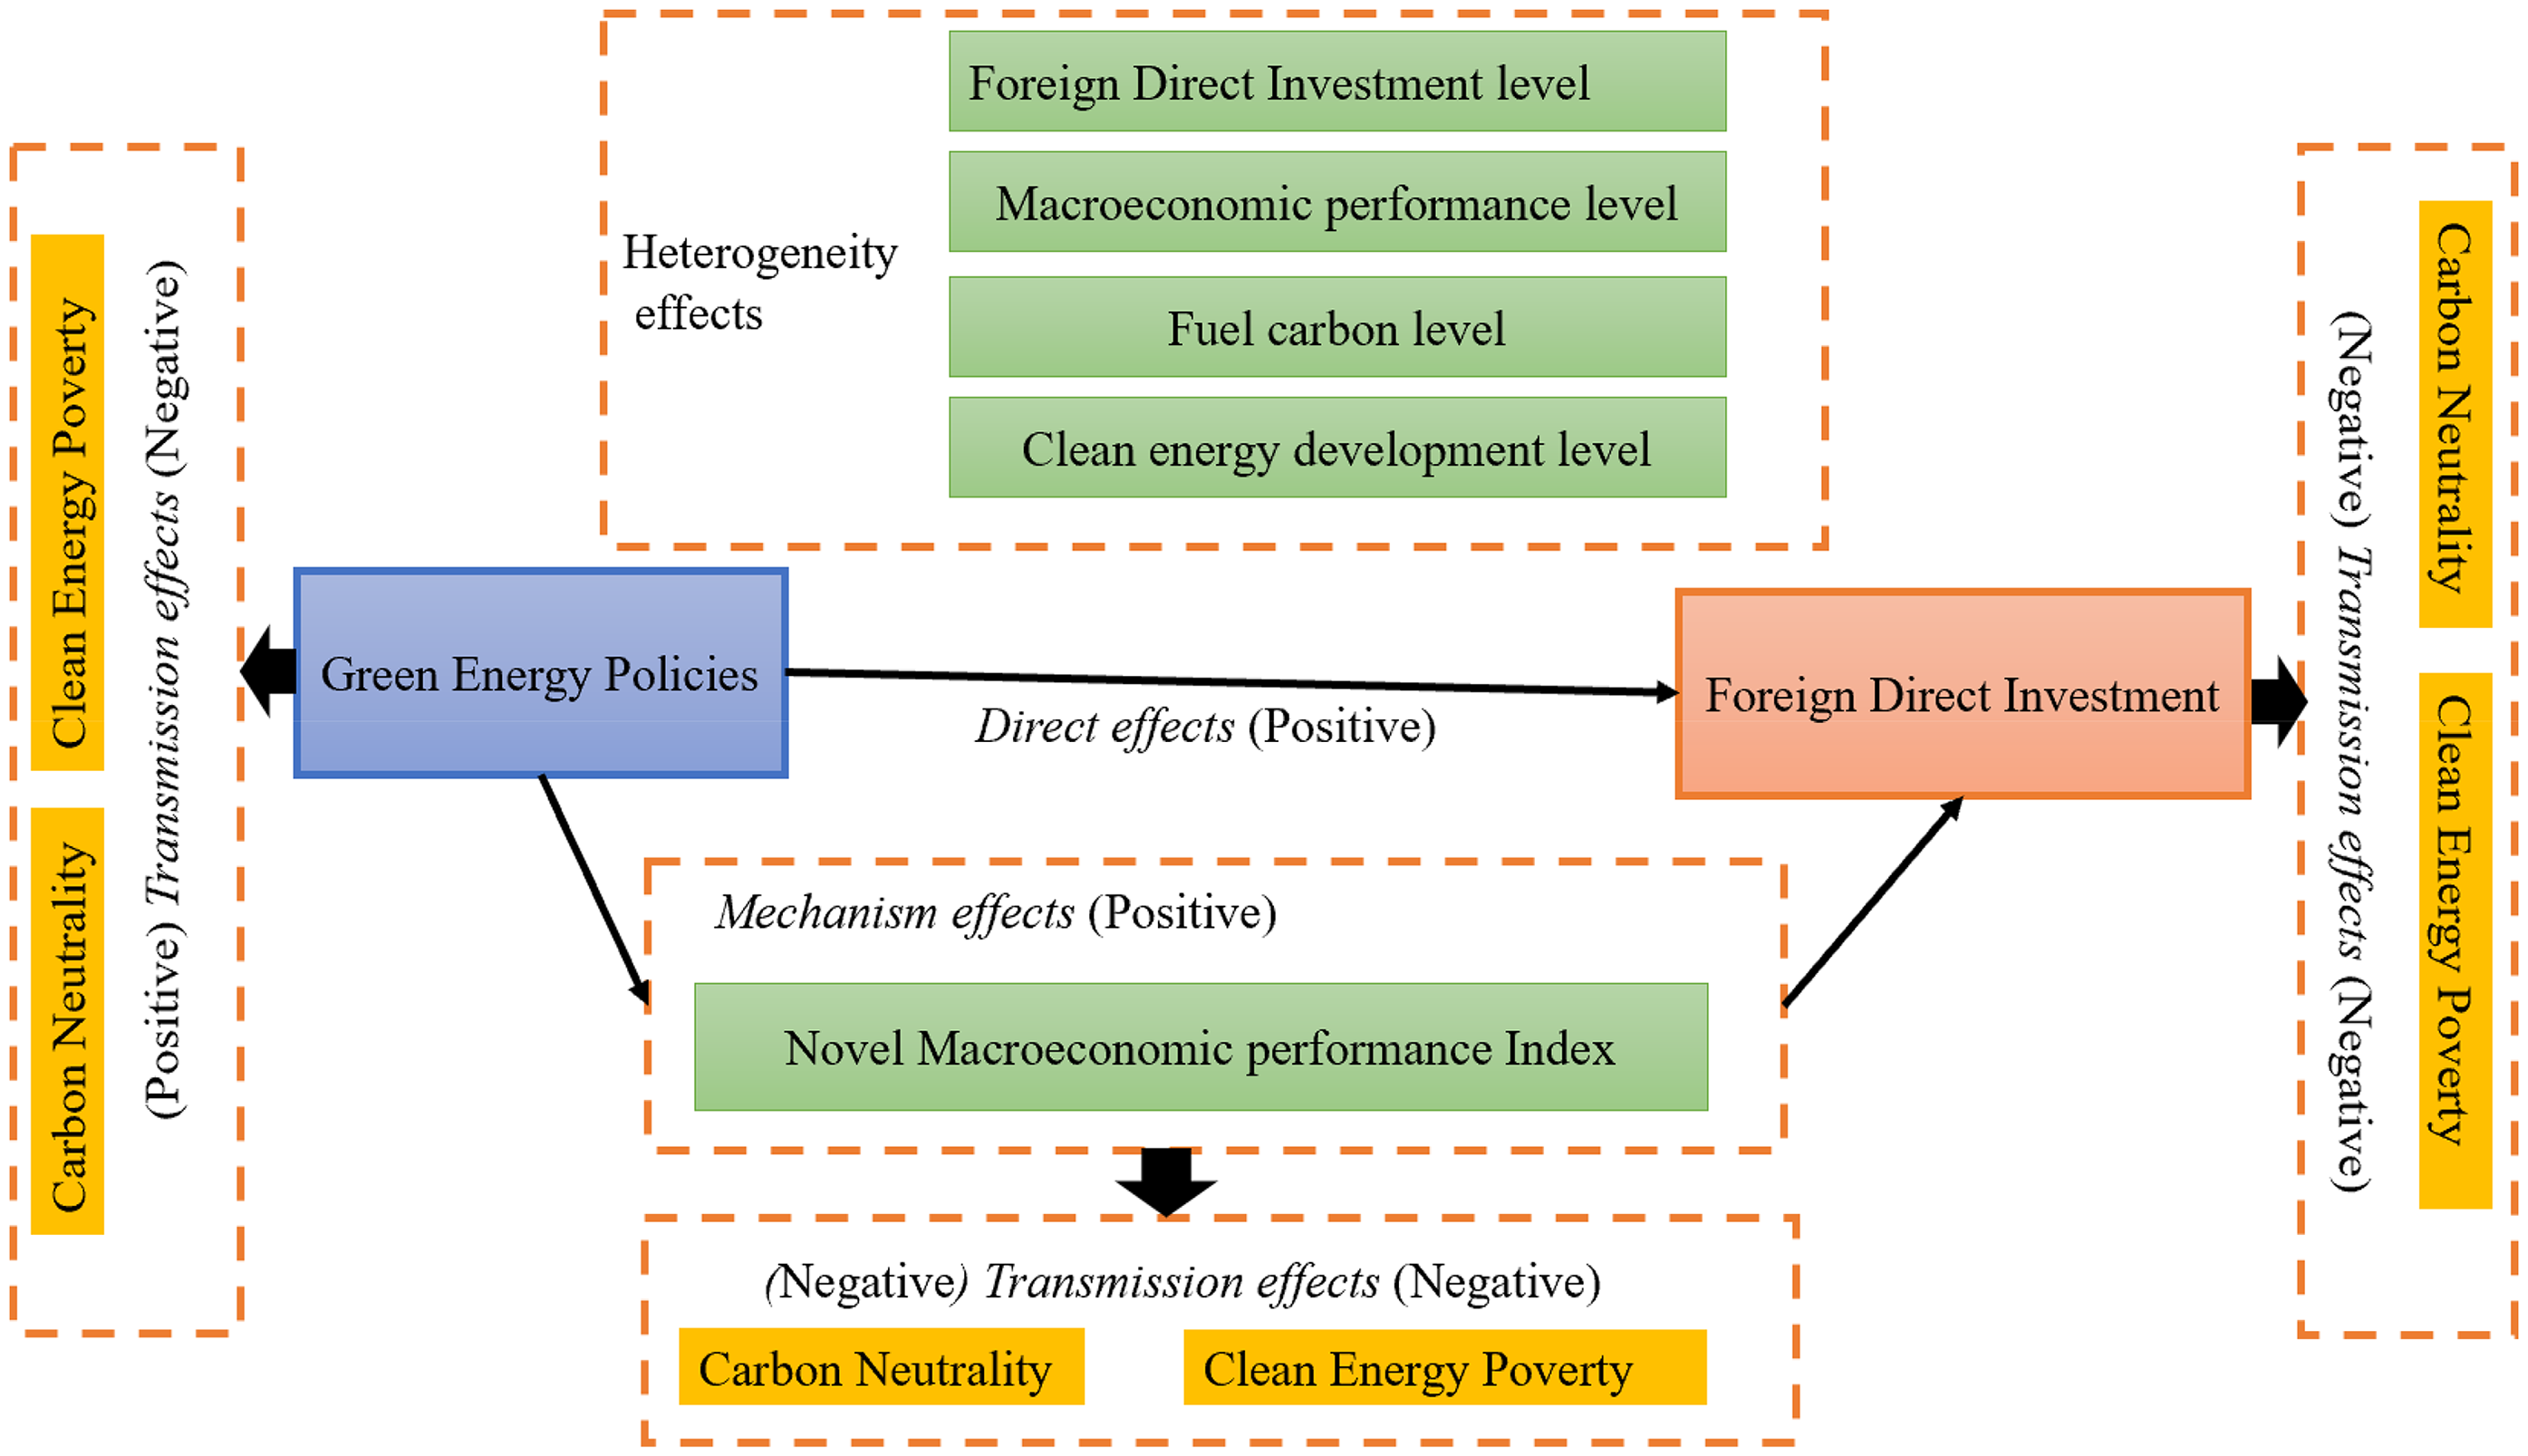
Conceptual framework indicating potential pathway for FDI and green energy policies, their consequences on the carbon neutrality and clean energy poverty. The novel macroeconomic performance index = (ΔGDP growth + ΔEmployment rate + ΔTrade intensity per capita) − (ΔInflation rate + ΔLending rate + ΔExchange rate). FDI, foreign direct investment.
Second, the sustainable development theory posits that development should meet the needs of the present without compromising the ability of future generations to meet their own needs. This theory emphasizes a balanced approach to economic growth, social inclusion, and environmental protection, recognizing that these three pillars are interdependent. 90 It advocates for policies and practices that promote resource efficiency, reduce environmental degradation, and enhance the quality of life for all, while ensuring that economic activities do not deplete natural resources or harm ecological systems. This aligns with this study as the policy recommendations intend to provide new insights regarding promoting the transition towards a low-carbon economy through promoting clean energy, FDI, and MP.
Third, the Porter hypothesis posits that environmental regulations can enhance a firm's competitiveness by encouraging innovation and efficiency. Proposed by economist Michael Porter, it suggests that well-designed environmental policies can lead to reduced production costs and improved resource efficiency, ultimately driving technological advancements. 91 This hypothesis challenges the traditional view that regulations impose burdens on businesses, arguing instead that they can stimulate economic growth and create a competitive advantage, especially for firms that proactively adapt to regulatory challenges. This theory supports this study through examining the impacts of GEP on MP in higher-income countries.
Fourth, the structural theory of poverty posits that poverty is not merely the result of individual failings or poor choices, but rather a consequence of systemic factors and institutional structures that perpetuate economic inequality. This theory emphasizes the role of social, economic, and political frameworks that create barriers to opportunities, such as inadequate education, discrimination, and lack of access to resources. 92 This study incorporates the structural theory of poverty in the field of energy economics because poverty in energy access is often a result of institutional structures rather than individual choices.
Fifth, the pollution halo hypothesis suggests that strict environmental regulations in a country can actually help businesses become more competitive. This happens because these regulations encourage companies to innovate and develop cleaner technologies. 93 As a result, countries with strong environmental policies can attract investment and industries that prioritize sustainability, leading to economic benefits and a cleaner environment. In simple terms, it means that good environmental laws can make businesses better and more appealing. This study verifies this hypothesis by examining whether FDI decreases CO2 emissions.
Sixth, the pollution haven hypothesis means that companies might move their factories or operations to countries where environmental laws are weak or not enforced. This is done to save money on pollution control costs and maximize profits. Essentially, it suggests that countries with less strict environmental regulations can attract industries that produce a lot of pollution, leading to more environmental harm in those areas. 93 This study verifies this hypothesis by examining whether FDI increases CO2 emissions. Therefore, considering the above theoretical analysis, the E3 framework 28 initiated by Cambridge econometrics was adopted. It emphasizes the need to balance economic development with environmental protection by analysing how energy policies impact economic performance while considering environmental consequences as recently claimed by Wang et al. 94 It incorporates many theories such as EKC, sustainable development theory, energy transition theory, Porter hypothesis, structural theory of CEP, and pollution halo/haven theories. This E3 model was employed in constructing conceptual framework and empirical models. Analysing the effects of green energy climate policies on FDI patterns while accounting for CEP and environmental consequences has found E3 model helpful as indicated by the following model.
As a matter of fact, for improving results of the previous study, another study is needed to provide a deeper understanding by analysing the dynamic effects of shocks and changes in each variable in order to clearly identify the causal relationship and factors that explain more variability in carbon neutrality and CEP. Lastly, the previous studies have not been able to give an answer to the twin problems of energy (carbon emissions and CEP). As a crucial aspect, the literature on development needs to compare the consequences of both green climate policies and FDI on clean energy-related poverty and carbon neutrality. This is the present study's necessity as the above hypotheses are linked to the mentioned literature gaps. The conceptual model (Figure 2), summarizes and puts together all mechanisms from green energy climate policies to FDI and carbon neutrality implications using an analytical framework of the study.
Data details and econometrics model
Summarization of the data
This paper relied on World Bank database data that has changed throughout time, spanning from 1995 to 2022.
24
The chosen nations comprise 77 high-income countries (Appendix 1). The mediating variable in this study is the novel MPI quantified by this study. This metric was quantified by improving the already existing MP metrics such as the misery index measure initiated by Gakuru and Yang,
95
MPI with five indicators and economic (ECO)–MPI with seven indicators initiated by Mohanty et al.
27
Our index also improved the ECO–MPI made of six indicators pointed out by Mohanty and Sahoo.
96
Further information on the research variables is given in Table 2 and also, in Table 3, our novel index was validated or benchmarked against the established metrics. Per capita trade intensity variable in our new index implies trade-to-GDP ratio, measuring the degree to which a country engages in international trade. It was quantified as
Explanations of variables.
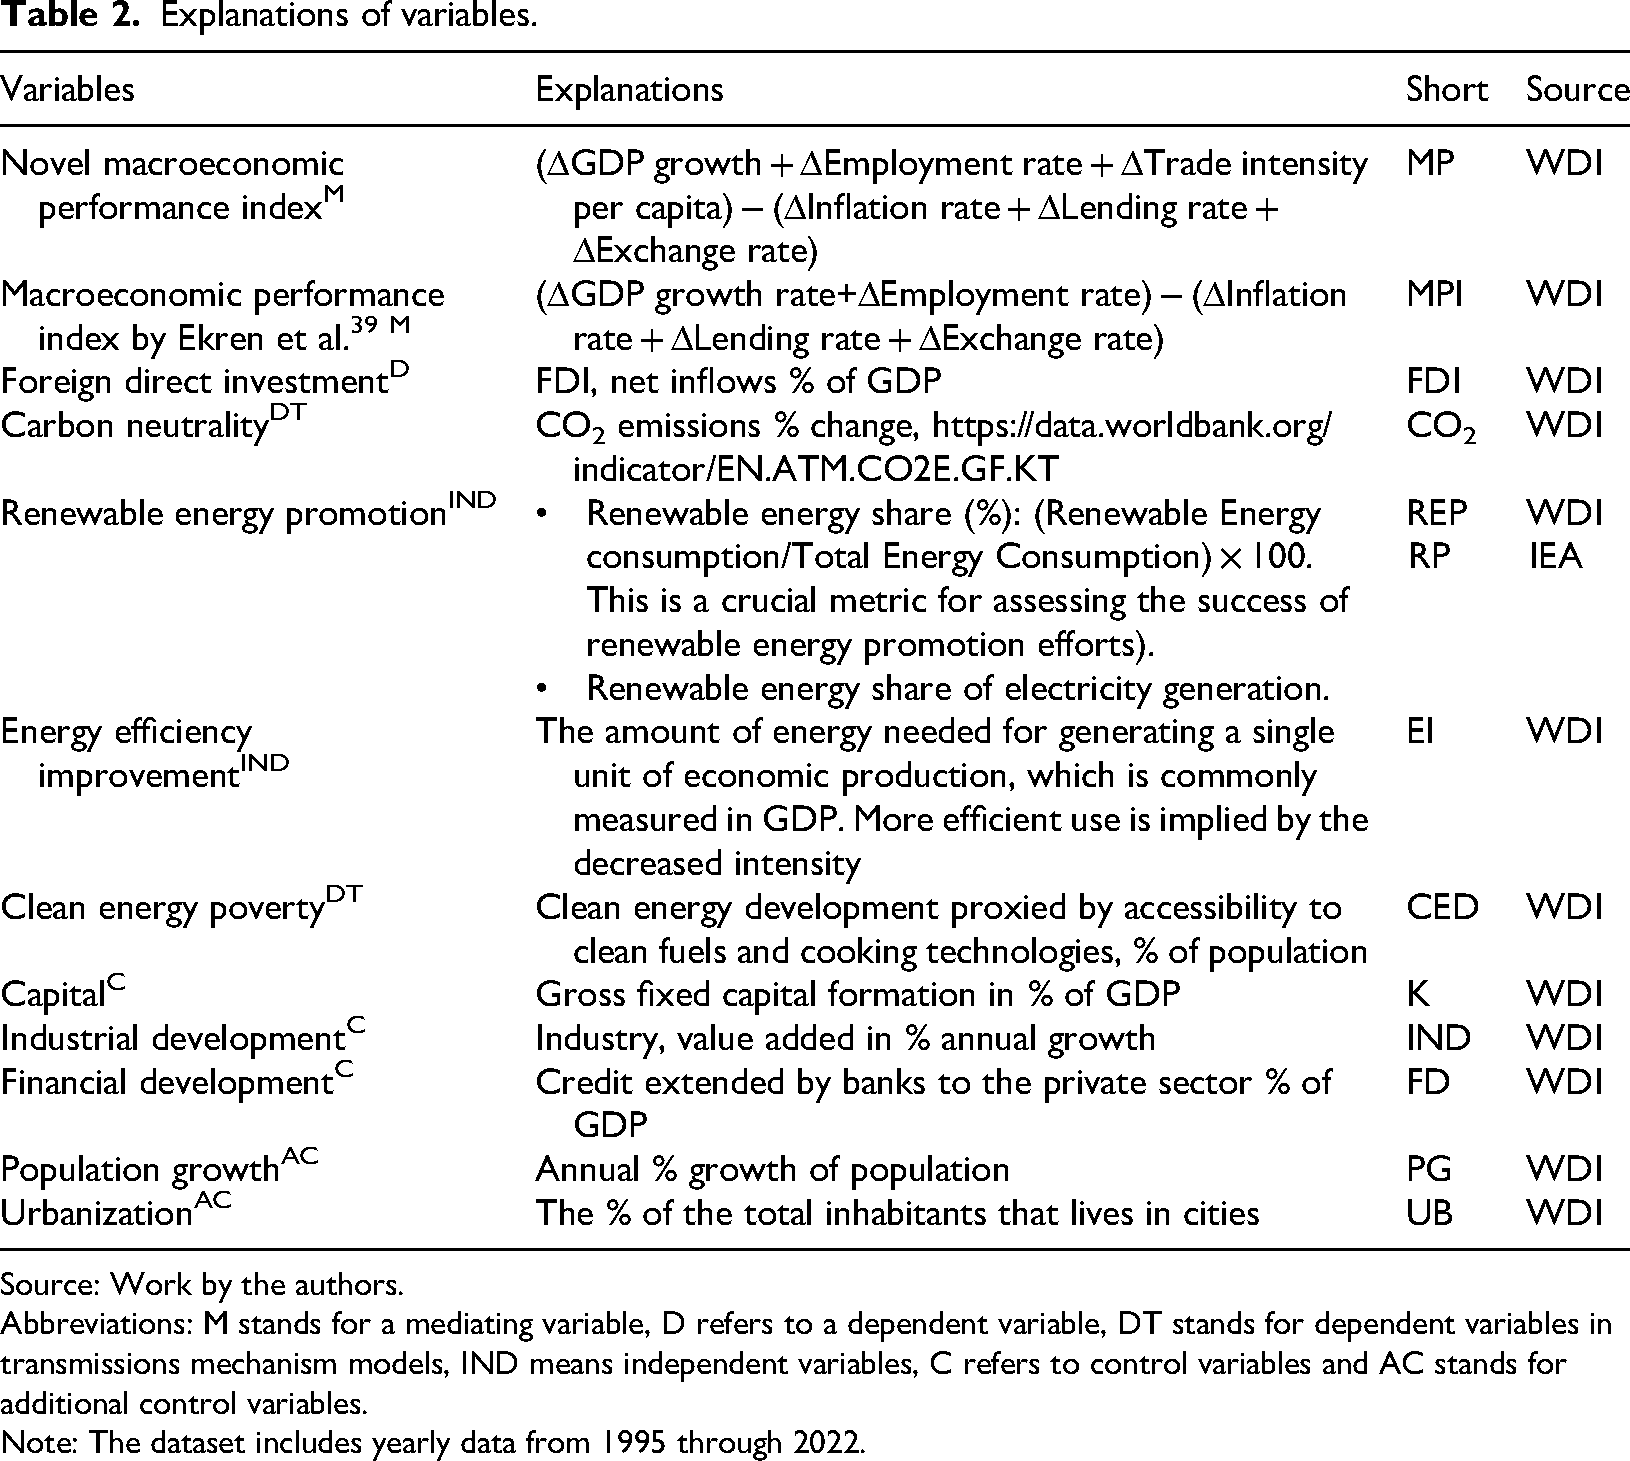
Source: Work by the authors.
Abbreviations: M stands for a mediating variable, D refers to a dependent variable, DT stands for dependent variables in transmissions mechanism models, IND means independent variables, C refers to control variables and AC stands for additional control variables.
Note: The dataset includes yearly data from 1995 through 2022.
Novel macroeconomic performance-related indices.
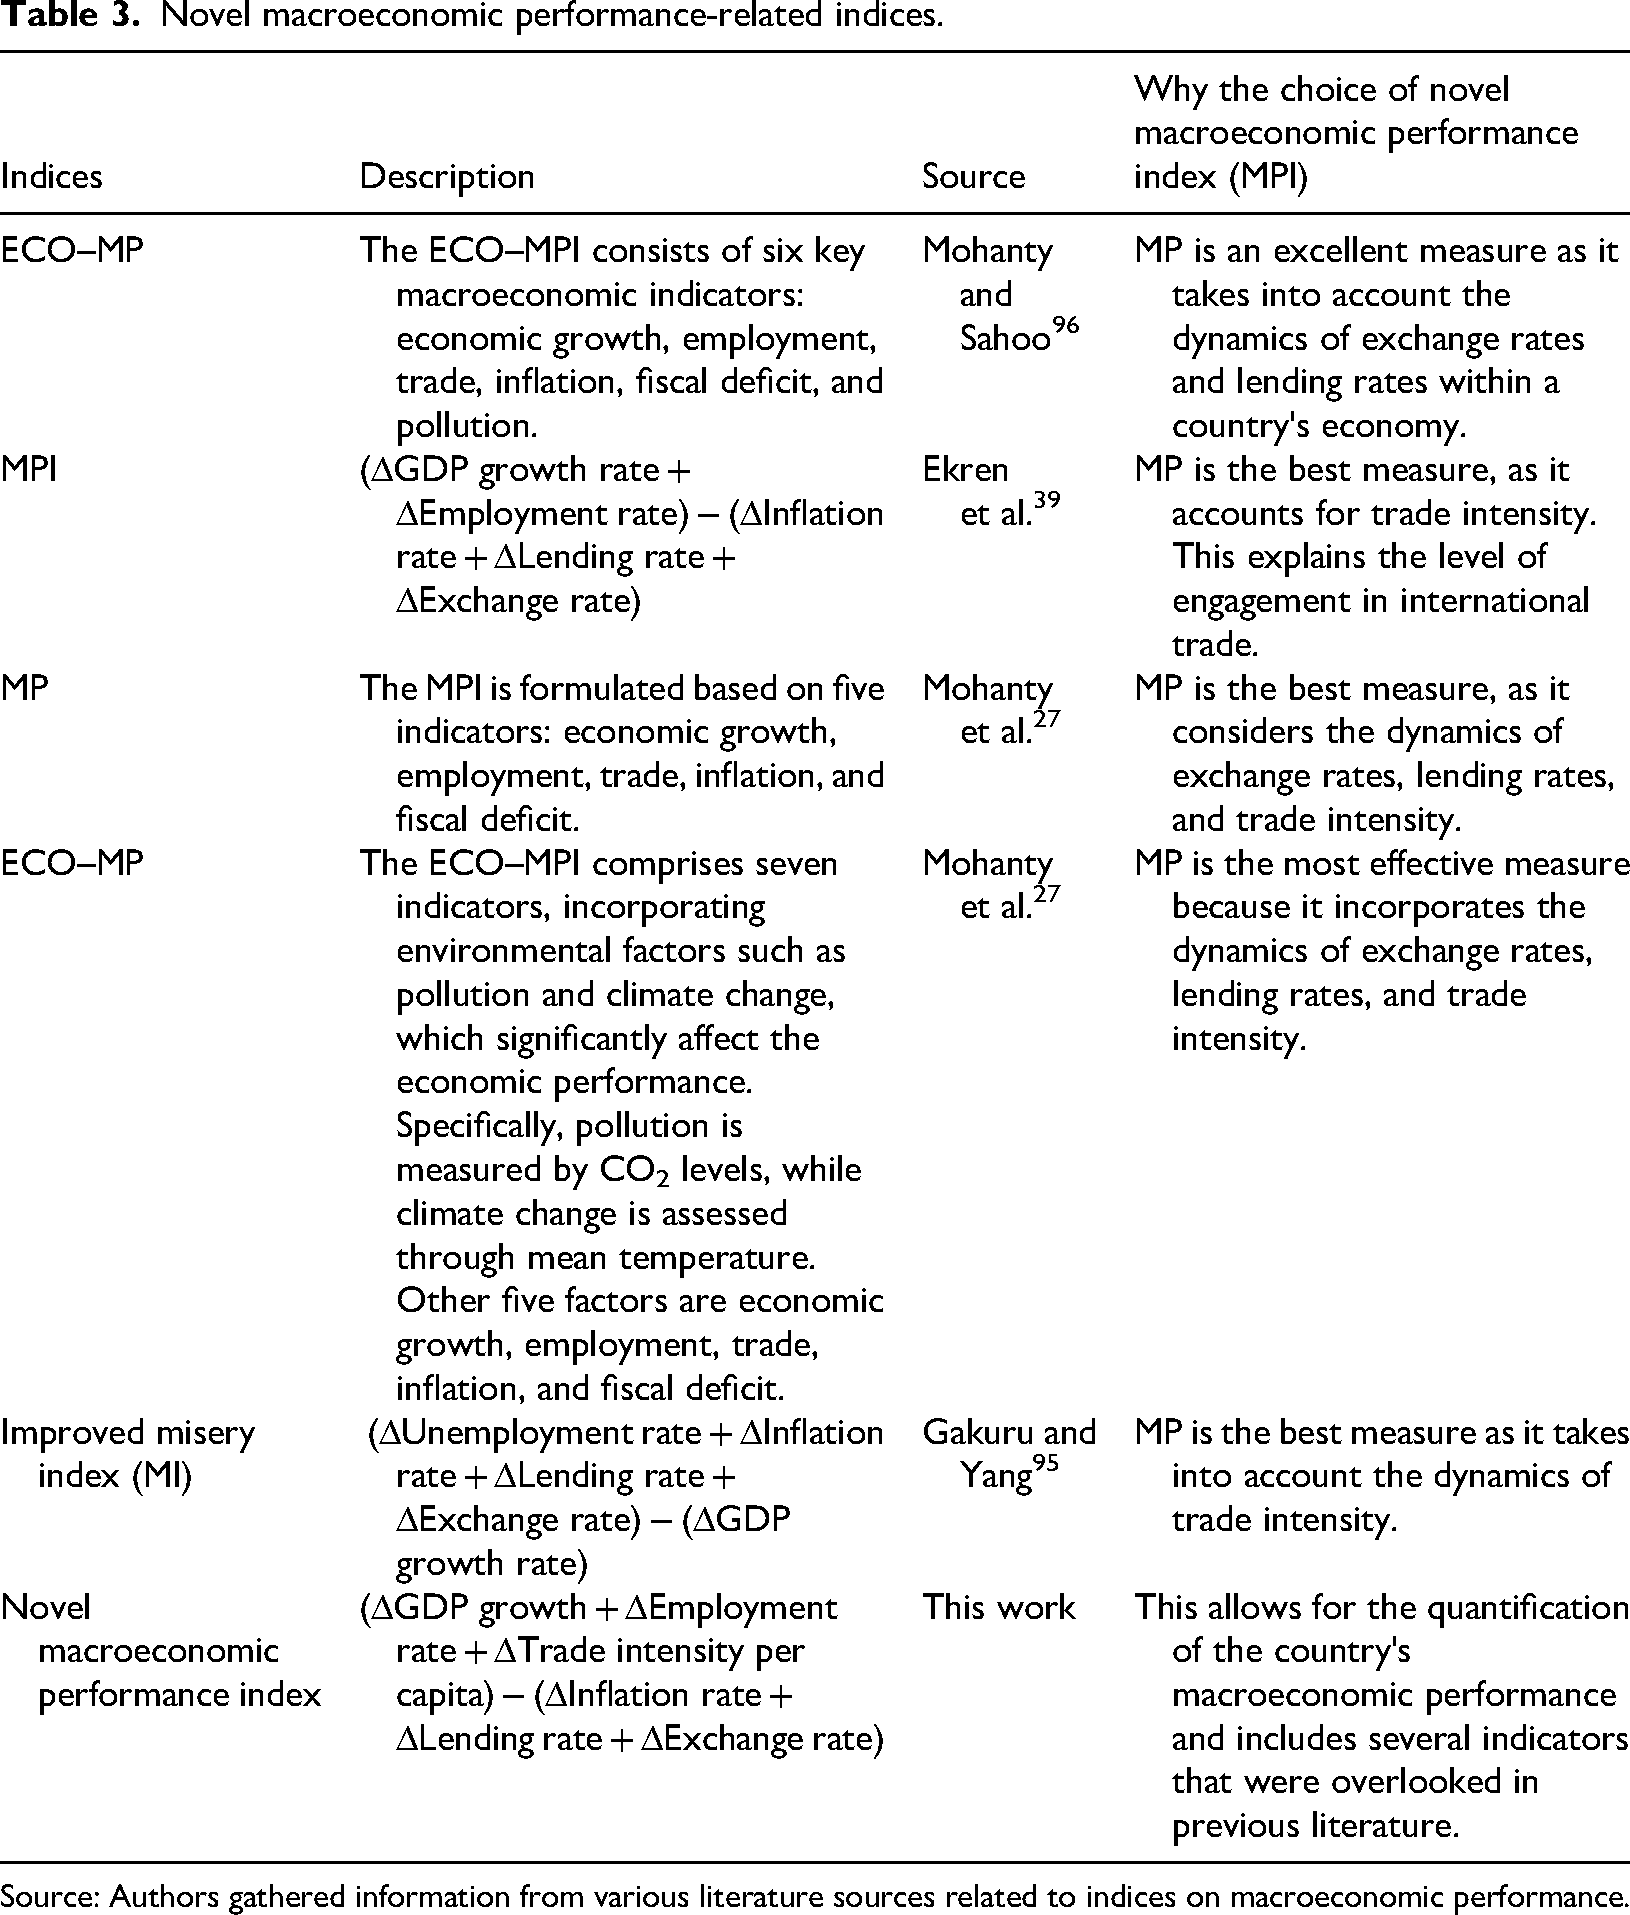
Source: Authors gathered information from various literature sources related to indices on macroeconomic performance.
Descriptive statistics.

Source: Work by the authors.
Econometrics model
The study's main focus is on the processes that green energy climate policies rely on to increase FDI. The first model examines the baseline model, the second and third models are about mechanism analysis, and the fourth and fifth models involve heterogeneous transmission mechanisms to CO2 and clean energy development (CED), respectively.
Model 1:
Model 2:
Model 3:
Model 4:
Model 5:
Model 1:
Model 2:
Model 3:
Model 4:
Model 5:
Reasons for selecting the econometric techniques used
The study utilized the method developed by Driscoll and Kraay, 101 which is recognized for its flexibility in addressing issues such as heterogeneity, heteroscedasticity, serial correlation, and cross-sectional dependence. This makes it a popular choice for panel data analysis. This approach was particularly suitable for this research due to the large number of cross-sectional units compared to the limited time periods involved. This model effectively takes into account differences across various countries and time periods, as highlighted by Acheampong et al. 102 Consequently, the results from the fixed-effects model developed by Driscoll and Kraay 101 are favoured due to their superior reliability and comprehensiveness compared to pooled ordinary least squares (OLS) and random effects models.
Pooled OLS approach analyses panel data as a whole to derive average effects, based on the assumption of uniform relationships across various entities and time periods, which may overlook important heterogeneity. 103 In contrast, a random effects model assumes that individual-specific effects are uncorrelated with the explanatory variables, a premise that may often be violated in practical situations. Additionally, the method proposed by Driscoll and Kraay 101 was favoured over generalized method of moments due to the lack of appropriate instruments within the dataset. Figure 3 presents a range of econometric methods employed for various purposes. The panel quantile regression method was chosen to address both distributional concerns and the issue of unobserved individual heterogeneity, building on the foundational research by Koenker and Bassett. 104
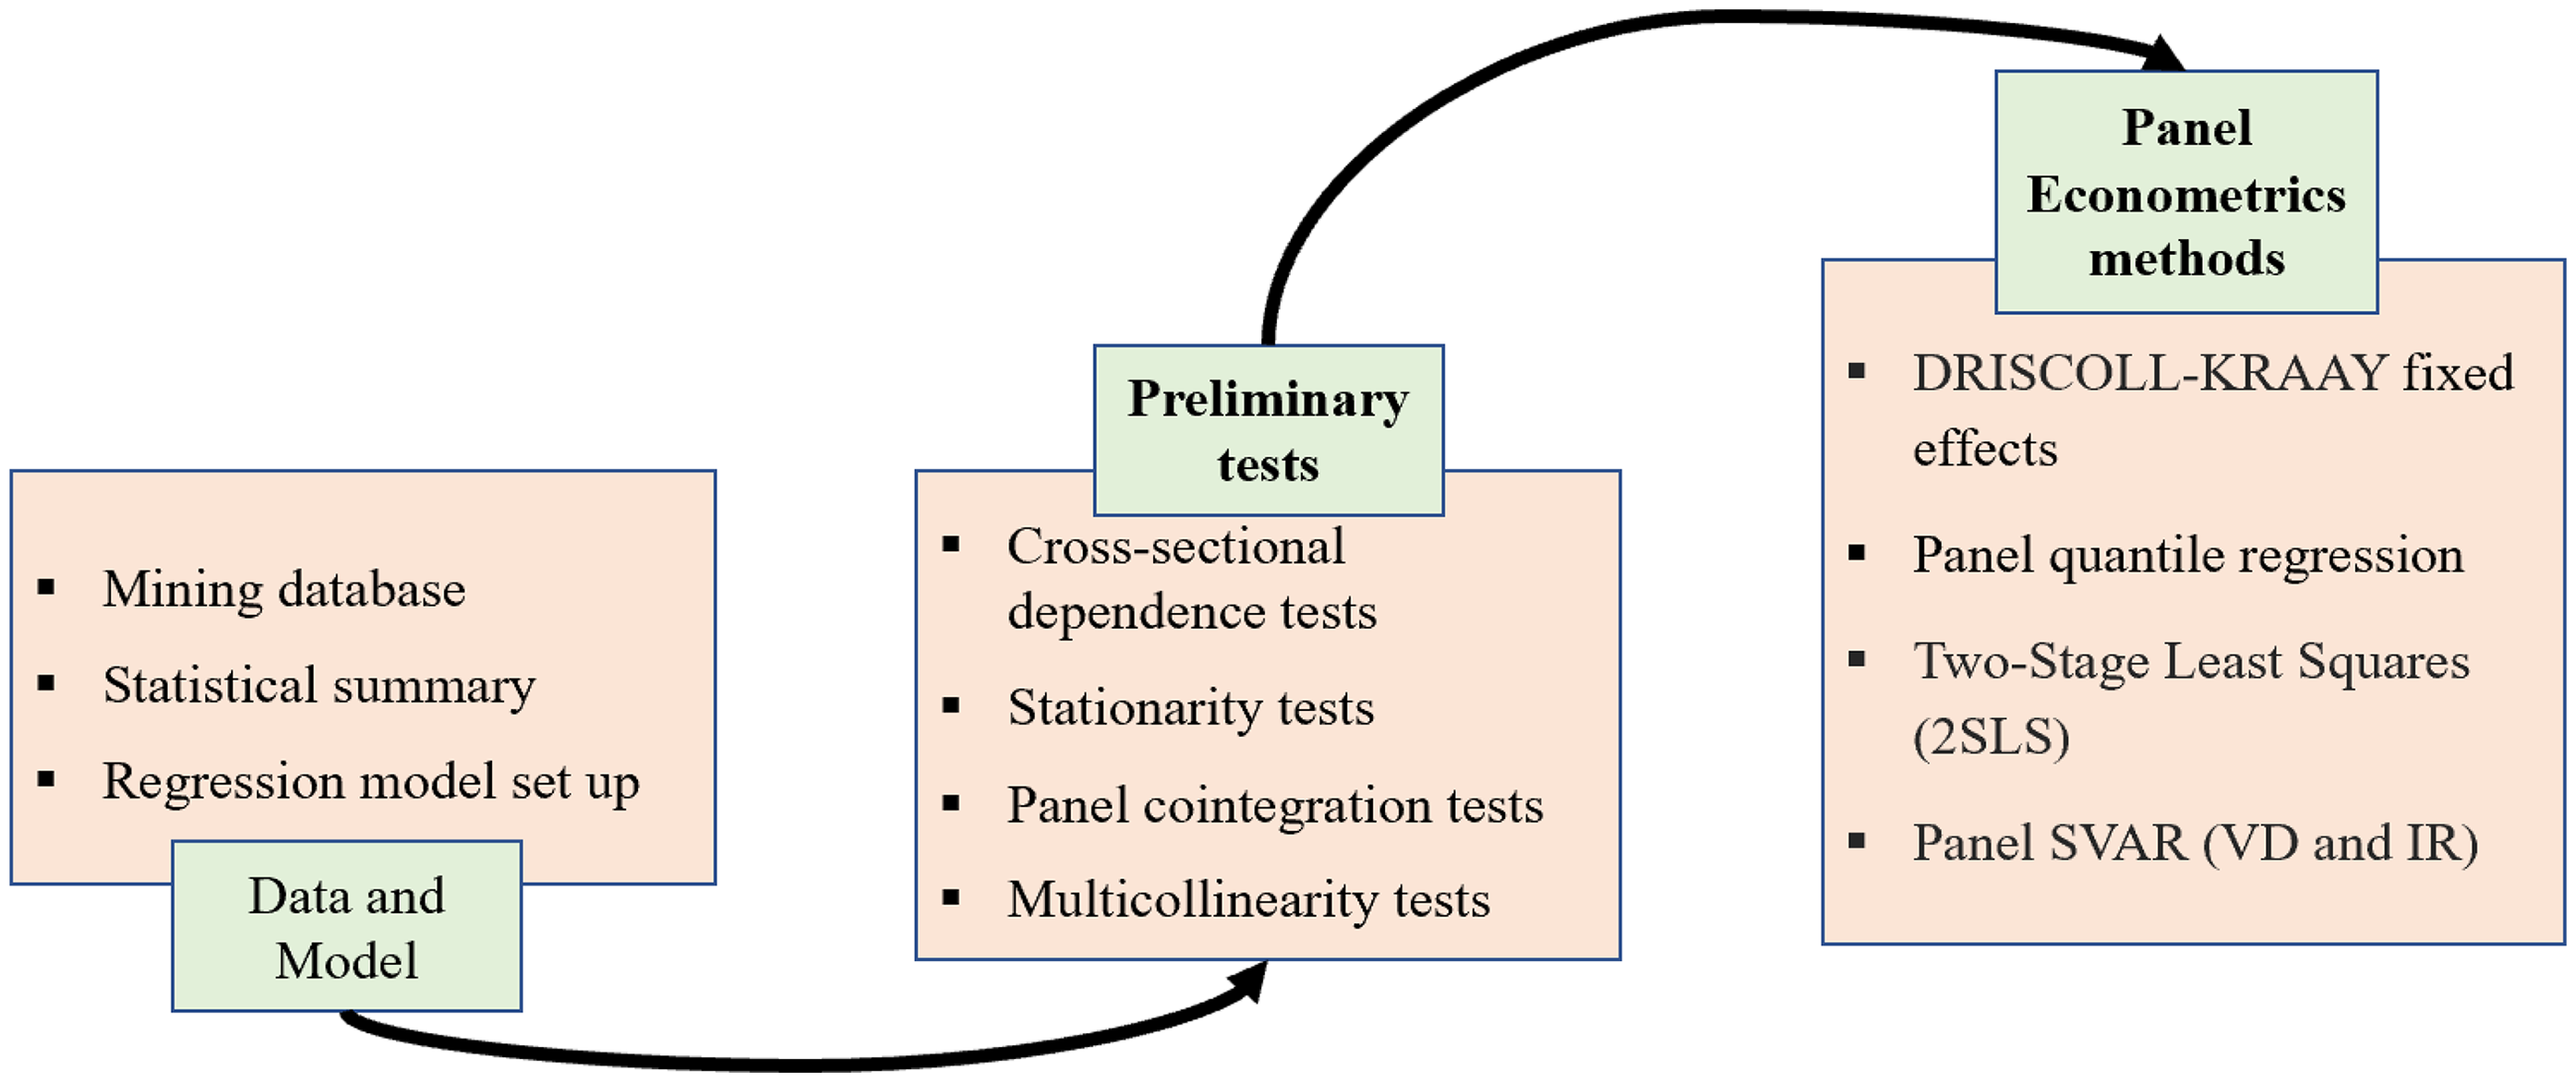
Empirical flowchart. Source: Authors’ illustration.
To tackle the issue of endogeneity, we employed a two-stage least squares (2SLS) method as outlined by Kelejian, 105 utilizing an instrumental variable (IV) approach. However, finding appropriate external IVs for foreign financial transactions was challenging. Consequently, we adopted the strategies also used by Wen et al. 106 and Mondjeli et al., 107 using lagged values of the independent variables as instruments. To confirm and compare the transmission effects, we applied the panel SVAR model, which accounts for cross-sectional dependence and can address long-term dynamic relationships, following the methodology described by Pedroni. 108 The impulse response (IR) and variance decomposition (VD) methods detailed by Lanne and Nyberg 109 were utilized to quantify the transmission effects.
The construction of the novel MPI
The novel MPI quantified with (ΔGDP growth + ΔEmployment rate + ΔTrade intensity per capita) − (ΔInflation rate + ΔLending rate + ΔExchange rate) ignored weights (Table 5). This is because, assigning different weights could introduce bias based on subjective judgments about the importance of each indicator. Equal weights eliminate this subjectivity, promoting fairness and objectivity in the evaluation process. The choice of equal weights aligns with the ideas of Okun Arthur 110 and Barro 111 who first initiated the indexes for MP even though, they named them misery indices. 95 The components of the study's index are a mix of positive indicators (e.g. ΔGDP growth, ΔEmployment rate, ΔTrade intensity per capita) and negative indicators (e.g. ΔInflation rate, ΔLending rate, ΔExchange rate). This makes it impossible to use principal component analysis when quantifying the novel MPI. Again, since the MPI is composed of both positive and negative indicators, and macroeconomic indicators are often interdependent, the entropy method adopted by Wang et al. 112 is not appropriate in this context, as it assumes that the variables are independent and only used positive indicators.
Construction of the novel macroeconomic performance index.
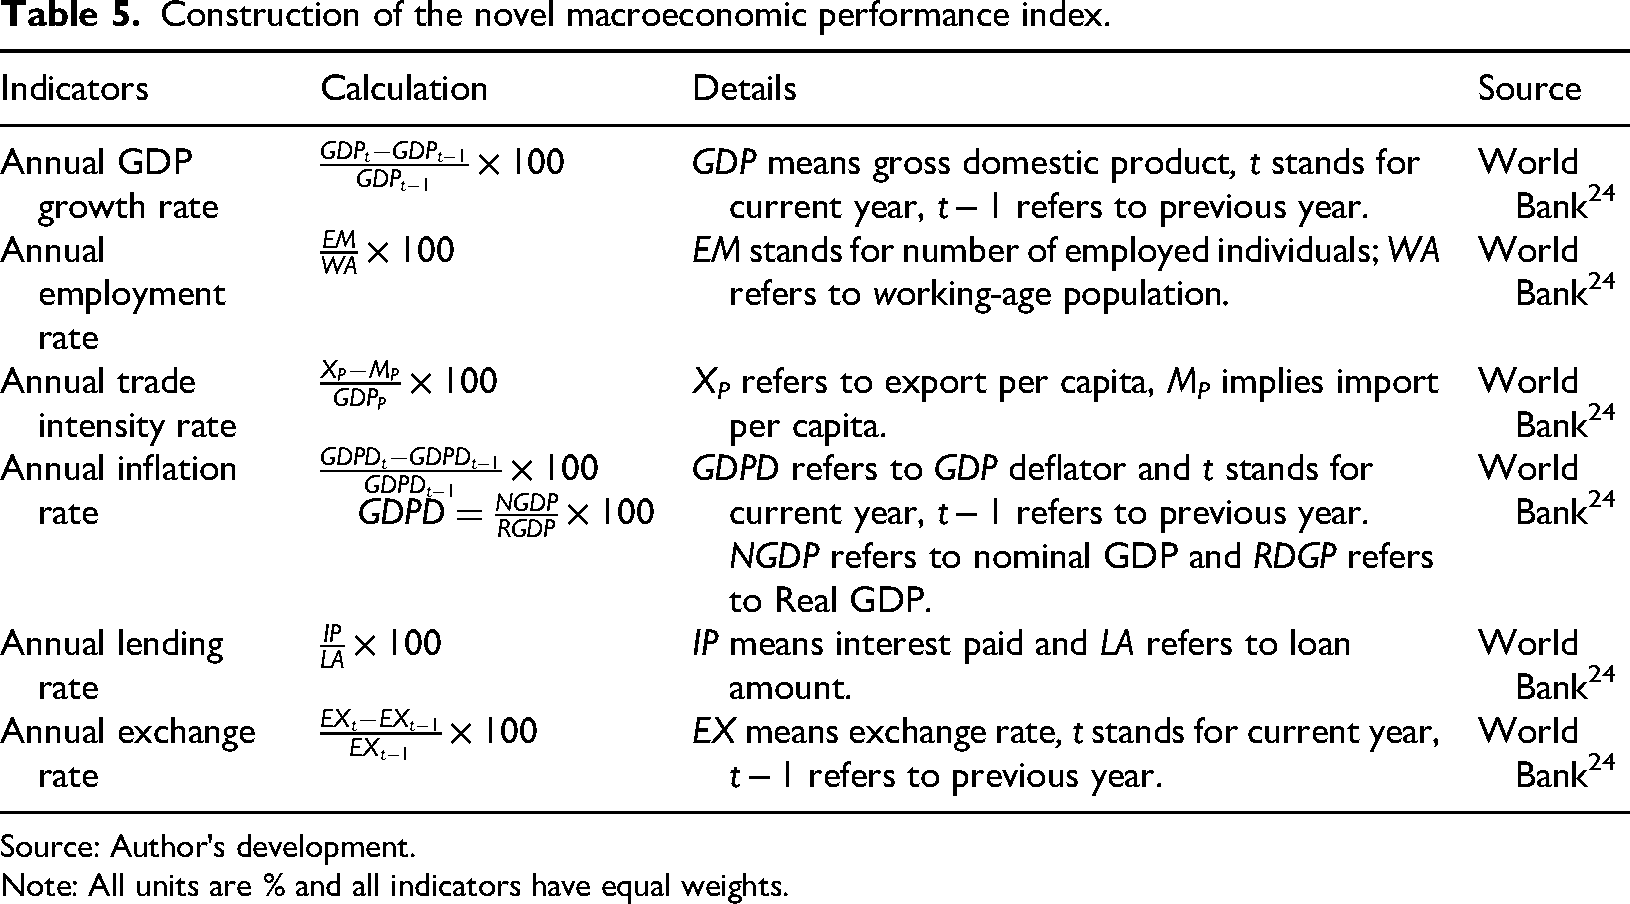
Source: Author's development.
Note: All units are % and all indicators have equal weights.
Empirical findings and discussion
Preliminary tests
Cross-sectional dependence tests
The findings in Table 6 demonstrated cross-sectional dependability, which was validated employing the cross-sectional dependence test introduced by Pesaran. 113 All of the probability values that are less than 0.05 confirm these findings. This indicates that a disturbance in one nation can influence others. This observation underscores the importance of employing second-generation unit root testing techniques that consider cross-sectional dependence, as opposed to first-generation methods that operate under the assumption of cross-sectional independence.
Cross-sectional dependence tests.
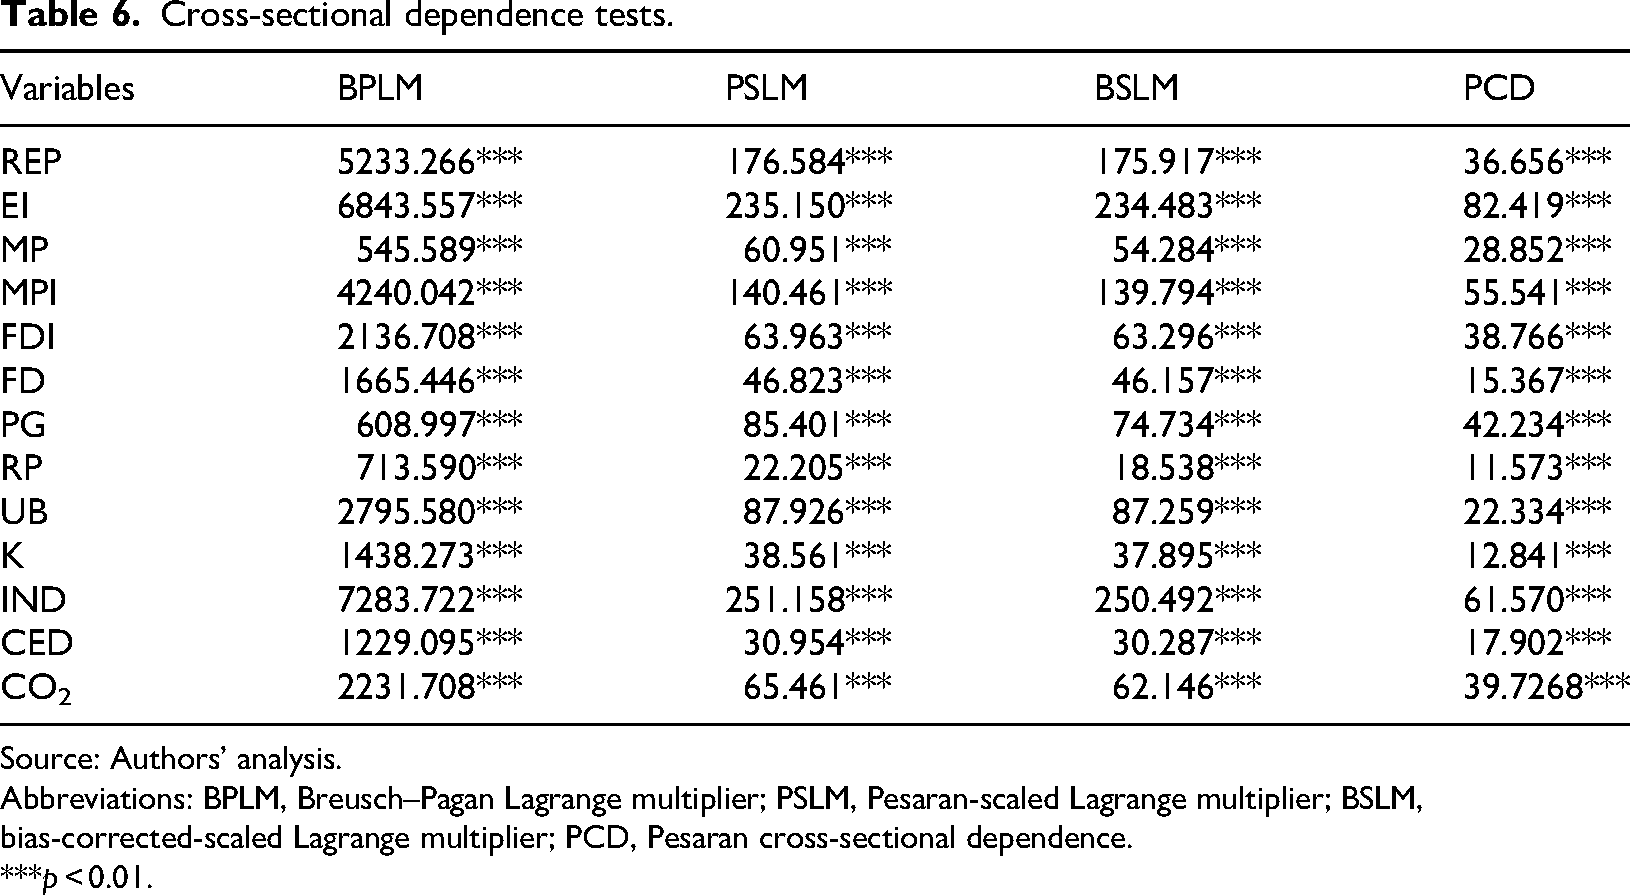
Source: Authors’ analysis.
Abbreviations: BPLM, Breusch–Pagan Lagrange multiplier; PSLM, Pesaran-scaled Lagrange multiplier; BSLM, bias-corrected-scaled Lagrange multiplier; PCD, Pesaran cross-sectional dependence.
***p < 0.01.
Stationarity test
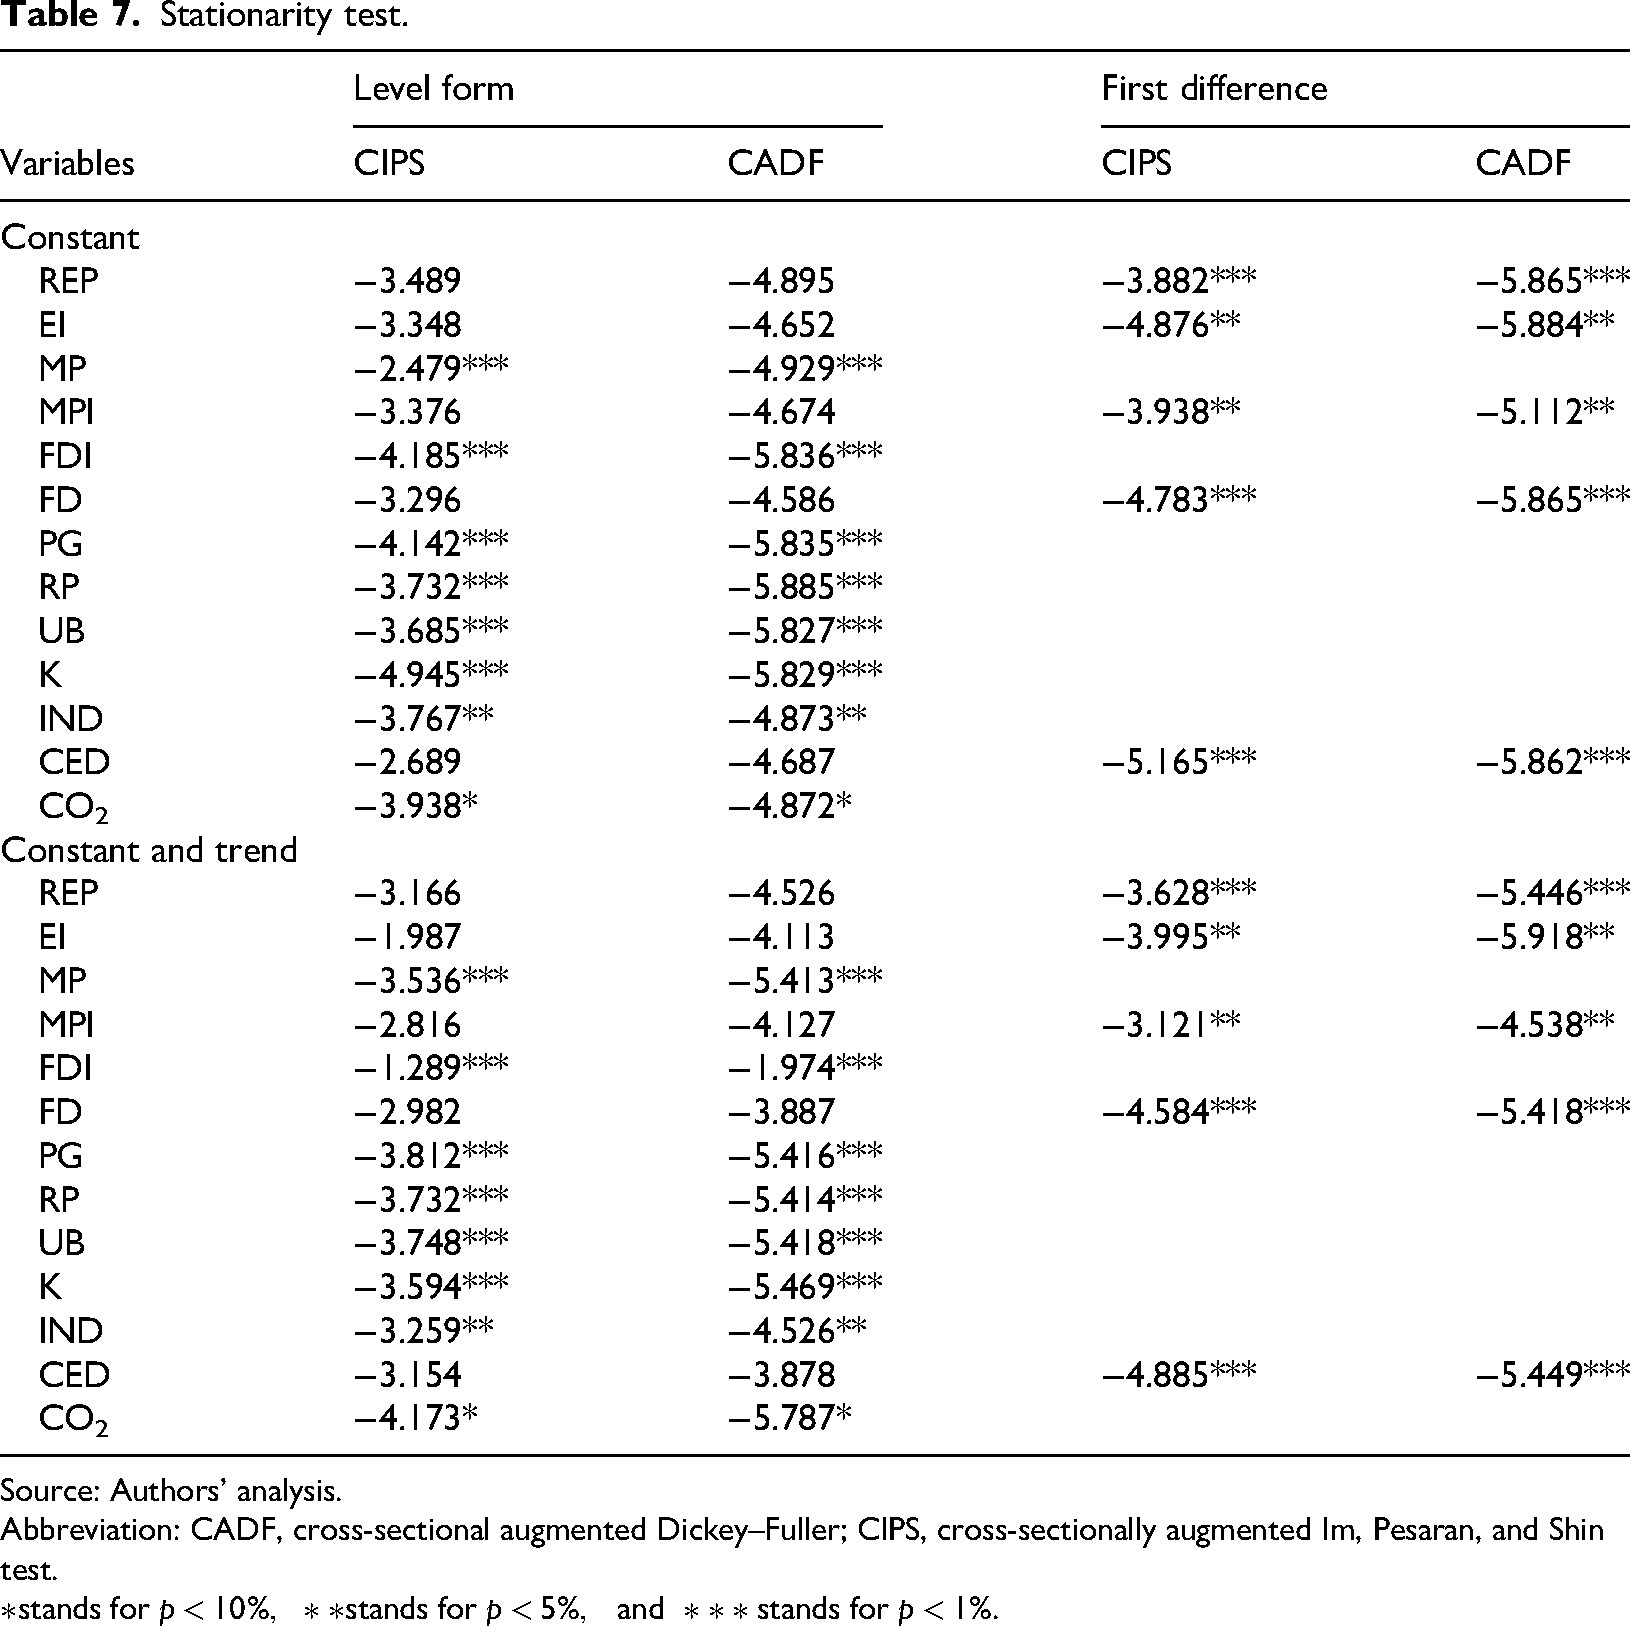
To prevent spurious regression results and improve the reliability and precision of the statistical analysis, a stationarity test was performed (see Table 7). This included the use of the CIPS (cross-sectional 114 ) and CADF (cross-sectional augmented Dickey–Fuller) tests. The results indicated that all variables were stationary following first-order differencing.
Stationarity test.
Source: Authors’ analysis.
Abbreviation: CADF, cross-sectional augmented Dickey–Fuller; CIPS, cross-sectionally augmented Im, Pesaran, and Shin test.
Panel cointegration test
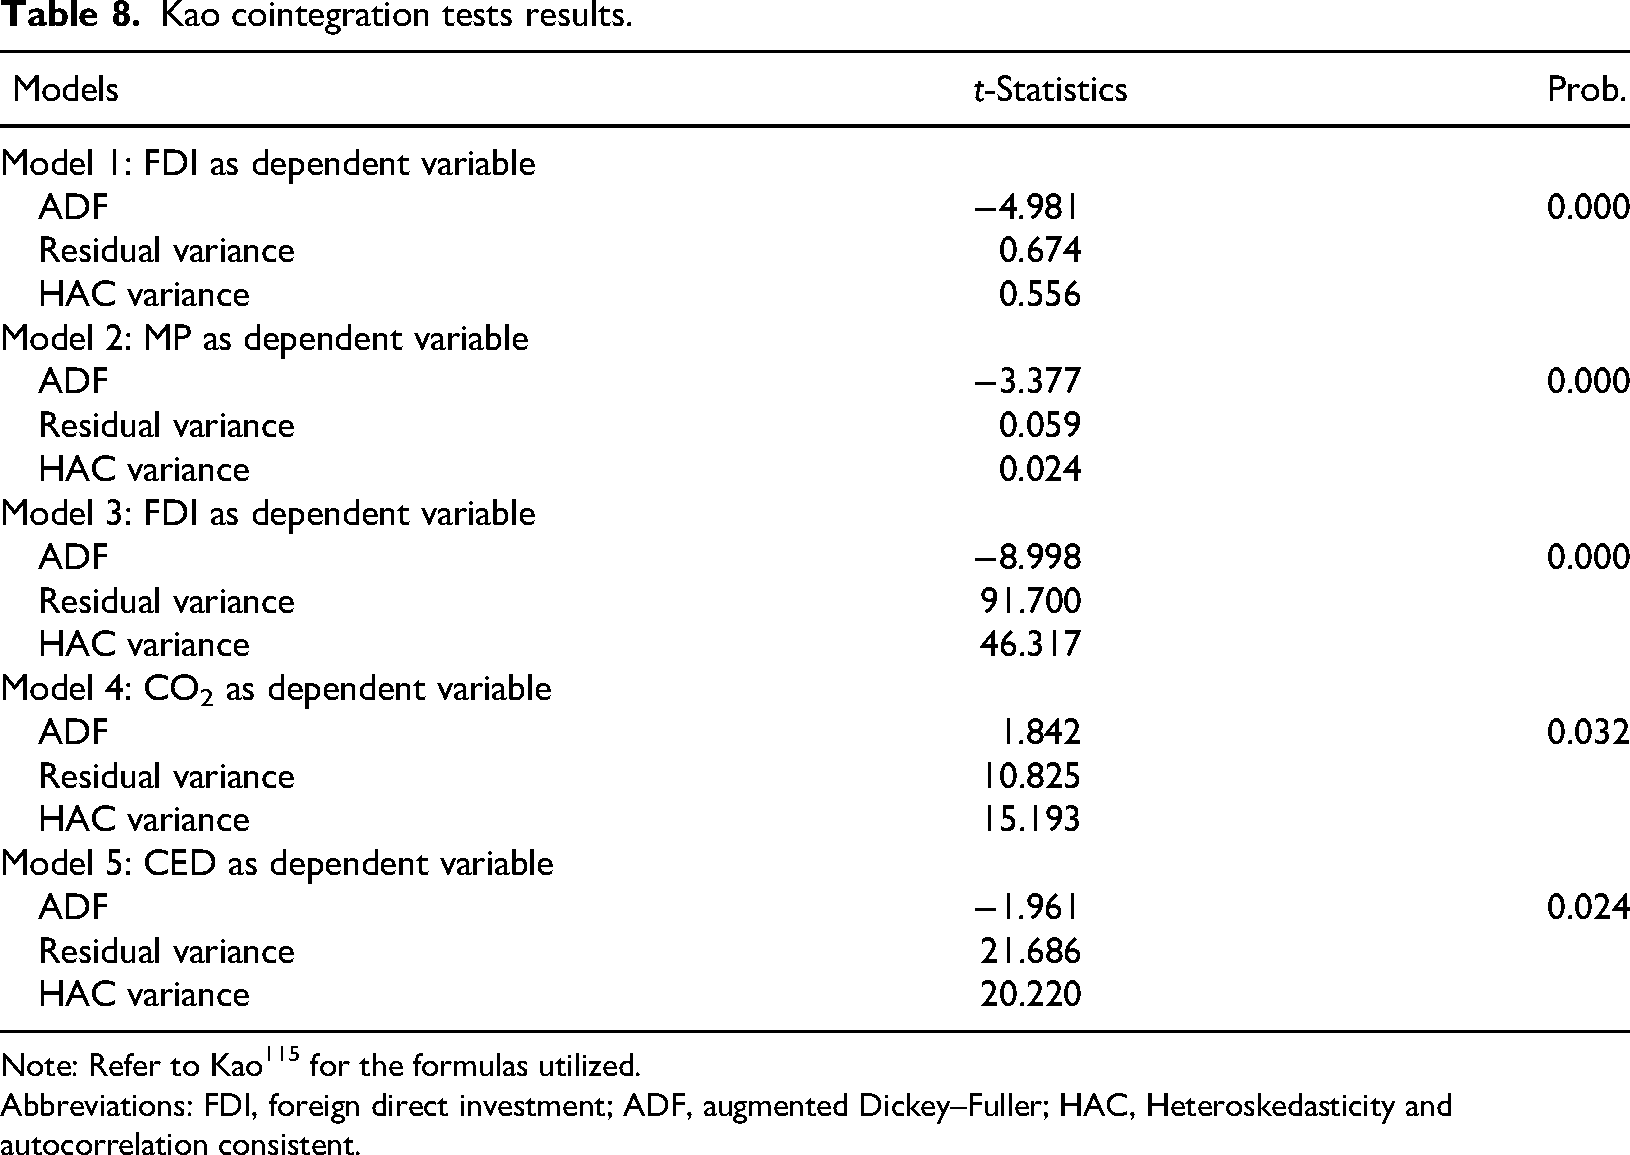
The study conducted the Kao cointegration tests to determine if long-term relationships exist among the variables. The findings, shown in Table 8, confirm that the Kao tests indicate the presence of long-term relationships among the variables. Thus, the variables chosen for this study are suitable for further regression analysis. This is due to all probability values being less than 5%.
Kao cointegration tests results.
Note: Refer to Kao 115 for the formulas utilized.
Abbreviations: FDI, foreign direct investment; ADF, augmented Dickey–Fuller; HAC, Heteroskedasticity and autocorrelation consistent.
Multicollinearity test
Estimation efficiency challenges often root from multicollinearity, especially when the correlation coefficients between the independent variables exceed 0.8. 116 The correlation among all variables is depicted in the heat map (see Figure 4). The results indicated the absence of multicollinearity problem as well as the interactions among variables. This proves data quality, potential coefficients stability in the model, and potential reliable estimates.
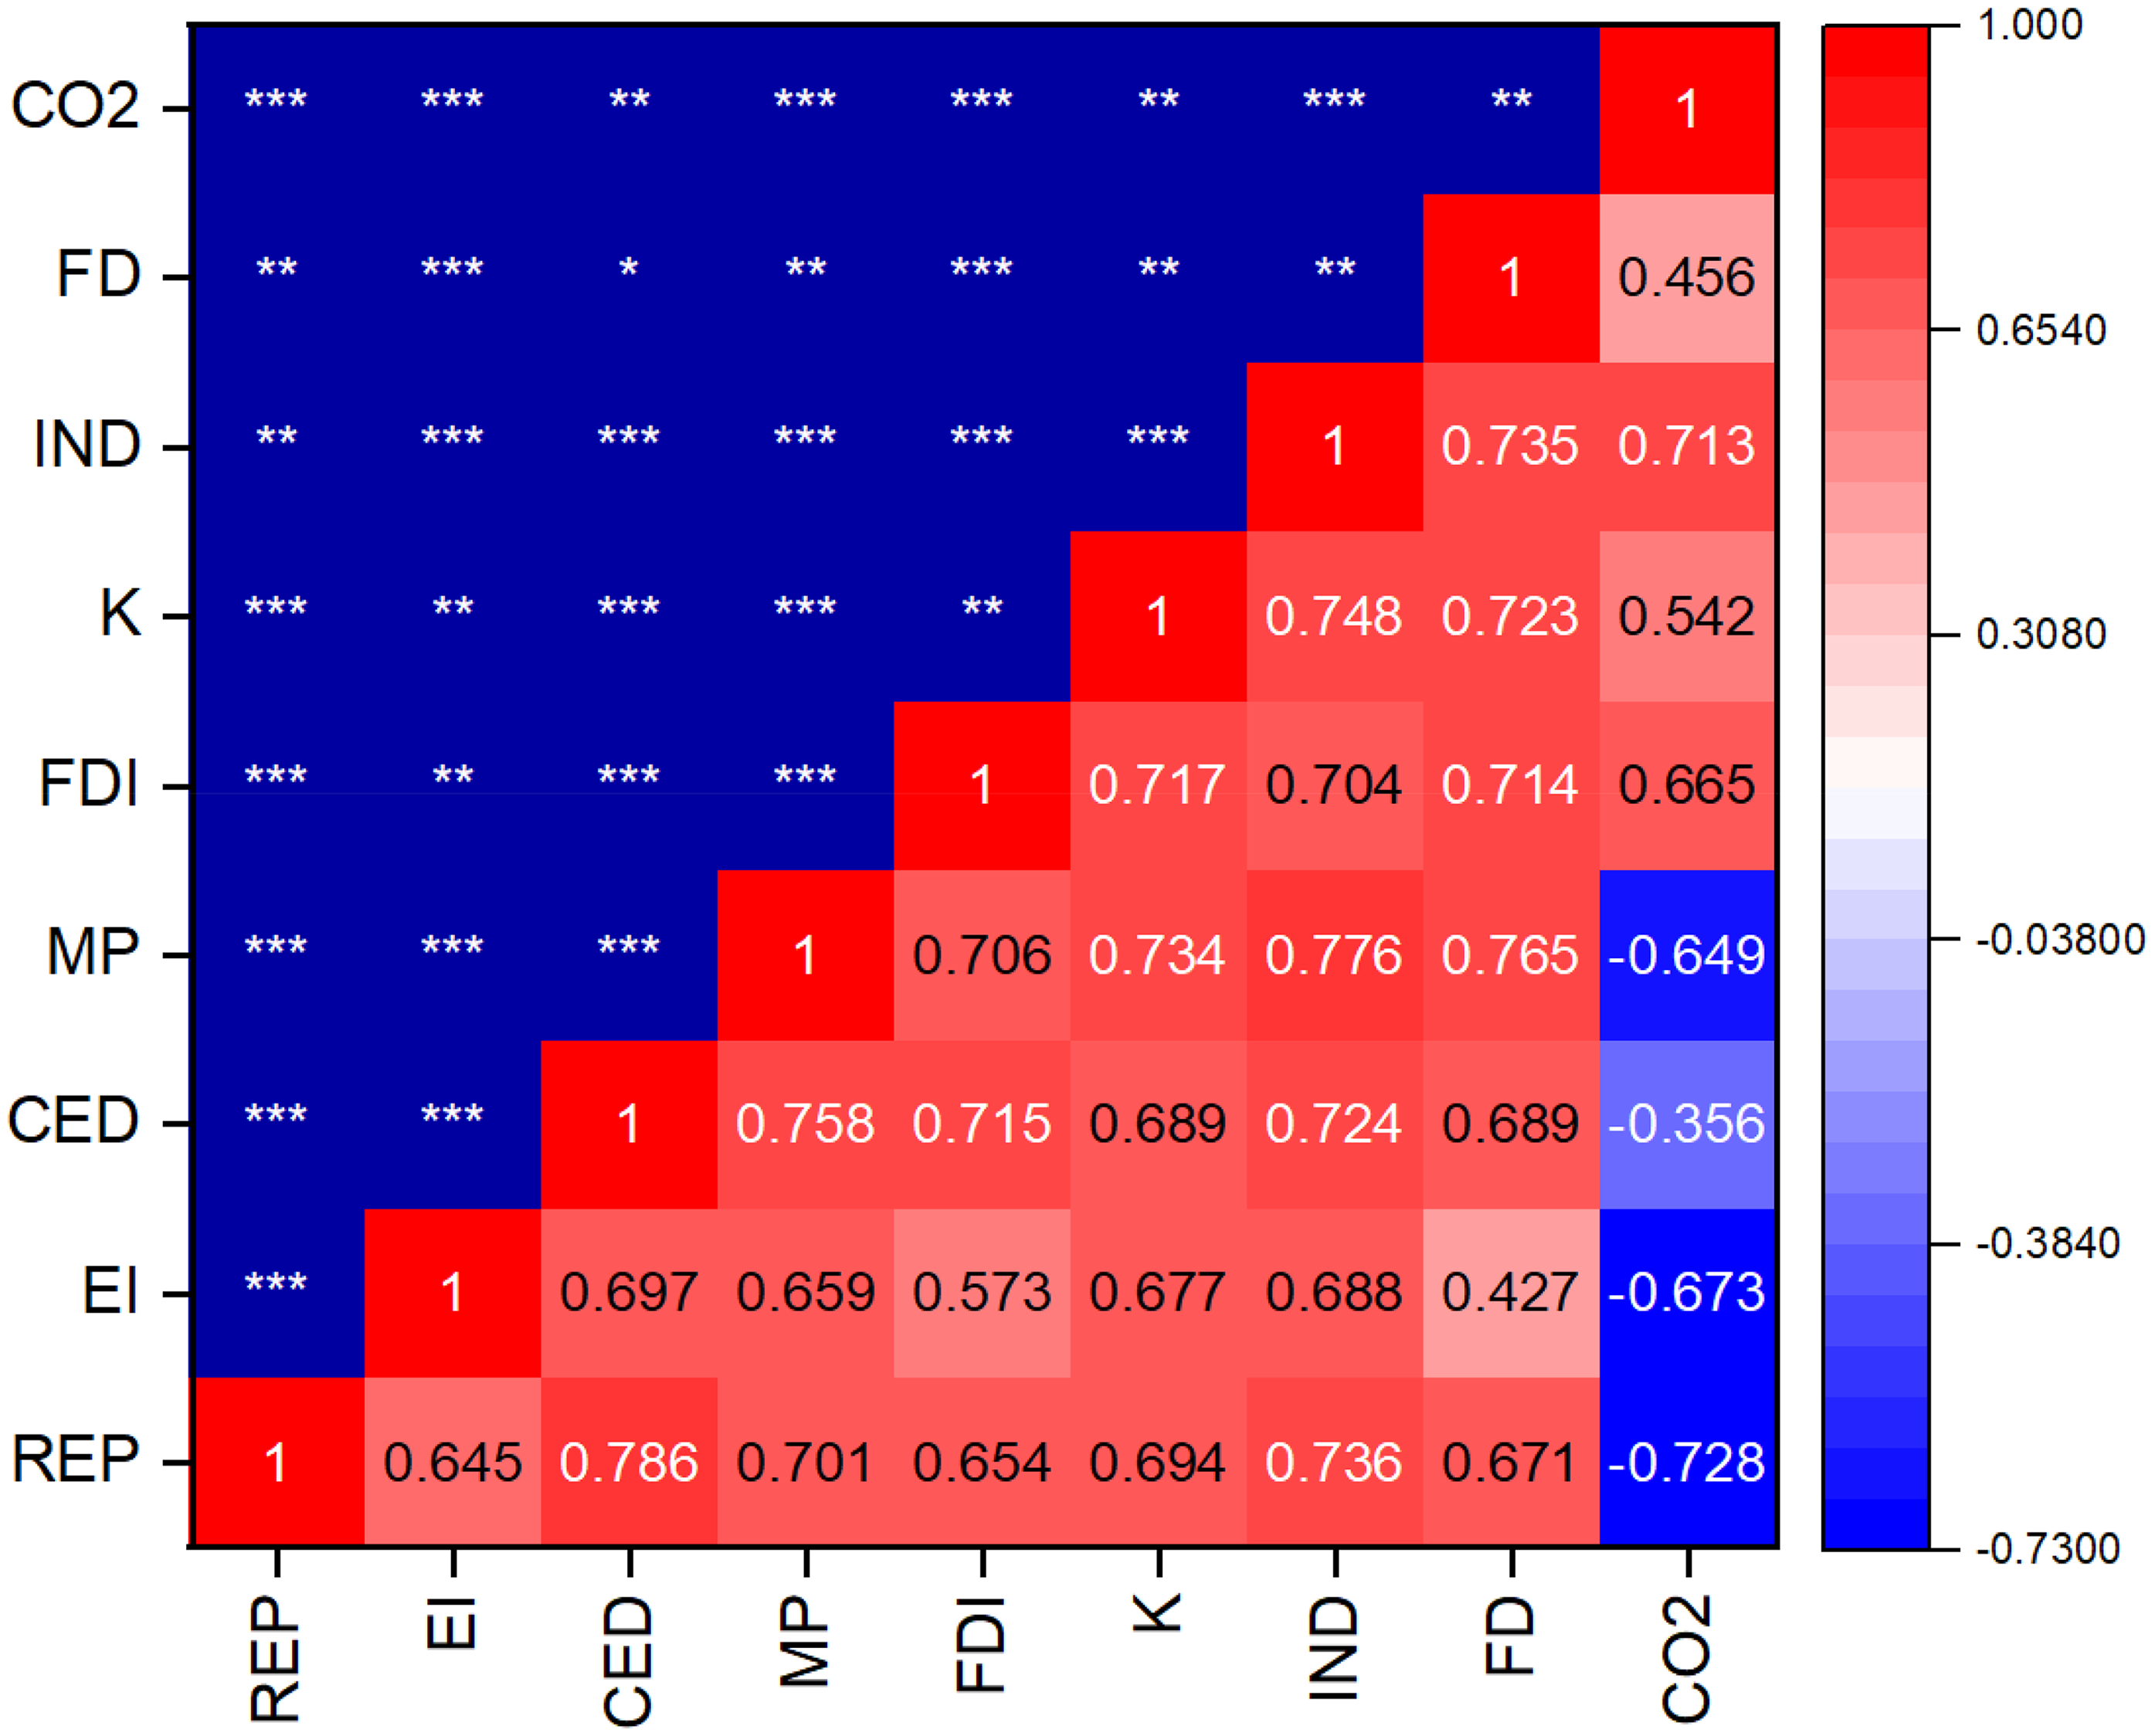
Correlation matrix heat map indicating the association among the variables. Pearson's values (r), ***p < 0.01, **p < 0.05, *p < 0.1. Source: Authors’ analysis.
Estimates’ results and discussion
Baseline models’ findings and first hypothesis verification
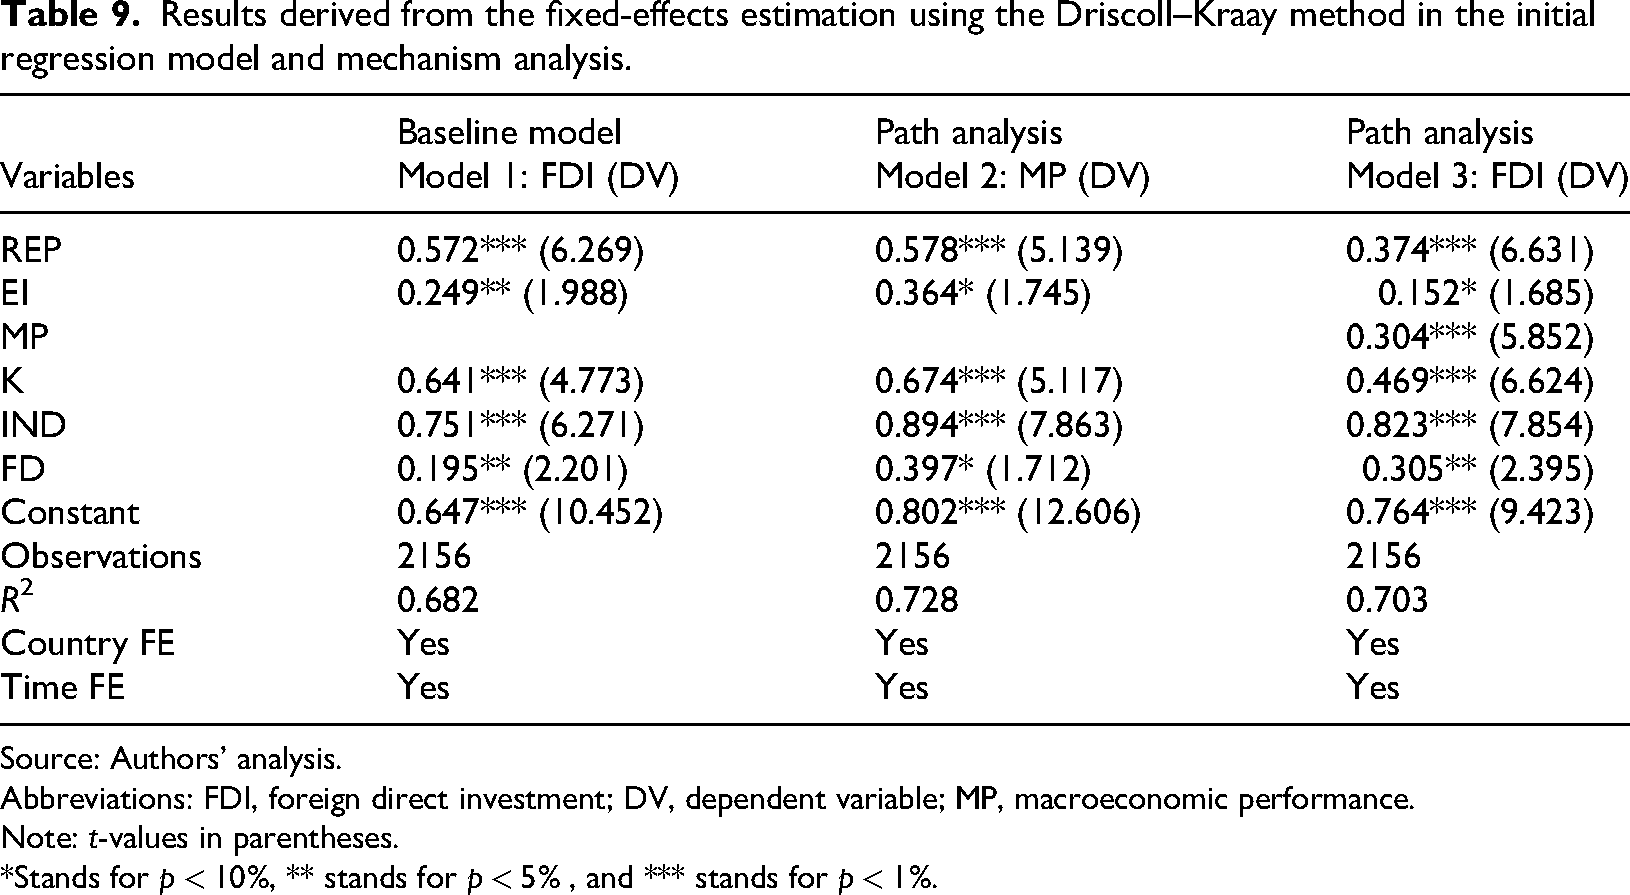
In the results from model 1 based on Driscoll–Kraay estimates, which investigates the effect of GEP on FDI, it was found that these policies (REP and EI) have a positive effect on FDI. By comparing the effects of REP and EI (Table 9), it was indicated that a 1% increase in REP leads to a 0.57% rise in FDI, while a 1% increase in EI results in a 0.24% rise in FDI. This indicates that REP has a stronger positive effect on FDI compared to EI. Therefore, hypothesis 1, which states that GEP enhance FDI, is valid. This is supported by the significance of the REP coefficient at 1% and the significant coefficient of EI at 5% in the Driscoll–Kraay estimates in the first column of Table 9. This suggests that promoting sustainable energy practices can attract more international investment, signalling confidence in the nation's dedication to the sustainability of the environment and economic growth. This evidence is reinforced by Leitão et al., 31 who indicated that renewable energy consumption increases FDI in the Visegrad countries, and by Pan et al., 21 who found that carbon finance policies attract FDI in China. Unfortunately, the above stated literatures do not provide insights into how MP influences this relationship. The next subsection explores the analysis of a novel MPI mechanism within the identified GEP–FDI nexus.
Results derived from the fixed-effects estimation using the Driscoll–Kraay method in the initial regression model and mechanism analysis.
Source: Authors’ analysis.
Abbreviations: FDI, foreign direct investment; DV, dependent variable; MP, macroeconomic performance.
Note: t-values in parentheses.
*Stands for
Mechanism analysis and second hypothesis verification
In the second model, the direct effect of GEP on MP is apparent (refer to Table 9). Both GEP examined (REP and EI) enhance MP. According to the Driscoll–Kraay estimates shown in Table 9, the second column indicates that a 1% increase in REP results in a 0.57% increase in MP, while a 1% rise in EI leads to a 0.36% increase in MP. This suggests that REP has a more significant positive impact on MP than EI. These GEP enhance MP in higher-income countries by fostering stable and sustainable energy markets, reducing reliance on volatile fossil fuels, and driving innovation in technology. Investments in renewables create jobs and stimulate economic activity, particularly in high-tech sectors like solar, wind, and battery storage. 117 Additionally, green policies lower long-term energy costs, increase energy security, and encourage investment in clean industries, which boosts productivity and efficiency. This transition helps stabilize energy prices, mitigates environmental costs, and strengthens resilience against external economic shocks. 29 By considering MP indicators, the positive impact of REP and EI on economic progress was also confirmed by many scholars in our literature. But high-income countries experience a higher impact of GEP on economic growth than other countries; for instance, refer Gakuru et al. 29 in top renewable energy-producing nations and Namahoro et al. 118 in Africa, the global panel, lower-income countries, and upper-middle-income countries. Introducing the novel MPI highlights the significant role of GEP. This is because, scholars in the literature focus on specific components of the MPI.
In the third model, it was found that the novel MPI has a positive effect on FDI inflows. According to the Driscoll–Kraay estimates presented in Table 8, the third column indicates that a 1% increase in MP leads to a 30% increase in FDI. Additionally, a 1% rise in REP results in a 0.37% increase in FDI, while a 1% increase in EI corresponds to a 0.15% rise in FDI. This indicates that REP has a more substantial positive effect on FDI compared to EI. This implies that the index effectively captures key aspects of economic stability, growth potential, and investor confidence that attract foreign investments. This relationship suggests that higher scores on the index signal favourable economic conditions such as robust GDP growth, low inflation, employment growth, good lending rate, and favourable exchange rate which are critical factors for foreign investors when deciding where to allocate their capital.36,58,87 It highlights the usefulness of the index as a predictive and evaluative tool for policymakers aiming to enhance their country's appeal to foreign investors by improving the underlying macroeconomic fundamentals it measures. Therefore, hypothesis 2, which states that GEP enhance FDI through improved MP, is valid. This is supported by the significance of the REP coefficient at 1% and the significant coefficient of EI at 10% in the Driscoll–Kraay estimates in the second column, Table 9, which connects GEP to the MPI. Additionally, the significance of the MPI coefficient at the 1% level was observed while linking MP with FDI. This mechanism is further evidenced by the decrease in the coefficients of REP and EI from 57% and 24% in the first model to 37% and 15% in the third model, respectively, when the MPI was included. This indicates that some effects of REP and EI have been captured by the MPI in the third model (see, the third column, Table 9).
GEP transmission mechanisms to carbon neutrality, CEP, and third hypothesis verification
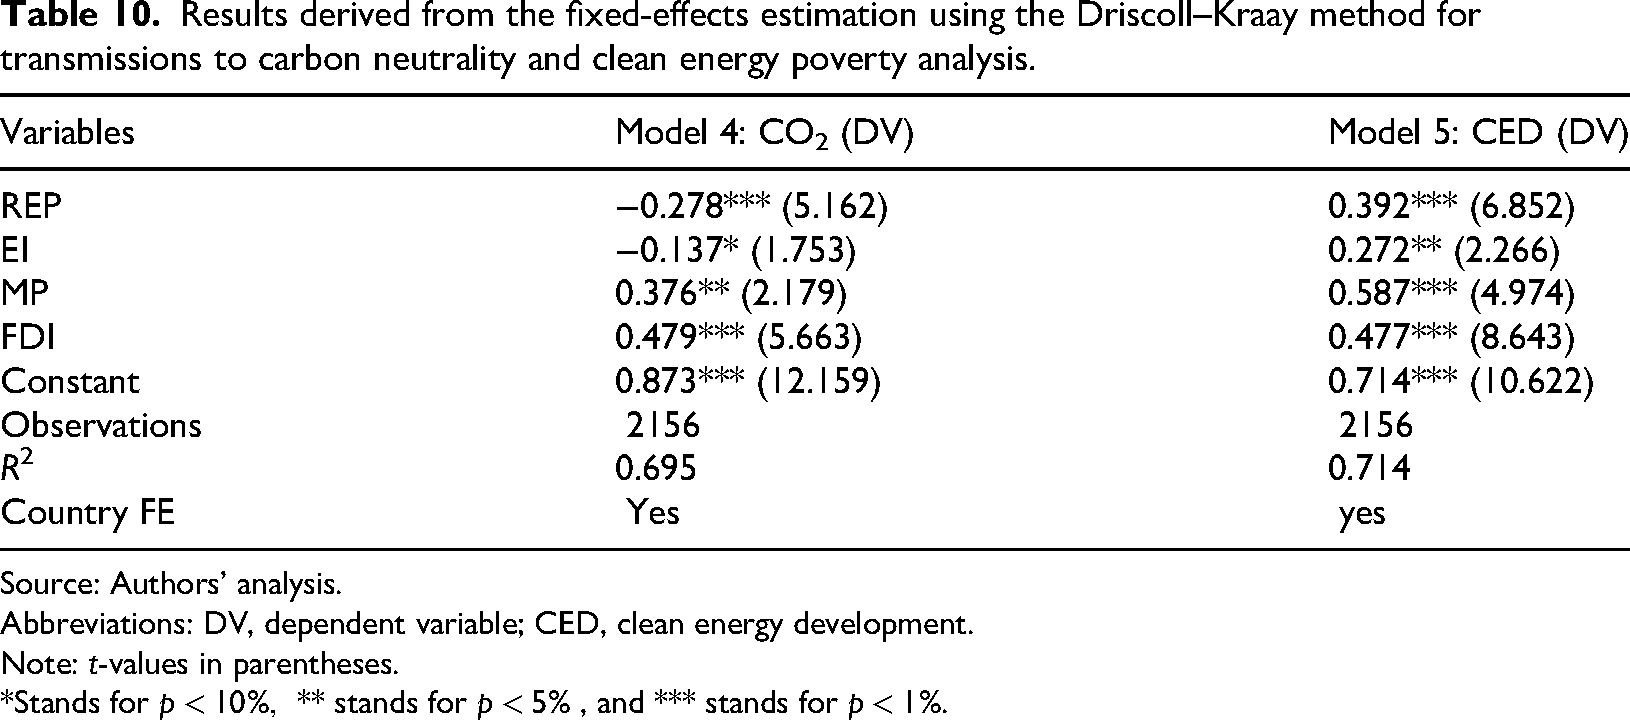
In the fourth model, all energy-based climate policies (REP and EI) have a negative effect on CO2. According to the Driscoll–Kraay estimates presented in Table 10, the first column indicates that a 1% increase in REP leads to a 0.27% reduction in CO2, while a 1% increase in EI results in a 0.13% decrease in CO2. This indicates that REP has a more pronounced negative effect on CO2 compared to EI. These energy-based climate policies in developed countries drive down CO2 emissions by reducing fossil fuel dependence, increasing energy efficiency, and promoting the adoption of renewable energy and clean technologies, 117 supported this negative nexus in top wind energy generation countries. The novel MP and FDI exhibits positive effects on CO2 in higher-income countries. This implies that economic growth and investment activities are associated with environmental degradation as also mentioned by Gang et al. 72 This relationship suggests that as economies expand and attract FDI, the increased industrial activity, energy consumption, and infrastructure development often rely on carbon-intensive processes, leading to higher CO2 emissions. Such a finding underscores the environmental trade-offs of economic growth and globalization, highlighting the need for sustainable practices, cleaner technologies, and policies that decouple economic and investment growth from environmental harm to mitigate climate change risks. 14
Results derived from the fixed-effects estimation using the Driscoll–Kraay method for transmissions to carbon neutrality and clean energy poverty analysis.
Source: Authors’ analysis.
Abbreviations: DV, dependent variable; CED, clean energy development.
Note: t-values in parentheses.
*Stands for
In the fifth model (Table 10), GEP (REP and EI) have positive effects on CED. This means that GEP alleviate CEP, since CED is a reverse indicator of CEP. According to the Driscoll–Kraay estimates shown in Table 10, the second column indicates that a 1% increase in REP results in a 0.39% increase in CED (a reduction in CEP), while a 1% rise in EI leads to a 0.27% increase in CED. This suggests that REP has a more significant positive impact on CED compared to EI. The GEP in higher-income countries drive CED by creating a supportive regulatory environment, attracting investment, fostering technological innovation, enhancing energy security, and providing environmental and economic benefits. In this context, Kocak et al. 119 confirm that effective energy policies lead to strong outcomes in energy security and environmental sustainability in developed countries; however, their examination was limited to electricity generation. These findings of negative effects on CEP are similar to some studies in the literature. For instance, Simionescu et al., 77 who revealed the significant impact of renewable energy policies on reducing energy poverty in EU member countries. However, all the studies in literature talked about energy poverty in general. Therefore, hypothesis 3, which states that GEP enhance carbon neutrality and alleviate CEP, is valid. This is supported by the significance of the negative coefficient of REP at the 1% level and the significant negative coefficient of EI at the 10% level in the Driscoll–Kraay estimates in the first column of Table 10, where carbon emissions are the dependent variable. Additionally, it is further supported by the significance of the positive coefficient of REP at the 1% level and the significant negative coefficient of EI at the 5% level in the second column of Table 10, where CED is the dependent variable.
FDI transmission mechanisms to carbon neutrality, CEP, and fourth hypothesis verification
In the fourth and fifth models presented in Table 10, the first column indicates that both the MPI and FDI have positive effects on CO2 emissions, while also exerting positive effects on CED. The results from Driscoll–Kraay estimates indicate that a 1% increase in MP leads to a 0.37% increase in CO2 emissions, and a 1% increase in FDI results in a 0.47% increase in CO2. Regarding CED, a 1% increase in MP corresponds to a 0.39% increase in CED, while a 1% increase in FDI results in a 0.27% increase in CED (see Table 10, column 2). This implies that macroeconomic growth and international investments are contributing positively to energy access and the adoption of cleaner energy sources. This could occur through increased financial resources, technological transfer, and infrastructure development, enabling more households and businesses to access renewable energy and modern energy services. It highlights the dual role of FDI and macroeconomic growth: while they may increase CO2 emissions due to industrial expansion, they also have the potential to alleviate energy poverty and promote sustainable development by fostering clean energy adoption. These dynamics underscore the importance of balancing growth with environmental sustainability through targeted policies that steer investments towards green energy solutions. Therefore, hypothesis 4, which states that FDI enhances carbon neutrality and alleviates CEP, is valid. This is supported by the significance of the positive coefficient of FDI at the 1% level for CO2 as a dependent variable, as well as the significant positive coefficient of FDI at the 1% level for CED as a dependent variable (see Table 10).
Robustness analysis
The replacement of the main independent variables and additional control variables
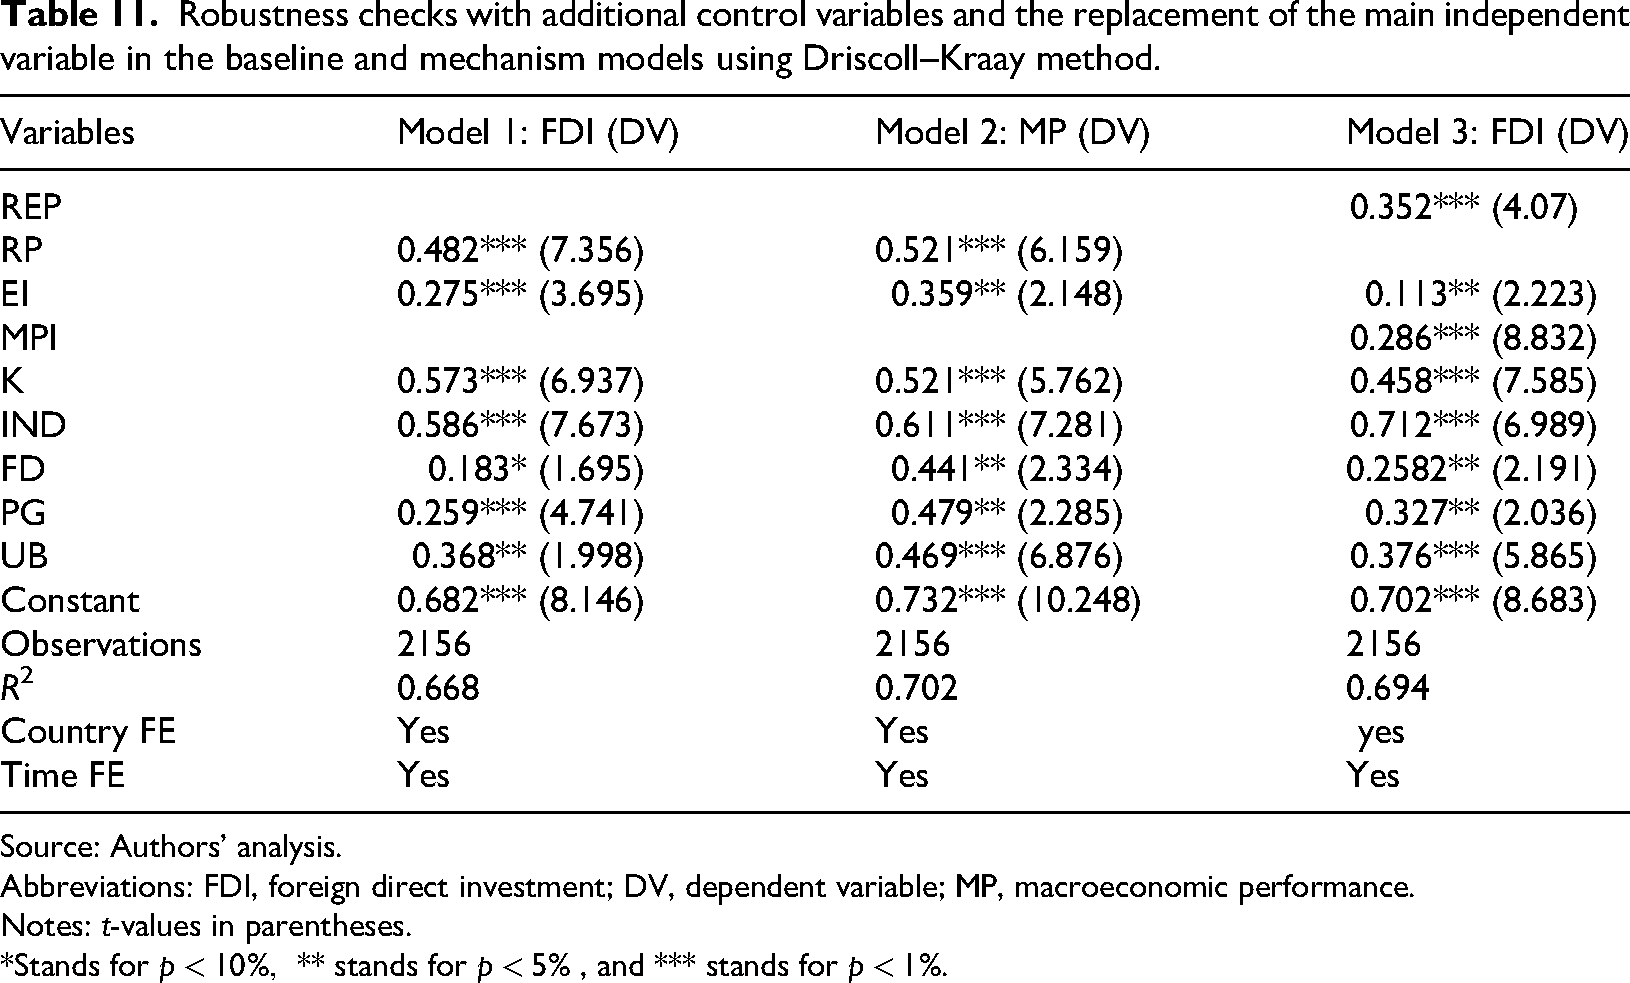
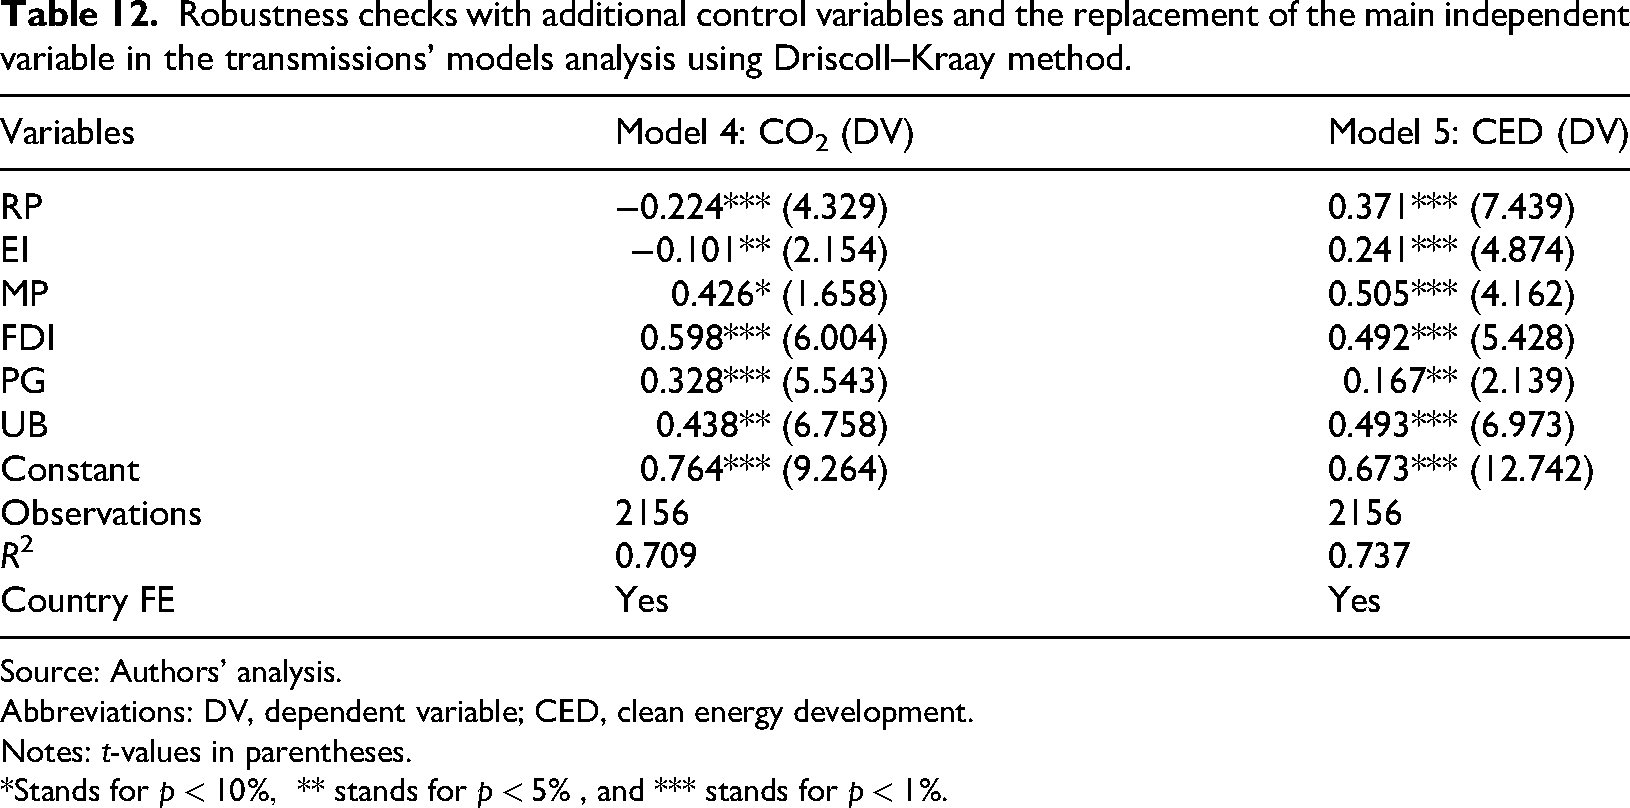
This study uses the percentage of renewable energy in total electricity (RP) as a proxy for REP and also incorporates the MPI developed by Ekren et al. 39 Additionally, the study includes other control variables, such as population growth and urbanization, to conduct robustness checks (Tables 11 and 12). Many scholars, including Peng et al. 120 and Lee and Zou, 121 have recognized this approach to robustness checks. The consistent signs of the coefficients and their statistical significance confirm that the study's results remain robust, even after accounting for the replacement of the main independent variables and additional control variables.
Robustness checks with additional control variables and the replacement of the main independent variable in the baseline and mechanism models using Driscoll–Kraay method.
Source: Authors’ analysis.
Abbreviations: FDI, foreign direct investment; DV, dependent variable; MP, macroeconomic performance.
Notes: t-values in parentheses.
*Stands for
Robustness checks with additional control variables and the replacement of the main independent variable in the transmissions’ models analysis using Driscoll–Kraay method.
Source: Authors’ analysis.
Abbreviations: DV, dependent variable; CED, clean energy development.
Notes: t-values in parentheses.
*Stands for
Endogeneity analysis
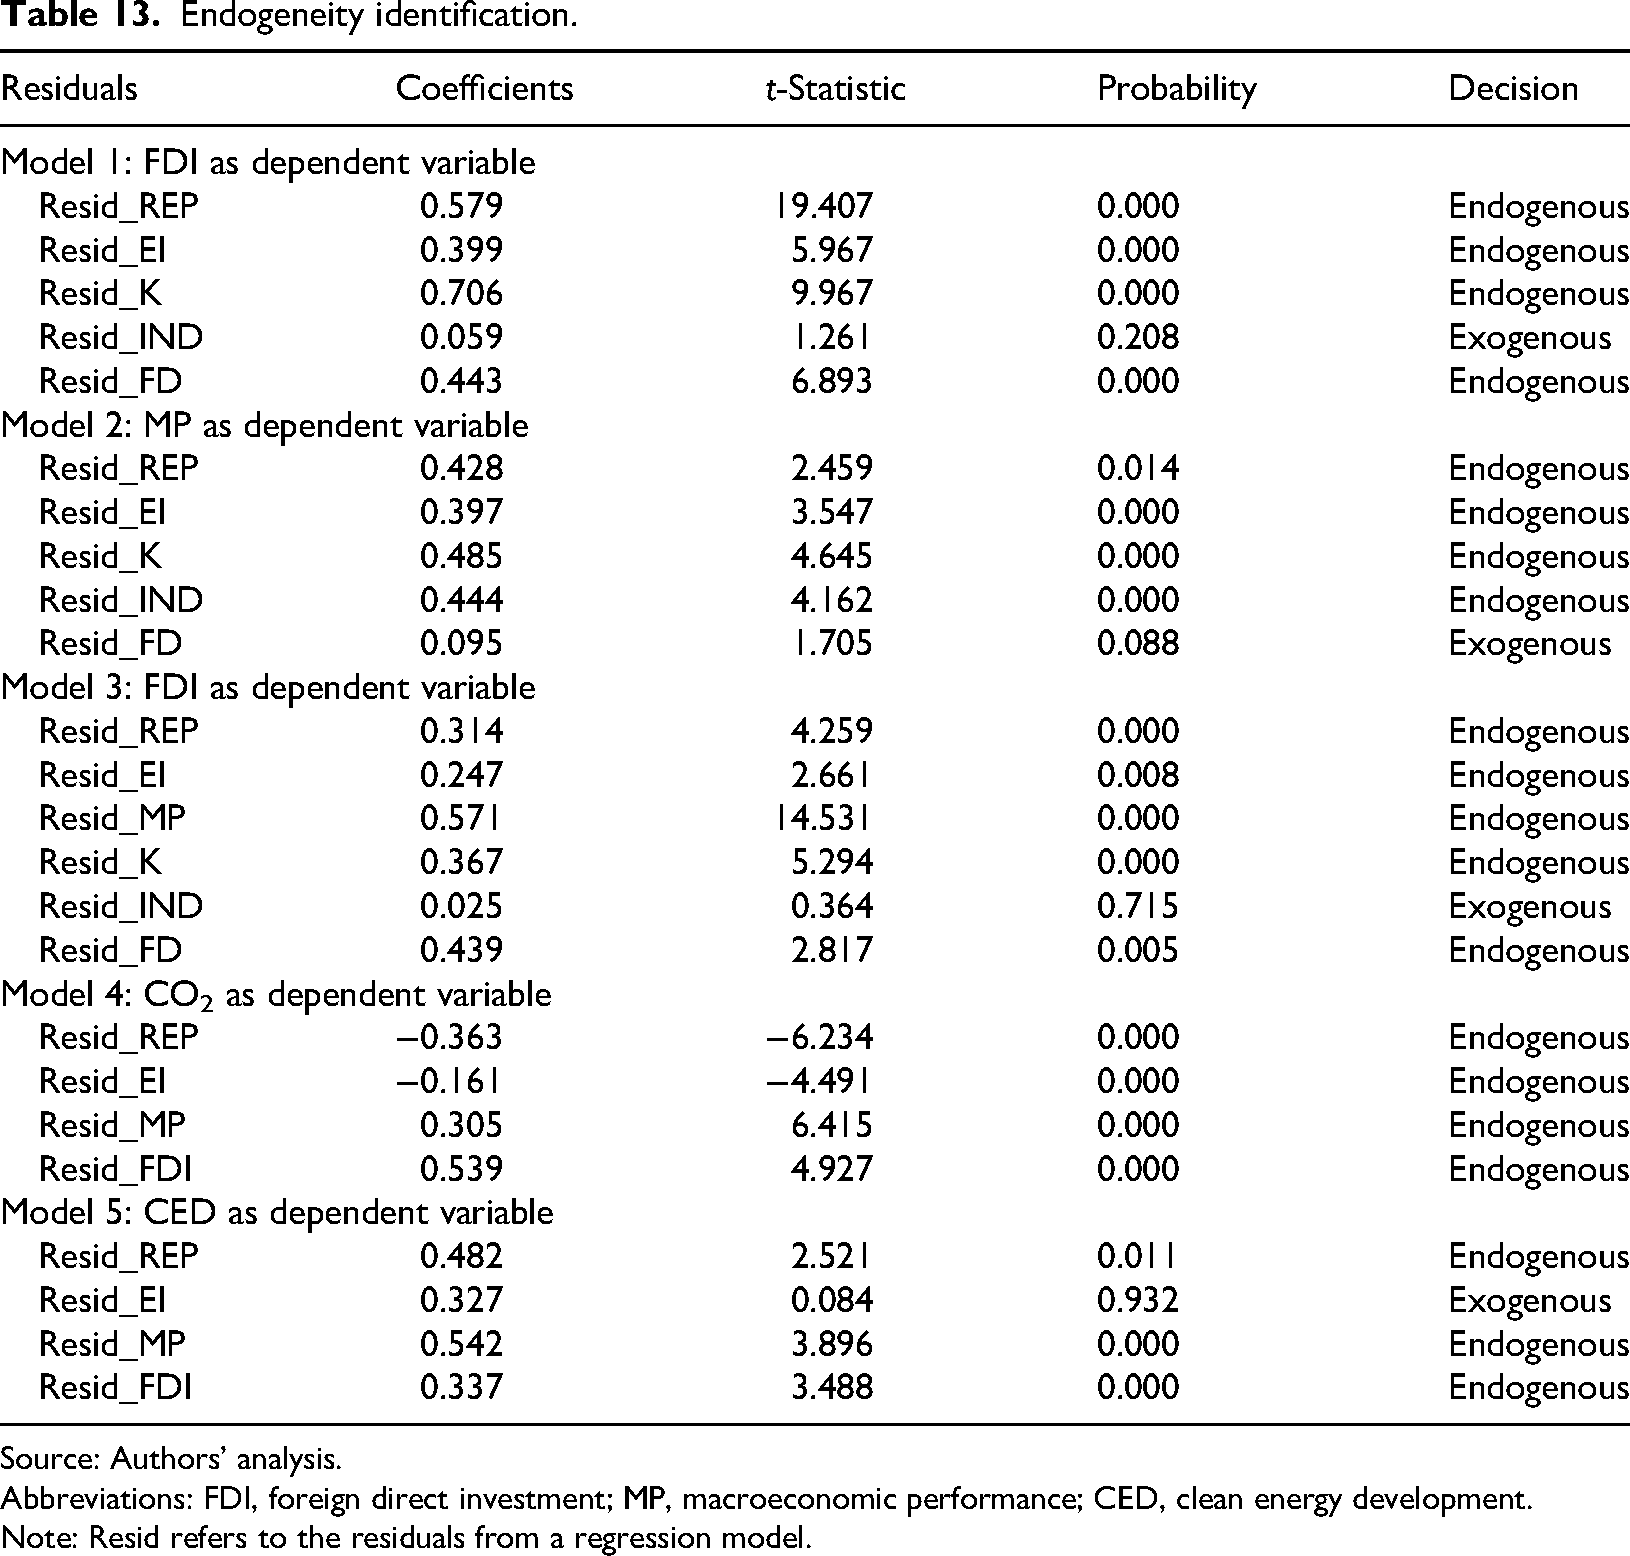
Endogeneity identification was conducted through the following steps. First, the original regression equation of the model is constructed. Then, the first explanatory variable is made the dependent variable, and an OLS regression is conducted. The residuals from this initial regression are stored. Next, the original equation is modified by replacing the independent variable with the residuals obtained in the previous step. If the p-value of the residual variable in this modified regression is statistically significant (p < 0.05), it suggests that endogeneity is present in the original independent variable. If p > 0.05, it indicates the absence of endogeneity. Finally, the entire process is repeated, considering other explanatory variables in the model. This approach aims to detect the presence of endogeneity, which occurs when the independent variable is correlated with the error term, leading to biased and inconsistent estimates as adopted also by Gakuru and Yang. 95
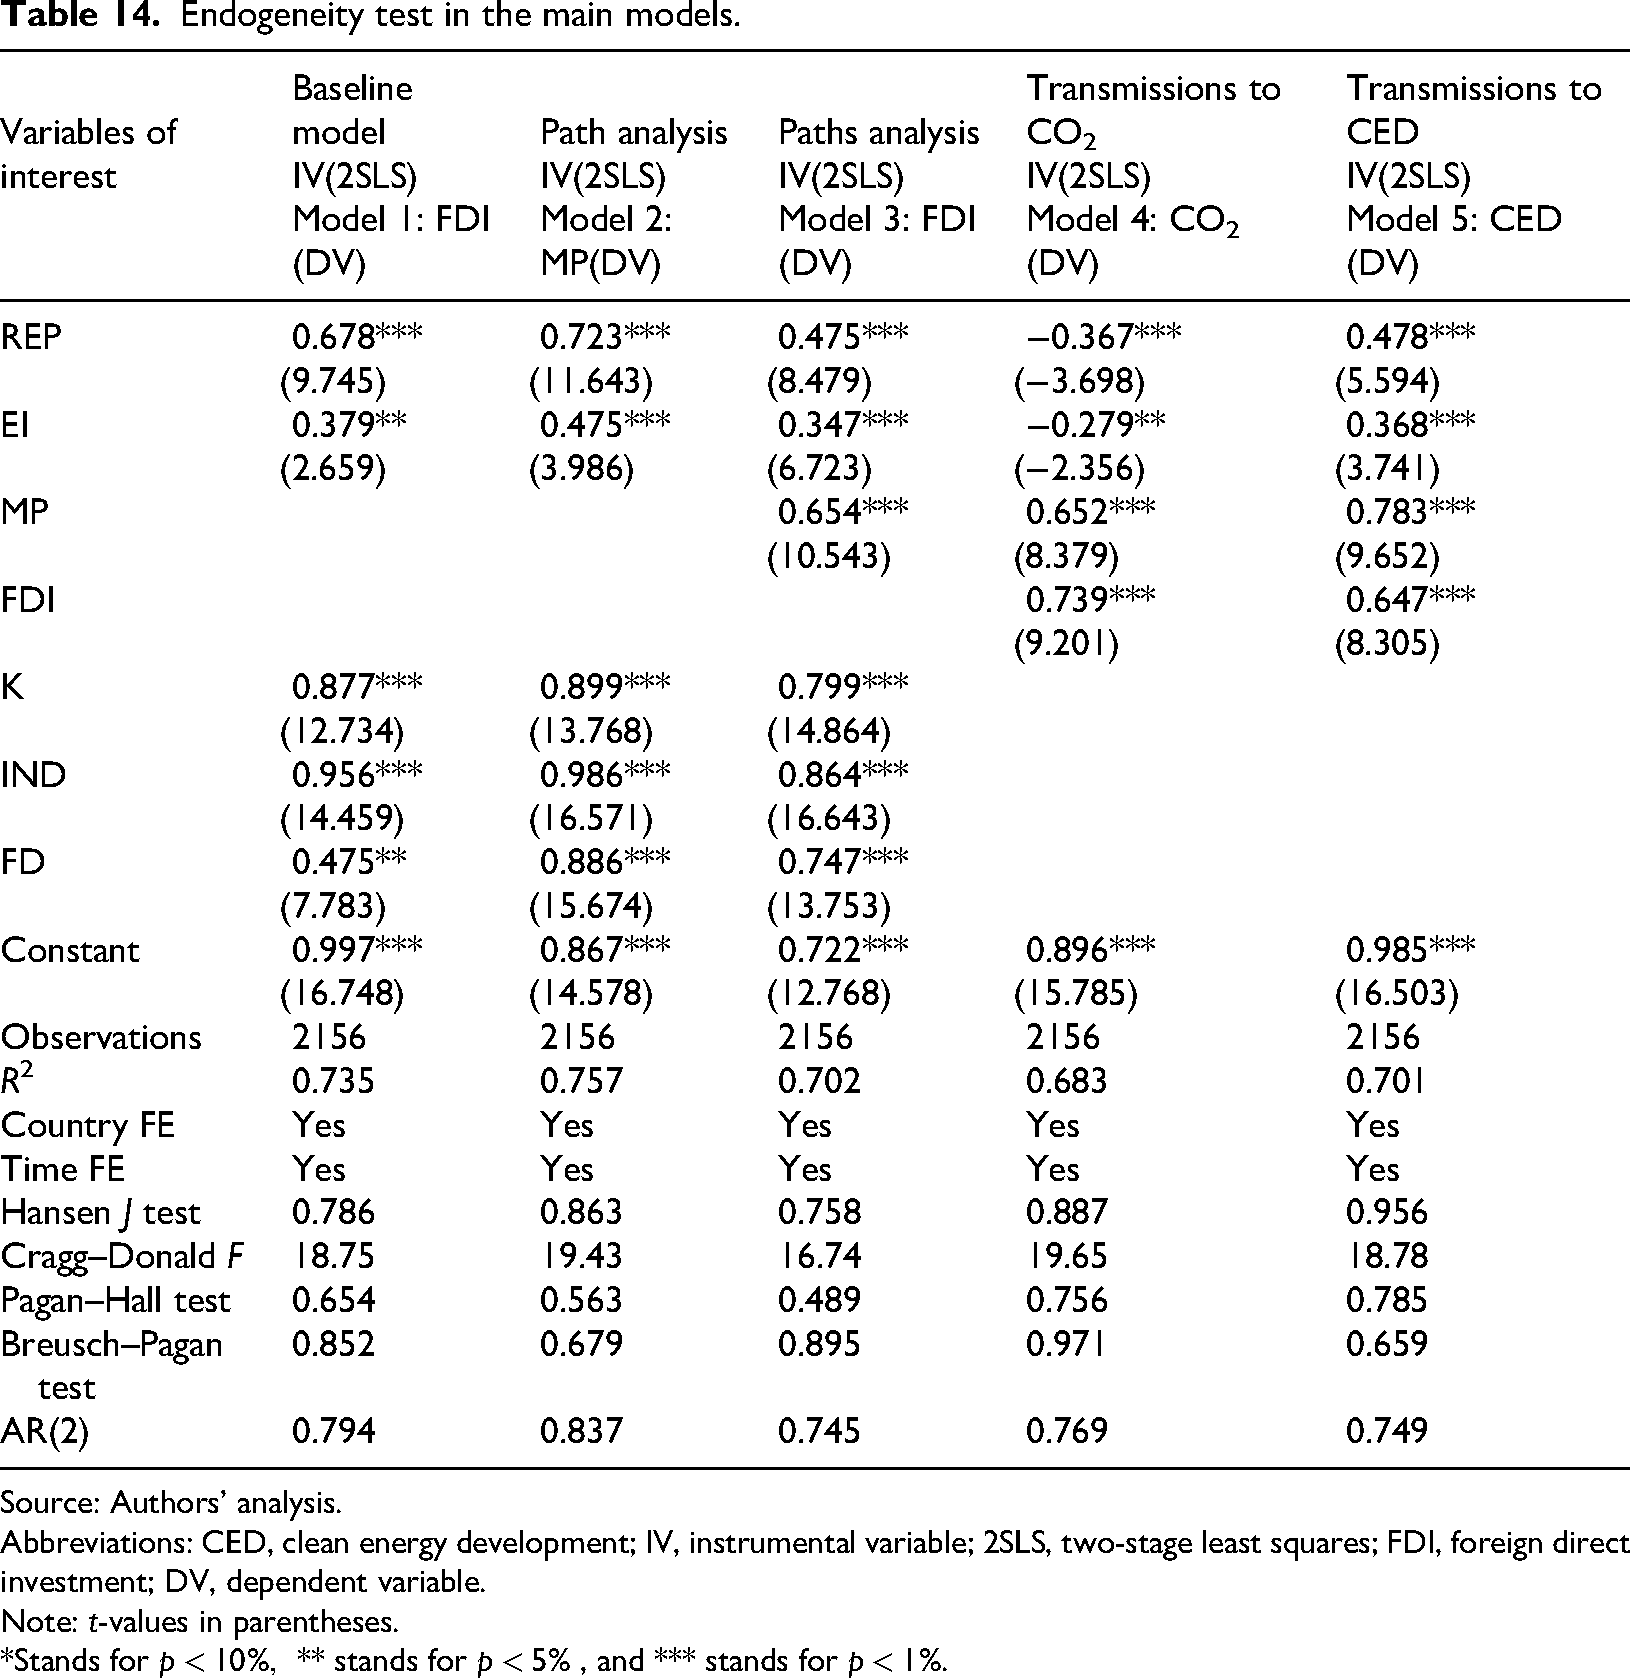
Through the above steps, the endogeneity problem was tested and addressed in all the five models. In case the presence of endogeneity, the variable is called endogenous, and in its absence, the variable is called exogenous (Table 13). The test indicated that only industrial development in the first model, financial development in the second model, industrial development in the third model, and EI in the fifth model are exogenous among all the variables of the study. The presence of endogeneity in the other variables justified the use of an IV approach, specifically 2SLS, to ensure consistency and robustness in addressing the endogeneity issue (see Table 14). At this point only endogenous variables experienced lags in the 2SLS model. The 2SLS estimates have been provided for the first to the fifth lags of the independent variables. The third lag was chosen as the best lag for the model based on the results of the IV diagnostic tests. These IV diagnostic tests include weak instrument tests and overidentification tests, as reported in Table 14.
Endogeneity identification.
Source: Authors’ analysis.
Abbreviations: FDI, foreign direct investment; MP, macroeconomic performance; CED, clean energy development.
Note: Resid refers to the residuals from a regression model.
Endogeneity test in the main models.
Source: Authors’ analysis.
Abbreviations: CED, clean energy development; IV, instrumental variable; 2SLS, two-stage least squares; FDI, foreign direct investment; DV, dependent variable.
Note: t-values in parentheses.
*Stands for
The findings from the baseline model, mechanism analysis, transmissions analysis, and heterogeneity analysis represent significant contributions of this study. This is due to the results obtained while addressing the issue of endogeneity through the use of IV regression (Table 14). Controlling for endogeneity was very important due to the reverse causality indicated by the bidirectional relationship between REP and FDI.12,22 Additionally, bidirectional causality was found between EI and FDI. 13 Furthermore, GDP and FDI also exhibit bidirectional causality.15,38 Bidirectional causality was also observed between REP and CEP. 29 The 2SLS approach was employed to address endogeneity concerns across the five models in this study. The validity of the IV(2SLS) estimates is supported by a high Cragg–Donald F statistic (F > 10), indicating that the instruments are robust. Additionally, the strength of the instruments is further confirmed by elevated Hansen J p-values (p > 0.05). Furthermore, both the Pagan–Hall test and the AR(2) test for the second-order autocorrelation yielded high p-values (p > 0.05), confirming the lack of heteroscedasticity and second-order autocorrelation, respectively.
To address endogeneity concerns, we reformulated the Driscoll–Kraay fixed-effects models by incorporating lags of the independent variables and applied 2SLS estimation techniques. The signs of the coefficients for the independent variables in the 2SLS estimation validate and reinforce the robustness of the panel Driscoll–Kraay fixed-effects results, despite the difficulties in identifying suitable external IVs for our explanatory variables. Therefore, we follow the approaches of Wen et al. 106 and Lee and Zou 121 by utilizing the lagged values of the explanatory variables as instruments. The 2SLS results demonstrate that the findings of this paper are robust, remaining consistent also after changing econometric approaches, additional controls, and substitutions of explanatory variables. Overall, the results reaffirmed the strong effects of REP compared to the effects of EI across models (Figure 5). This offers a strong basis for policymakers, researchers, and economists to leverage insights from the 3E model in making informed policy decisions and promoting sustainable economic development in higher-income countries.
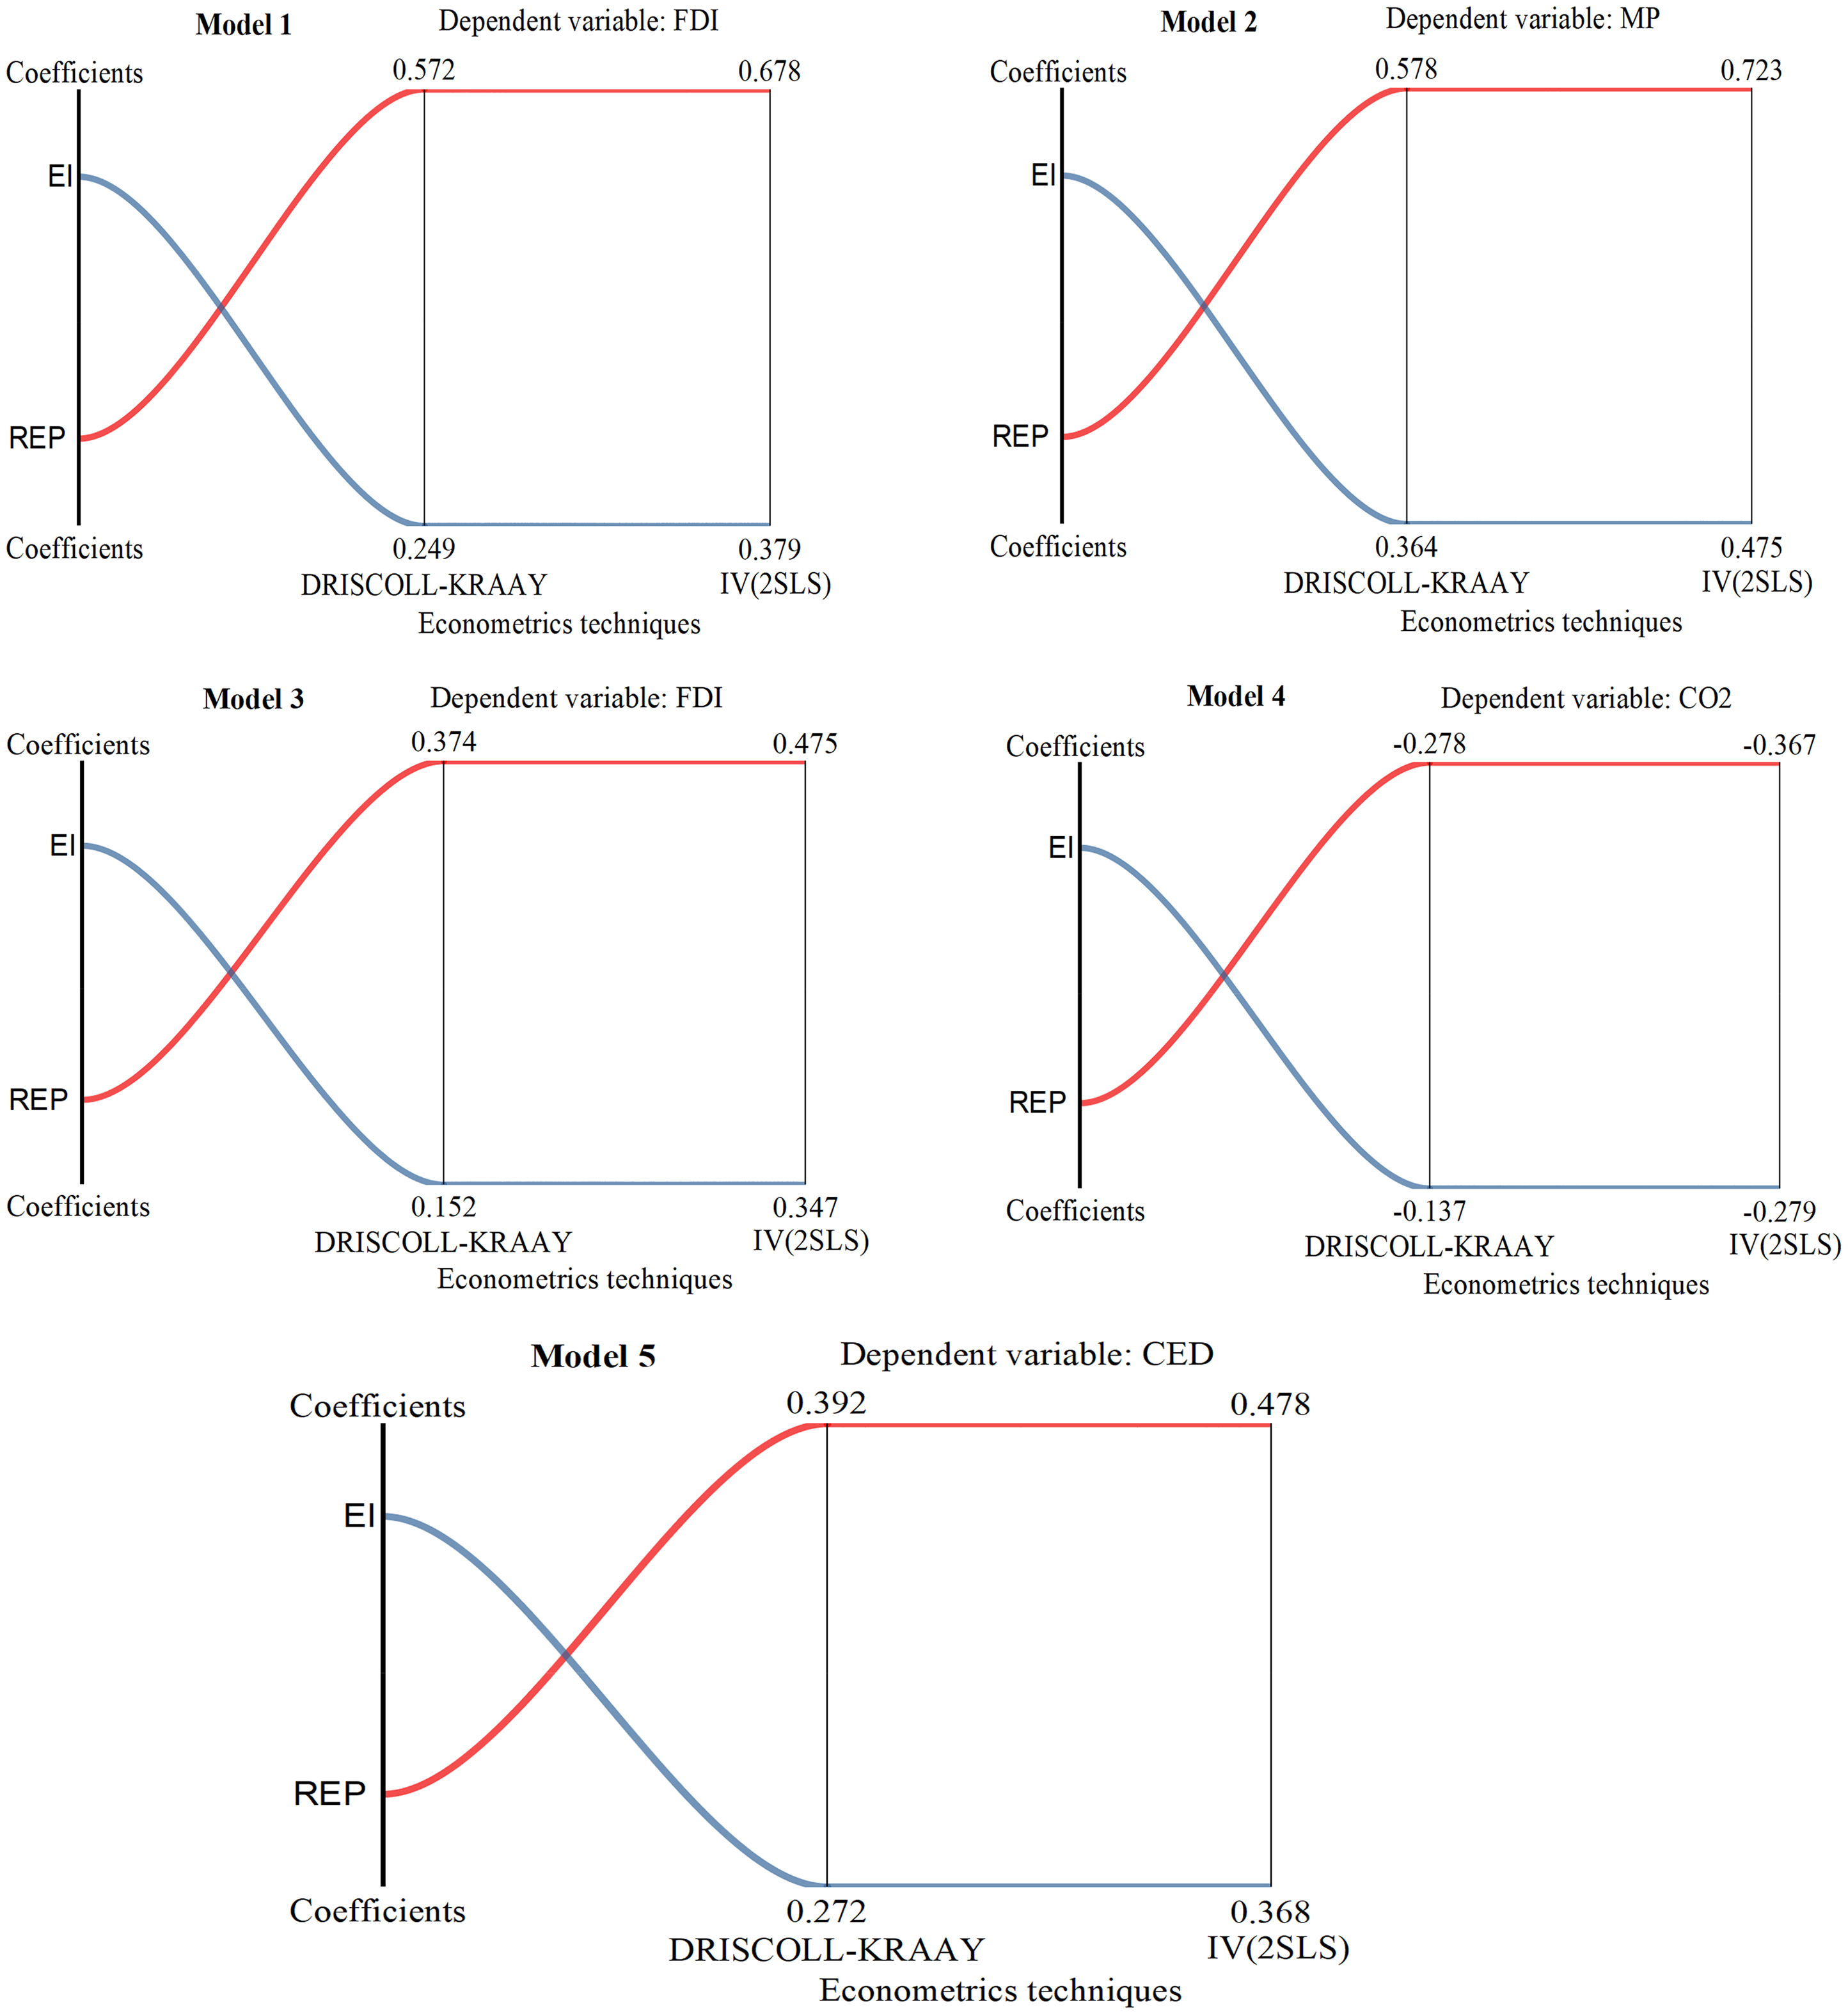
Summary comparing the effects of REP versus EI across models. Source: Authors’ illustrations. REP, renewable energy promotion; EI, energy efficiency improvements.
Heterogeneity analysis
About heterogeneity analysis in the baseline model, REP have a greater positive impact on FDI in countries with lower levels of FDI compared to those with higher levels (Figure 6). Conversely, EI has a stronger positive effect in countries with higher levels of FDI rather than in those with lower levels. The reason behind is that, in rich (developed) countries, promoting renewable energy often attracts more foreign investment (FDI) in places where there was not much investment before. This is because investors see a big opportunity in these countries the markets are still growing, and the promotion of clean energy shows that the government is serious and supportive. That makes investors feel more confident and willing to take the risk. But in countries that already have a lot of foreign investment, the market is often crowded, and there's less room to grow, so the same renewable energy policies do not make as big of a difference. In addition, regarding EI, it has a stronger positive effect on FDI inflows in countries that already have high levels of FDI because these countries often have better infrastructure, stable institutions, and more advanced technologies, making it easier and more profitable for investors to benefit from energy savings. In such environments, improving energy efficiency can significantly reduce operating costs for businesses, which attracts even more foreign investment. In contrast, countries with low FDI levels may lack the necessary infrastructure or supportive policies, so even if they improve energy efficiency, the overall business environment may still not be attractive enough to strongly boost FDI inflows. Again, the positive heterogeneous impact of GEP examined on FDI allowed us to reaffirm the first hypothesis that GEP enhance FDI.
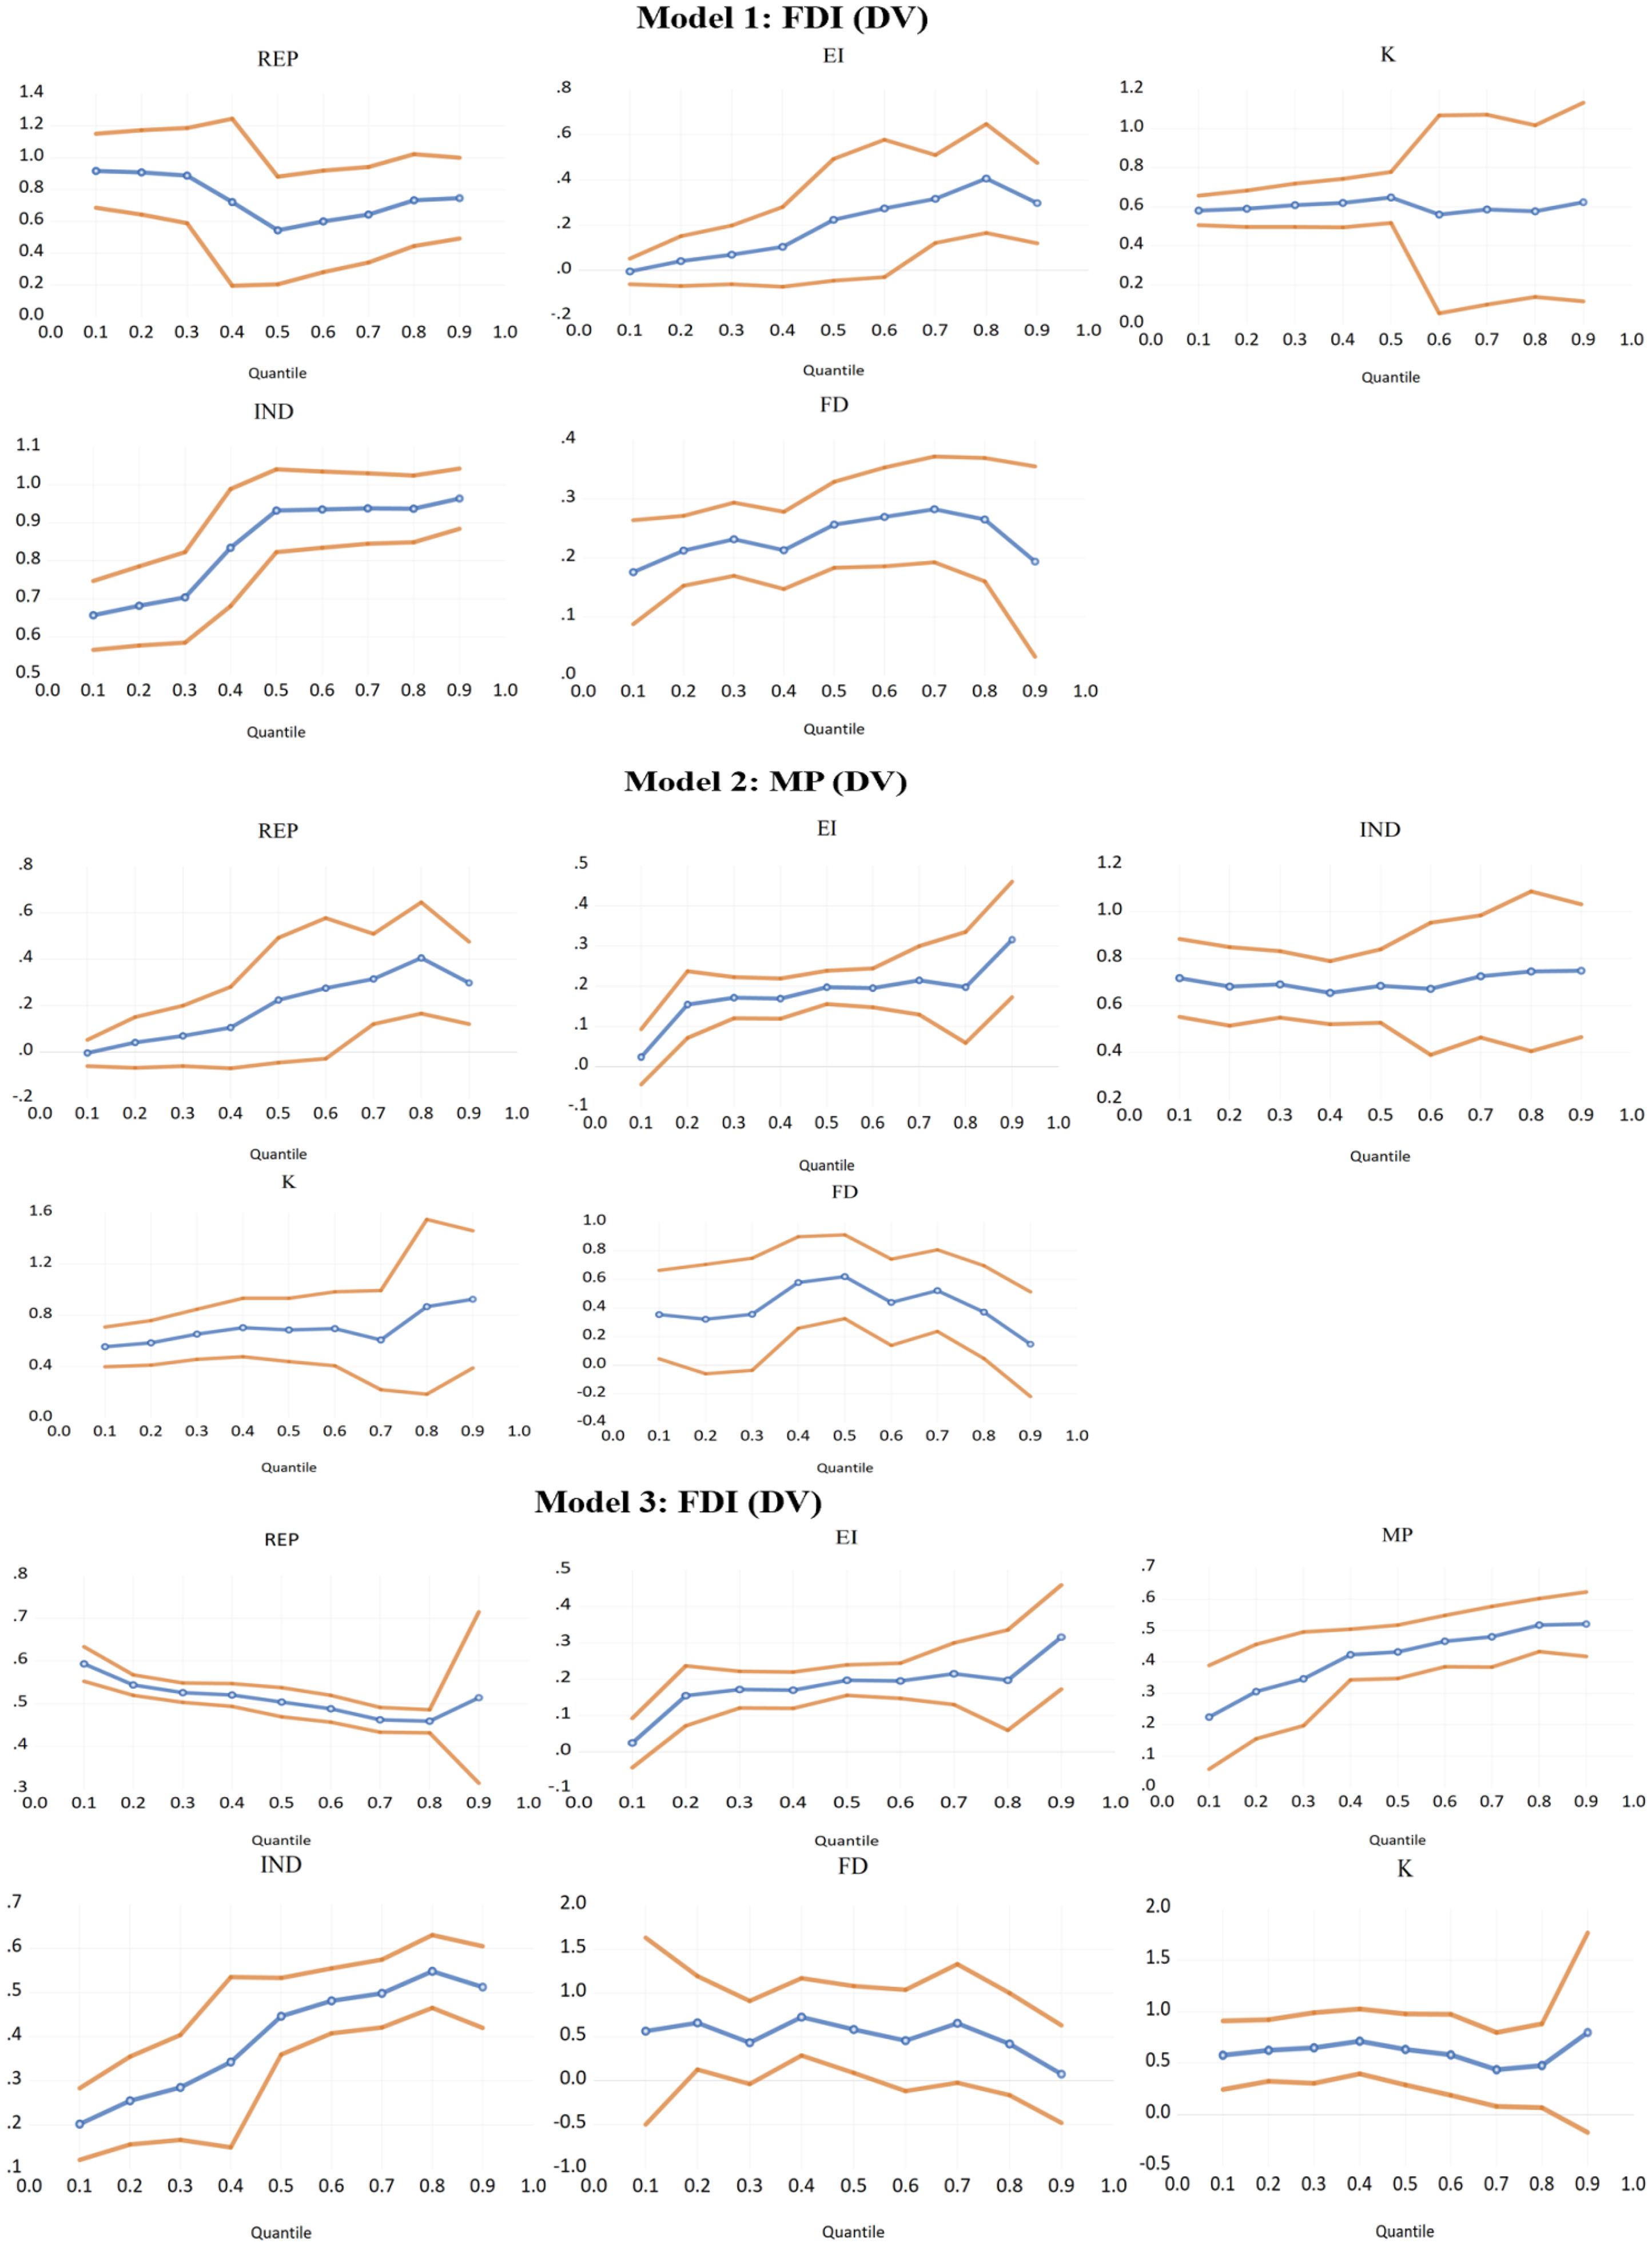
Heterogeneity analysis. The blue dashed line represents the shift of coefficients for panel quantile regressions. The 95% confidence interval is shown by the dashed yellow lines. Source: Authors’ illustrations.
Concerning heterogeneity in mechanism analysis, GEP (REP and EI) have heterogeneous positive effects on MP (Figure 6). The stronger positive effects are observed in countries with higher MP compared to those with lower MP. These findings are obvious because countries have varying levels of green energy innovations 121 and economic policies have different capacities to enhance MP of countries.118,122 About REP, in higher-income countries, the stronger positive effects of REP on MP are more evident in countries that already have higher MP because these countries typically have better infrastructure, stronger institutions, and more efficient markets to support and scale renewable energy initiatives. With stable economies, they can allocate more resources, attract greater private investment, and implement policies more effectively, leading to greater job creation, innovation, and energy cost savings. In contrast, countries with lower MP may face structural challenges such as limited funding, weaker governance, or slower policy implementation that reduce the impact of REP on their overall economic growth. Furthermore, in higher-income countries, EI have stronger positive effects on MP in nations with already high MP because these countries have the infrastructure, technology, and institutional capacity to fully leverage efficiency gains. High-performing economies can more effectively integrate advanced energy-saving technologies, reduce production costs, and boost productivity, which translates into greater economic growth. Additionally, these countries often have supportive policies, skilled labour, and access to capital, enabling faster and more impactful implementation of energy efficiency measures. In contrast, countries with lower MP may struggle with limited resources, outdated infrastructure, and weaker policy enforcement, which reduces the overall impact of EI on their economic performance.
Regarding heterogeneity analysis in the third model, the effects of the examined variables on FDI are heterogeneous (Figure 6). MP and IND have stronger positive effects in countries with higher FDI, but weaker positive effects in those with lower FDI. Again, REP have a greater positive impact on FDI in countries with lower levels of FDI compared to those with higher levels. Conversely, EI has a stronger positive effect in countries with higher levels of FDI rather than in those with lower levels. The findings imply that countries with FDI benefit more from MP, green energy development, and industrial development, indicating that policy efforts should focus on enhancing these areas to attract FDI. Conversely, countries with lower FDI may need to adopt targeted strategies to improve their macroeconomic conditions and industrial capabilities. These aspirations are in alignment with the current SDG 17, which underscores the necessity of global cooperation. 7 About MP as a variable of interest, in higher-income countries, stronger positive effects of MP on FDI inflows are observed in countries with higher existing FDI inflows because these countries tend to have more stable economic environments, better infrastructure, and well-established financial markets that create a favourable investment climate. High MP signals growth potential and reduces investment risks, which attracts even more foreign investors looking to capitalize on expanding opportunities. Additionally, countries with already substantial FDI benefit from network effects, such as better business ecosystems and skilled labour pools, making them more attractive destinations for additional investments. In contrast, countries with lower FDI inflows may face structural challenges or uncertainties that limit the impact of MP improvements on attracting new foreign investments.
About heterogeneity analysis in transmission models, in the fourth model, where CO2 is the explained variable, the effects of the examined explanatory variables are heterogeneous (Figure 5). GEP (RE and EI) have greater negative impacts on CO2 in countries with higher CO2 levels compared to those with lower CO2 levels. This is because, higher-income countries have more room for reduction and a greater reliance on fossil fuels, making policy interventions more impactful. When CO2 emissions are already high, even modest shifts towards cleaner energy sources and more efficient energy use can lead to significant absolute reductions in emissions. Additionally, governments in high-emission countries may implement these policies more aggressively to meet international climate commitments, amplifying their effect. In contrast, countries with already low CO2 levels have fewer emissions to cut, so the marginal impact of GEP tends to be smaller. In contrast, MP and FDI show stronger positive effects on CO2 in countries with higher CO2 levels rather than in those with lower levels. The reason is that, economic growth and increased foreign investment in these contexts are often linked to energy-intensive industries and greater consumption of fossil fuels. High CO2-level countries typically have larger industrial bases and transportation networks that contribute more significantly to emissions as economic activity expands. As a result, improvements in GDP and inflows of FDI can lead to higher energy demand, which, in the absence of strict environmental regulations or a strong shift towards clean energy, results in greater CO2 output. In contrast, countries with lower CO2 levels may already have cleaner energy systems, stricter environmental policies, or less energy-intensive economic structures, limiting the emissions impact of economic growth and investment. These findings imply that carbon neutrality policies must be tailored to the specific conditions of each country. In countries with higher CO2 emissions, implementing GEP may yield significant reductions in emissions, highlighting the need for aggressive climate strategies. Conversely, in nations with lower CO2 levels, enhancing MP and FDI could inadvertently lead to increased emissions, suggesting that careful management is necessary. Overall, a nuanced approach that considers the unique economic and environmental contexts of each country is essential for effectively achieving carbon neutrality. This aligns with the recommendations made by Lee and Zhao 123 and Xing et al., 124 who emphasized the importance of developing heterogeneous pathways for emission reduction.
In the fifth model, where CED is the dependent variable, heterogeneous effects have been observed (see Figure 6). MP and REP have stronger positive effects on CED in countries with lower levels of CED compared to those with higher levels. The reason is that, REP policies can catalyse innovation and technology transfer, which are crucial in underdeveloped areas to overcome traditional energy systems. In contrast, regions with established clean energy frameworks may already benefit from economies of scale and advanced technologies, making additional improvements less impactful. Thus, the combination of robust macroeconomic conditions and targeted renewable energy initiatives is essential for fostering clean energy growth where it is most needed. Conversely, the positive effects of EI and FDI are greater in countries with higher CED than in those with lower CED. This is because, the higher CED fosters a more sustainable and stable energy supply, which enhances operational efficiency for businesses, making them more attractive to foreign investors. Additionally, countries that prioritize clean energy often implement progressive policies and technologies that not only reduce environmental impact but also lower operational costs, thereby improving the overall investment climate. Furthermore, these countries are likely to benefit from a skilled workforce trained in clean technologies, which can drive innovation and productivity. In contrast, regions with lower CED (a reverse indicator of CEP) may face higher energy costs and regulatory risks, deterring FDI and limiting the benefits of energy efficiency initiatives. Thus, the synergistic relationship between CED and economic growth creates a more favourable environment for investment and efficiency gains. These prove that strategies to enhance CED should focus on improving MP and renewable energy policies in countries with lower CED levels, as these factors significantly boost development in such contexts. Conversely, for countries with higher CED, fostering energy investment and FDI can further enhance clean energy initiatives. This highlights the need for tailored approaches that consider a country's specific level of CED to effectively promote sustainable energy transitions as also mentioned by Gakuru et al. 29 in green energies countries. These goals align with the current SDG 7, which promotes universal access to clean and modern energy. 7
VD and IR technique
In high-income countries, we conduct an estimation of a panel SVAR model that incorporates cross-sectional dependence and is capable of addressing long-term dynamic relationships, following the methodology outlined by Pedroni. 108 The IR and VD approaches laid out by Lanne and Nyberg 109 were used to quantify the amount to which FDI, MP, REP, and EI may contribute to CO2 and CED. The findings of the IR and VD for a 12-year forecasting horizon are shown in Figures 7 to 9. In the situation of high-income countries, the findings urged that 50.145% of the fluctuations in CO2 can be attributed to unique shocks originating from CO2 itself, whereas FDI, MP, EI, and REP take part in 22.155%, 20.361%, 3.454%, and 3.885%, respectively. In the other part, the findings pointed out that 45.476% of CED changes can be accounted for by novel shocks originating from CED itself, whereas FDI, MP, EI, and REP account for 21.496%, 22.264%, 3.004%, and 6.760%, respectively. Through a comparison, CO2 variation caused by GEP (EI and REP) is the least. This implies that EI and REP in support of lowering CO2 emissions are at a typical level in the countries in question. However, FDI refers to the primary cause of rising CO2 in high-income countries. These FDI in higher-income countries can contribute to undermining carbon neutrality in several ways including increased emissions from industrial activities and natural resource extraction sectors (e.g. oil, gas, mining, etc.).
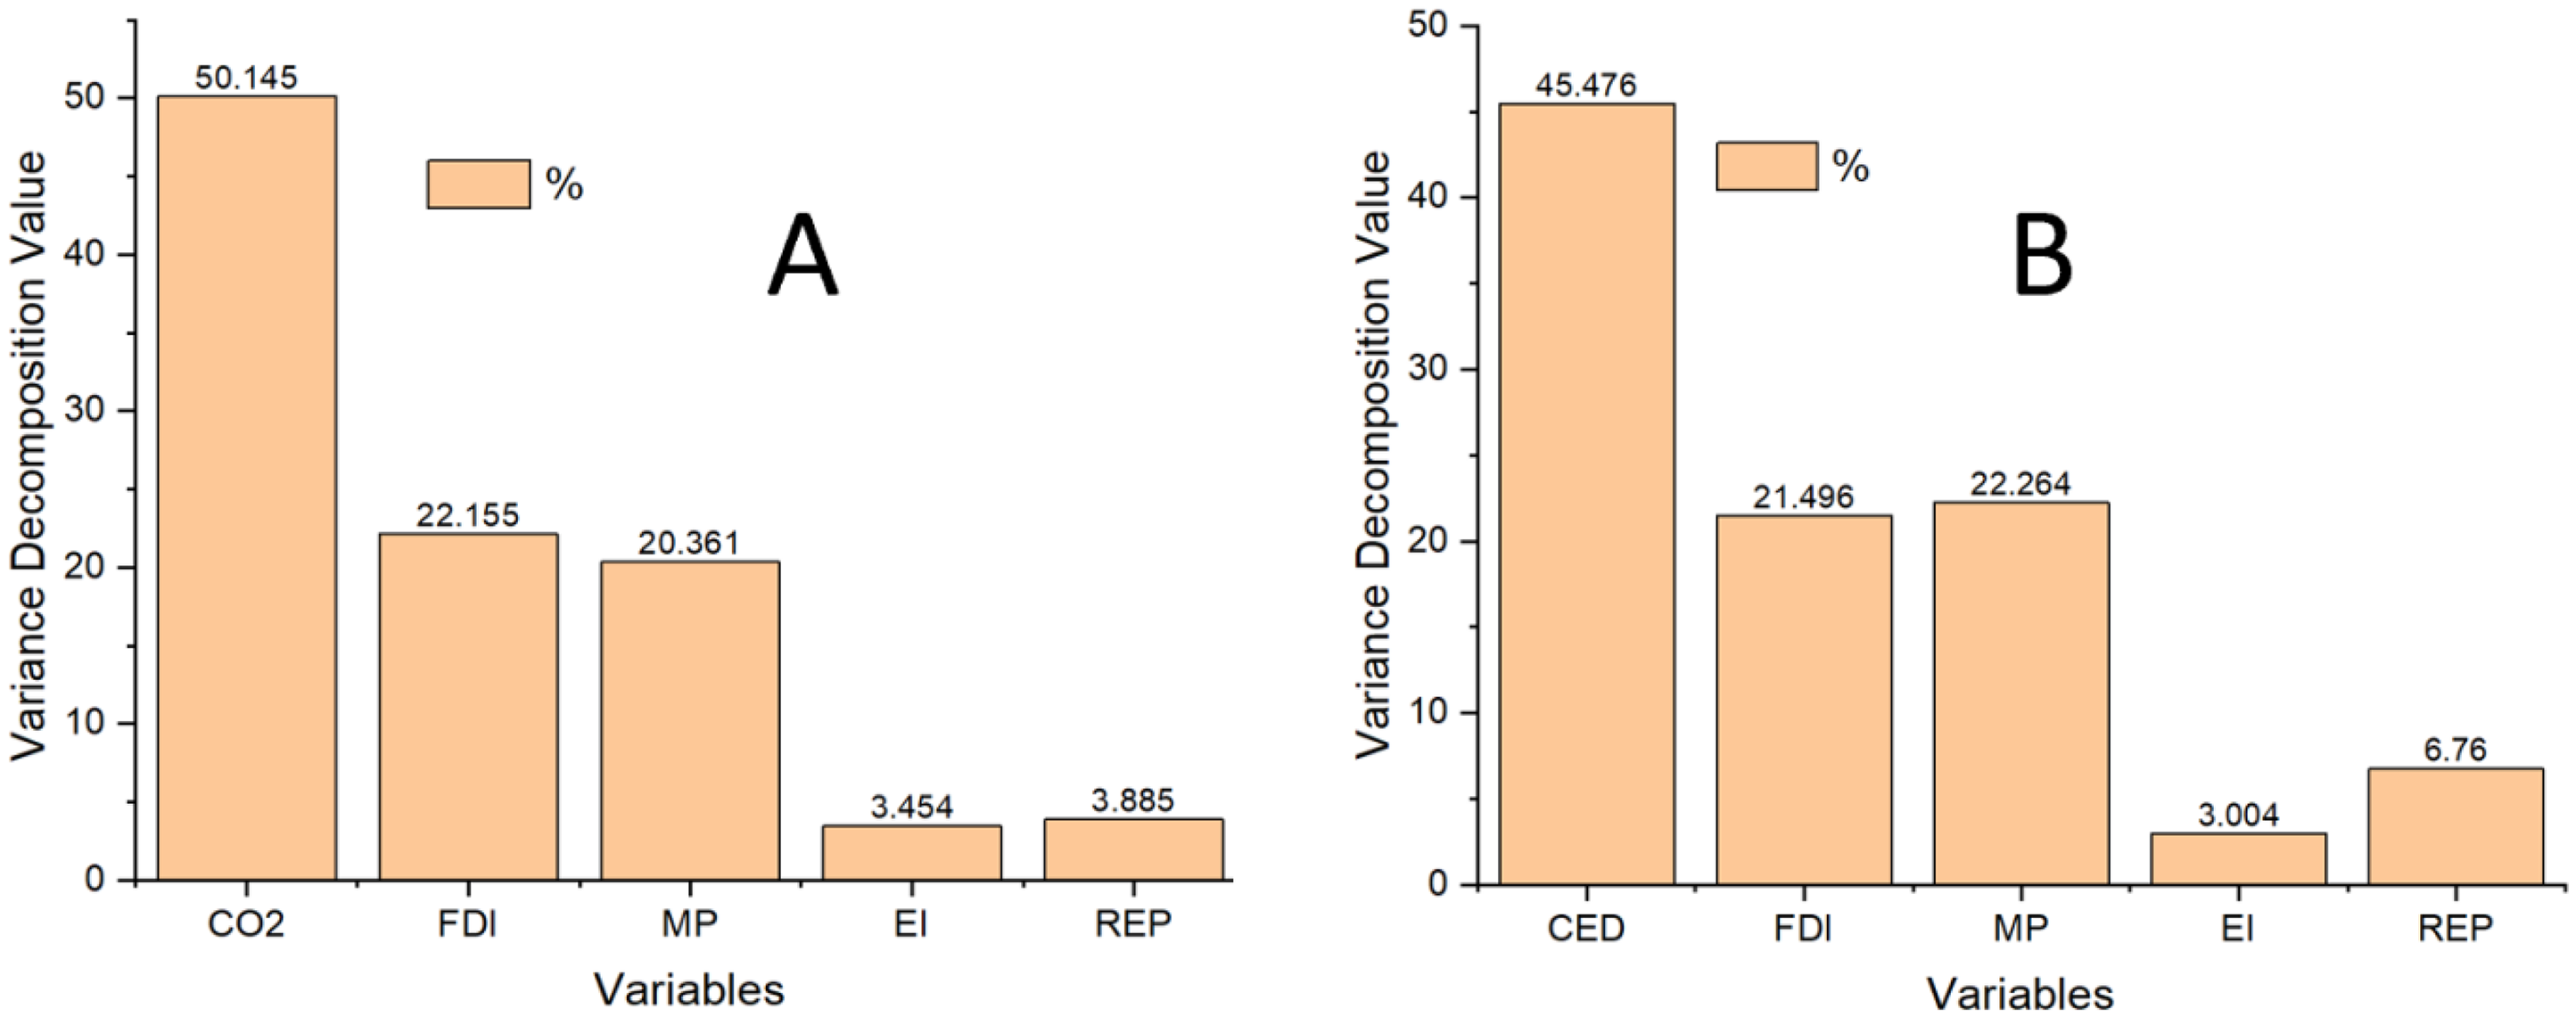
Variance decomposition (VD) results: (A) represents VD taking CO2 as a response (dependent) variable and (B) represents VD taking CED as a response (dependent) variable. The results throughout the 12 -year prediction period by considering only the variables of interest. Source: Authors’ illustrations. CED, clean energy development.
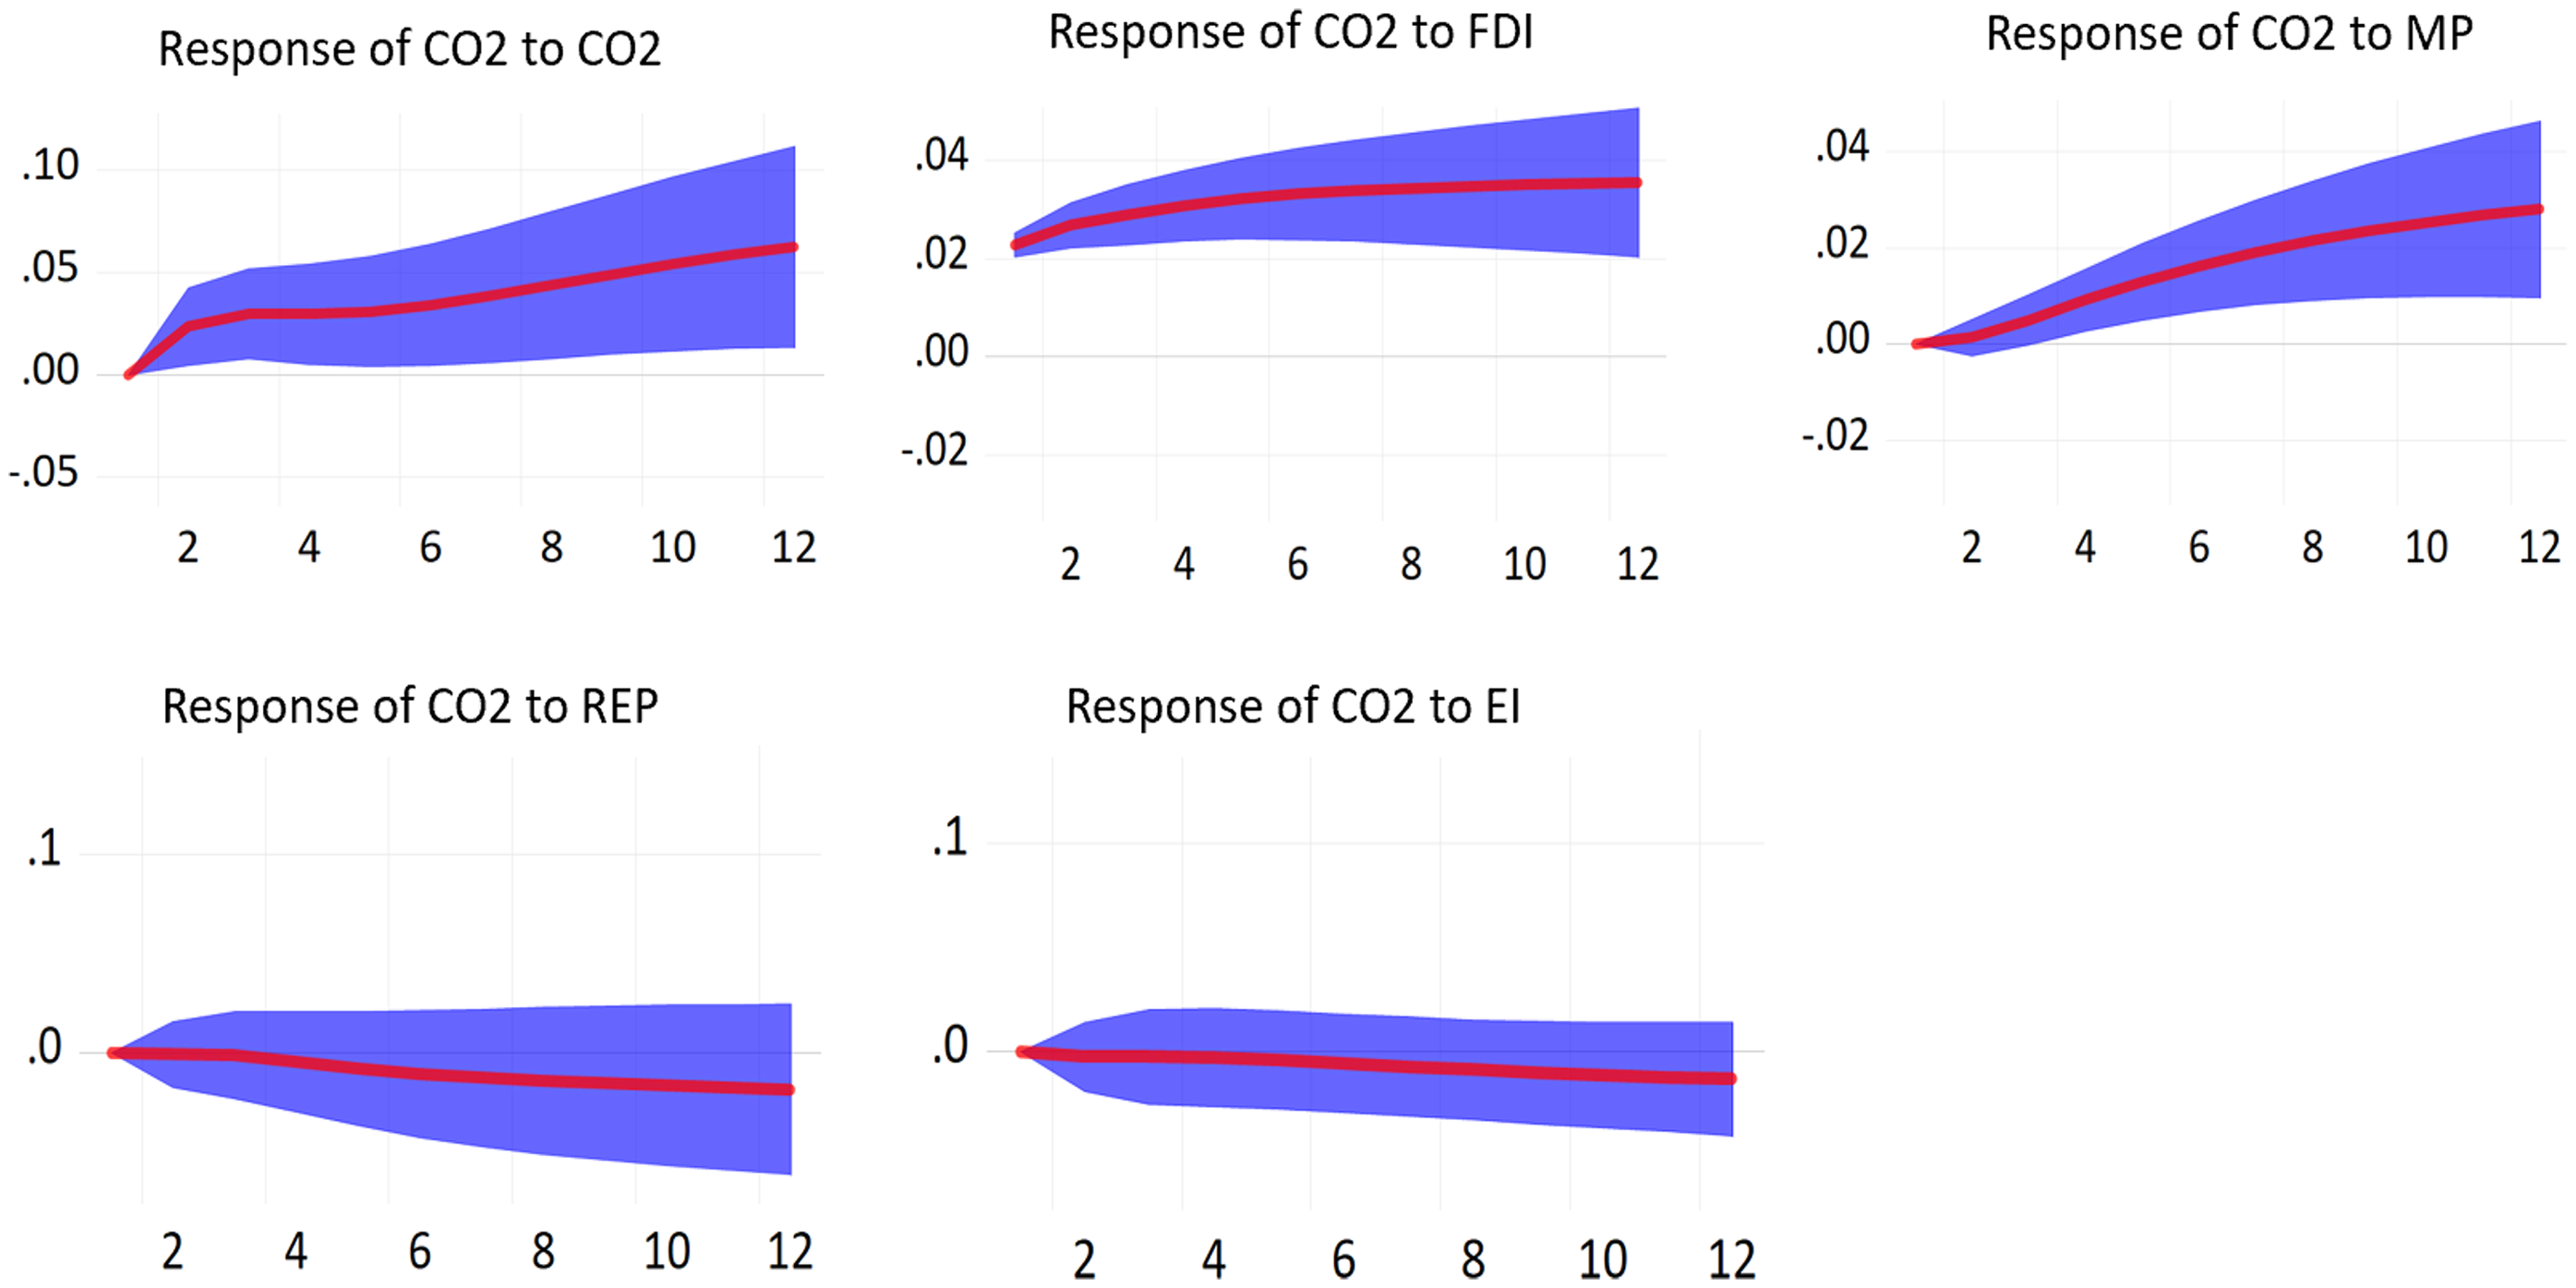
Impulse response results (CO2, dependent variable), blue shaded area (confidence intervals: 95%), red line (impulse response function), 12 years’ time horizon. Source: Authors’ illustrations.
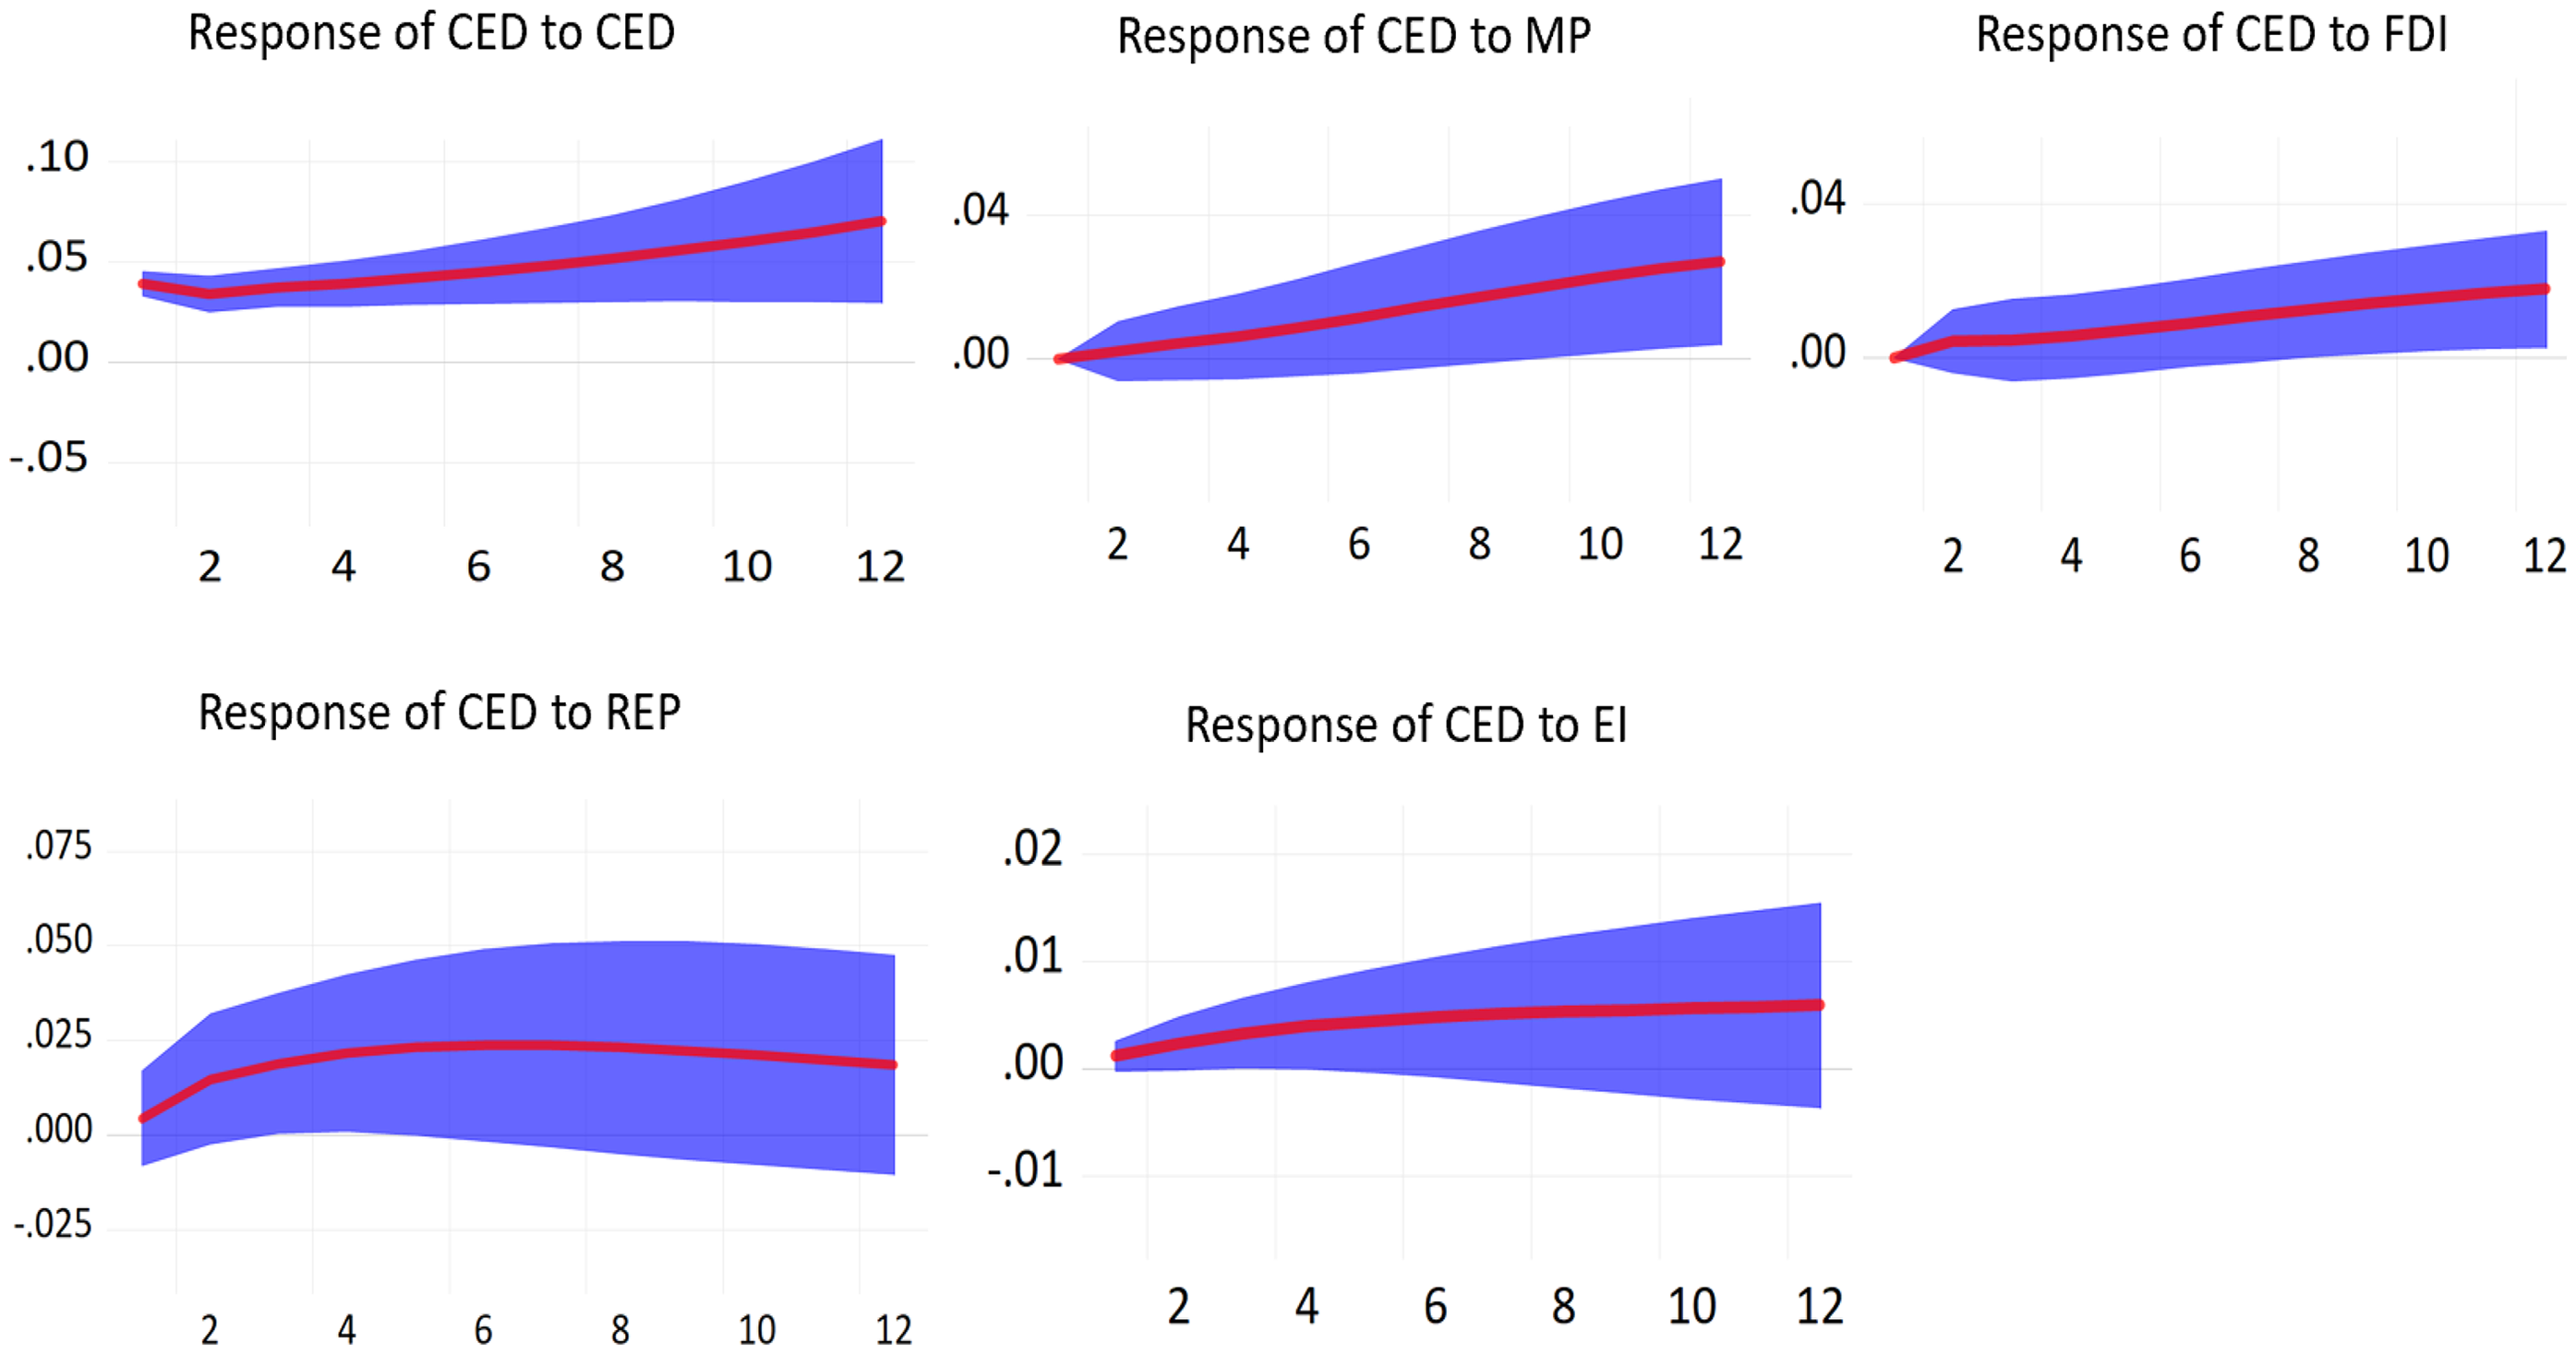
Impulse response results (CED, dependent variable), blue shaded area (confidence intervals: 95%), red line (impulse response function), 12 years’ time horizon. Source: Authors’ illustrations. CED, clean energy development.
About CED, MP is the first contributor to the reduction in CEP in these countries. This is obvious as increased MP alleviates energy poverty in countries by driving economic growth that enhances household incomes, thereby enabling greater access to energy resources. As economies expand, investments in infrastructure, such as electricity generation and distribution systems, become more feasible, improving energy access for underserved populations. Additionally, a thriving economy fosters job creation and increases government revenues, allowing for targeted policies and subsidies that support renewable energy initiatives and energy efficiency programmes. Consequently, improved macroeconomic conditions not only facilitate the availability of energy but also empower individuals to afford it, ultimately reducing energy poverty and promoting sustainable development. The overall findings reveal how FDI has a strong contribution in increasing CO2 (22.155%) and also a second contributor in decreasing CEP (21.496%), this confirms hypothesis 5. This highlights the need for actions to reverse the role of FDI in increasing CO2 emissions, as also suggested by Lee and Zhao. 123
The GEP (EI and REP) strongly contribute to carbon emissions reduction as well moderate reduction in CEP; this affirms hypothesis 4. This illustrates the presence of inequality in reducing carbon emissions and CEP among the higher-income countries in the examined transmission mechanisms (GEP, FDI, and MP). In addition, FDI does not transfer cleaner technologies to the economy and instead worsens carbon neutrality over the long and short terms. As a result, it supports the pollution haven hypothesis' existence in high-income countries. In the same way, MP introduces cleaner technologies into the economy and instead worsens carbon neutrality over the long and short terms. Therefore, the presence of the EKC hypothesis was not also found to be valid in the future due to the absence of inverted U-shaped curve IR of MP to CO2 in a 12-year forecast horizon, suggesting that strong policies are needed so that an increase in MP could potentially result in decreased carbon emissions in the upcoming years. The structural theory of CEP is confirmed in this study, as improvements in energy systems and economic policies are able to address this kind of poverty. This study brings new insights as it is able to compare the transmission impacts on carbon neutrality and CEP, which can provide an effective solution to the twin energy problems (carbon and poverty). This was neglected by our scholars in literature (for carbon neutrality see Baz et al., 34 Zha et al., 69 Meng and Yu 70 ; for CEP see Simionescu et al. 77 ).
Several studies have suggested that variables like agriculture, urbanization, industrial structure, globalization, economic development, population density, development expenditures, primary energy consumption, and others have an important impact on CO2 emissions125–128 and energy prices and household size are other factors that play a role in influencing energy poverty.129,130 However, this study has limitations on these variables due to inaccessible data or various values being missing. Other limitations include using proxy indicators due to the unavailability of direct measurements, and the study did not account for lower- and middle-income countries. This study also faced additional limitations, such as examining only 77 high-income nations and not taking into account lower- and middle-income countries; some variables utilized proxy indicators that were correlated with the targeted phenomenon, as direct measurements were not accessible due to data constraints. The final limitation is that the study utilized only six macroeconomic variables (GDP, employment rate, inflation, exchange rate, interest rate, and trade intensity) to quantify the MPI, which could also incorporate environmental factors, as suggested by Gakuru and Yang. 122
Conclusion and implications for policy
Conclusion
This research offers valuable insights into achieving clean energy accessibility within a carbon neutrality framework by emphasizing the roles of green energy development, MP, and targeted FDI policy interventions. Addressing these dual energy challenges necessitates coordinated global efforts to ensure sustainable development. However, there was limited understanding of how policies related to clean energy promotion and carbon neutrality influence progress towards these goals. Given the current fluctuations in MP, this study introduces a novel MPI as a mediating variable in the nexus between GEP and FDI. In addition to analysing the effects and mechanisms of GEP and FDI, the study also compares their heterogeneous impacts on achieving carbon neutrality and alleviating CEP.
This paper presents the following key conclusions: (1) GEP can significantly enhance FDI inflows, with greater effects of REP compared with EI. (2) MP mediates the GEP–FDI inflows nexus, with greater positive effects in higher FDI inflows countries. (3) In discussing the heterogeneous transmissions of GEP, MP, and FDI towards carbon neutrality and CEP, FDI contributes more to undermining carbon neutrality compared to the undermining impacts of MP and the favouring effects of GEP. In addition, MP contributes more to reducing CEP than FDI and GEP. (4) A deep analysis of transmission heterogeneity revealed that FDI has strong effects in countries with higher carbon emissions and higher clean energy accessibility countries. Then, MP and REP have strong effects in lower carbon emission countries and lower clean energy accessibility countries. These findings remain robust against endogeneity concerns, demonstrating consistency even when alternative econometric approaches, additional control variables, and substitutions of explanatory variables are applied. The study proved the presence of the pollution haven hypothesis in the high-income countries, using the novel MPI, the presence of the EKC hypothesis was also not found to be valid in the future due to the 12-year forecast period results and due to the below policy implications, the structural theory of poverty is proven in the context of CEP in the higher-income nations.
Policy recommendations
Building on the above conclusions, the following recommendations are proposed. First, given the significant positive mediating role of MP in GEP and FDI nexus, governments should strengthen macroeconomic fundamentals for greater impact. This should be implemented through fiscal discipline, stable exchange rates, and robust infrastructure can amplify the positive nexus between GEP and FDI. This can be achieved by prioritizing investments in human capital, renewable energy research, and regulatory reforms to build a resilient economic environment that supports clean energy growth. Second, given the significant positive contributions of GEP and FDI to MP and CED (fall in CEP) respectively, governments should create policy frameworks that actively integrate green energy incentives with measures to attract FDI. This includes offering tax breaks or subsidies to foreign investors who contribute to renewable energy projects or adopt energy-efficient technologies. Aligning FDI policies with environmental goals ensures sustainable economic growth and fosters innovation in clean energy sectors. Third, given FDI's negative impact on carbon neutrality, governments should implement strict environmental regulations for FDI to limit its contribution to carbon emissions. This includes enforcing carbon pricing, emissions caps, or mandatory adoption of clean technologies by foreign investors. Encouraging green FDI through environmental certification schemes can help reduce the carbon footprint of foreign investments. Fourth, given the contributing role of GEP in alleviating CEP, governments should expand GEP initiatives to address CEP. Here, governments should focus on expanding access to affordable renewable energy in underserved areas. This could involve decentralized solutions such as solar microgrids, targeted subsidies for low-income households, and public–private partnerships to increase clean energy infrastructure. Fifth, given the beneficial effects of GEP, MP, and FDI on CED (a reverse indicator of CEP), as well as the positive impacts of MP and FDI on CO2 emissions, governments should promote additional GEP related to FDI inflows. This includes encouraging innovations in the green digital economy-based FDI. These include encouraging FDIs highly promoting artificial intelligence and Internet of Things innovations for boosting their economy by optimizing resource use, enhancing productivity. This could be simultaneously controlling carbon emissions through real-time monitoring, predictive analytics, and efficient energy management. Hence, addressing CEP reduction while simultaneously managing carbon emissions in high-income countries requires a balanced approach that encourages sustainable economic growth while mitigating environmental impact. As a matter of fact, transition assistance for affected industries is vital. These aspirations are in alignment with the current SDG 17, which underscores the necessity of global cooperation; SDG 7, which advocates for universal access to clean and modern energy; and SDG 13, which emphasizes the necessity of “taking urgent actions to combat climate change and its impact’.
Limitations and avenues for future research
Taking into account the study's limitations and findings, several directions for upcoming research are available. First, when analysing the GEP–FDI relationship in the nations under investigation, one should focus on spatial and spillover impacts. Likewise, more research can be undertaken within regions, as well as through cross-country comparative studies or case studies, to validate these findings. Second, due to the potential for omitted variable bias, it is advisable to utilize additional factors that contribute to FDI, CO2 emissions, and CEP, such as gross market size, legal framework, technological advancement, level of privatization, technological innovation, political stability, and others. Third, the study utilized only six macroeconomic variables (GDP, employment rate, inflation, exchange rate, interest rate, and trade intensity) to quantify the novel MPI, which should also be improved to incorporate environmental factors in future research. Fourth, given our preliminary findings that the GEP–FDI relationship is, at the very least, partially mediated by MPI, it is imperative to investigate all possible paths through which GEP could influence FDI in order to shed further light on the FDI development in high-income nations. Fifth, although panel SVAR models attempt to address endogeneity in transmission analysis, they have limited capacity to handle nonlinear dynamics. Future researchers could employ machine learning-based approaches to analyse nonlinear interactions within heterogeneous transmissions to carbon neutrality and CEP. Both ongoing and future studies that address these limitations have the potential to significantly improve countries’ MP, enhance environmental sustainability, and optimize clean energy systems.
Footnotes

Funding
The authors disclosed receipt of the following financial support for the research, authorship, and/or publication of this article: This work was supported by the Shaanxi Philosophy and Social Sciences Office (grant number 2023D003).
Declaration of conflicting interests
The authors declared no potential conflicts of interest with respect to the research, authorship, and/or publication of this article.
Data availability
Data are available on request.