



Abstract
The present study explores the potential of wild elephant grass (EG), for co-production of ethanol and xylitol. Alkaline H2O2-pretreated-EG was hydrolyzed by a tailor-made cocktail of recombinant bacterial crude cellulolytic and xylanolytic enzymes, used for co-fermentation. Candida tropicalis (MTCC 230) was adapted in medium having both C5 and C6 sugars. Three significant parameters, inoculum size, S:N in medium and orbital shaking speed (rpm), were optimized using response surface methodology (RSM) and artificial neural network linked genetic algorithm (ANN-GA) for bioethanol and xylitol production. The predictive capabilities of both models were compared. ANN-GA predicted optimum conditions were 10% (v/v) initial inoculum size, the S:N ratio 37.4 and rpm 250 gave 27.4 g/L (0.42 g/gglucose) ethanol and 5.1 g/L (0.44 g/gxylose) xylitol titres with KLa of 194 h−1. The ANN-GA optimized parameters gave 22.3% and 13.3% higher ethanol and xylitol yields, respectively, than those predicted by the RSM-based model. The current innovative method of co-producing ethanol and xylitol from EG offers a promising alternative to traditional bioethanol production.
This is a visual representation of the abstract.
Keywords
Introduction
The concept of biorefinery is rapidly rising as a sustainable means to generate several value-added bioproducts from biomass with a significant benefit of a carbon-neutral cycle. 1 Various studies have been established, representing the potential of lignocellulosic feedstock based biorefineries in terms of their availability and anticipation of food-to-fuel race. 2 Elephant grass (EG) is wild-invasive grass with fast-growing properties, low nutrient requirement and high biomass yield. 3 Due to its high cellulosic and hemicellulosic fraction in the entire grass family, this feedstock is suitable for lignocellulosic biorefineries. 4 Cellulose and hemicellulose are two major polysaccharides of lignocellulosic biomass, composed of glucose and xylose as presiding sugars, respectively, that can be fermented to give bioethanol. 5 However, fermentation of bioethanol from xylose is challenging, in terms of low ethanol yield and productivity. 6 Therefore, the focus has shifted towards the production of other xylan-based commodities, possessing high market value. The idea will provide an integrated approach to biorefinery and support bioethanol's cost-efficacy, as the global market size for bioethanol is valued at approximately USD 55.5 billion. 7 The xylose present in the xylan chain of a lignocellulosic substrate could be bio-converted to xylitol, a sugar alcohol that has an eminent application in pharmaceuticals, cosmetics, food and chemical industries. 8 The global xylitol market is growing and is projected to cross 1.37 billion by 2029. 9 Thus, producing both ethanol and xylitol would greatly enhance the profitability of biorefineries that utilize lignocellulose.
Implementing the strategy of sequentially producing xylitol and ethanol from a glucose and xylose mixture with good yields offers a promising approach to enhance the economic efficiency of biorefineries. This method is advantageous due to its lower operational and labour costs. 10 Till now, several microorganisms have been explored for the xylitol production, but yeast has been stated to be the most efficient one. Yeasts like Candida boidinii, Candida tropicalis, Pachysolen tannophilus, Candida guilliermondii and Debaryomyces hansenii have been explored widely for their xylitol production abilities. 11 C. tropicalis is found to be one of the appropriate species for the production of both bioethanol and xylitol from glucose and xylose, respectively. 12 Xylose metabolism in C. tropicalis is primarily governed by two major enzymes, xylose reductase and xylitol dehydrogenase. 13 Xylitol is an intermediate product in the xylose fermentation. A dual enzymatic redox reaction takes place, in which firstly, xylose undergoes a reduction reaction by NADPH-dependent xylose reductase enzyme to give xylitol. The xylitol is further oxidized to xylulose by NAD+ dependent xylitol dehydrogenase. Xylulose is utilized by cells in their metabolism and cell growth. The formation of xylulose from xylitol should be regulated to achieve a higher yield of xylitol. 11 There are some crucial factors governing the yield of xylitol in C. tropicalis mediated xylose metabolism. One of them is reducing the NAD+ to NADPH ratio in the cell, which is highly affected by the oxygen level present in the culture environment. The oxygen availability is either expressed in terms of volumetric oxygen transfer coefficient (KLa) or oxygen transfer rate. 13 Apart from that, nitrogen source is also an essential factor in xylitol production, as it supplies vital vitamins and minerals to stimulate the oxidative phase of the cell's pentose phosphate pathway. Thus, nitrogen sources at their optimum concentration are crucial to govern the metabolism of xylose in C. tropicalis.
The present study explores the effect of initial inoculum size, volumetric oxygen transfer rate (based on rpm) and sugar to nitrogen (S:N) ratio on C. tropicalis-mediated production of bioethanol and xylitol from alkaline hydrogen peroxide pretreated elephant grass (AHPpEG). The study is the first to develop response surface methodology (RSM) and artificial neural network linked genetic algorithm (ANN-GA) based models to predict the relation and interaction of input variables (inoculum %, S:N ratio and orbital shaking speed, rpm) and the output variables (ethanol and xylitol production). An RSM-based central composite design (RSM-CCD) model and neural network were developed based on the experimental data, and their efficiency was compared. Machine learning techniques including ANN and GAs can imitate diverse features of biological information for data modelling and could be beneficial for learning non-linear biochemical interactions. 14 The main objective was to identify the optimal operating conditions for separate hydrolysis and fermentation (SHF) to simultaneously produce bioethanol and xylitol from AHPpEG.
Material and methods
Feedstock processing and pretreatment
The feedstock, EG was harvested from the campus of the Indian Institute of Technology, Guwahati, Assam, India (26.2°N, 91.7°E) during post-monsoon period, in the month of September 2022. The biomass, EG dried at 80°C (until a constant weight was achieved), was milled and sieved in a range of <1 mm particle size. The alkaline hydrogen peroxide (AHP) pretreatment of the processed biomass was performed under optimized conditions as reported in our previous study. 15 The EG was pretreated with 4.2% (v/v) AHP at 100°C for 148 min. The AHP pretreated EG (AHPpEG) contained 67.8%, (w/w) cellulose, 19.1%, (w/w) hemicellulose and 6.5%, (w/w) lignin on a dry biomass basis analyzed by Technical association of paper and pulp industry 16 and National renewable energy laboratory method. 17
Recombinant crude enzyme cocktail-mediated saccharification
A novel tailor-made recombinant crude enzyme cocktail (ReCEC) formulation comprising chimera (endoglucanase and β-glucosidase, CtGH1-L1-CtGH5-F194A), cellobiohydrolase (CtCBH5A), endo-1,4-β-xylanase (CtGH11A) from Clostridium thermocellum, β-xylosidase (BoGH43A) from Bacteroides ovatus and arabinofuranosidase (PsGH43) from Psedupedobacter saltans in an optimum proportion of 45:20:10:10:15 respectively, containing 2 g/L of TritonX-100 was utilized for the hydrolysis of AHPpEG.
18
The saccharification was performed at 15% (w/v) solid loading with 6.4 FPU/mL (42 FPU/gAHPpEG) of total enzyme cocktail dose at 35°C and 180 rpm for 48 h. The formulated enzyme cocktail gave 544 mg/gAHPpEG TRS yield with glucose and xylose titres as 65.3 g/L (435 mg/gAHPpEG) and 15.8 g/L (106 mg/ gAHPpEG), respectively. The reducing sugars content in the hydrolysate was estimated by High-Performance Liquid Chromatography, HPLC coupled with a refractive index (RI) detector (Shimadzu Corporation, Japan). An aliquot of 1 mL of the saccharified hydrolysate was centrifuged at 13000 g for 10 min and supernatant was taken for HPLC analysis. The column used was reverse phase Rezex™ ROA-Organic Acid 8% cross-linked H+, LC Column 200 × 10 mm with guard column: Rezex™ ROA-Organic Acid 8% cross-linked H+, LC Guard Column 60 × 10 mm (Phenomenex, CA, USA) with 5 mM H2SO4 as mobile phase at the flow rate of 0.6 mL/min.
Pre-culture and adaptation of C. tropicalis cells in the fermentation medium
The fungus, C. tropicalis MTCC 230 was used for sequential fermentation of glucose and xylose fermentation. It was purchased from the Institute of Microbial Technology (IMTECH), Chandigarh, India. It was maintained on Malt Yeast extract agar slant containing (per L): malt extract 3 g; yeast extract 3 g; peptone 5 g; dextrose 10 g; agar 20 g. 19 The cells from agar slant were aseptically transferred to 10 mL preculture medium consisting of (per g/L): yeast extract 20; dextrose 20; peptone 10; MgCl2 5; KH2PO4 1; (NH4)2SO4 0.5 at pH 5.5 in 250 mL Erlenmeyer flask and incubated at 30°C and 180 rpm for 24 h. Further, C. tropicalis cells were adapted in an adaptation medium consisting of both C5 and C6 sugars to mimic the natural environment of production or fermentation medium. The adaptation medium contained (per g/L): yeast extract 20; dextrose 20; xylose 20; MgCl2 5; KH2PO4 1; (NH4)2SO4 0.5, pH maintained at 5.5. The C. tropicalis cells were sub-cultured 2 times in 100 mL volume of adaptation medium, pH 5.5 in 250 mL Erlenmeyer flask with 5%, v/v inoculum incubated at 30°C and 180 rpm for 24 h.
Inoculum and production medium
The C. tropicalis, yeast cells grown in adaptation medium (mentioned in Preculture and adaptation of C. tropicalis cells in the fermentation medium section) were used as inoculum for the further fermentation experiments. SHF were carried out for the optimization of the entire fermentation process. The production medium was prepared using AHPpEG saccharified hydrolysate, which contained 65.3 g/L (435 mg/g.AHPpEG) glucose and 15.8 g/L (106 mg/gAHPpEG) xylose, as the source of sugar (S), along with 5 g/L MgCl2 and 1 g/L KH2PO4. The inoculum size (1 to 10%, v/v) and S:N ratio (1 to 100) were varied by adjusting the concentration of the nitrogen source, (NH4)2SO4 (g/L). The orbital shaking speed (30–250 rpm) was adjusted for each fermentation set based on the experimental design generated using Design Expert 7.0 (Stat-Ease, Inc., USA). The detailed description is given in Response surface methodology for integrated ethanol and xylitol production process section. The optimization run for the fermentation process was conducted with 40 mL of production medium in a 100 mL Erlenmeyer flask at varying rpm incubated at 30°C for 24 h.
RSM for integrated ethanol and xylitol production process
Experimental design
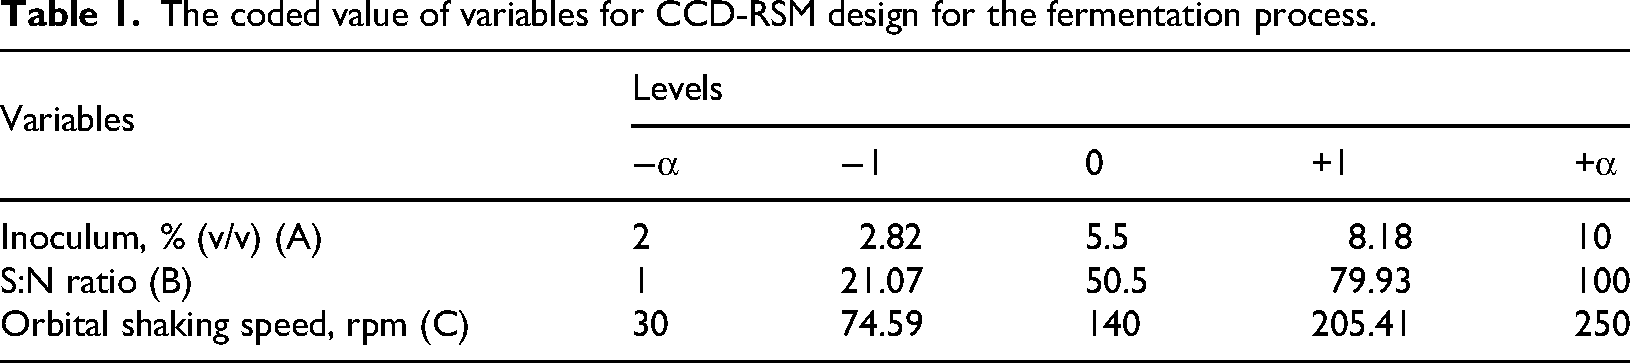
To enhance the ethanol and xylitol concentration, the RSM-CCD was adopted to estimate the optimal values of the three significant factors, inoculum size (v/v) (A), S:N ratio (B) and rpm (C). The factors were adjusted at five coded levels (−α, −1, 0, +1 and +α). The upper and lower coded levels of the variables were 1 to 10% (v/v) for inoculum size (A), 1 to 100 for S:N ratio (B) and orbital shaking speed, 30‒to 250 rpm (C). The complete design summary is shown in Table 1. Ethanol and xylitol concentration (g/L) were taken as two crucial responses, R1 and R2, respectively, in the optimization process. The software, Design Expert 7.0 (Stat-Ease, Inc., USA) generated 20 experimental runs with eight factorial, six central and six star points given in Table 2. Each experimental run was conducted under software-generated conditions at 30°C for 24 h with 40 mL of production medium in a 100 mL Erlenmeyer flask. An aliquot of 1 mL from the fermentation broth was withdrawn after every 6 h of interval till 24 h. Samples were centrifuged at 13,000 g for 10 min and the supernatant was further analyzed for ethanol and xylitol concentration. Both the responses were measured by High-Performance Liquid Chromatography (HPLC, Shimadzu Corporation, Japan). The column used was reverse phase Rezex™ ROA-Organic Acid 8% cross-linked H+, LC column 200 × 10 mm (Phenomenex, CA, USA) was used with 5 mM H2SO4 at a 0.6 mL/min flow rate as mobile phase. Commercial 95% (v/v) ethanol and xylitol were used as standards and detected via a refractive index (RI) detector. The ethanol and xylitol yield in g/g were calculated by using equations (1) and (2), respectively.
20


The coded value of variables for CCD-RSM design for the fermentation process.
Dataset for experimentally determined RSM and ANN predicted values for ethanol and xylitol yield using AHPpEG biomass.

Where EtOHf and EtOHi represent final and initial ethanol concentration (g/L),
Gluf and Glui represent final and initial glucose concentration (g/L);
XyOLf and XyOLi represent final and initial xylitol concentration (g/L);
Xylf and Xyli represent final and initial Xylose concentration (g/L).
Statistical analysis of the model generated
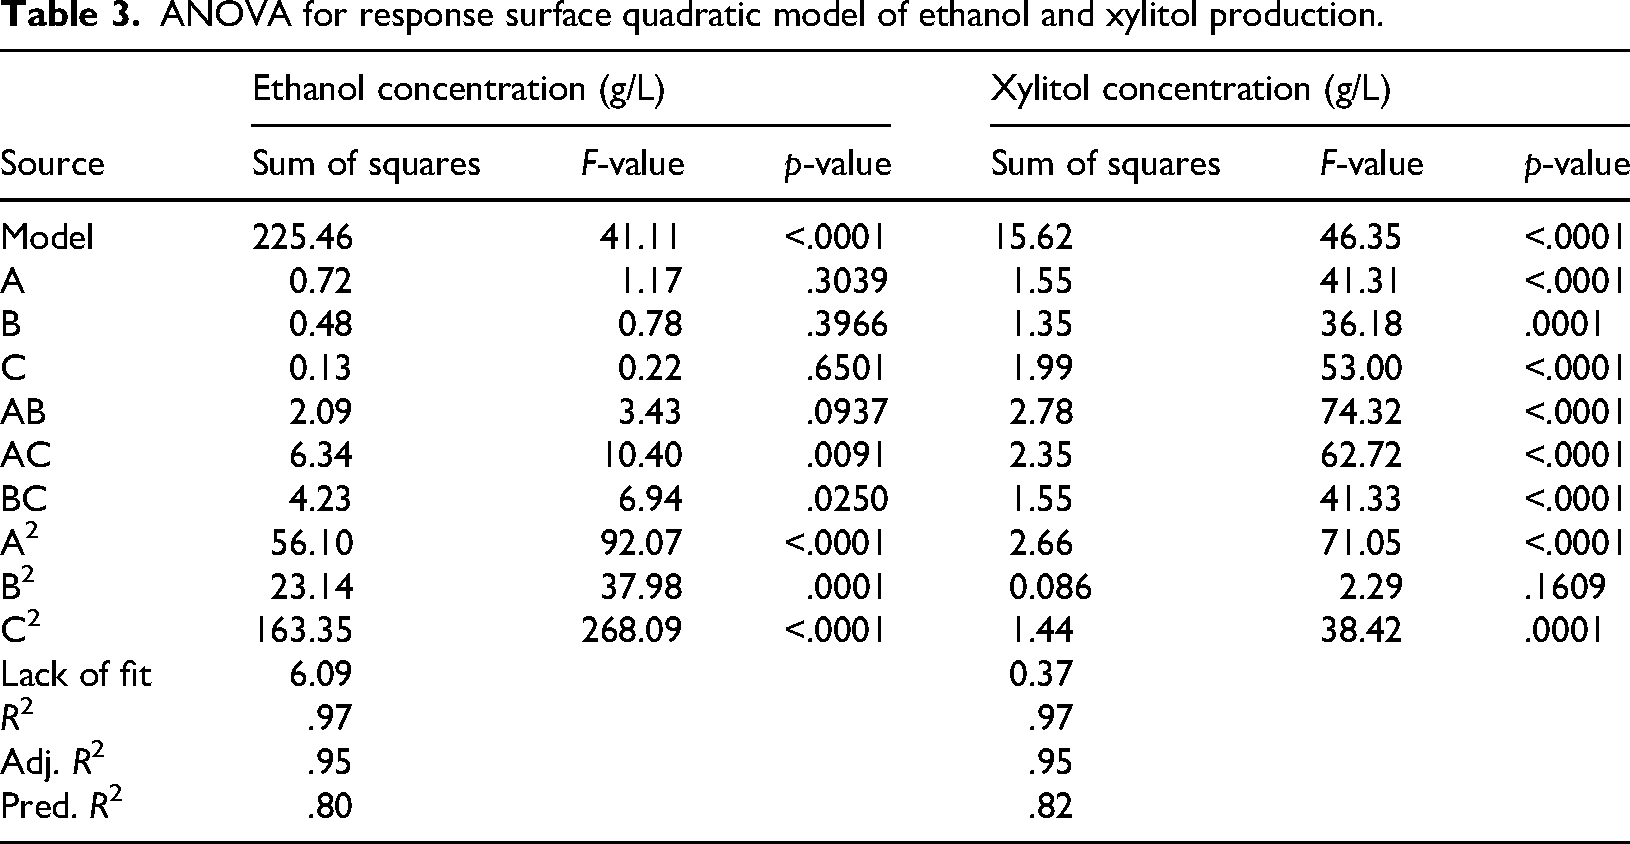
The two responses were calculated, summarized and analyzed using Design Expert 7.0 (Stat-Ease, Inc., USA). The statistical significance of the model was estimated with analysis of variance (ANOVA) test, F-test and p-value (Table 3). The quality of the quadratic polynomial fitted model was determined by R2 coefficient, adjusted R2, predicted R2 and lack of fit of the model. The numerical optimization technique was employed while keeping all the independent variables in the range and responses were set to be maximized. The desirability function method was utilized to obtain the optimum conditions with desirability values near 1.00.
ANOVA for response surface quadratic model of ethanol and xylitol production.
Artificial neural network-based modelling
To better predict the optimized conditions for the co-production of ethanol and xylitol in the fermentation medium an ANN-based model was developed. The experimental runs generated through RSM-CCD (mentioned in Response surface methodology for integrated ethanol and xylitol production process section) were used to construct the architecture of ANN. Neural networking was executed on the same experimental data used for RSM for optimization. All the computations and analyses were performed by using MATLAB R2023b (MathWorks INC., Natick, USA). Levenberg-Marquardt's feed-forward algorithm was employed to train the network.
21
The neural network has three layers namely, input, hidden and output layers. The trained network architecture consists of three neurons for the input layer [inoculum size (v/v) (X), S:N ratio (Y) and rpm (Z)], a hidden layer and two neurons for the output layer [ethanol (A) and xylitol yield (B)]. The bifurcation of dataset was done as 70%, 15% and 15% as training data points, test data points and validation data points, respectively. Based on the number of training data sets, input layer and output layer, number of hidden neurons was calculated by using the following empirical formula (equation (3)).22,23
Where, NH is number of hidden layers;
NI is number of input neurons;
NO is number of output neurons;
NT is number of training dataset.
The dataset was trained multiple times to obtain the best-fitted model based on the accuracy of prediction in the testing phase. The generated model was analyzed each time based on an error histogram and regression plot. The model generated was exported to the network function for MATLAB coder in matrix-only argument and a command was given to obtain the ANN predicted response for respective runs mentioned in Table 2. The codes generated were used for further GA-based optimization of the dataset.
GA-based optimization of fermentation process parameter
A GA-based optimization was run on the developed ANN model, using MATLAB R2023b (MathWorks INC., Natick, USA) to optimize the given variables to obtain maximized value for both the responses. A stochastic search approach is adopted by the GA for process optimization, which relies on the initial population size. 24 The algorithm is trained multiple times to produce supreme offspring in following generations. This implies that the best-evolved individual arises in the subsequent generation that is being converted into the best solution for the model. 25 The total number of generations and population size used in the present study were 100 and 50, respectively. The GA parameters used to obtain the optimal desired combination are given in Table 4. In each subsequent generation, the superior offspring replaces the least fit one to produce a new population. The process of selection of fittest continues till the algorithm finds the finest individual that evolved, denoting it with the optimum solution.
Working parameters of genetic algorithm.

Comparative analysis of RSM and ANN-GA model
A comparative analysis was conducted on the predictive performance and regression plots of models generated using RSM and ANN-GA. The experimental data, alongside the predicted values from both RSM and ANN-GA for ethanol concentration (R1) and xylitol concentration (R2) across various input combinations, are summarized in Table 2. In addition to evaluating the predictive accuracy of the responses, the R² values and the optimal conditions predicted by both models were examined. The comparative analysis was carried out in order to determine which model is more reliable for practical applications.
Validation of the developed RSM and ANN-GA model
The experimental validation for both RSM and ANN-GA predictions was carried out at their optimal reaction conditions. The validation of the optimized conditions of fermentation for co-production of ethanol and xylitol predicted by RSM, viz. 6.06% (v/v) inoculum with 34.97 S:N ratio at 118.8 (∼119) rpm and by ANN-GA, viz. 9.9% (v/v) inoculum, 37.4 S:N ratio at 249.9 (∼250) rpm in the fermentation medium as mentioned in Inoculum and production medium section was performed at 30°C for 24 h. The working volume, 40 mL in Erlenmeyer flask of 100 mL was used and the validation was carried out in triplicate sets. The sample (1 mL) was withdrawn after every 6 h of interval till 24 h for the estimation of cell growth, ethanol and xylitol yield. The aliquoted sample was centrifuged at 13,000 g for 10 min and the supernatant obtained was filtered, through 0.2 µm membrane using a syringe filter for HPLC analysis (mentioned in Experimental Design section). The volumetric oxygen transfer coefficient, KLa for the optimized rpm was calculated by using the following empirical formula given in equation (4).
26

where, KLa is volumetric oxygen mass transfer;
variable ‘n’ is orbital shaking speed (g or rps);
A/V represents the superficial area per filling volume.
Result and discussion
Experimental design for process optimization of the co-production of ethanol and xylitol
Batch fermentation of AHPpEG saccharified hydrolysate by using C. tropicalis was optimized with three independent variables: (A) inoculum, % (v/v), (B) sugar to nitrogen (S:N) ratio and (C) orbital shaking speed (rpm). The AHPpEG saccharified hydrolysate was supplemented with (NH4)2SO4 as a nitrogen source in the fermenting medium for enhancing C. tropicalis growth and productivity during the fermentation. The RSM-CCD design with 20 runs was generated and experiment was performed at 30°C for 24 h with a reaction volume of 40 mL in 100 mL Erlenmeyer flask. The maximum value of 24.3 g/L ethanol (R1) and 5.3 g/L xylitol (R2) was recorded. While, the minimum concentration recorded was 15.1 g/L and 1.6 g/L for R1 and R2, respectively (Table 2).
Statistical analysis of the model developed by RSM
The responses obtained for all 20 runs, including eight factorial, six central and six star points were fitted to the quadratic polynomial regression equations given below (equations (5) and (6)). An empirical relation in coded values between the responses (R1 and R2) and the three variables (A, B and C) was established. The significance of each term in the quadratic regression model was analyzed through ANOVA and is given in Table 3. The R2 and adjusted R2 values of .97 and .95, respectively, were attained for both the responses, ethanol and xylitol concentration. Whereas, the predicted R2 values of .80 and .82 was obtained for ethanol and xylitol concentration, respectively, suggesting that the attained outcomes fit well in the quadratic regression model. In the present study, the model possesses a higher F value of 41.1 and 46.35 for R1 and R2, respectively, indicating the acceptability of the designed model.
27
An ‘adeq precision’ of ˃4 is always desirable. The current model presents 17.5 and 23.8 adeq precision for R1 and R2, directing to proceed in the design space.

The significance of the model generated was justified with the p-value of < .0001 obtained for the responses. It was observed from the ANOVA table that the linear terms (A, B and C), interacting terms (AB, AC and BC) and quadratic terms (A2 and C2) play a significant role in xylitol production. While, interacting terms (AC and BC) and quadratic terms (A2, B2 and C2) are significant model terms in ethanol production (Table 3). In the case of R1, all three variables in their linear and interacting forms impart a substantial effect on the xylitol production, however S:N ratio (B) is in its quadratic form, accounting for a non-linear and negative impact. This can be inferred as, the increased S:N ratio in the fermenting medium is decreasing the overall xylitol production but is a crucial parameter for C. tropicalis mediated ethanol production. Apart from this, increasing inoculum concentration increases the production of ethanol and xylitol. While increasing orbital shaking speed increases the ethanol titre but causes an inverse effect on the xylitol titre. The interactions between all three variables in both responses are discussed in detail in the following section.
Effect of interacting variables on the integrated ethanol and xylitol production process
Effect of independent variables on cellulose to ethanol production by C. tropicalis
The process of SHF at a condition when the independent variables are under optimum conditions is crucial for achieving maximum ethanol and xylitol yield and productivity making it also cost-effective. For better insights into the interactions among the variables for maximizing the responses, the response surface plots of the second-order polynomial models were graphically analyzed. In the case of ethanol production from AHPpEG hydrolysate, all three independent variables, inoculum concentration, S:N ratio and rpm in their quadratic form possess a significant impact. Figure 1(a) represents the effects of interaction between inoculum, % (v/v) (A) and S:N ratio (B) on ethanol production. The red contour reflects the highest ethanol concentration ranging between 23 and 24.4 g/L with increasing values for A and B, at a constant value of 140 for rpm (C). Similarly, Figure 1(b) depicts a concentration range of 21.1 and 24.4 g/L for ethanol with increasing inoculum % (A) and rpm (C) at constant S:N ratio (B) of 46.52 and Figure 1(c) depicts, increasing S:N ratio (B) and rpm (C) at constant inoculum % (A) of 5.5. From Figure 1(a) to (c), it can be noted down that the ethanol production significantly depends on the rpm as well as the inoculum size. This is because the higher inoculum size in the fermenting medium decreases the lag phase of C. tropicalis. 11 Agitation speed (rpm) plays a very significant role as it ensures even nutrient transfer to the yeast cells, which subsequently reduces the lag phase and augments the substrate consumption rate. The interaction and prediction of the model can also be analyzed and inferred with the quadratic equation (equation (5)). A positive coefficient for the interacting variables S:N ratio (B) and rpm (C) represents a synergistic approach towards maximizing the R1. However, an optimal level of inoculum size (A), S:N ratio (B) and orbital shaking speed, rpm (C) is required to maximize ethanol concentration.
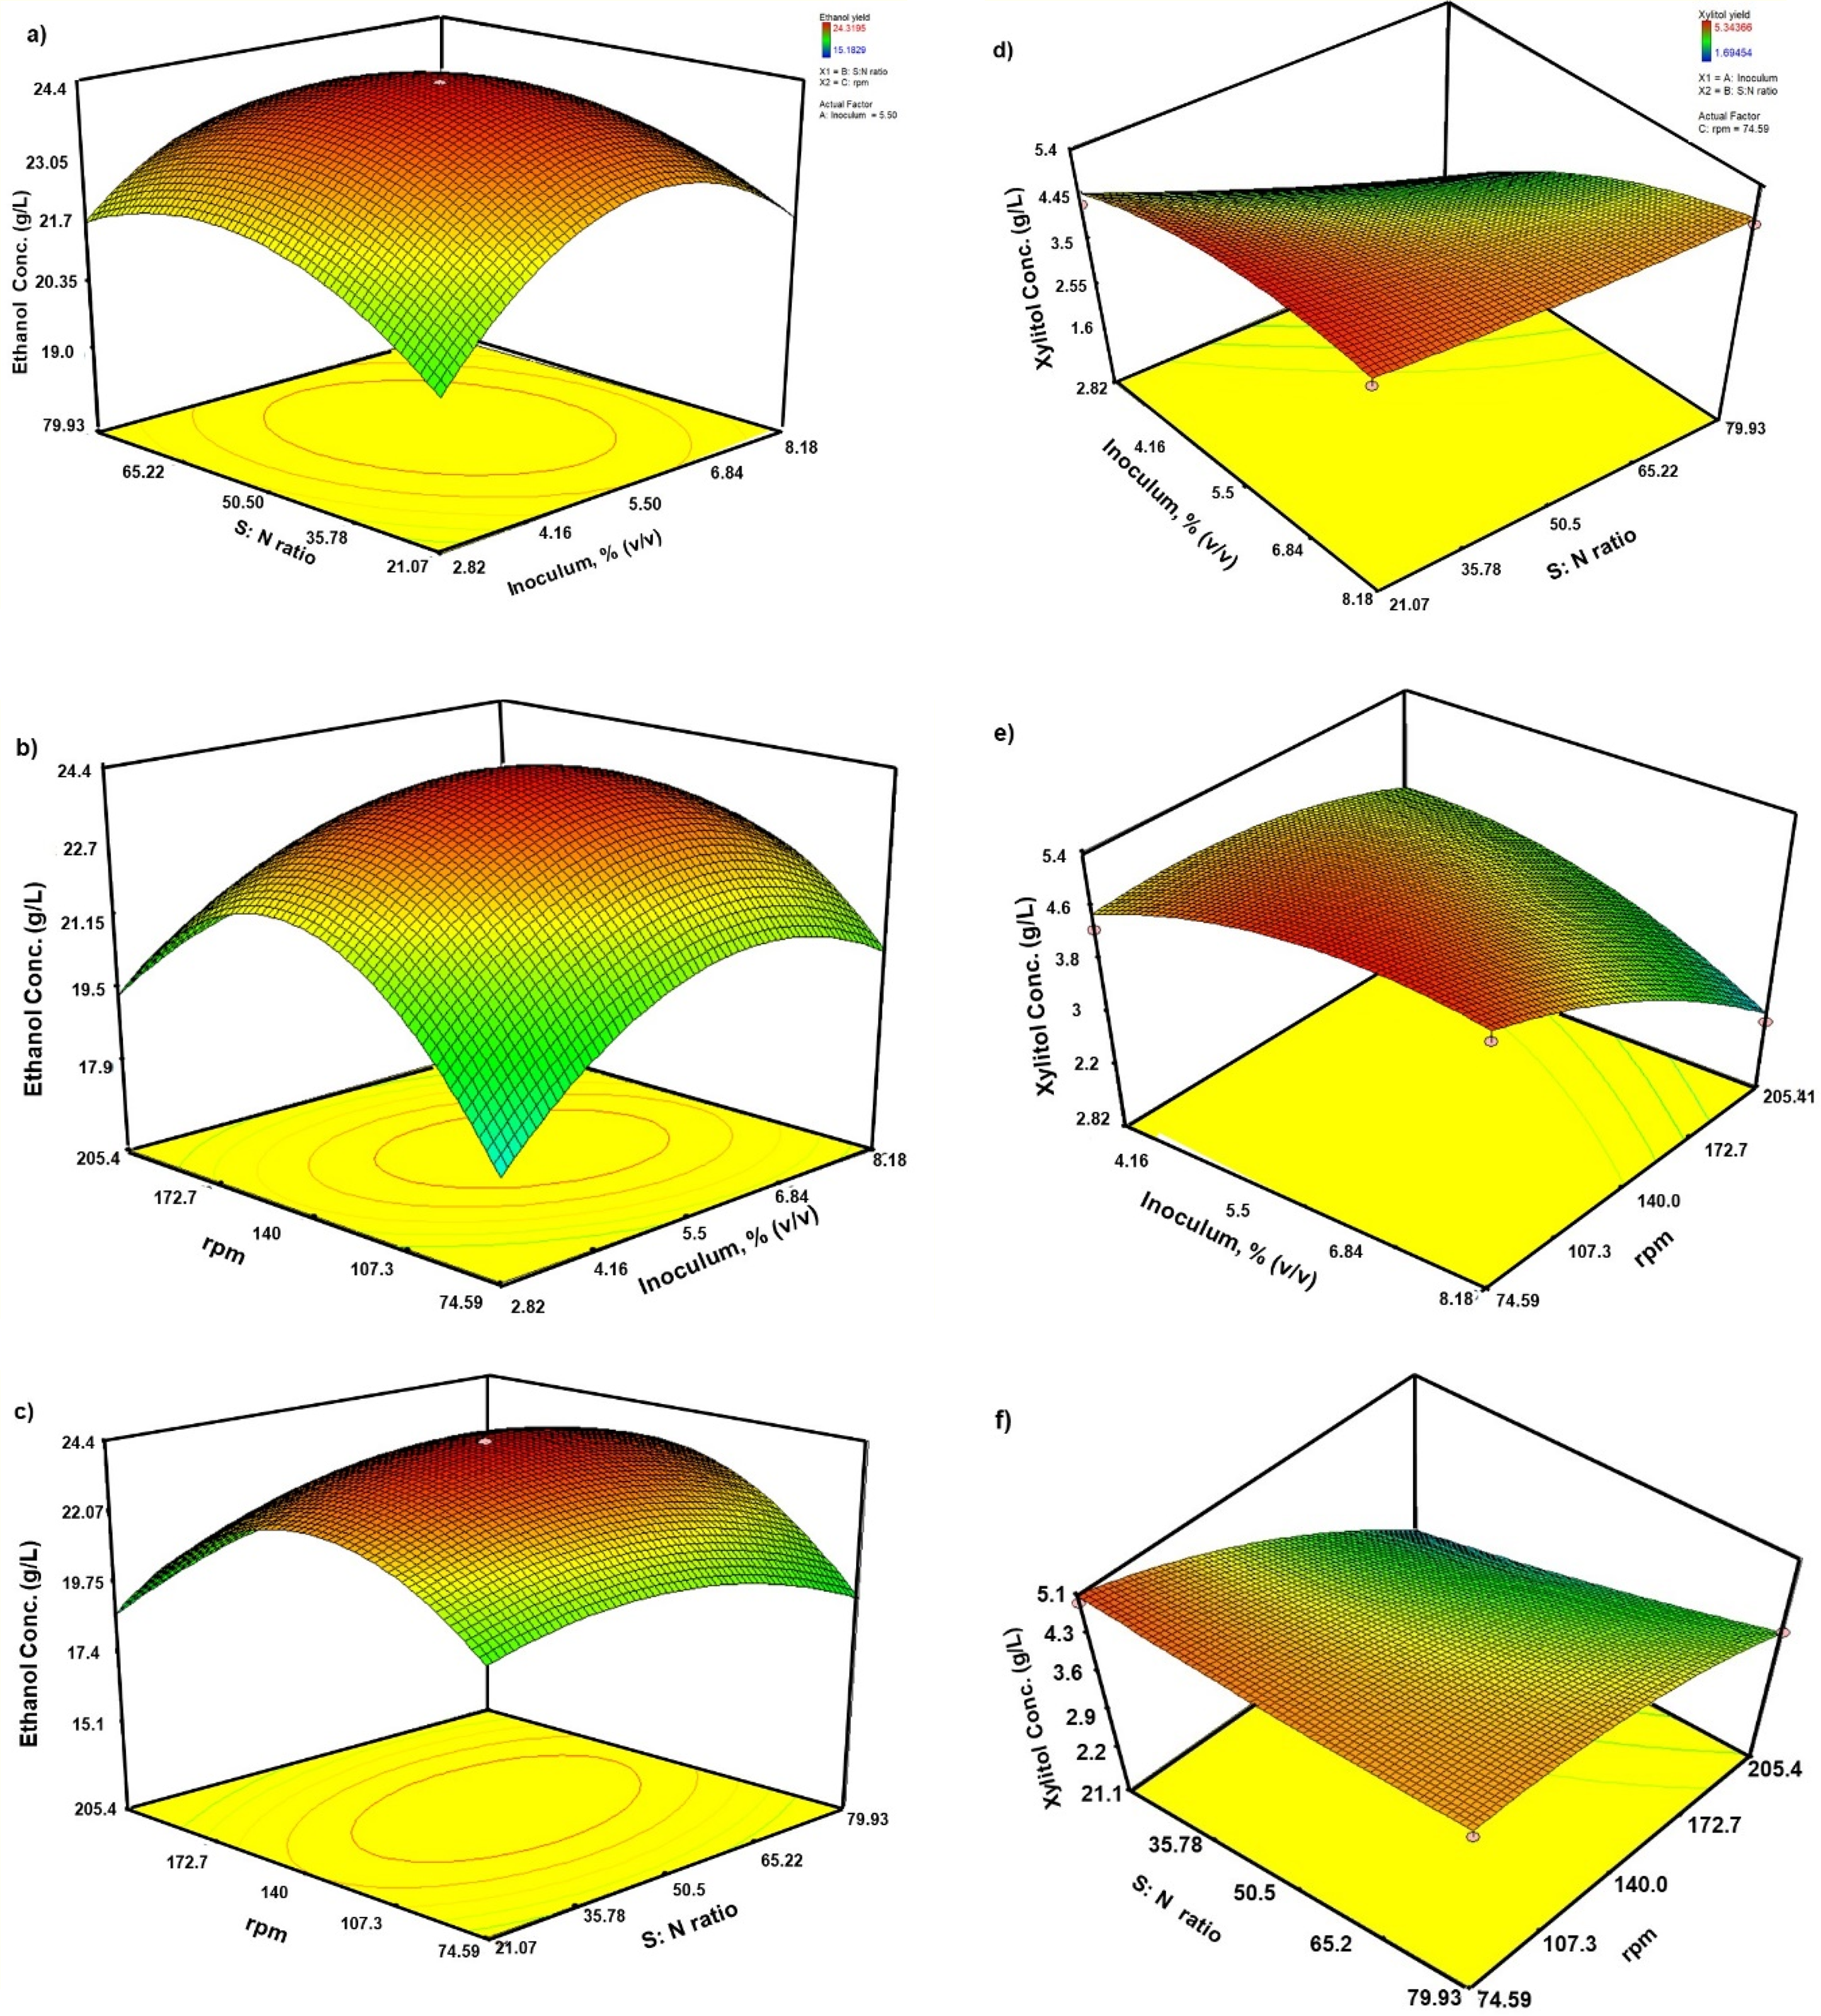
Response surface plots (interaction among independent variables) of ethanol production, g/L (1a, b and c) and xylitol production, g/L (1d, e and f); (a) and (d) inoculum, % (v/v) versus S: N ratio; (b) and (e) inoculum, % (v/v) versus rpm; (c) and (f) S: N ratio versus rpm.
Effect of independent variables on the bioconversion of xylose to xylitol by C. tropicalis
The influence of inoculum % (A), S:N ratio (B) and rpm (C) variables, independently and their interaction on the xylitol production (R2) in batch fermentation was studied and analyzed. The hydrolysate medium was supplemented with (NH4)2SO4, as a nitrogen source during the fermentation and its concentration with respect to sugar concentration was optimized to maximize the xylitol production. Figure 1(d) shows that the S:N ratio has an opposing effect on xylitol production. However, increasing the inoculum percentage (A) at a constant shaking speed of 74.59 rpm leads to a higher xylitol concentration, ranging from 4.6 to 5.4 g/L. A similar interaction is observed in Figure 1(e), where inoculum size (A) interacts with the orbital shaking speed (C) at a fixed S:N ratio of 21.07, depicts increasing the inoculum percentage favours higher xylitol production. Figure 1(f) illustrates the interaction between the S:N ratio (B) and shaking speed (C), where both variables at their lower levels enhance xylitol concentration when the inoculum size is fixed at 8.18%. Additionally, the quadratic equation (equation 6) indicates that the S:N ratio (B) has a positive quadratic effect, as shown by its positive coefficient. A possible explanation could be that in the initial 12 h of fermentation, glucose was quickly consumed and metabolized by the cells (Figure 2). The existence of glucose in the hydrolysate supports cell growth. After the complete depletion of glucose in the media, C. tropicalis shifts to xylose uptake, its metabolism and xylitol biosynthesis. C. tropicalis was observed to completely exhaust xylose within 24 h of fermentation and produce maximum xylitol. Thus, as reported earlier also, low xylitol production may be due to the partial utilization of xylitol by the organism for cell growth. 28 However, an antagonistic relation between rpm (C) in context with xylitol production is due to the fact xylose to xylitol conversion is highly governed by oxygen availability. 29 Lower oxygen transfers to cells promotes xylitol accumulation by reducing the activity of NAD+ dependent xylitol dehydrogenase, which is responsible for the conversion of xylitol to xylulose. Since the volumetric oxygen transfer coefficient (KLA) is directly proportional to rpm, as represented in equation (4), so, the contours shown in Figure 1(e) and (f) illustrate that a decrease in rpm during the fermentation process leads to a significant increase in overall xylitol production.
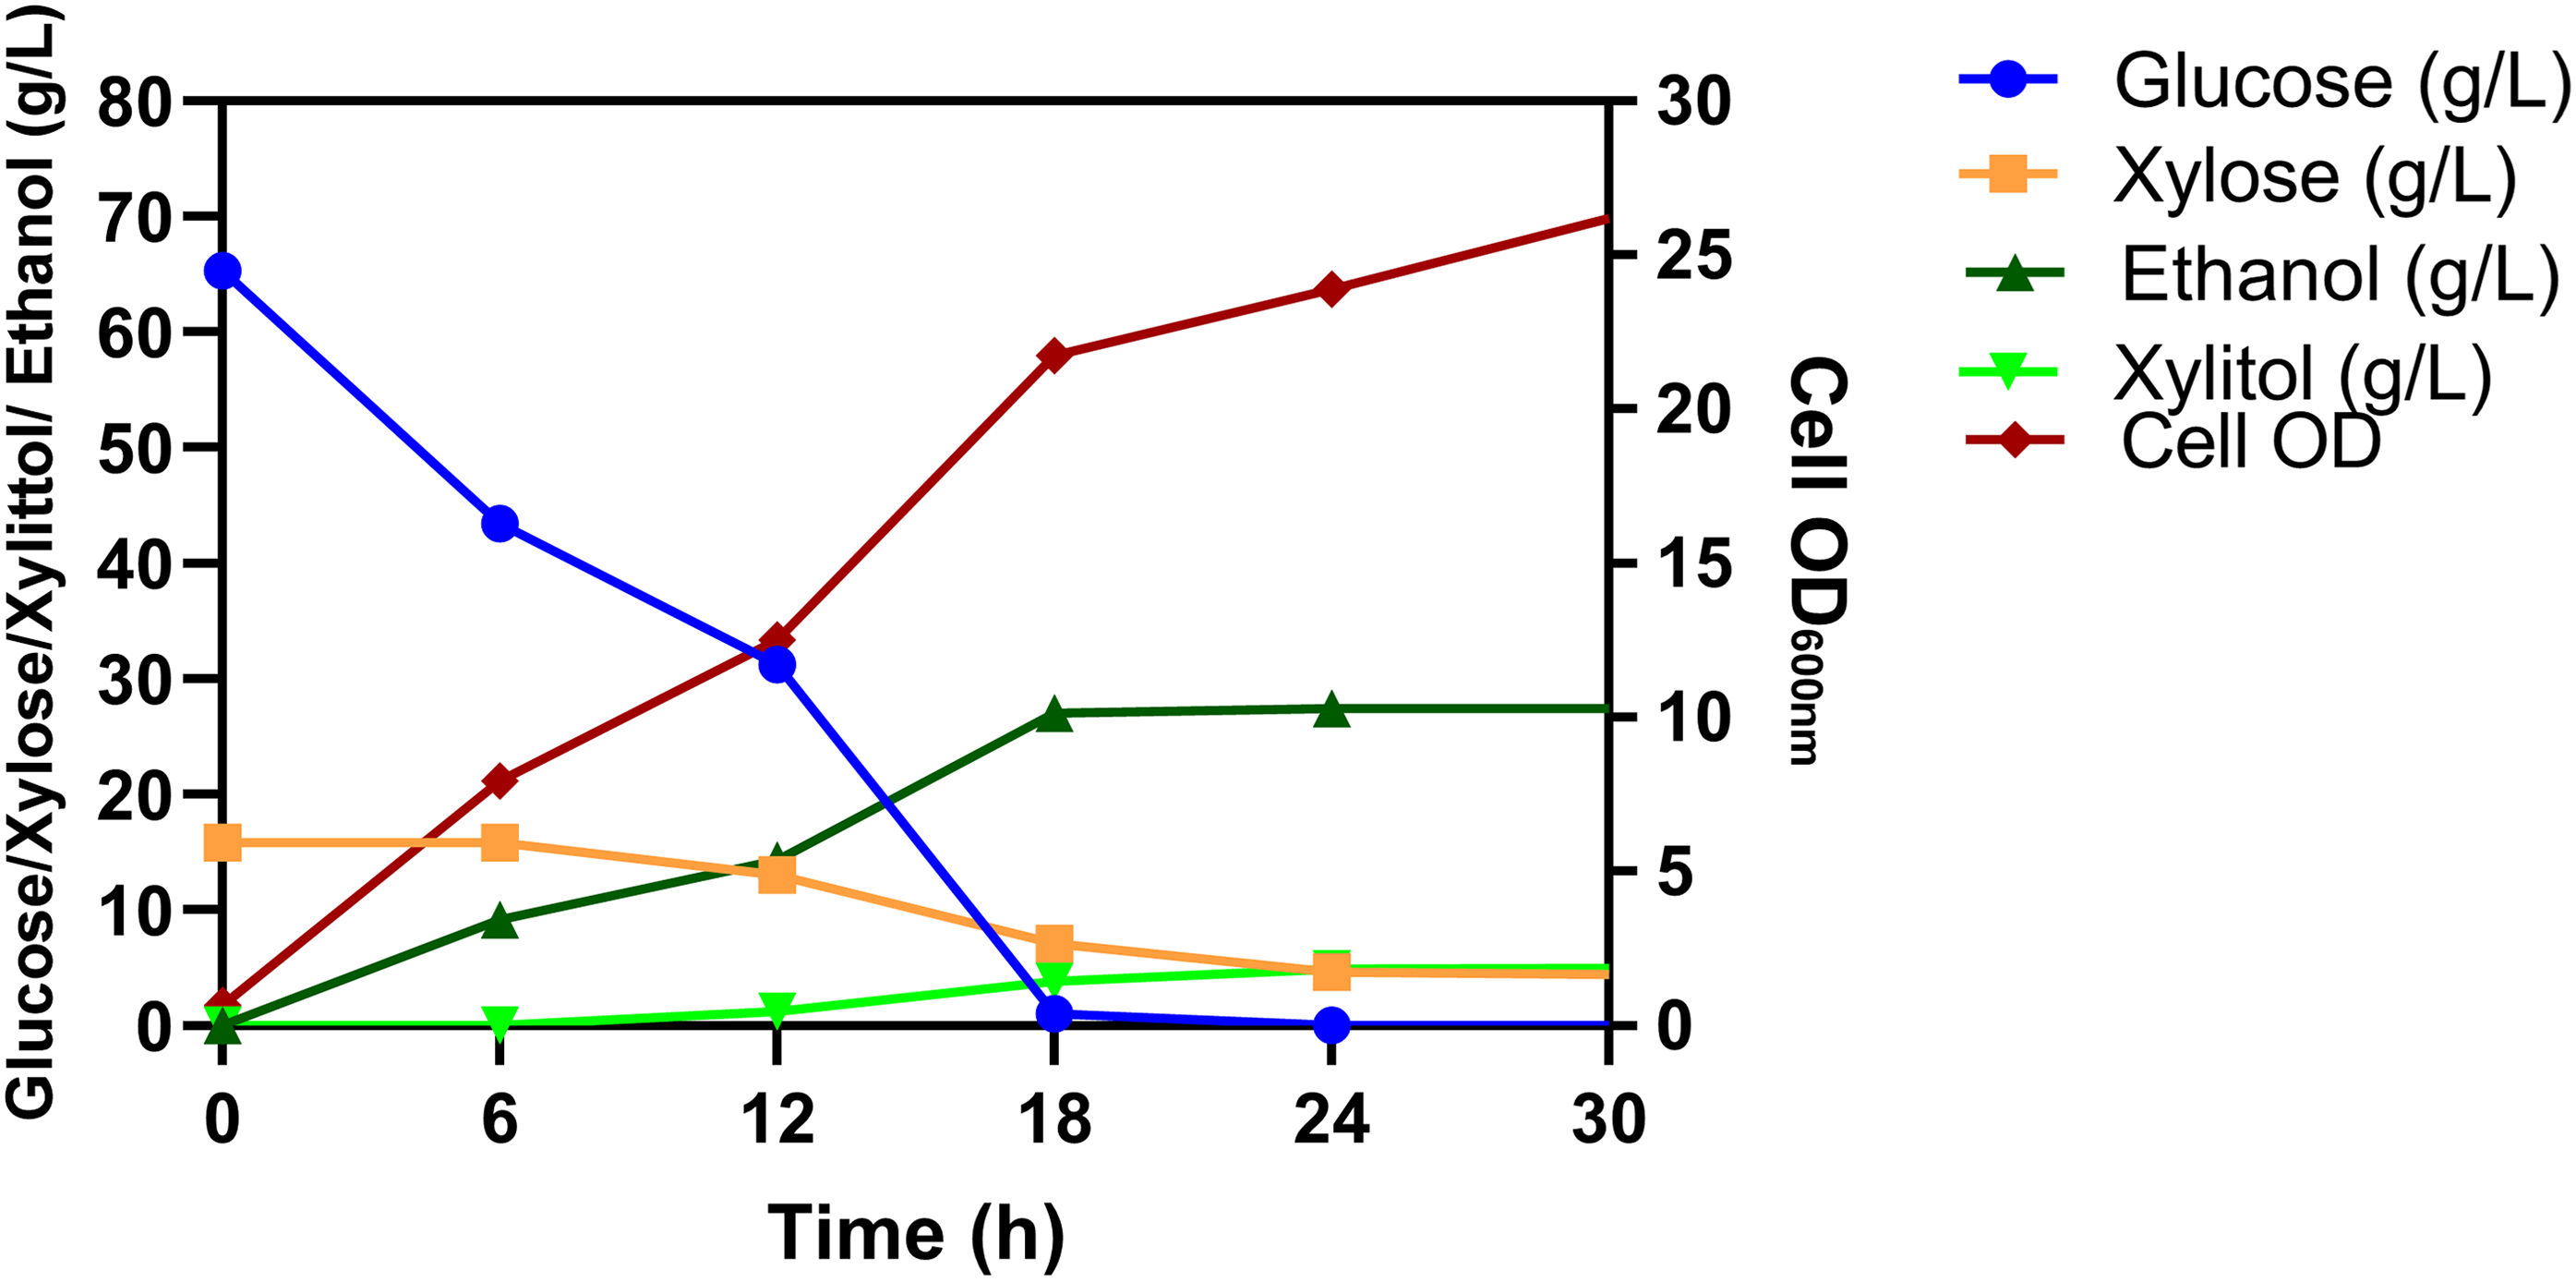
A complete fermentation profile for validated optimized conditions through ANN-GA.
Analysis of ANN-GA developed model for process optimization of the co-production of ethanol and xylitol
In order to study the non-linearities in the dataset, the artificial neural network is more appropriate and accurate modelling technique than RSM. 30 The experimental runs generated through RSM-CCD were the topology used for neural network design for the co-production of ethanol and xylitol through SHF. The designed model consisted of six hidden neurons along with the three input and two output layers. A highly significant model was developed with an R2 value of .99 for the training (Figure 3(a)) and test dataset (Figure 3(c)). The validation dataset gives an R2 value of .98 (Figure 3(b)) with an overall R2 value of .99 for the model (Figure 3(d)). An R2 value of .99 for the training dataset indicated that the model developed has a perfect fit to the dataset. It implies that the model precisely matches the real experimental system rather than just being a mathematical fit as also reported earlier. 24 The statement can be justified by analyzing Table 2, for experimental and predicted values of ethanol (R1) and xylitol (R2) concentration. It can be seen that the experimental values are much closer to the ANN-GA predicted values as compared to the RSM-based prediction. The training of neural networks is ceased when the mean squared error (MSE) of the network drops significantly. In the current study, the neural training is terminated after 13 epochs (iterations) (Figure 4). The set goal of MSE is still higher than the concluding point of the training data, implying the successful end of the network training. 31 Figure 4 represents the performance plot of the trained model, indicating a small final MSE, no over-fitting and the same characteristics of test and validation datasets.

The regression plot of experimental data versus ANN model predicted data.
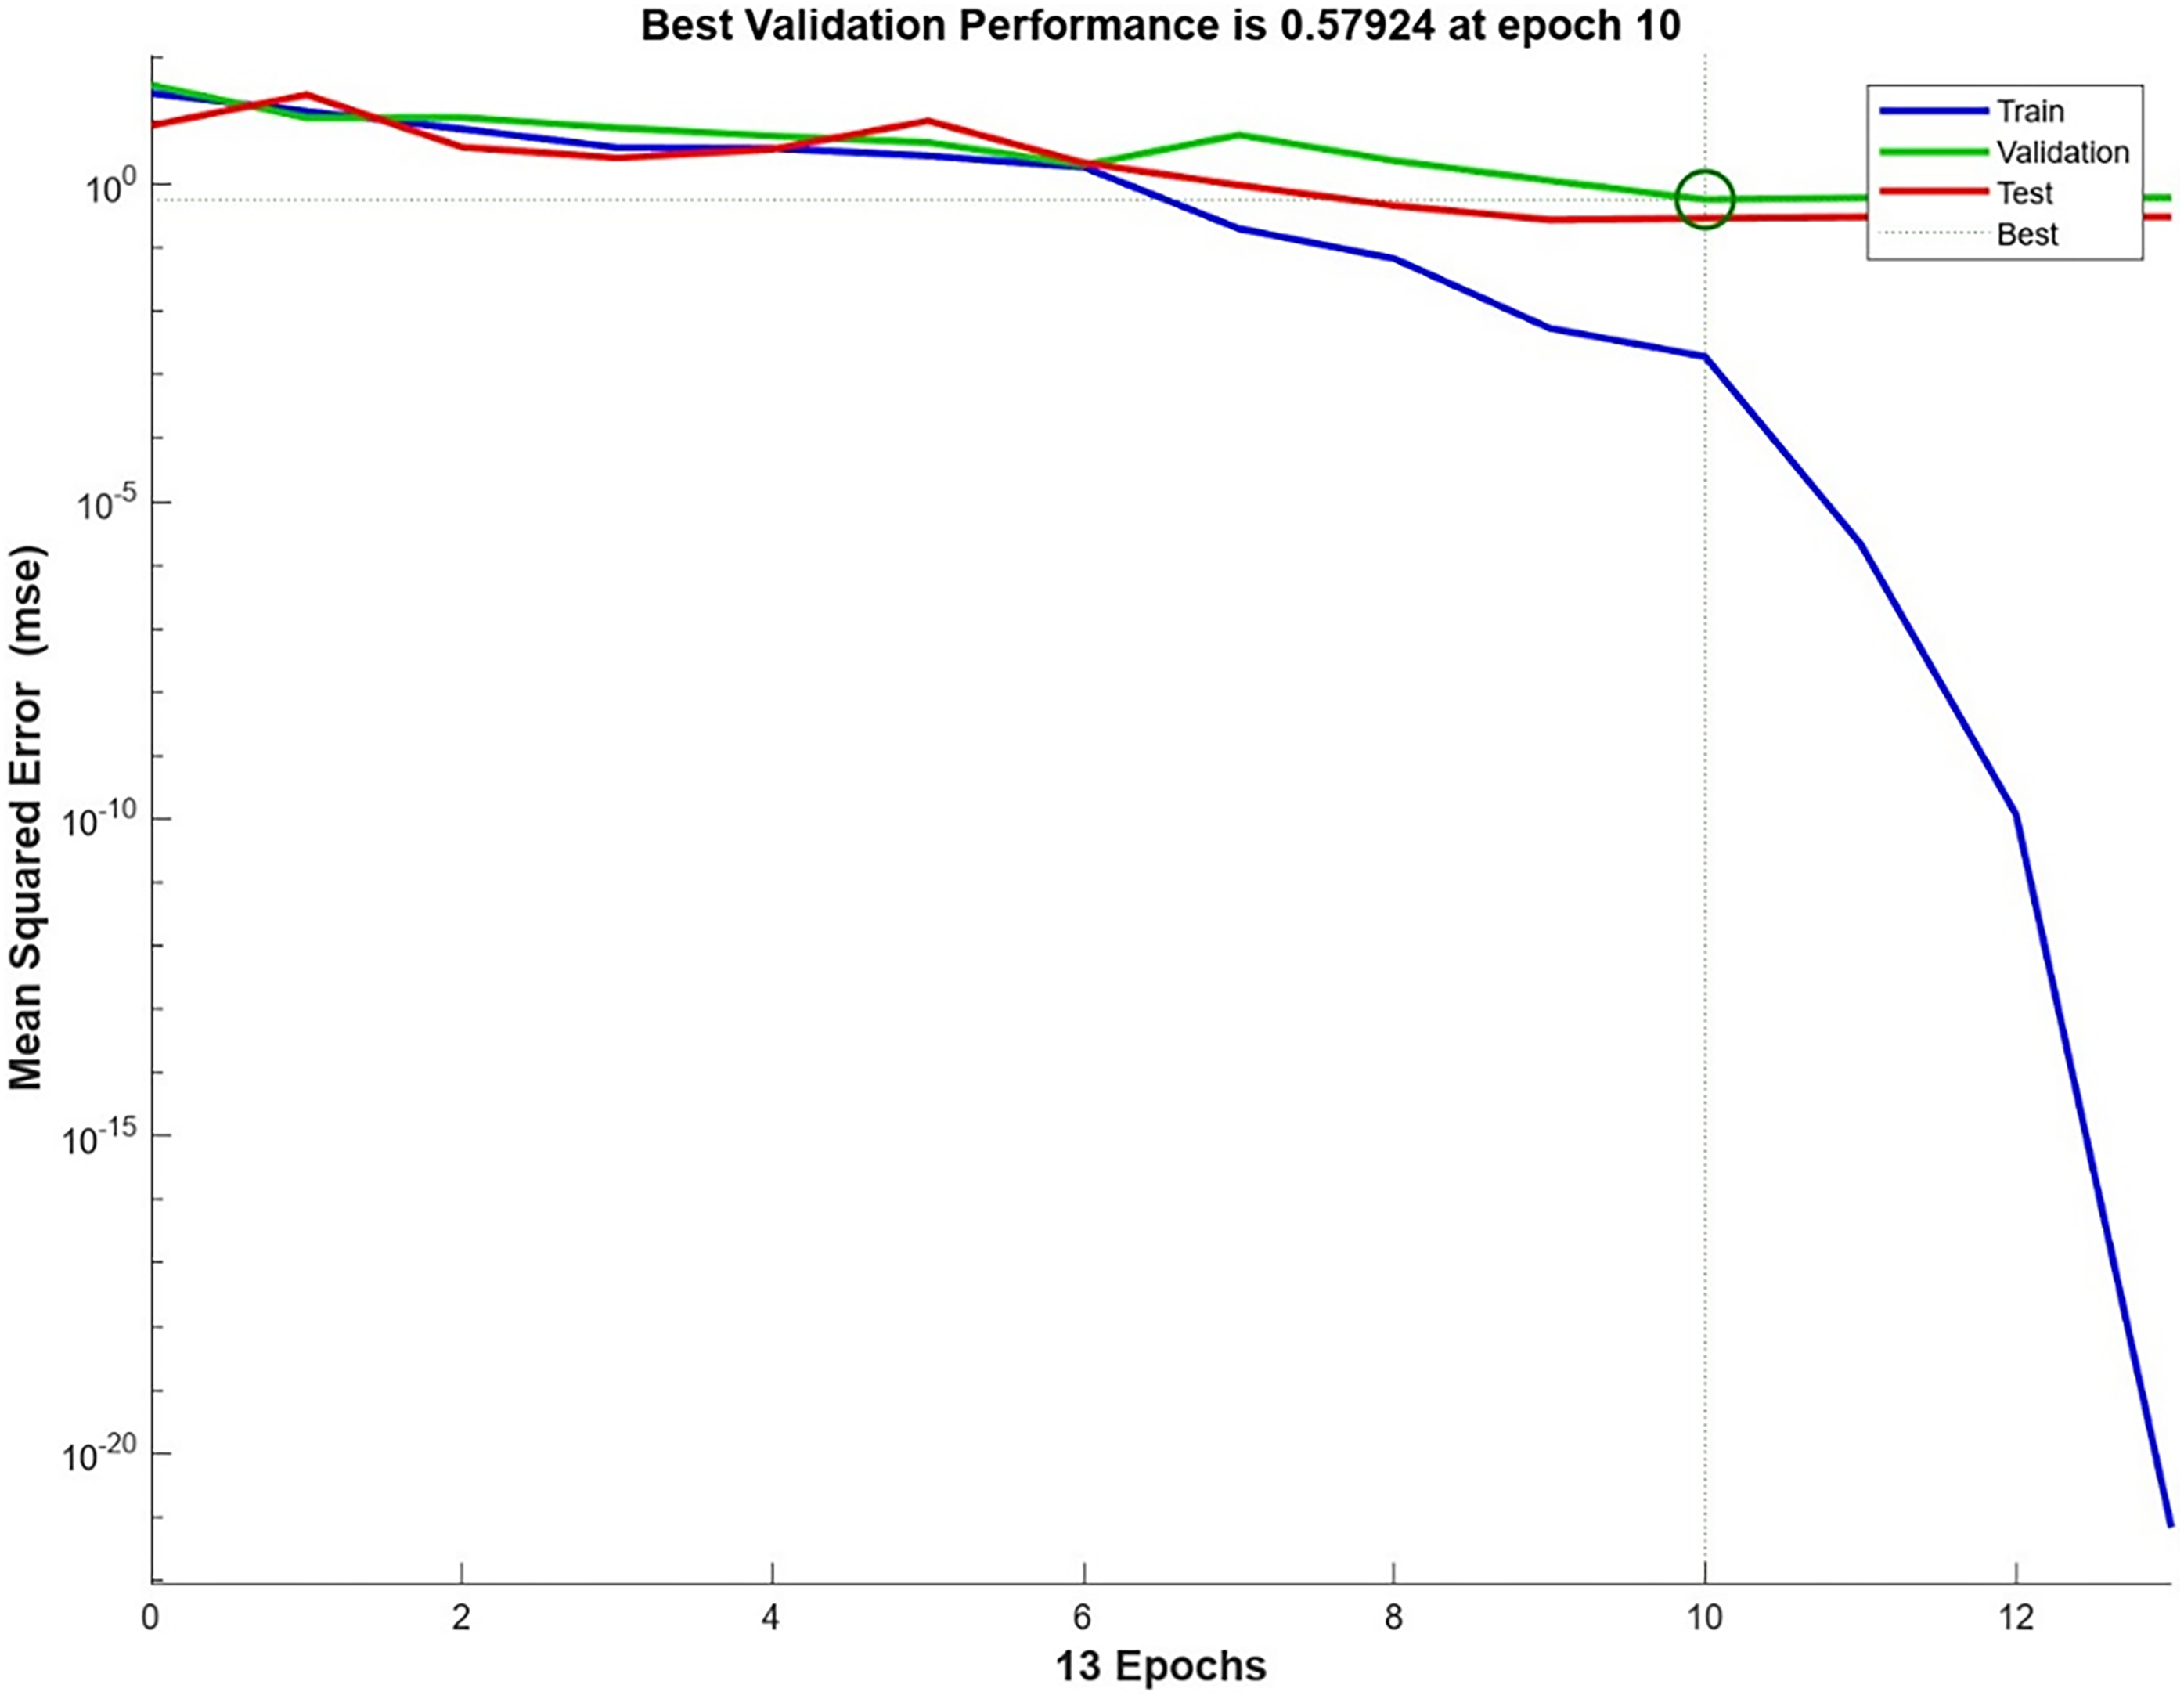
Development of MSE during the training phase of ANN model.
Comparative analysis of RSM and ANN-GA-generated models for co-fermentation optimization
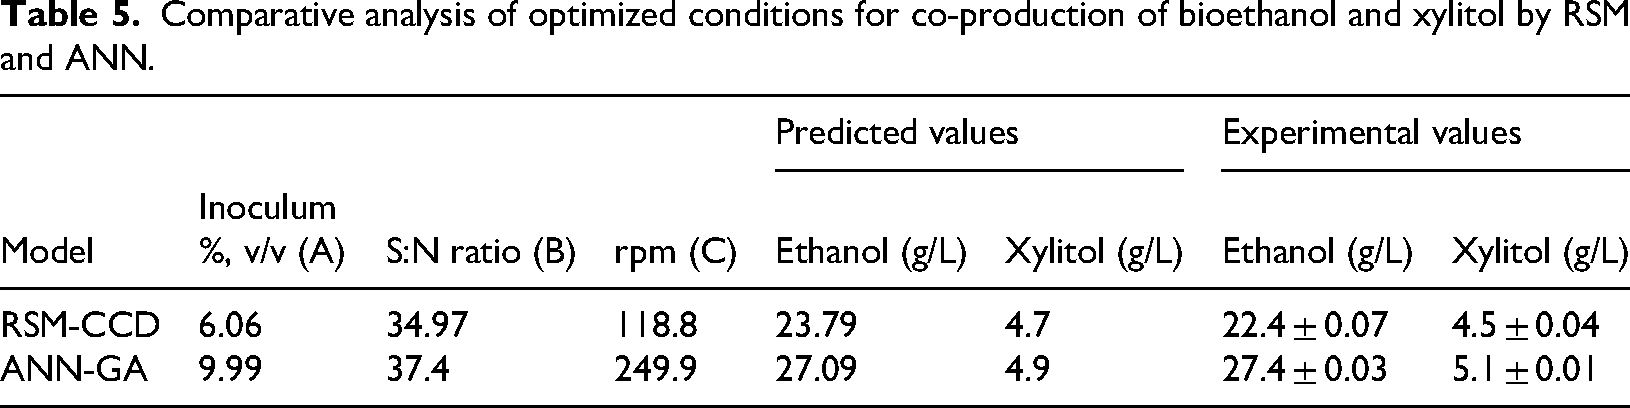
The predictive performance of the RSM and ANN model developed was analyzed and compared. It can be seen from Table 2, that the experimentally obtained values for ethanol and xylitol production are much closer to the ANN-predicted values than those of the RSM- predicted values. So, it can be inferred that ANN-based predictions are in proximity of perfect prediction than those of quadratic polynomials. The R2 value of .99 was obtained for the ANN model, while for RSM it was restricted to 0.97. Apart from the statistical comparison, the optimum process conditions predicted by both models separately were also evaluated. Table 5 compares the optimum process parameters obtained by both the models at which the maximum ethanol and xylitol production can occur during the fermentation. The optimum conditions of RSM (inoculum 6.06%, v/v; S:N ratio 34.97; 119 rpm) predicted 23.79 g/L ethanol and 4.7 g/L xylitol concentrations (Table 5). While the optimum conditions of ANN coupled with GA (inoculum 9.99%, v/v; S:N ratio 37.4; 250 rpm) predicted 27.09 g/L ethanol and 4.9 g/L xylitol (Table 5). The ANN model predicted slightly higher concentrations of both ethanol and xylitol as compared with the RSM model. However, it is important to note that the RSM model also achieved a desirability score of 0.9. Despite this, the ANN model was able to predict potentially higher values. Further, to validate the predictions by RSM and ANN, a validatory set of experiments was run in triplicate to analyze the predictive potential of both the models in actual terms.
Comparative analysis of optimized conditions for co-production of bioethanol and xylitol by RSM and ANN.
Validation of the RSM and ANN-GA optimized parameters
The validation experiment for both RSM and ANN-GA predictions at their optimal reaction conditions was performed in triplicate. The validation of fermentation was conducted at 30°C for 24 h with 40 mL of working volume in 100 mL Erlenmeyer flask. The experimentally obtained values for RSM optimized model were found to be 22.4 ± 0.07 g/L ethanol concentration and 4.5 ± 0.04 g/L xylitol concentration (Table 5). While ANN-GA predicted model gave 27.4 ± 0.03 g/L ethanol concentration and 5.1 ± 0.01 g/L xylitol concentration. The complete fermentation profile for ANN-GA validation experiment is shown in Figure 2. The ANN-GA predicted ethanol and xylitol concentration were 22.3% and 13.3%, respectively, higher than that of RSM based quadratic model. Thus, it can be stated that ANN is more potentially trained and replicates the fermentation process than RSM. The ANN-GA optimized process parameters were 9.9% (v/v) inoculum, 37.4 S:N ratio in the fermenting media and 249.9 rpm (∼250 rpm) at 30°C for 24 h gave an ethanol yield of 0.42 g/gglucose and xylitol yield of 0.44 g/gxylose. The corresponding ethanol and xylitol productivity was 1.14 and 0.21 g/L/h thus providing a conversion efficiency of 82.5% and 49.3%, respectively. The conversion efficiency was calculated by using equations (7)
32
and (8), given below. The KLa for the optimized rpm was calculated to be 194 h−1 by using equation (4) (mentioned in Validation of the developed RSM and ANN-GA model section).

where 0.511 is the maximum possible theoretical ethanol yield (gethanol/gglucose)
0.99 is the maximum possible theoretical xylitol yield (gxylitol/gxylose)
To gain insight into the bioconversion of raw EG starting from pretreatment to bioethanol production, the mass balance of the entire process is depicted in Figure 5. The raw EG (100 g) was pretreated with 7.5% (w/v) solid loading to give 44.9 g AHPpEG with 67.8%, (w/w) cellulose and 19.1%, (w/w) hemicellulose content. 15 The enzyme cocktail (ReCEC) with 15% (w/v) solid loading that resulted in 65.3 g/L (435 mg/gAHPpEG) glucose and 15.8 g/L (106 mg/gAHPpEG) xylose yield. Further, the co-fermentation of AHPpEG enzyme saccharified hydrolysate at optimum conditions resulted in 8.03 g ethanol which can be represented as 231.5 L ethanol/ tonne of AHPpEG and 101.8 L ethanol/ tonne of raw EG. The process yielded 2.05 g xylitol which can be represented as 30.7 L xylitol/ tonne of AHPpEG and 13.5 L xylitol/ tonne of raw EG.
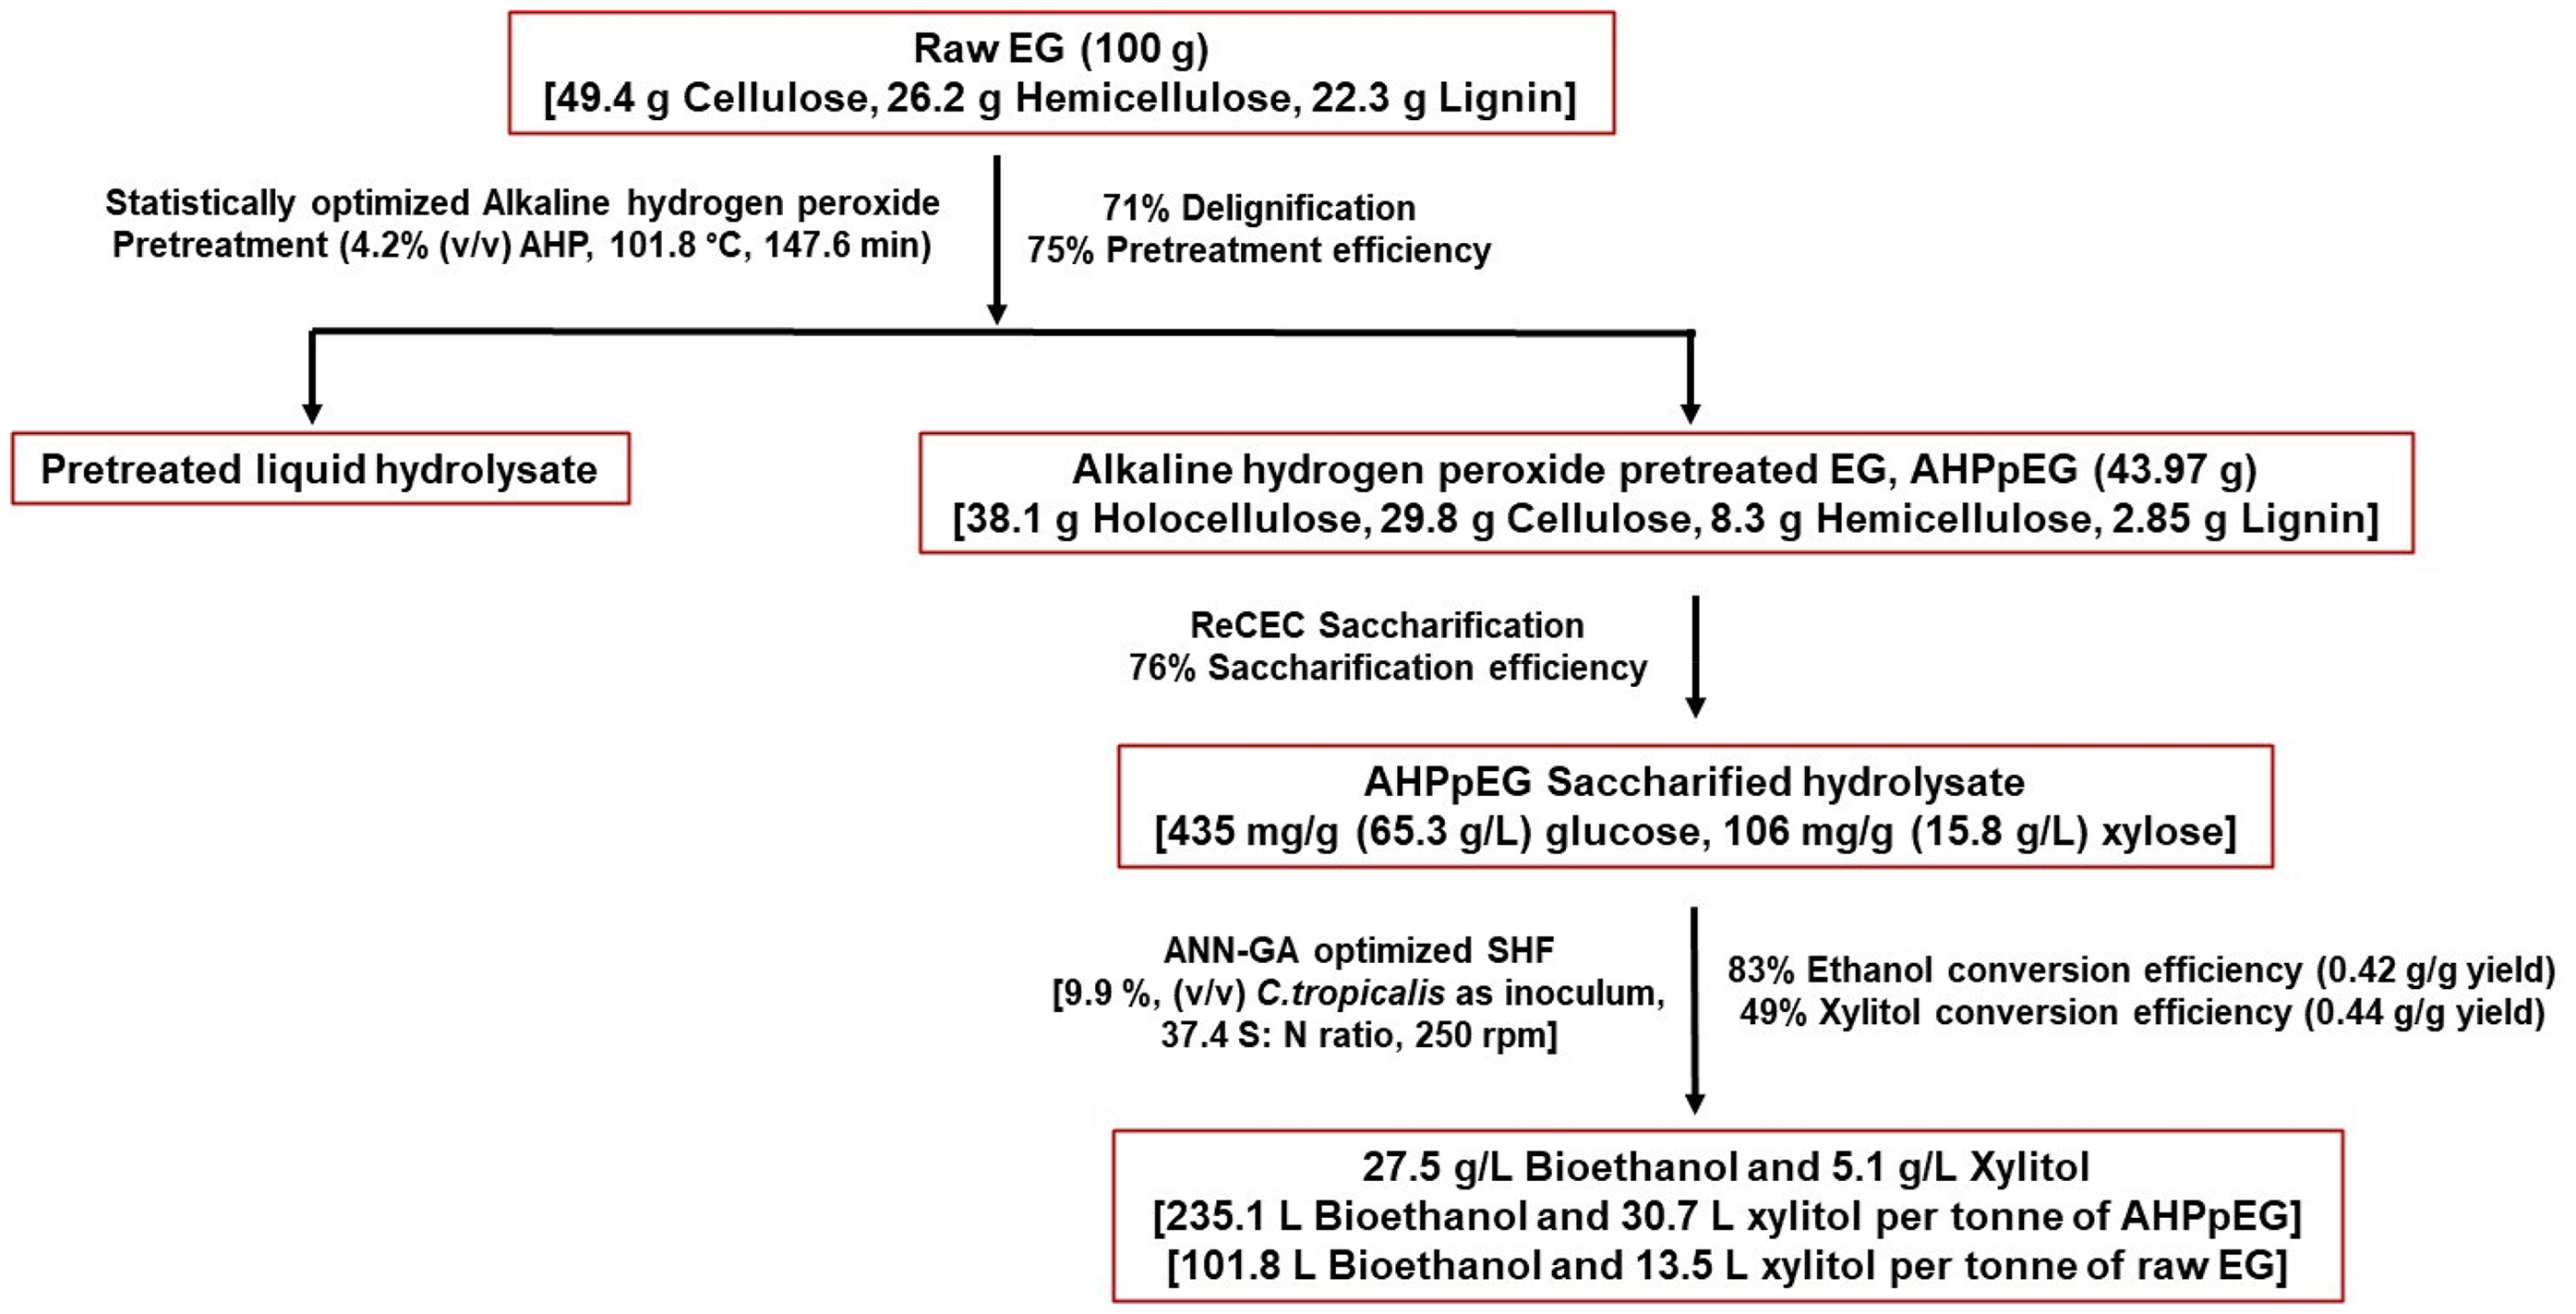
Bioconversion of raw EG to ethanol and xylitol under optimized conditions of SHF process using recombinant crude enzyme cocktail and C. tropicalis MTCC 230.
The study conducted by Kolo et al. 33 investigated the production of bioethanol from microwave-assisted pretreated EG. They reported bioethanol production of 10.7 g/L, with conversion efficiency of 69.4% utilizing a co-fermentation approach with the yeast strains S. cerevisiae ITB-R89 and Pichia stipites ITB R-58. In another study by Eliana et al., 34 alkali-pretreated EG was hydrolyzed by commercial enzyme Accellerase 1500 and further subjected to SSF by S. cerevisiae, that give 15.1 g/L of bioethanol production. Tsai et al. 35 also explored bioethanol production from EG, using a dilute acid pretreatment and reported the production of 15 g/L bioethanol, with hydrolysis facilitated by the commercial enzyme CTec2 and fermentation carried out by S. cerevisiae. Another study by Camesasca et al. 36 examined the effect of dilute sulfuric acid pretreatment on EG. They reported the bioethanol production of 21 g/L with an overall conversion efficiency of 66%, using P. stipitis NBRC 10063 as the fermenting yeast. Additionally, when EG was pretreated with alkali, the study reported an ethanol yield of 24 g/L with a conversion efficiency of 52%, using S. cerevisiae as the fermenting yeast. Vargas et al., 10 utilized alkali pretreated EG and reported similar result to the present study stating the highest ethanol yield of 0.42 g/gglucose with a conversion efficiency of 83%. They also claimed simultaneous xylitol production with the highest yield of 0.61 g/gxylose by utilizing a combination of two industrial microbial strains, S. cerevisiae PE-02 and Meyerozyma caribbica CHAP-096. Another study reported ethanol production from steam-pretreated corn husk by polyvinyl alcohol immobilized yeast strains, C. tropicalis and S. cerevisiae, separately with 20.6 and 5.8 g/L concentration, respectively. 37
In comparison to the mentioned earlier reports, the current study not only shows significant bioethanol production yield but also marks the first report on xylitol co-production from EG by utilizing single fermenting organism, C. tropicalis. The current study underscores the importance of systematic process optimization in understanding the interactions and effects of key parameters involved in co-production of ethanol and xylitol during SHF.
Conclusion
The present study reports the co-production of ethanol and xylitol from alkaline H2O2 pretreated elephant grass (AHPpEG) using a single fermenting microbe, C. tropicalis. The interaction of three significant variables, inoculum %, S:N ratio in fermenting medium and orbital shaking speed, rpm was studied through RSM and ANN-GA models. Developed models were compared based on their predictive performance. ANN-GA built model gave optimum conditions viz. 10% inoculum; 37.4 S:N ratio; 250 rpm gave 22.3% and 13.3% higher ethanol and xylitol titres respectively, than RSM based quadratic model. Thus, ANN-GA model is more potentially trained and replicates the experimental process than RSM. The study gave 0.42 g/gglucose ethanol and 0.44 g/gxylose xylitol yield with ANN-GA optimized SHF conditions with an overall estimated production of 232 L bioethanol/tonneAHPpEG and 31.0 L xylitol/tonneAHPpEG. The current study reports a potentially superior approach, highlighting the utility of EG beyond the traditional bioethanol production.
Footnotes

Funding
The authors disclosed receipt of the following financial support for the research, authorship, and/or publication of this article: This work was supported by the DBT-Pan IIT Centre for Bioenergy (grant number: BT/PR41982/PBD/26/822/2021).
Declaration of conflicting interests
The authors declared no potential conflicts of interest with respect to the research, authorship, and/or publication of this article.