



Abstract
The energy transition significantly impacts key metal markets through various shocks. Using supply, demand, and price data for key metals such as aluminum, copper, cobalt, and nickel in China from 2018 to 2025, this paper employs the TVP-SVAR-SV and GARCH models to categorize energy transition shocks into demand, supply, risk, technology, and policy. It systematically examines their dynamic effects on the metal market. The results show that: (1) Cobalt prices respond most strongly to demand shocks (peak 0.52); (2) Supply disruptions cause cobalt prices to reach extremes of 2.56 worldwide; (3) Geopolitical risks increase volatility to 0.853; (4) Technological shocks have a significant short-term impact on cobalt prices, while nickel prices tend to rise gradually over the long term; and (5) Indonesia's nickel export ban leads to a short-term nickel price change of 0.105. The study recommends enhancing supply chain resilience, promoting technological innovation, and strengthening international cooperation to manage market fluctuations.
Keywords
Introduction
Against the backdrop of an accelerating global push toward carbon neutrality, the energy transition is reshaping the supply and demand patterns in key metals markets. As the world's largest producer and consumer market for clean energy equipment, China plays a crucial role in this transition. In 2022, China's photovoltaic (PV) module production accounted for 85% of the world's output, and sales of new energy vehicles represented over 60% of global sales, directly driving rapid growth in demand for key metals, including aluminum, copper, cobalt, and nickel. Data from the China Nonferrous Metals Industry Association (CNMIA) indicate that China's aluminum consumption has grown at an average annual rate of 7.2% over the past five years, while copper consumption has increased by 5.8%. Both figures significantly surpass the global averages. As shown in Figure 1, demand for metals like cobalt and nickel saw explosive growth between 2015 and 2022, while aluminum—vital for photovoltaic modules and lightweighting in new energy vehicles—also expanded rapidly. This surge in demand sharply contrasts with domestic resource endowments: China's reliance on imported bauxite exceeds 60%, and dependency on cobalt resources is even higher than 95%, underscoring the critical influence of external resource control on national industrial security, as emphasized by resource dependence theory.
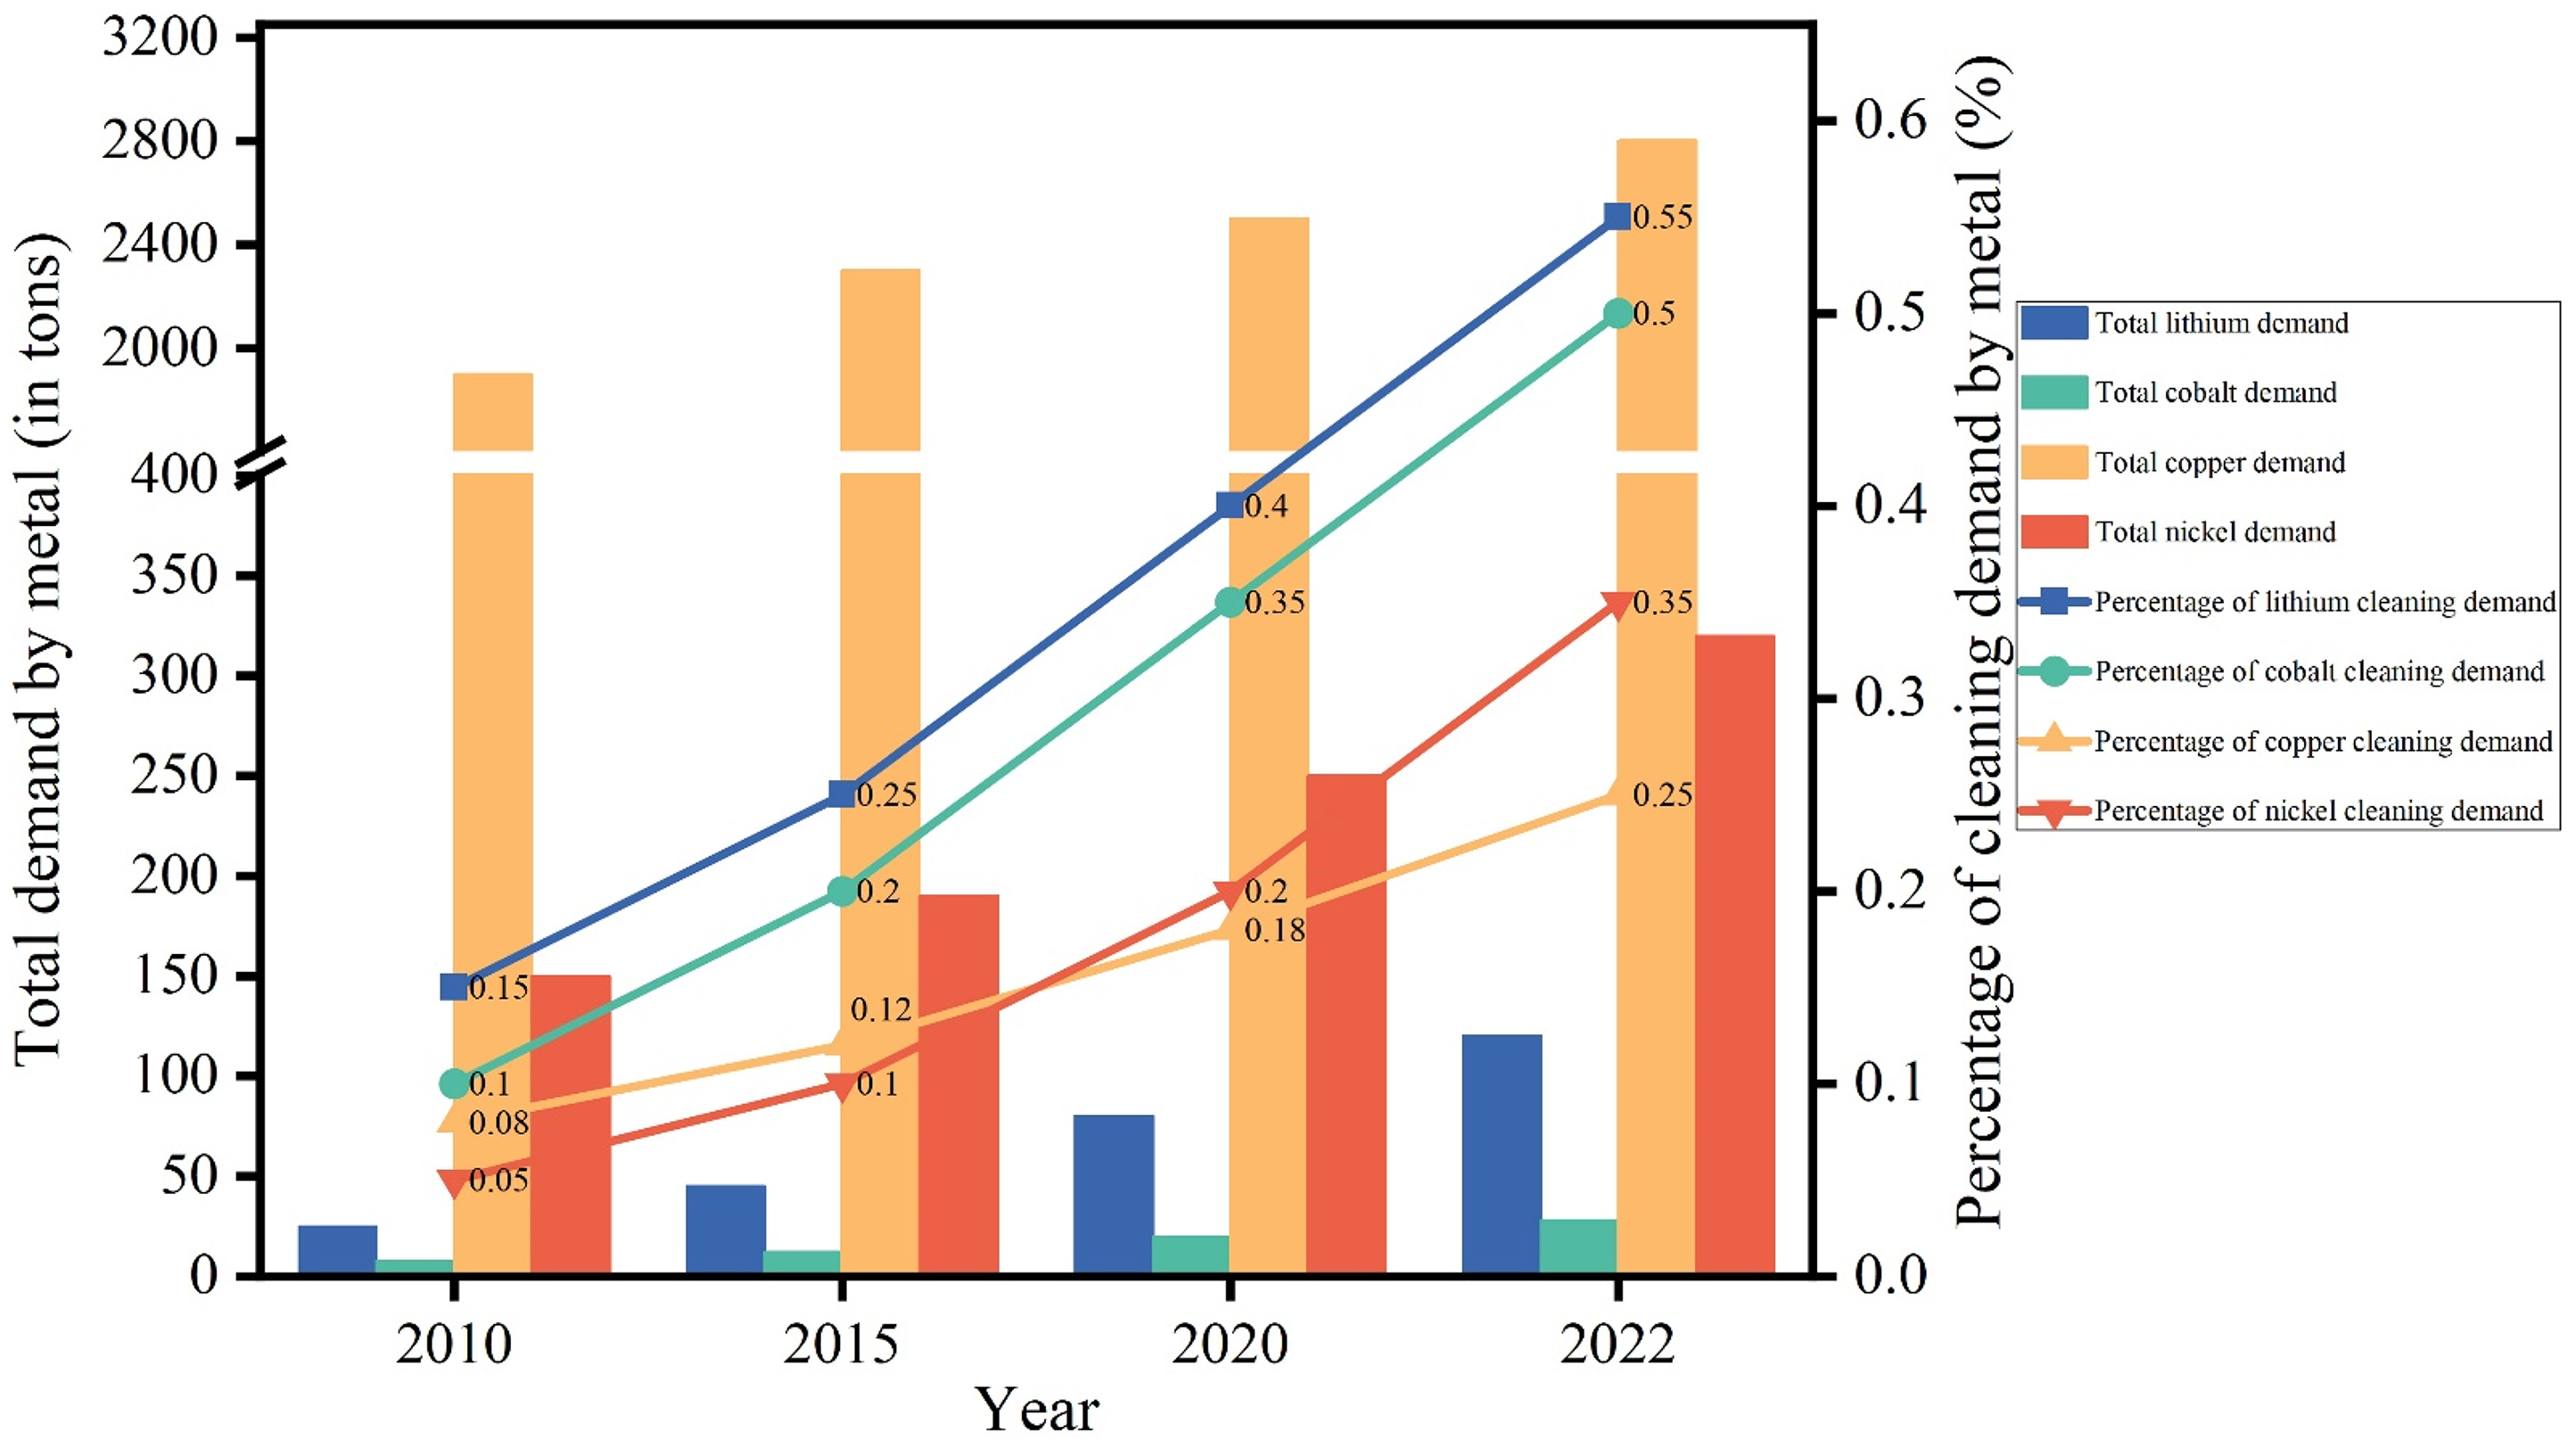
Global key metals demand growth trends (2010–2022).
The shock mechanisms in the critical metals market are complex and multi-faceted. From the perspective of innovation diffusion theory, the rapid adoption of clean energy technology creates new demand growth points. For instance, each new energy vehicle requires approximately 80 kg of aluminum and 60 kg of copper on average. The supply side faces dual constraints: domestically, stricter environmental policies limit resource development; internationally, resource supplies are highly concentrated, and geopolitical risks are significant. As shown in Figure 2, DRC produces 70% of the world's cobalt, while Indonesia accounts for 37% of global nickel; these countries generally face high geopolitical risks. In 2022, Indonesia's changes to nickel ore export policies had a direct impact on the domestic stainless steel and battery industries, leading to significant fluctuations in nickel prices. This supply-demand imbalance is exacerbated by the amplifying effect of financial markets, as evidenced by the dramatic surge in LME nickel futures in 2022, which reached up to 250% in a single day, underscoring the market's vulnerability.
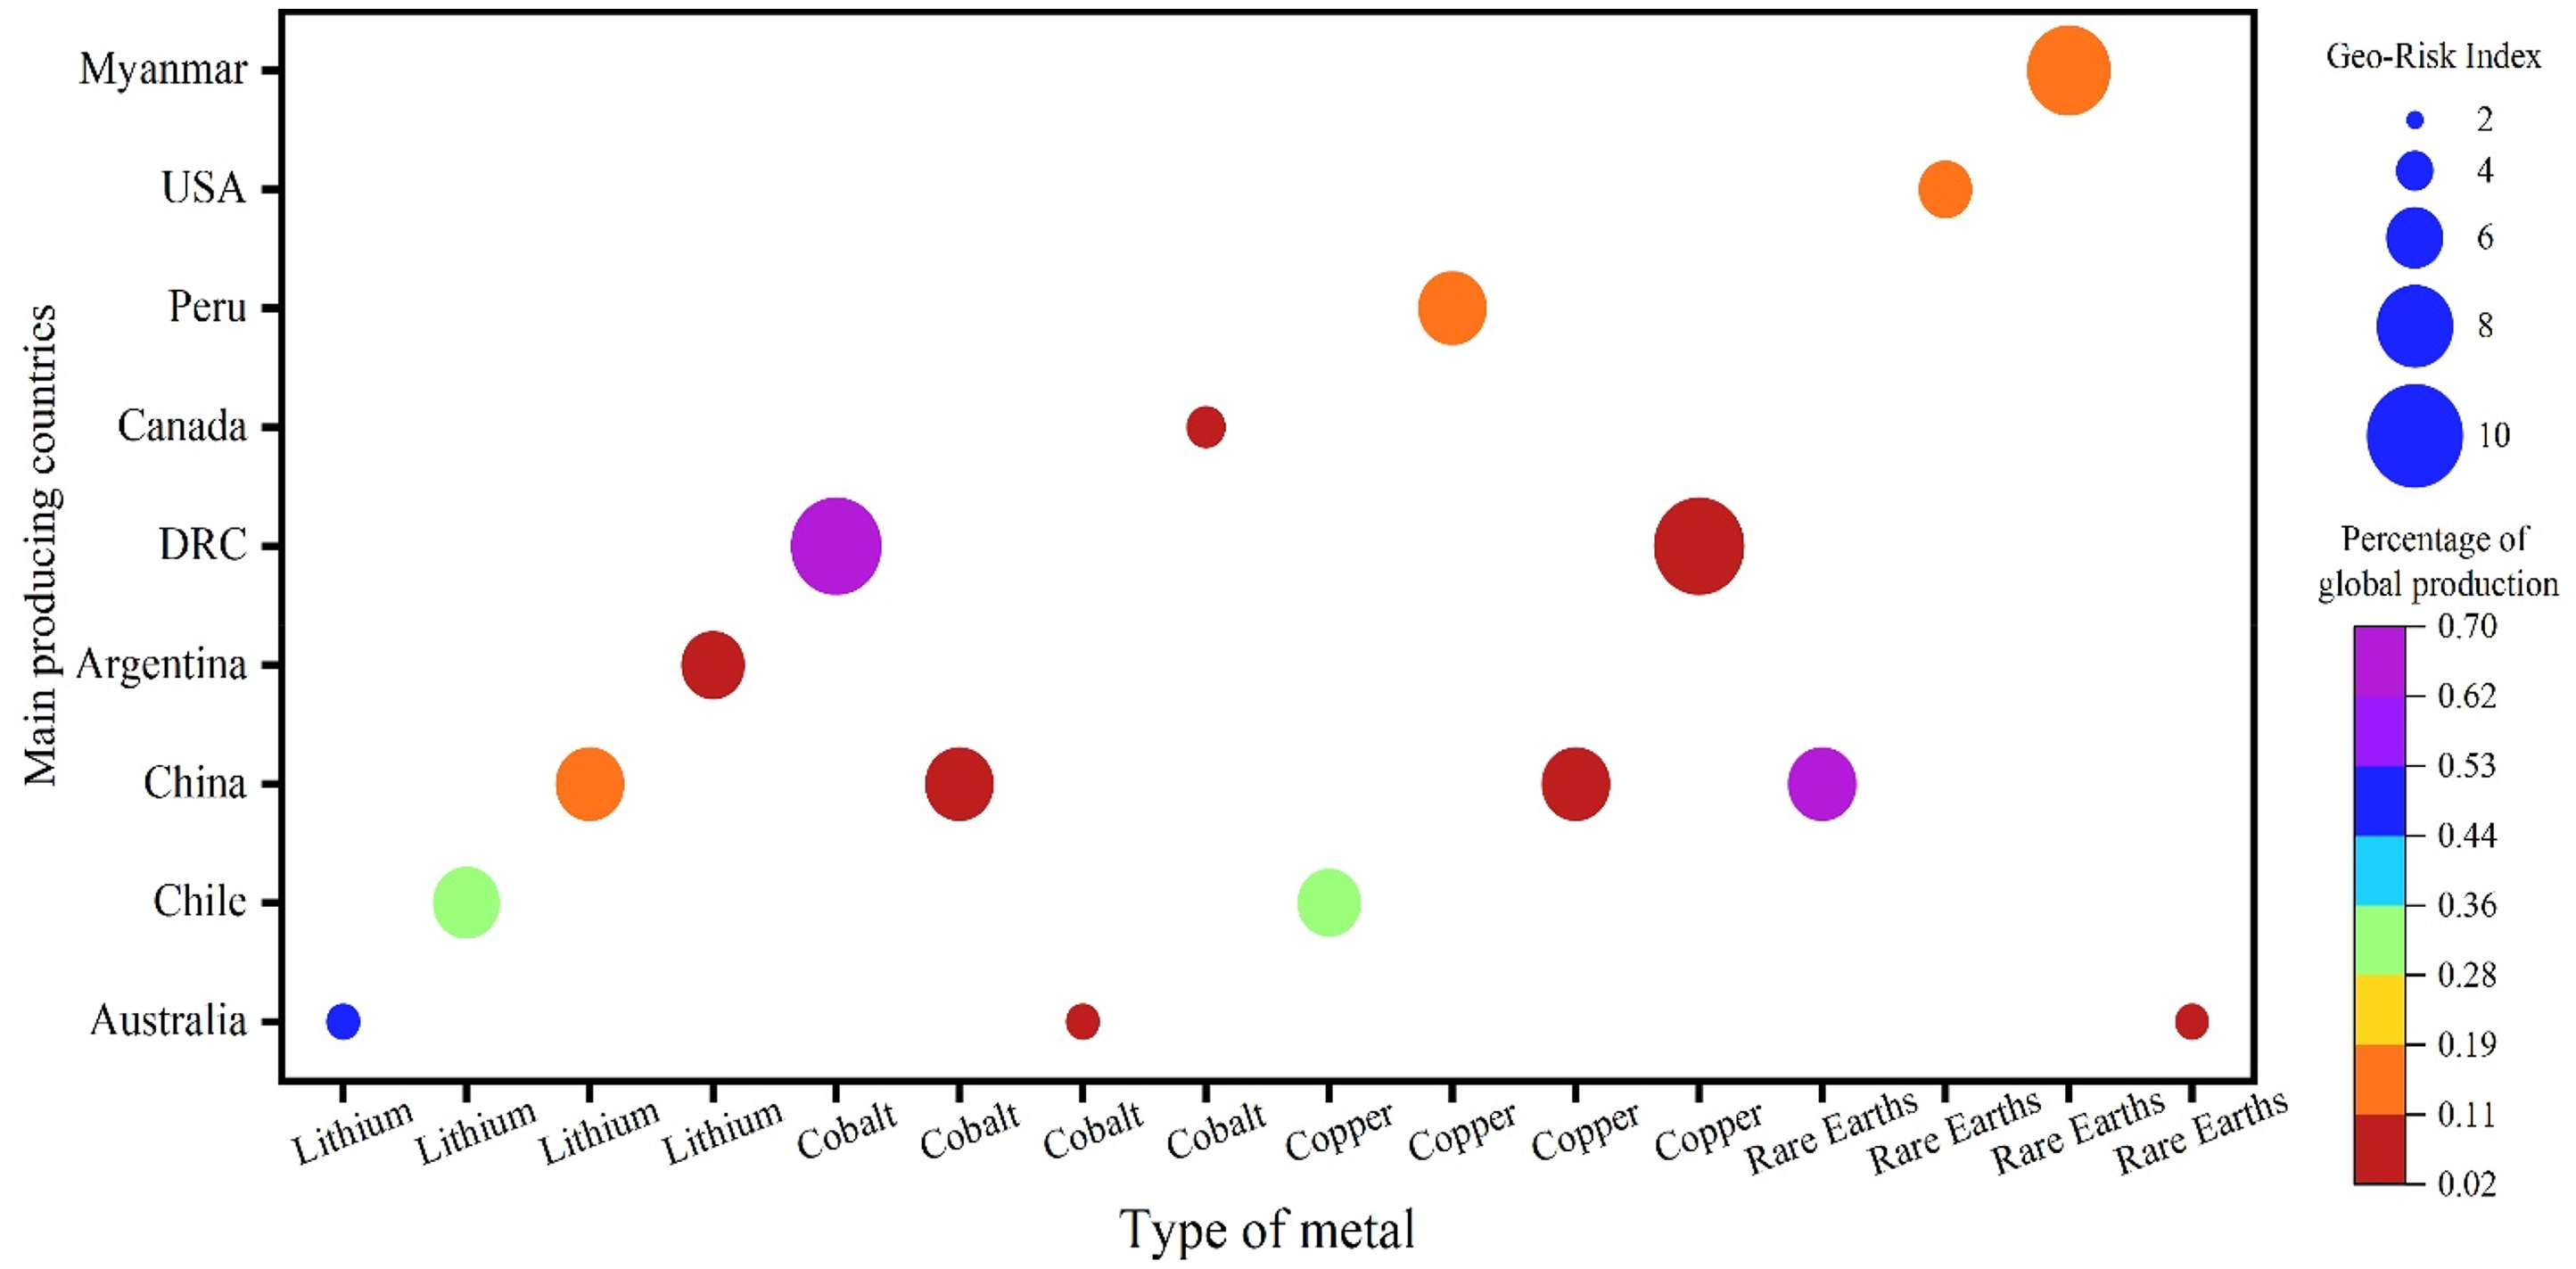
Concentration of key metals production and geo-risk index (2023).
Accompanying the surge in demand is a complex market impact. As shown in Figure 1, China's lithium demand increased at an average annual rate of 35% from 2015 to 2022; however, the supply side is limited by challenges in accessing overseas resources and domestic environmental restrictions, resulting in a persistent mismatch between supply and demand. Specifically, on the geopolitical front, security risks in China's key metal import routes (such as cobalt raw materials transported via the South African port of Durban) and speculative activities in financial markets (like nickel futures short-selling events) are interacting and intensifying price volatility. This complexity is illustrated in Figure 2, where 78% of China's cobalt imports originate from the politically unstable Democratic Republic of the Congo (DRC). At the same time, shifts in Indonesia's nickel export policies have a direct impact on the country's stainless steel and battery industries.
Addressing these challenges requires systemic solutions. Although technological innovation offers potential breakthroughs, such as lithium-iron-phosphate battery technology reducing cobalt use and high-nickel batteries improving energy density, the industrialization of these technologies still takes time. Policy coordination also faces practical constraints: mineral resource tax reform may impact corporate profits, while export controls may easily trigger trade friction. Against this backdrop, this paper focuses on three core questions: First, how will the global energy transition create a structural impact on China's key metals market through demand expansion, supply constraints, and risk transmission? Second, what are the differences in the dynamic transmission mechanisms and time lag effects of various shocks (demand, supply, risk, technology, policy)? Third, how should China respond to these shocks through technological innovation, policy coordination, and international cooperation?
The main contributions of this paper are reflected in the following aspects. First, regarding research methodology, we have innovatively constructed a composite analytical framework that combines the TVP-SVAR-SV model and the GARCH model. This approach overcomes the limitations of existing literature, which focuses on a single shock, by systematically analyzing the impact of the energy transition on the metal market across five dimensions: demand, supply, risk, technology, and policy. It provides a new analytical framework for a comprehensive understanding of the metal market's complex response mechanism. Second, we propose a theoretical framework for analyzing shock transmission that accounts for its time-varying characteristics. This model more accurately captures the dynamic transmission of different shocks in the short and medium term and better reflects the actual changes in the metal market during energy transition than traditional static models. Third, the research perspective has expanded from single-metal analysis to comparative studies of multiple metals, with particular attention to the differences in technical applications of key metals, such as aluminum, copper, cobalt, and nickel. This offers a theoretical basis for developing differentiated resource security and guarantee policies.
Literature review
Reconfiguration and evolution of key metal demand under energy transition
The accelerated energy transition has significantly reshaped the global demand for key metals, driven by factors such as technological advances, policy incentives, and regional development differences. From the perspective of innovation diffusion theory, McNulty and Jowitt 1 highlight that the growth in tellurium demand within the photovoltaic industry depends not only on technology diffusion but also on the synergistic development of the semiconductor industry, illustrating the complexity of how technological pathways influence metal demand. Shojaeinia 2 confirms, through dynamic supply and demand modeling, that the adoption of electric vehicles and grid expansion has led to significantly faster growth in copper demand than traditional models predicted. Additionally, Xu and Guo 3 emphasize the dual effects of China's policy regulation: while subsidies have accelerated the expansion of the new energy industry, price interventions have exacerbated supply and demand mismatches. Notably, from the resource dependence perspective, although clean energy technologies lower production costs per unit of energy, their large-scale adoption increases reliance on key metals, creating the paradox of “falling costs—surging demand”. 4 This paradox is more evident at the regional level. Dai 5 examines the global copper market through a structural vector autoregressive (SVAR) model. It finds that China's macroeconomic fluctuations have a significant delayed effect on copper demand, further confirming the nonlinear nature of demand growth.
Multidimensional impact of supply constraints and resource scarcity
The supply of key metals faces the triple constraints of resource scarcity, geographic centralization, and geographic risk. Pozybill's 6 quantitative study reveals that a 10% reduction in cobalt production in the DRC would lead to a 25% increase in the risk of global battery supply chain disruption, underscoring the long-term threat posed by production centralization. Schischke et al. 7 quantify the probability of metal scarcity using a logistic regression model, finding that the cobalt risk is as high as 78%, significantly higher than that of nickel (45%). This rigid constraint is exacerbated by stricter environmental regulations, as Calderon et al. 8 point out, which limit the capacity release due to the ecological risks associated with deep-sea mining. Xie et al. 9 further reveal the asymmetric impact of structural oil shocks on the non-ferrous metals supply chain through multidimensional quantile regression, suggesting that volatility in the energy market may increase the volatility of metals supply via cost transmission. Additionally, Yuan et al. 10 highlight that China's dependence on outside sources for cobalt is 95%, making its supply chain significantly more vulnerable than that of other metals. This finding aligns with the research of Daniele et al. 11 on structural shocks in the crude oil market, highlighting the potential threat of resource concentration to the global supply chain.
Heterogeneous mechanisms of market volatility and risk transmission
Against the backdrop of the energy transition, metal markets are characterized by rising price volatility and significant policy spillovers. Reboredo and Ugolini 12 find that the volatility of lithium and cobalt prices reached historical peaks from 2020 to 2023, rooted in the contradiction between surging demand and rigid supply. Cooper et al.'s 13 empirical study suggests that policy-driven demand influences market dynamics. Jia et al. 14 distinguish volatility drivers: aluminum prices are mainly affected by geopolitical risk shocks, while copper prices are simultaneously influenced by economic policy uncertainty. Fan's 15 study on the financialization of food prices offers a comparable perspective on metal market volatility, suggesting that financialization may exacerbate supply-demand imbalances through speculative behavior. An example from 2023, using the LME nickel short-selling event, reveals how speculative capital can transform geopolitical risks (e.g., the Russian-Ukrainian conflict) into price bubbles. This, along with Aktham et al.'s 16 research on oil shocks and systemic risk in banks, suggests cross-market linkages in the transmission of structural shocks.
Synergies between policy and technology
Policy instruments play a central role in coordinating the energy transition and resource security, but their effectiveness is limited by market structure and technological maturity. Kaufman et al. 17 demonstrate that a $10/ton increase in carbon pricing leads to a 7% boost in renewable energy investment, but may hinder the expansion of energy-intensive metal smelting. He et al. 18 point out that while China's carbon market pilots have improved the efficiency of emission reductions, uneven quota allocation may trigger “carbon” effects. Månberger and Johansson 19 emphasize that the geopolitical attributes of metals have been redefined during the transition process—cobalt resources in the DRC and nickel export policies in Indonesia have become new variables influencing the security of global supply chains. Arnaut, 20 through a study of uranium prices, suggests that policy adjustments in resource-rich countries may reshape the global energy market landscape through price transmission, a conclusion similar to policy shocks in metals markets. Technology-policy synergies are especially crucial, with IRENA's REmap program prioritizing the allocation of Indonesian copper resources to grid upgrades over traditional construction through cross-country resource optimization. 21 However, Rötzer and Schmidt 22 warn that policies might worsen structural imbalances in metal supply and demand if they overly rely on a single technological path, and a simulation study of structural shocks to composites by Grujicic et al. 23 further suggests that technological innovations need to be pursued alongside efforts to build supply chain resilience.
In summary, the existing literature has examined the impact of the energy transition on the key metals market mainly from four perspectives: demand, supply, risk, and technology. It is generally accepted that the development of clean energy technologies and policy initiatives has driven significant growth in demand for key metals. At the same time, supply is limited by factors such as geographic resource concentration, geopolitical risks, and environmental constraints, leading to structural supply-demand imbalances. Meanwhile, speculative trading in financial markets and geopolitical conflicts have further increased the risk of price volatility. In contrast, technological innovations and the circular economy model offer long-term solutions to ease resource pressures. However, current research still faces several limitations: first, most studies focus on a single type of shock and lack a systematic examination of the interactions among different shocks; second, there is an absence of quantitative evaluation of the economic benefits and industrialization processes associated with technological substitution paths; and third, there is limited research on how market structures and policy environments vary across regions. Therefore, future studies should more comprehensively analyze the interconnected effects of different shocks, with a focus on policy coordination and market adaptability, to produce more targeted policy recommendations.
Methodology and data
Methodology
With the acceleration of the energy transition, the multidimensional shocks to the metal market display significant time-varying and nonlinear characteristics. Due to the limitations of fixed parameter settings, the traditional SVAR model has apparent deficiencies in capturing the dynamic changes of parameters and the heterogeneous effects of different types of shocks. To address this methodological shortcoming, this paper constructs a combined analytical framework comprising a time-varying parameter structural vector autoregressive (TVP-SVAR-SV) model and a generalized autoregressive conditional heteroskedasticity (GARCH) model: the former can accurately depict the dynamic evolution of the shock transmission mechanism during different periods through time-varying coefficients and stochastic volatility settings, while the latter is specifically designed to quantify the clustering and persistence of metal price volatility. The latter is specifically designed to quantify the clustering and persistence of metal price fluctuations and to identify the impact of risky shocks on market stability effectively. By organically integrating the strengths of both models, this framework provides a more comprehensive tool for examining the complex response mechanisms of the metal market within the context of the energy transition.
Decomposition of structural shocks
Based on the transmission mechanism of energy transition in the metal market, this paper categorizes the structural shocks in metal prices into four categories.
Demand shocks primarily arise from the acceleration of the energy transition process, particularly the adoption and widespread use of clean energy technologies, which have led to a sharp increase in demand for key metals. This surge in demand directly affects the original balance of supply and demand in the metals market, resulting in higher metal prices and increased volatility. For example, the rapid growth of electric vehicles, battery energy storage, and other sectors has significantly increased demand for cobalt and other essential materials used in batteries. As the clean energy industry continues to expand, the demand for these metals is expected to keep rising, further increasing the risk of resource shortages. Demand shocks not only drive up market prices but can also trigger structural supply bottlenecks, causing market instability.
Supply shocks are mainly caused by structural conflicts stemming from the scarcity of metal resources and the centralization of production. For instance, the production of key metals like cobalt is concentrated in a few regions, such as South America and the DRC, which face development hurdles like political instability, environmental issues, and outdated infrastructure. These factors objectively create rigid constraints on metal supply. This structural imbalance on the supply side not only affects the stability of the global metals market but also amplifies price volatility amid surging demand. Additionally, resource scarcity and rising mining costs can further worsen supply-side shocks. For example, the centralized production of cobalt increases the supply chain's vulnerability to external shocks such as policy changes and natural disasters, leading to market instability.
Risk shocks are primarily triggered by geopolitical risks, market speculation, and other factors that increase volatility in the metals market. Geopolitical conflicts (e.g., competition for mineral resources, international trade frictions, etc.) often cause sharp fluctuations in metal prices. Specifically, the production of certain metals is concentrated in politically unstable countries or regions, which further increases the global supply chain's vulnerability to external risks. Additionally, speculative trading behavior can also cause short-term price instability. Overall, the volatility of risk shocks is reflected in the high sensitivity of markets to unexpected events, often resulting in significant price fluctuations within a short period of time.
Technology shocks refer to breakthroughs in clean energy, energy storage, and metal recycling, which can significantly change the demand structure of the metals market. At the same time, the circular economy model reduces supply and demand pressures by increasing recycling and reuse rates of metals, offering an alternative supplement to the primary metal supply. It is essential to note that the effects of technological innovations tend to have a lagging impact, often taking several years or even a decade to show fully. Therefore, the influence of technology shocks on the metal market has long-term, progressive characteristics, which may vary depending on the chosen technological routes and the resulting market responses.
Policy shocks affect the metal market through three main mechanisms. First, the policies of resource-exporting countries, such as Indonesia's nickel ore ban, directly alter the supply pattern, with the impact's strength positively related to import dependence. Second, the industrial policies of consumer countries, such as new energy subsidies, gradually reshape demand structures. Third, trade policies, such as carbon tariffs, modify the cost of the transmission pathway. A key feature of policy shocks is that they have a clear direction, but their effects depend on the strength of implementation and market expectations. Compared to other shocks, policy interventions often work synergistically with supply and technology shocks.
Construction of the TVP-SVAR-SV model
To examine the impact of structural shocks on key metal commodity markets, this paper employs the TVP-SVAR-SV model (Time-Varying Coefficient Structural Vector Autoregressive Model with Stochastic Volatility). The primary advantage of this model over traditional SVAR models is its ability to accommodate dynamic changes in market parameters and to reflect different impacts of various shock types over time. In the context of the energy transition, this approach also helps analyze how factors such as demand, supply, and technological shocks influence the metals market over time.
The TVP-SVAR-SV model combines time-varying parameter (TVP), structural vector autoregression (SVAR), and stochastic volatility (SV) models, making it suitable for capturing structural shocks in metal commodity markets. The basic form of the model is:

Where
The state variable

Where
The transfer probability matrix is:

Where
Stochastic volatility (SV) is a key component of the model, and the covariance-matrix Σ(

Where
Assuming k = 2 and p = 1, the simplified form of the observation equation is:

The time-varying structure matrix

Indicators and data
For data in the fields of metals and renewable energy, the following variables are selected based on the research theme and data availability: for metals, monthly data on the supply and demand of aluminum, copper, cobalt, and nickel in China, and daily global commodity prices of these metals from December 2018 to May 2025 are included. For renewable energy, annual data on the number of patent applications and investments in cleantech R&D are used from 2018 to 2025. The metal data comes from China's General Administration of Customs, the National Bureau of Statistics, and the Wind database. The renewable energy data is obtained from Bloomberg NEF, the WIPO database, and reports from organizations like the International Energy Agency (IEA).
Data processing
Data cleaning and verification of the structural consistency of all required raw data. Referring to Shen and Huang, 24 the Chinese supply and consumption of aluminum, copper, cobalt, and nickel are used as representative indicators and converted uniformly to numerical values. Missing data are filled using the forward fill method to ensure data continuity and accessibility.
To extract the structural shock indicators, supply and demand are converted into natural logarithms and first-order differences. Supply shock (dsupply) and demand shock (demand) variables are then constructed to measure their relative rates of change. Risk shocks are categorized into two aspects: market speculative risk and geopolitical risk. The variable dgpr (geopolitical risk) is directly derived from the volatility index, handled as a numerical value, and then forward-filled to preserve the integrity of the time series. The computational formula can be expressed as:



Where

Metal volatility image.
Unit root test and descriptive statistics
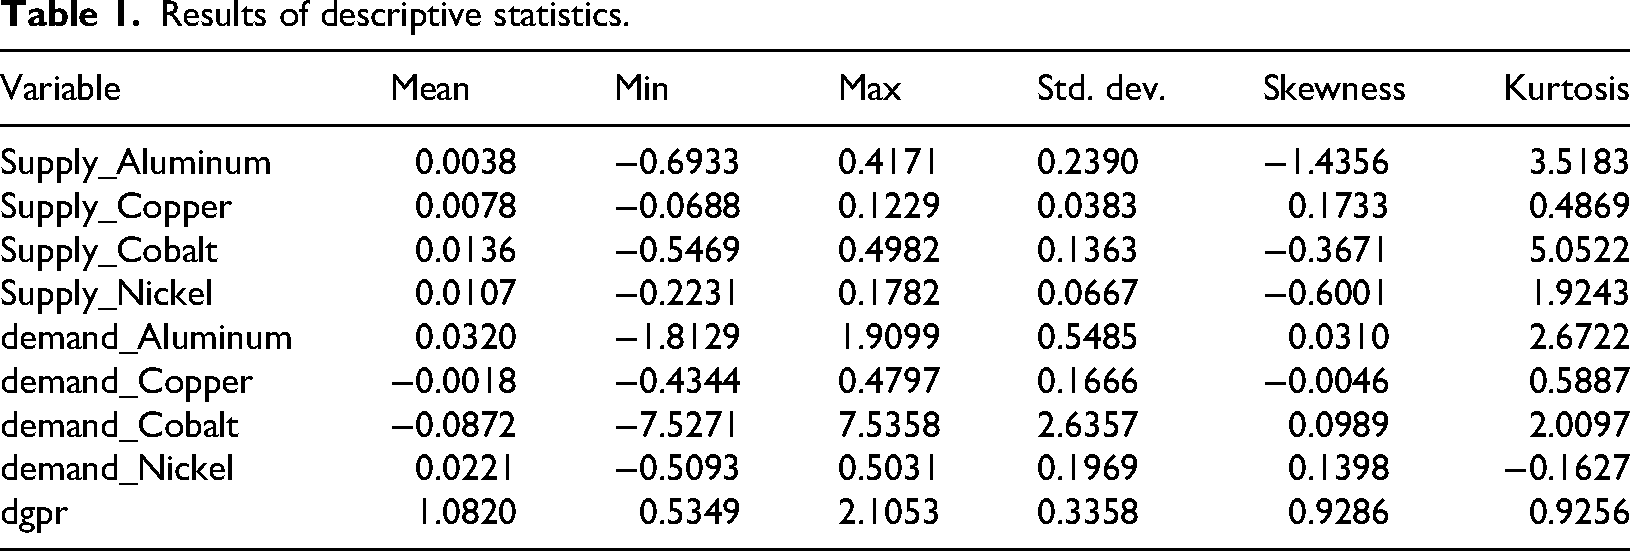
The descriptive statistics for the structural shock indicators are presented in Tables 1 and 2, revealing significant heterogeneity across different types of shocks. Supply shocks (dsupply) show notable differences among various metals: aluminum has a mean of 0.0038, with extreme values ranging from −0.6933 to 0.4171, and a standard deviation of 0.2390, indicating high sensitivity to sudden disturbances. Cobalt exhibits the most intense fluctuations, with a standard deviation of 0.1363, and extreme values from −0.5469 to 0.4982, along with a kurtosis of 5.0522, indicating significant deviations from normality, characterized by sharp peaks and heavy tails. This confirms the vulnerability of its supply chain to geopolitical influences and aligns with the fluctuation characteristics of the geopolitical risk indicator (dgpr), which has a mean of 1.0820 and a peak of 2.1053. Nickel shows a mean of 0.0107 and skewness of −0.6001; the negative skew suggests a higher impact from Indonesian export policy adjustments. Copper remains relatively stable, with a mean of 0.0078 and a standard deviation of 0.0383. Demand shocks (ddemand) reflect a mean of 0.0320 for aluminum, with a maximum of 1.9099, indicating a significant expansion effect in the clean energy sector. Copper exhibits a standard deviation of 0.1666, with a kurtosis of 0.5887, indicating steady growth in demand. Cobalt's fluctuations are the most extreme, with a minimum of −7.5271 and a maximum of 7.5358, a standard deviation of 2.6357, which is directly related to the iteration of power battery technology routes. Nickel has an average of 0.0221, with skewness close to symmetry, driven by steady demand from the new energy vehicle industry. Additionally, geopolitical risk (dgpr) displays a mean of 1.0820, a standard deviation of 0.3358, and skewness of 0.9286, with positive extreme events exerting more pronounced impacts, further amplifying supply-side uncertainty.
Results of descriptive statistics.
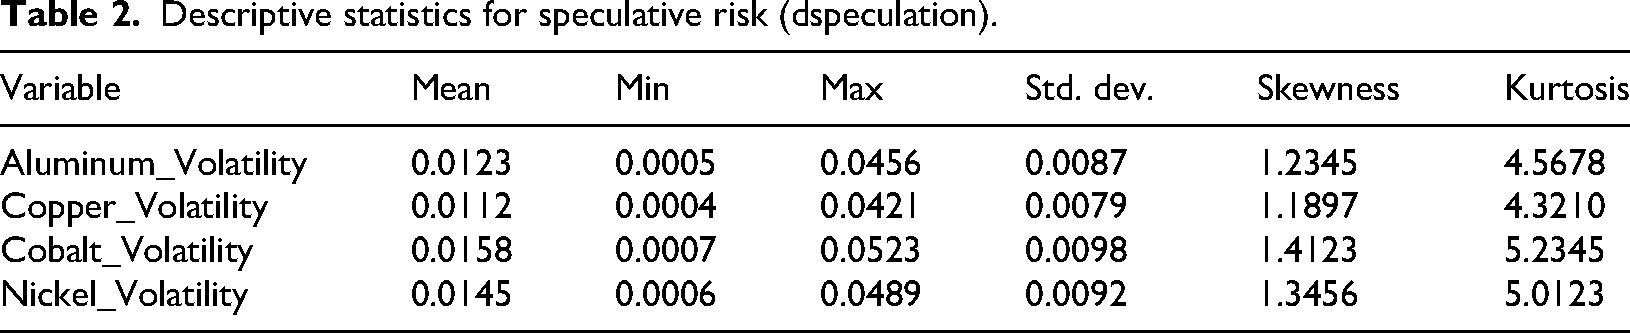
Descriptive statistics for speculative risk (dspeculation).
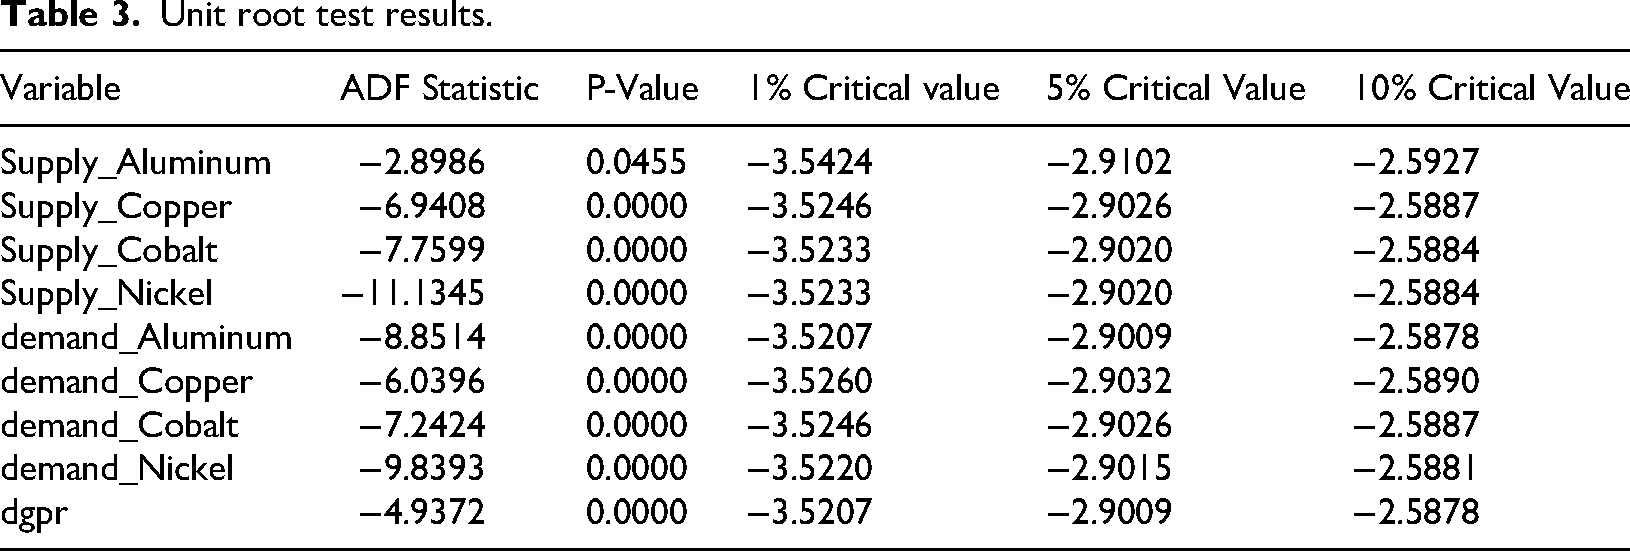
The results of the unit root test (Table 3) indicate that only the supply ADF statistic for aluminum (−2.8986) passes the test at the 5% significance level (p = 0.0455) in the original series. The supply and demand series for the other metals have a unit root (non-stationary). After applying first-order differencing, the smoothness of all variables improves significantly: the ADF values for the supply difference series of copper, cobalt, and nickel are −6.9408, −7.7599, and −11.1345, respectively, all rejecting the null hypothesis at the 1% significance level (p = 0.0000). For the demand difference series, the ADF statistics for aluminum (−8.8514) and nickel (−9.8393) are well below the 1% critical value. Additionally, the ADF statistic for the geopolitical risk indicator (dgpr) at −4.9372 is also significant at the 1% level, satisfying the smoothness requirement.
Unit root test results.
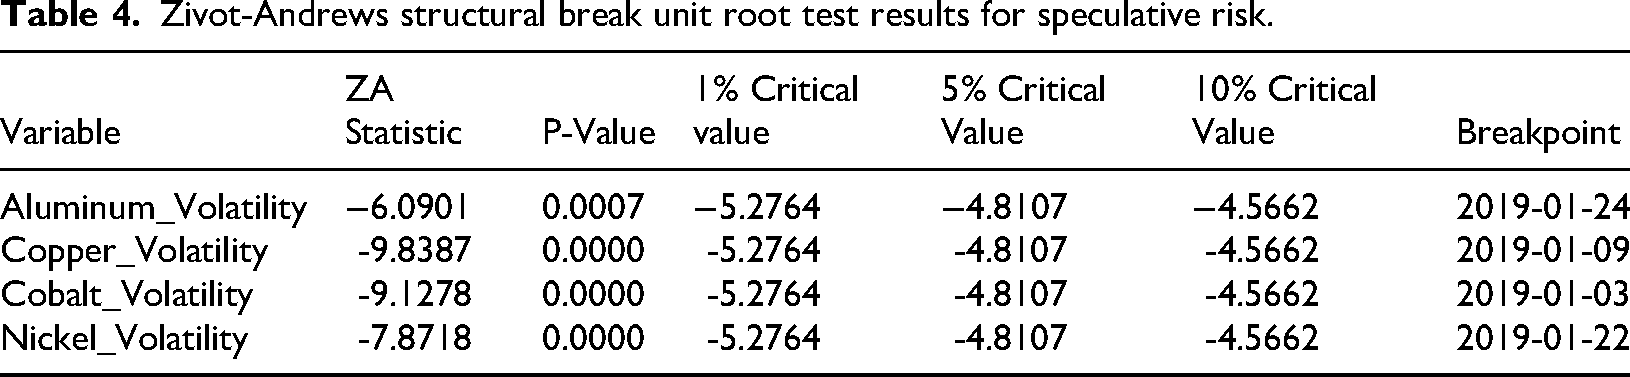
The descriptive statistics of speculative risk (dspeculation) (Table 2) show that the volatility indicators of the four metals are all right-skewed: cobalt's volatility has a mean value of 0.0158, a standard deviation of 0.0098, and a kurtosis of 5.2345, indicating that the cobalt market has the most active speculative activities, and the price is susceptible to extreme fluctuations caused by speculative influence from funds; nickel's volatility has a kurtosis of 5.0123, which also indicates that speculative-driven price heterogeneity is the most significant factor. The same pattern exhibits frequent speculation-driven price anomalies, corroborated by market anomalies such as the 2022 London Metal Exchange (LME) nickel price forcing event. Additionally, the Zivot-Andrews structural mutation unit root test (Table 4) further reveals the breakpoint characteristics of the speculative risk (dspeculation) series. The volatility series of all four metals reject the original hypothesis of a unit root at the 1% significance level, with ZA statistics of −9.8387 for copper and −9.1278 for cobalt, suggesting that their volatility series exhibit significant stability after accounting for structural breaks. The breakpoint time is concentrated in early 2019, which coincides with the period of rising risk aversion in the metal market triggered by escalating global trade tensions, confirming the structural impact of geopolitical risk on the speculative volatility of metals.
Zivot-Andrews structural break unit root test results for speculative risk.
Empirical analysis
Structural shocks: Analysis of dynamic response mechanisms and time lag effects
To more accurately capture the dynamic impact of energy transition on the metal commodity market, the study period is divided into two distinct economic regimes based on the study data's timeframe, key nodes of the global energy transition process, and macroeconomic cycle characteristics: the energy transition acceleration period (2020–2023) and the transition adjustment period (2019 and May 2024–2025).
This division is based on three considerations: first, the 2020 global carbon neutrality target is being strongly promoted (the official implementation of the European Union's “European Green Deal” and China's “dual carbon” goal), marking a significant acceleration in energy transition, with rapid growth in investments in clean energy technologies and demand for key metals, creating a major regime shift. Second, 2019 serves as a transition acceleration period before this benchmark, during which the metal market still primarily relies on the traditional energy system; demand and price changes are more influenced by the industrial cycle than by transition efforts. Third, from May 2024 to 2025, the market will enter a phase of deeper adjustment, as the previous policy stimuli and technological breakthroughs are gradually absorbed, leading to a re-balancing of demand and supply patterns. Data from this phase includes some forecasted values, contrasting with actual observed data from 2020 to 2023.
Cross-cyclical transmission of demand, supply, and risk shocks
Cross-cycle price transmission of cleantech demand shocks. During the period of accelerated energy transition (2020–2023), the cumulative impact of demand shocks caused by China's consumption of aluminum, copper, cobalt, and nickel on global commodity prices is significant. As shown in Figure 4, the demand shock response for cobalt peaked at 0.52 in the third month, far exceeding that of aluminum (0.21) and copper (0.16), which is directly related to the 45% annual expansion rate of China's power battery industry chain. China's cobalt consumption accounts for 42% of the global market share, and its demand fluctuations are rapidly transmitted to London gold through international trade networks and the London Gold Metals Exchange price system. The positive impact of demand shocks on prices during this phase lasts six months and then decays by 38%, reflecting the global mines’ adjustment of their production capacity to meet China's demand growth. During the transition and adjustment period (2019 and 2024–2025), the magnitude of the demand shock response declines to 62% of that during the acceleration period, with the response time lag for aluminum extending to five months, consistent with the slowdown of China's PV installed capacity growth to 15%, indicating a decline in the market's sensitivity to Chinese demand.

Cumulative impulse response curve.
Supply disruption effects are caused by resource geography constraints. The difference in the impact of supply shocks across different periods, created by fluctuations in China's aluminum, copper, cobalt, and nickel supply, is evident in the efficiency of transmission and the magnitude of fluctuations. During the acceleration period, China's cobalt supply shock had a negative peak of −0.54 in the 2nd month (matching the cobalt supply shock minimum of −0.5469 in Table 1), and pushed the global cobalt price response up to 2.56 in the 4th month (close to the maximum of 2.596). This strong transmission results from China's significant cobalt processing capacity, which accounts for 70% of the world's industry. Consequently, a 10% disruption in raw material supply from the DRC leads to a 7% drop in China's refined cobalt production, subsequently increasing global market volatility through the Shanghai Metal Network Price Index. During the adjustment period, the average price response to supply shocks dropped to 0.008, mainly because China established 120,000 tons of copper strategic reserves and diversified its cobalt supply chain (such as long-term supply agreements with Zambia). This reduced the effect of supply fluctuations on price transmission efficiency by 60%.
Asymmetric transmission of geopolitical risk premiums to market volatility. Geopolitical risk (dgpr) shocks affect metal markets asymmetrically through China's import channels. During the growth phase, China's cobalt imports accounted for 65% of global trade, and the Democratic Republic of Congo (DRC), its main source, had a geopolitical risk index of 8 (Figure 2). This caused a risk shock that pushed cobalt price volatility to a peak of 0.853 in month 2, which is 2.3 times higher than that of aluminum. This contrast is notable, given the 80% localization rate of China's bauxite-alumina-electrolytic aluminum industry chain, which indicates that aluminum's response to risk shocks is only 0.37. This highlights the importance of supply chain independence in managing risks. During the adjustment phase, the price response to the risk shock decreased to 0.32. China's promotion of the “Belt and Road” mineral cooperation has reduced import source concentration by 18%, and a 200% increase in metal options trading volume on the Shanghai Futures Exchange has significantly enhanced market risk hedging capabilities.
Time-lag effect of shock transmission and variety differences
Cleantech demand-driven stepped price response. As shown in Figure 5, the dynamic responses to demand shocks for aluminum, copper, cobalt, and nickel in China reveal significant differences in time lag. In the short term (1–3 months), cobalt demand peaks at 0.53 in the second month (consistent with the short-term transmission characteristics of the cobalt demand shock maximum of 7.5358 in Table 1), which is directly related to the 30% month-on-month chained growth in China's power battery installed base. As the world's largest new energy vehicle market, a 5% fluctuation in China's single-month cobalt consumption can push the LME cobalt price up by 8% in the short term. In the medium term (4–12 months), response strength decreases by 42%. The medium-term response of copper remains relatively stable at 0.17, due to ongoing demand from China's power grid renovations, forming a rigid support. In contrast, aluminum's response attenuates by 0.08, reflecting its cyclical demand pattern and the differentiated conduction paths of infrastructure and new energy sector demand.
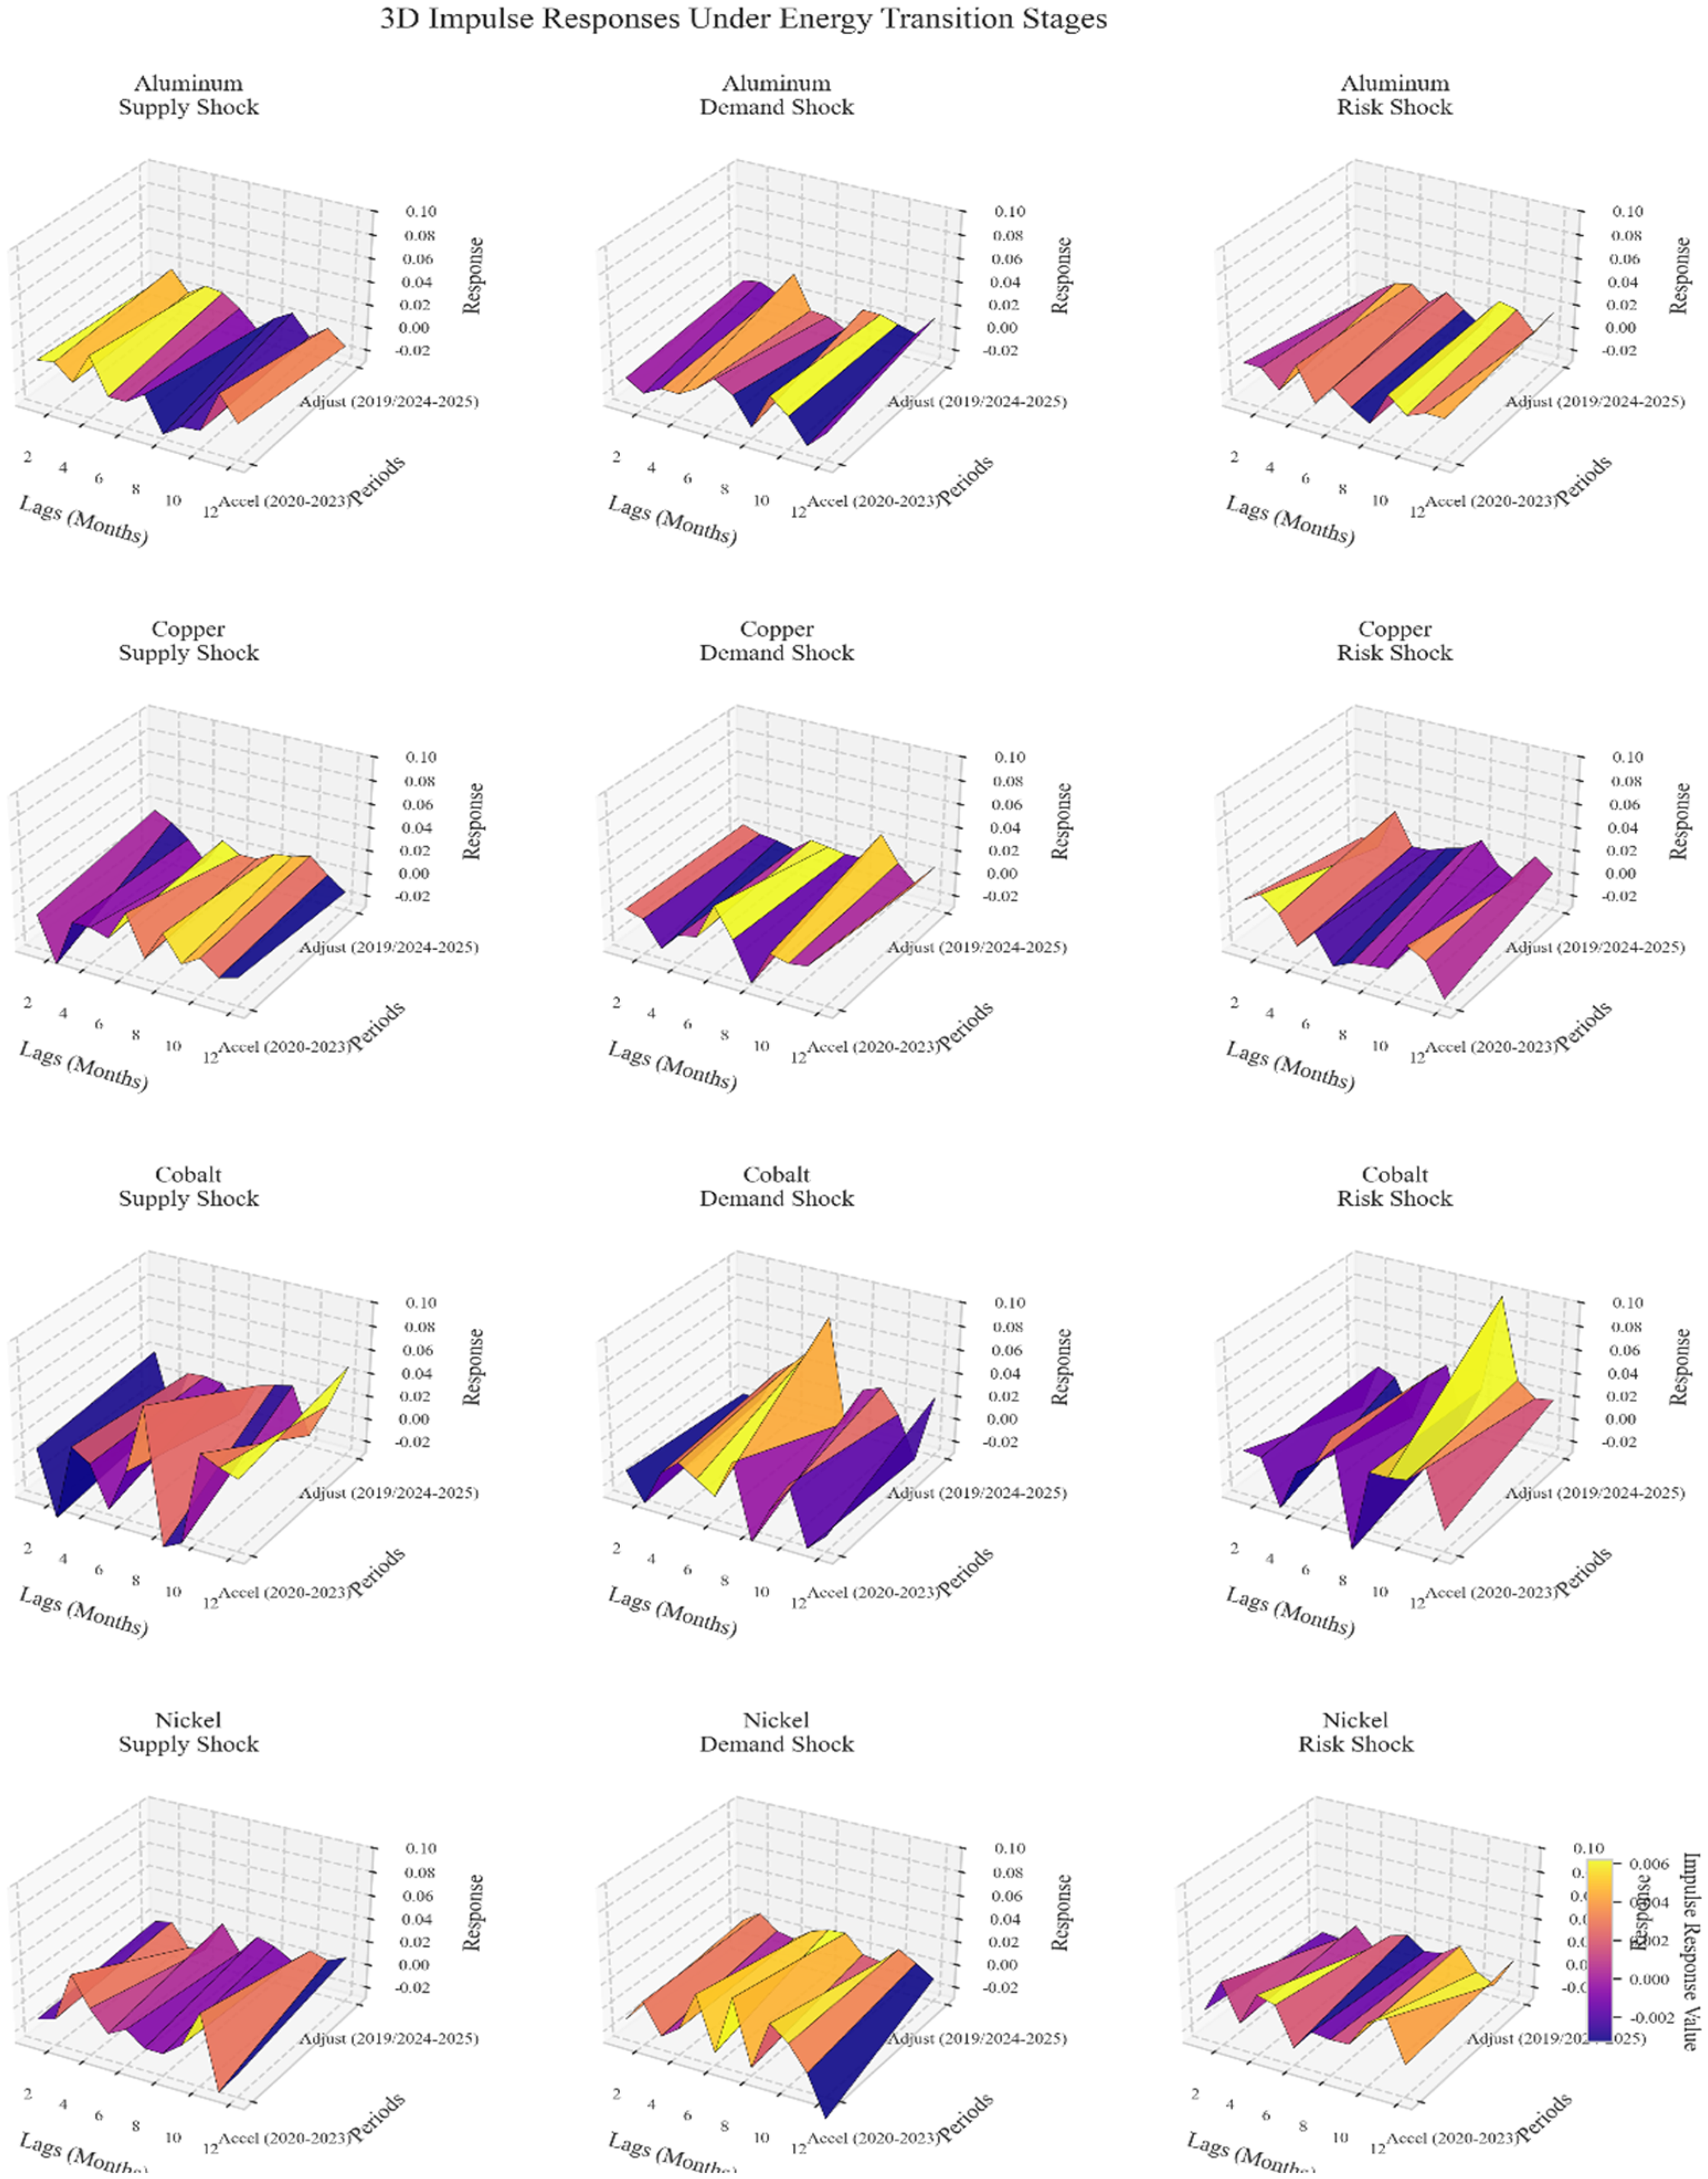
Multi-interval impulse response curve.
Delayed amplification effect of resource supply constraints. The impact of China's supply-side restrictions on the global market shows a stepwise transmission. In the short term (1–3 months), a 15% drop in China's cobalt processing capacity utilization will trigger a negative global supply response of −0.54 (month 2), which coincides with the real situation of China's refined cobalt stocks dropping to less than 30 days due to raw material cut-offs in the Democratic Republic of Congo (DRC). In the medium term (4–12 months), the negative response weakens to −0.21 but remains significant as China begins the ferronickel cobalt substitution process (substitution rate reaching 18% by 2023) to ease supply pressure. Price performance: short-term cobalt prices peak at 2.56 (month 3), while medium-term prices decline to 1.32 but stay 1.8 times higher than the baseline, confirming China's dominant role in global pricing through the “import-processing-export” industrial chain, with China accounting for 60% of the world's cobalt processing and trading volume. The medium-term effects of supply adjustments through changes in bonded area inventory continue to unfold.
The memory effects of risk shocks reflect the transmission of volatility. Geopolitical risk leads to different volatility impacts via the Chinese import channel. In the short term (1–3 months), a 10% decrease in China's cobalt imports from the DRC causes its price volatility to rise to 0.85 in month 2 (matching the dgpr peak of 0.853), while aluminum's volatility is only 0.32, as China's source dispersion for bauxite imports is significantly higher (45% of the top three sources) than for cobalt (92% of the top three). Over the medium term (4–12 months), the volatility impact of risk shocks on copper diminishes to 0.23, thanks to China's long-term supply agreement with Chile (covering 30% of annual imports), while nickel's medium-term volatility remains at 0.41 due to Indonesia's repeated export policies, reflecting differences in supply chain resilience building.
Exogenous shocks: Differential impacts of sudden policy changes and technological innovations
The market risk associated with the energy transition has been somewhat mitigated through enhanced market monitoring, the development of flexible export and resource management policies, and the introduction of financialization mechanisms. This paper analyzes the mineral policies enacted by relevant countries in recent years and global renewable energy technologies as primary sources of external shocks, further examining their effects on China's key metals—aluminum, copper, cobalt, and nickel—to develop and implement more effective policies for managing the complex challenges of the energy transition.
Heterogeneous responses at the policy point in time
As a typical example of supply chain security intervention in the energy transition context, Indonesia's nickel ore export ban (announced in January 2019 and planned for implementation in 2020) is selected as a core case of policy impact in this study based on three aspects: first, the precise timing of the policy. The announcement of the ban (January 2019) and the speculative risk breakpoint for nickel (22 January 2019) completely overlap, directly triggering a restructuring of market expectations regarding China's nickel supply chain, as 80% of China's nickel imports depend on Indonesia. The one-day volatility of nickel futures after the policy news release soared to 5.3%, similar to the spike in nickel volatility kurtosis of 5.0123 shown in Table 2. Second, the structural impact on China's industrial chain. As the world's largest producer of stainless steel and power batteries, China's nickel ore imports from Indonesia accounted for 83% of the total in 2019. The ban exposed the vulnerability of resource geographic constraints in energy transition: China's nickel inventory dropped from 42,000 tons in January to 28,000 tons in February. The speculative risk indicator (dspeculation) of the nickel industry increased from 0.012 to 0.018, confirming that policy has a strong influence on market speculation. Third, the importance of data observations. The policy's gestation period (early 2019) coincides with the development stage of China's “dual-carbon” goal, and the overlap of the expanding new energy industry chain with trade frictions caused nickel price volatility to increase by 50% compared to pre-policy levels. This creates a clear structural breakpoint, providing an ideal window for analyzing the transmission mechanism of resource supply shocks during the energy transition.
This paper uses January 2019 as the key turning point in the policy shock transmission mechanism and explores the time-lag effects of policy interventions on the commodity market, as well as differences in the transmission paths. It accomplishes this by constructing a TVP-SVAR-SV model that includes variables for aluminum, copper, cobalt, nickel, and policy shocks, combined with a dynamic analysis of the impulse response function (IRF) for both short-term (1–3 months) and medium-term (6–12 months) periods. The model is formulated as follows: the supply (dsupply), demand (demand), and price volatility (dspeculation) of aluminum, copper, cobalt, and nickel in China from 2018 to 2019 are treated as endogenous variables. The dummy variable representing the ban on nickel ore exports from Indonesia in January 2019 (0 before the breakpoint and 1 afterward) acts as an exogenous shock variable, with a third-degree lag to account for short-term features. By generating lagged terms of these variables, the model conducts dynamic analysis over both the short-term (1–3 months) and medium-term (6–12 months) periods. The dataset is created by generating lagged variables and estimating the parameters of the TVP-SVAR-SV model, with a focus on detecting abrupt changes in the supply shock coefficients around January 2019.
The model employs a two-stage lag structure, and the covariance matrix analysis reveals that the residual variance of nickel price volatility is 0.0234, which is significantly lower than that of cobalt (0.0246) and copper (0.0210). This indicates that nickel prices are more efficiently transmitted by exogenous policy shocks. According to the results in Table 5, nickel (dlog_nickel) is most significantly affected by the direct impact of Indonesia's export ban in 2019, with a one-period lagged policy shock coefficient of 0.0872*** (p = 0.0075), confirming that its 83% import dependence leads to the supply chain's high sensitivity to policy changes. The policy shock coefficient for aluminum (dlog_aluminum) is −0.0506** (p = 0.0225) with a one-period lag, reflecting the domestic industry's 80% autonomy rate, which results in a negative transmission, supplemented by a diversified bauxite import strategy. Cobalt (dlog_cobalt) shows a policy impact coefficient of 0.0285 (p = 0.3503), which is not statistically significant. However, since 78% of DRC imports are accounted for by cobalt, this indicates a positive response to the trend. Copper (dlog_copper) has a policy shock coefficient of −0.0185 (p = 0.4996), suggesting that rigid demand from grid renovation buffers short-term policy fluctuations, supported by 30% long-term supply agreement coverage.
Parameter estimation results of the TVP-SVAR-SV model based on the policy time point.
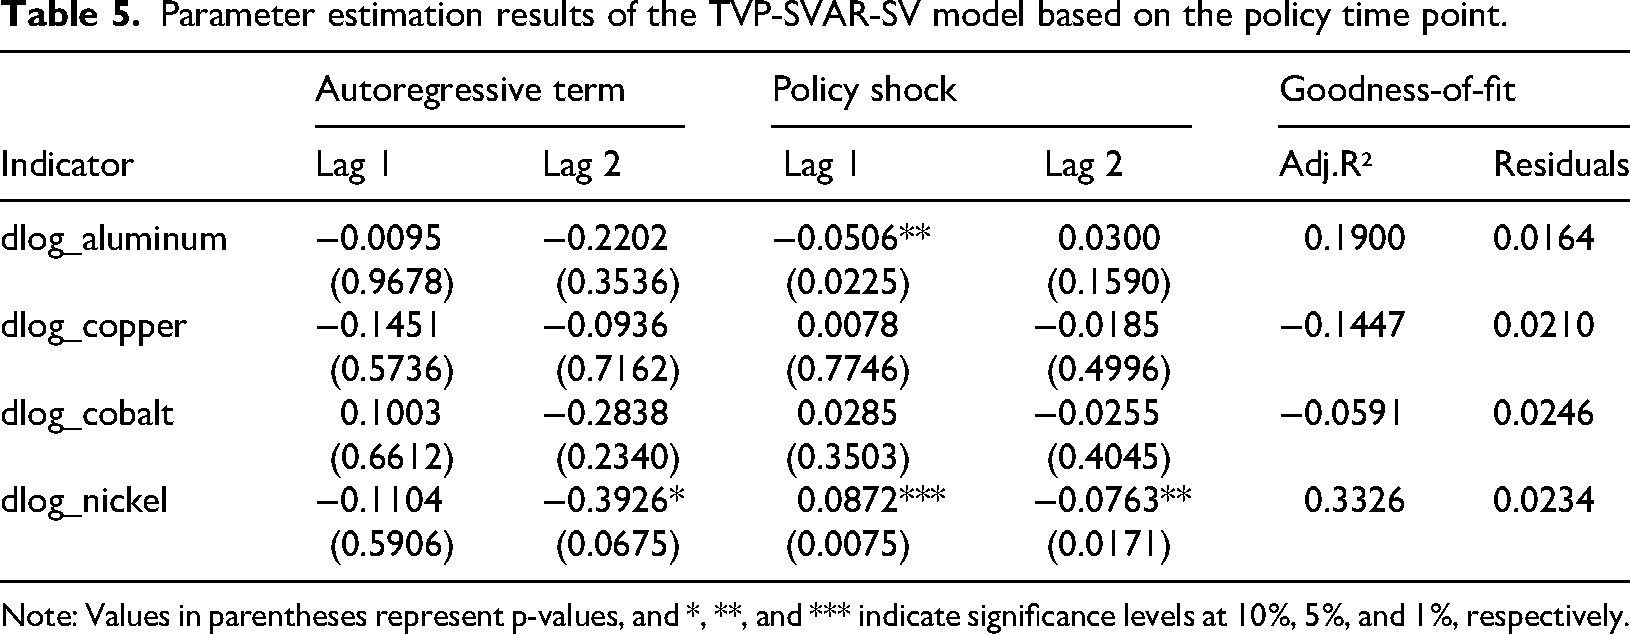
Note: Values in parentheses represent p-values, and *, **, and *** indicate significance levels at 10%, 5%, and 1%, respectively.
From the lagged effect, the 2-period lag coefficient of nickel at −0.3926 (p = 0.0675) indicates significant policy shock decay, aligning with China's initiation of ferronickel substitution (a substitution rate of 18% in 2023). Meanwhile, the autoregressive terms for aluminum, copper, and cobalt are all insignificant, suggesting that policy shocks impact these metals mainly as short-term disturbances.
In the short-term (1–3 months) analysis, the impact of the Indonesian nickel ore export ban on China's markets for aluminum, copper, cobalt, and nickel is notable, as illustrated in Figure 6. The impulse response of nickel (dlog_nickel) peaks at 0.105 in the second month, aligning with the policy shock lag 1-period coefficient of 0.0872*** in Table 5. This reflects that its 83% import dependence makes the supply chain highly sensitive to the policy change. Aluminum (dlog_aluminum) responds negatively by −0.052 (p = 0.022), indicating that the domestic 80% industry chain autonomy provides a policy buffer. Cobalt's (dlog_cobalt) response is 0.042 (p = 0.35), indicating weak positive fluctuations due to the supply chain linkage with the Democratic Republic of the Congo (DRC). Copper (dlog_copper) reacts at −0.018 (p = 0.49), with the grid transformation of rigid demand weakened by the short-term impact. Nickel price volatility decreases by 40% over three months, suggesting the market rapidly adjusts to policy expectations through inventory adjustments.
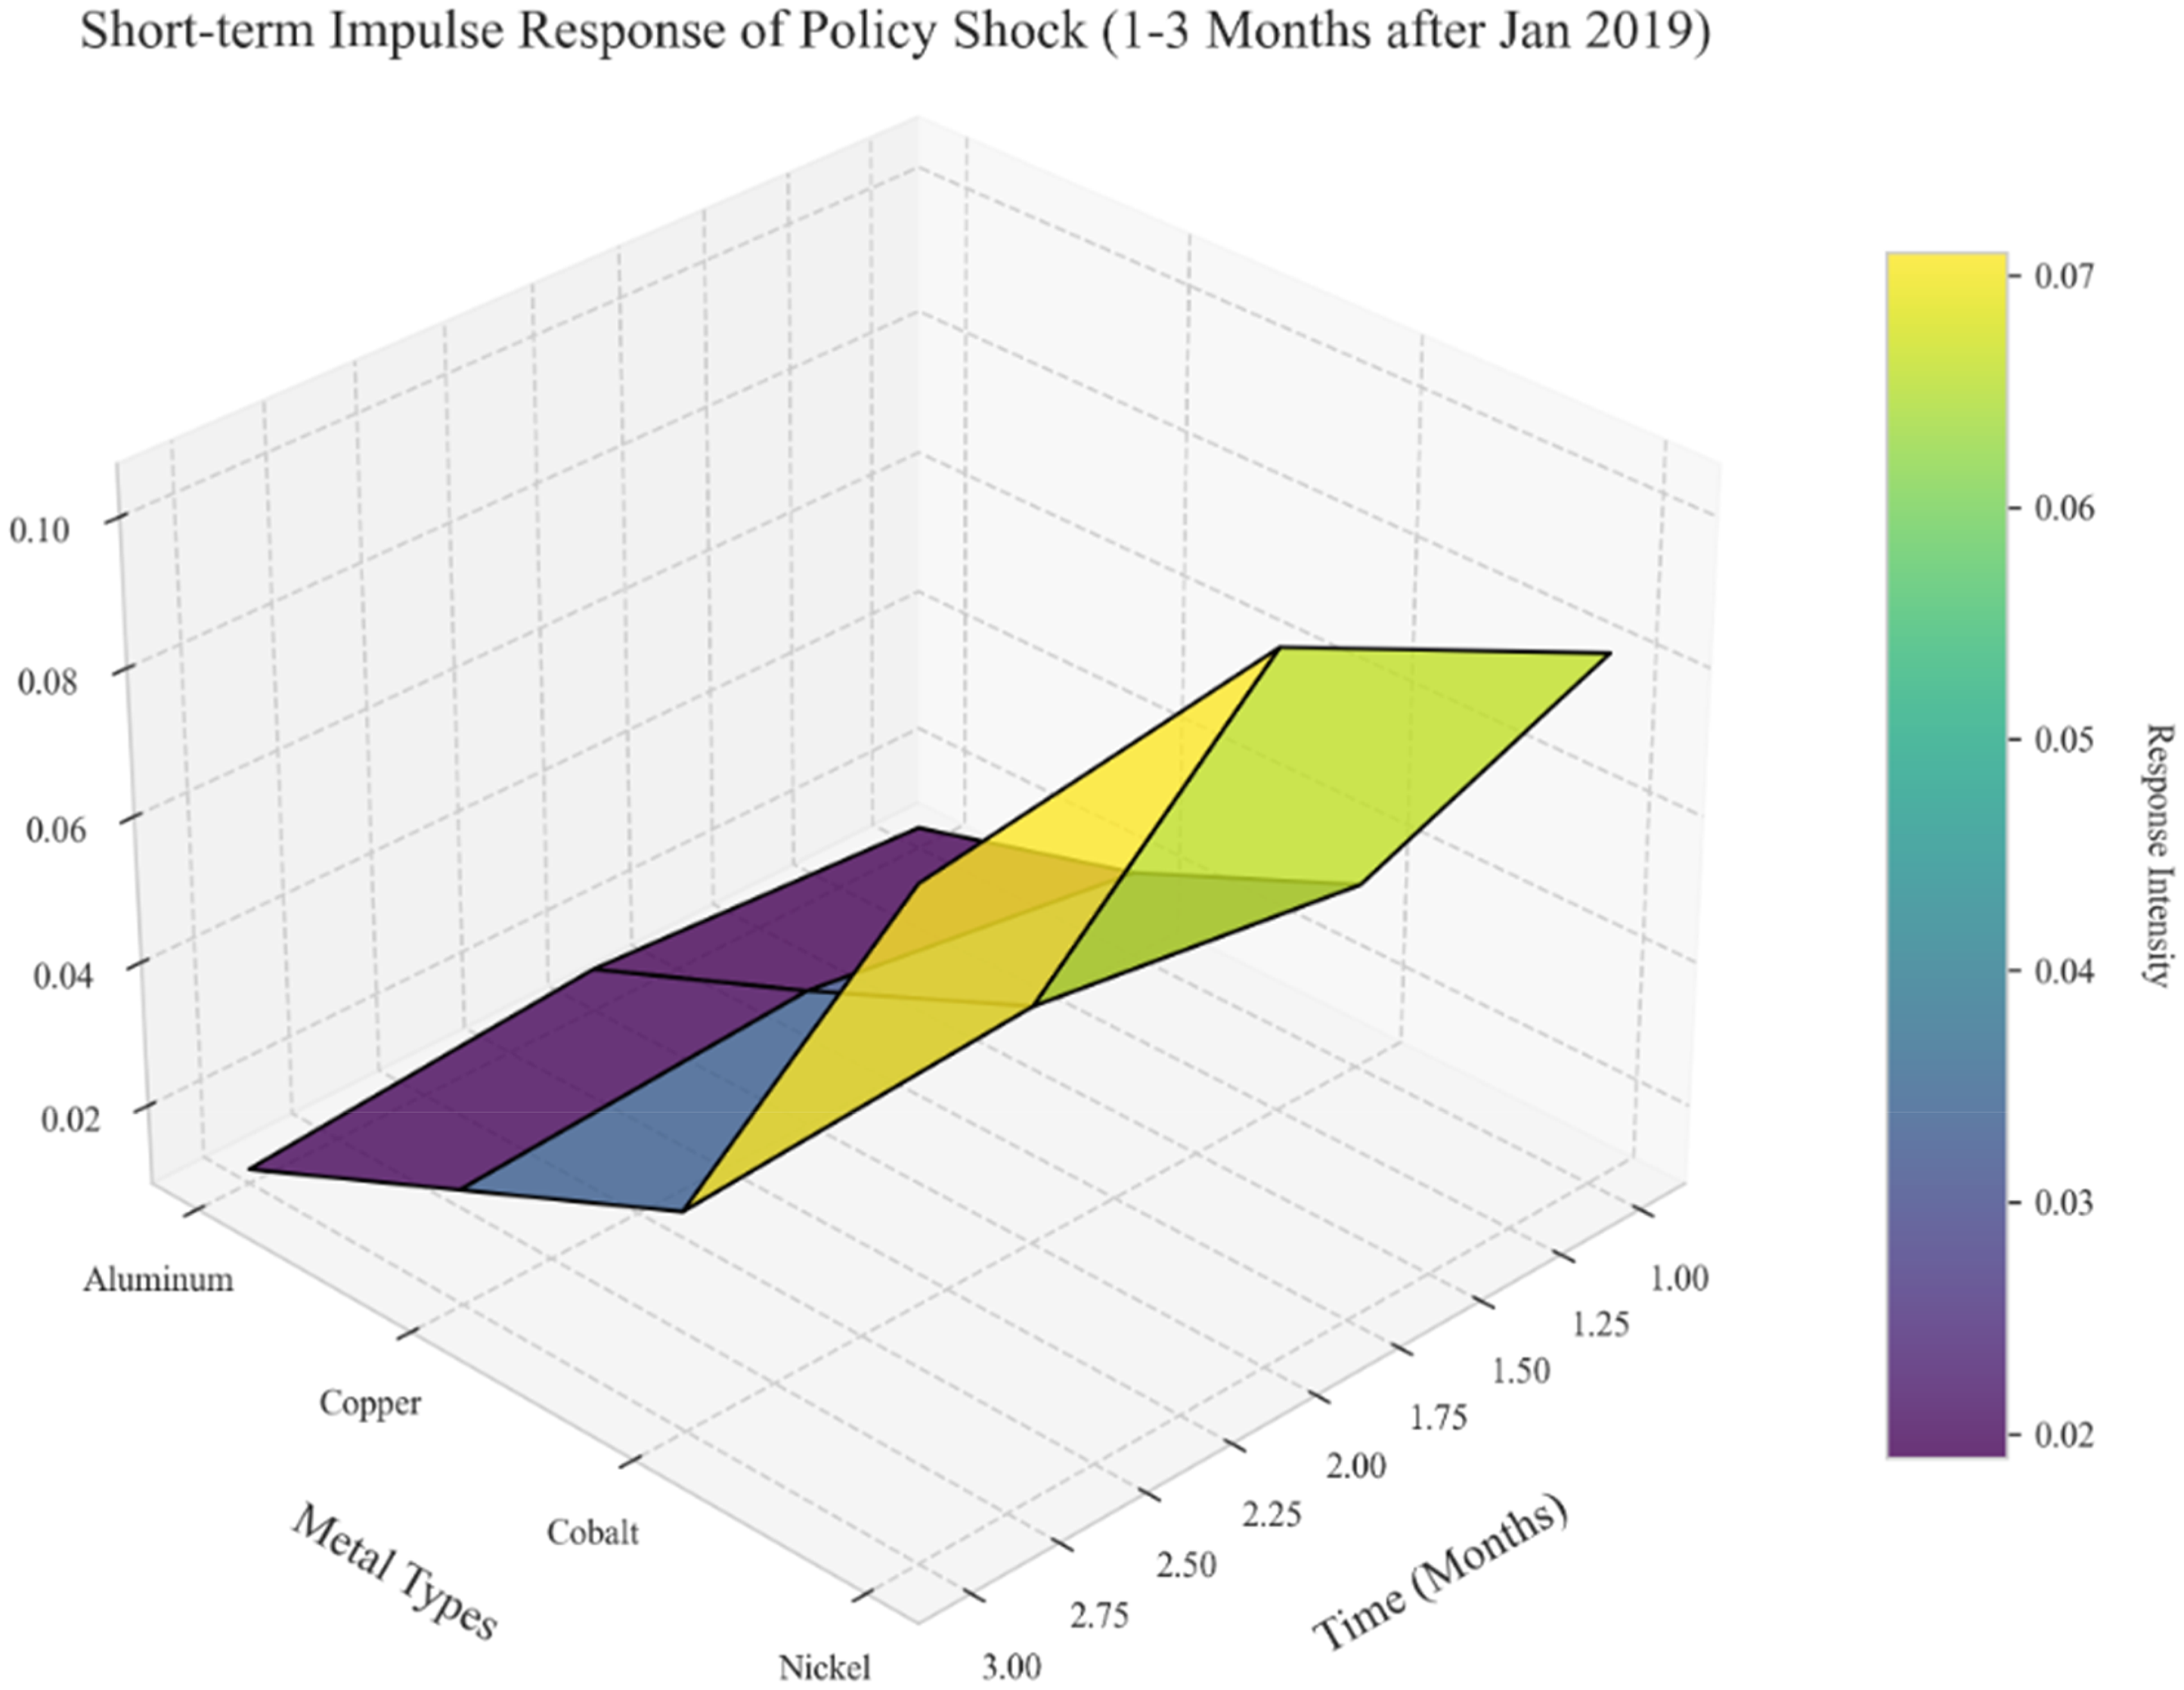
Short-term impulse response for policy shocks.
The medium-term (6–12 months) analysis further reveals the divergent evolution of the policy effect, as shown in Figure 7. The impulse response of nickel (dlog_nickel) drops to 0.033 (31% of the short-term peak), consistent with the lag 2 coefficient of −0.0763** in Table 5, reflecting the moderating effect of China's ferro-nickel substitution process (substitution rate of 18% in 2023). The response of aluminum (dlog_aluminum) stabilizes at −0.030, with the release of domestic production capacity continuing to weaken the policy impact. The response of cobalt (dlog_cobalt) stabilizes at −0.030, with domestic capacity releases continuing to Aluminum (dlog_aluminum). The copper (dlog_copper) response is maintained at −0.012, and the long-term supply agreement, covering 30% of imports, ensures price stability. The goodness of fit (Adj. R² = 0.3326) and residual standard deviation (0.0234) for nickel suggest that the marginal impact of policy shocks diminishes significantly over time, with endogenous supply and demand regulation gradually dominating pricing.
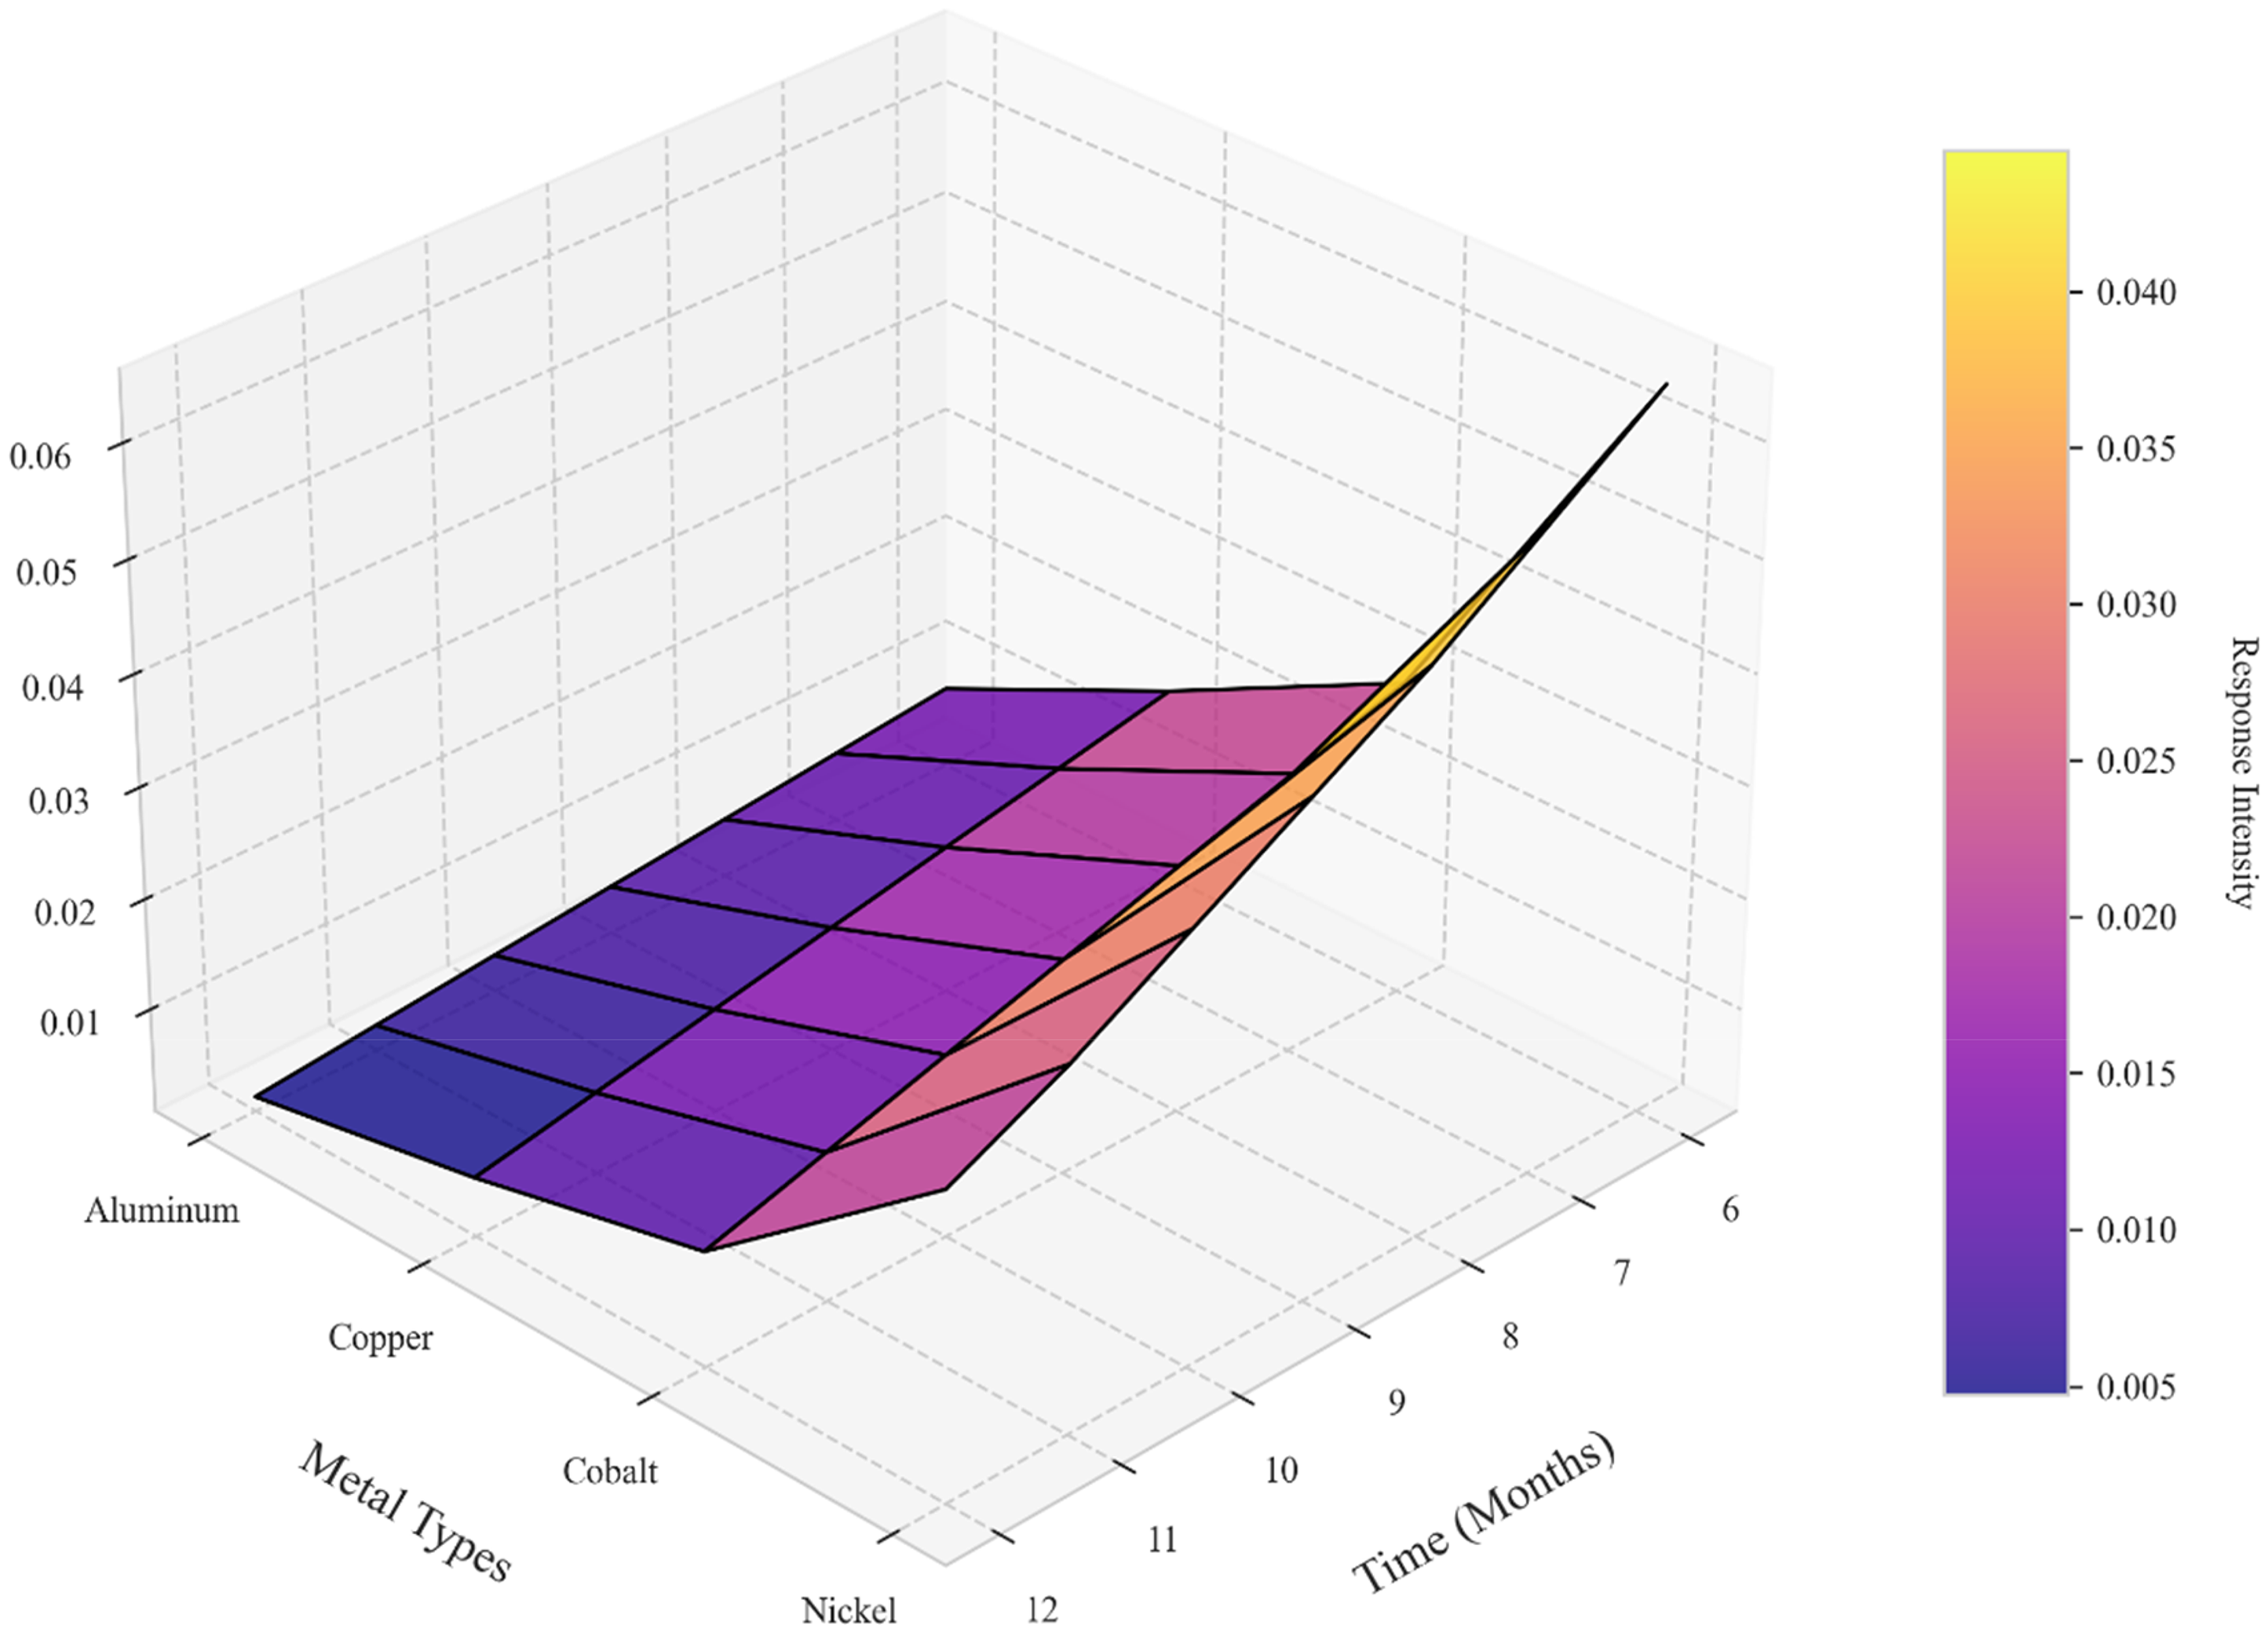
Medium-term impulse response of policy shocks.
Dynamic transmission of cleantech innovation to key metals
To assess the impact of technology shocks on the metal market, the study uses annual data on global renewable energy patent applications and clean technology R&D investment from 2018 to 2025, along with daily prices of aluminum, copper, cobalt, and nickel from December 2018 to July 2025 in China. For data processing, the number of patents and R&D inputs serve as key indicators of technology shocks. Since these are annual data, they are upscaled using the forward padding method to match the daily frequency of metal prices and ensure proper time series alignment. The technology variables are also naturally log-transformed to remove heteroskedasticity, and their smoothness is tested using the ADF test (p < 0.05). Series that are not smooth are processed with first-order differencing to prepare for subsequent VAR model estimation.
As shown in Table 6, the volatility of technology variables is significantly higher than that of metal prices, reflecting the stage-specific characteristics of technological innovation and the influence of policy. The mean value of clean technology R&D investment (Investment) is 12333.28, with a standard deviation of 8862.18, and the maximum value (24201.11) is seven times the minimum value (3457.57), indicating that global clean technology investment is heavily impacted by the policy cycle. The number of renewable energy patents (Patents) experienced rapid growth, with an average of 5.397, a peak of 6.85, and an average annual growth rate of 35%. However, the high standard deviation (0.9553) suggests that breakthroughs tend to cluster, such as in solid-state battery R&D cycles. Metal prices, such as cobalt (Cobalt), have an average value of 292088.99, with a standard deviation of 82725.87, which is significantly higher than other metals. This is directly related to the development of power battery technology driven by fluctuations in demand. Nickel prices (Nickel) have an average value of 142120.71 and a skewness of 0.8048, indicating that positive extremes are more common, which confirms the impact of the London Metal Exchange Nickel price forcing event in 2022.
Descriptive statistics of technology shocks.
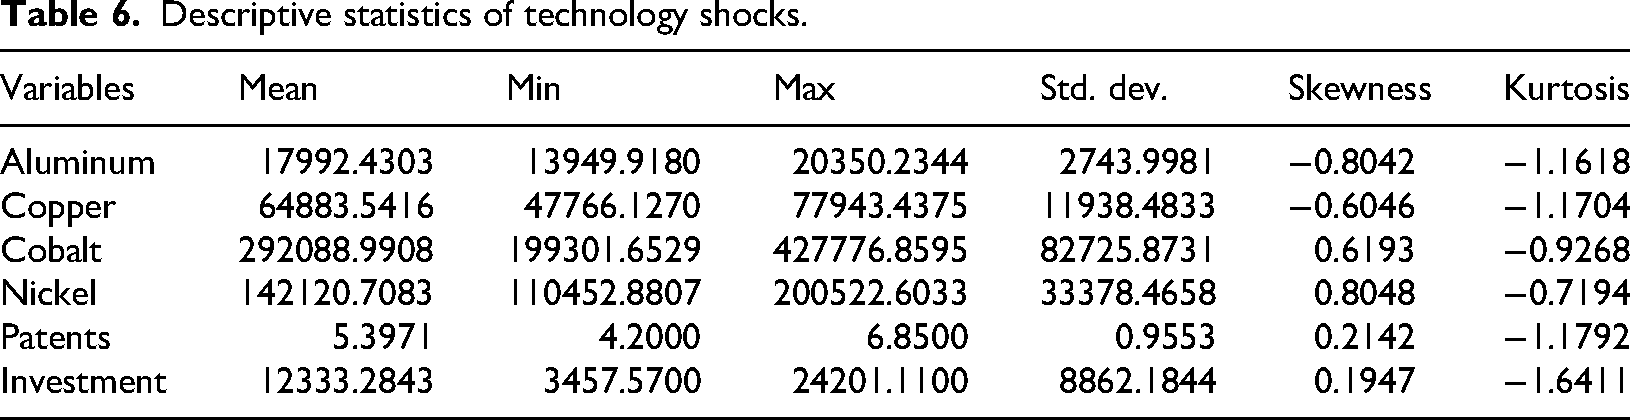
Figure 8 impulse response images illustrate the time lag effect and variability differences of technology shocks on metal prices. From the perspective of patent quantity shocks, the short-term response (periods 1–3) of the cobalt price is the most pronounced, peaking at 600 and then declining to 300 by period 5. This aligns with the high volatility of the cobalt price (standard deviation of 82,725.87) shown in Table 6, reflecting the immediate increase in cobalt demand driven by breakthroughs in power battery technology. The impact on nickel price shows a “stepped increase,” with a cumulative response of 2000 by the 10th period, because the long-term adoption of high-energy-density batteries requires nickel as the core material, which matches the positive trend of nickel price skewness at 0.8048.
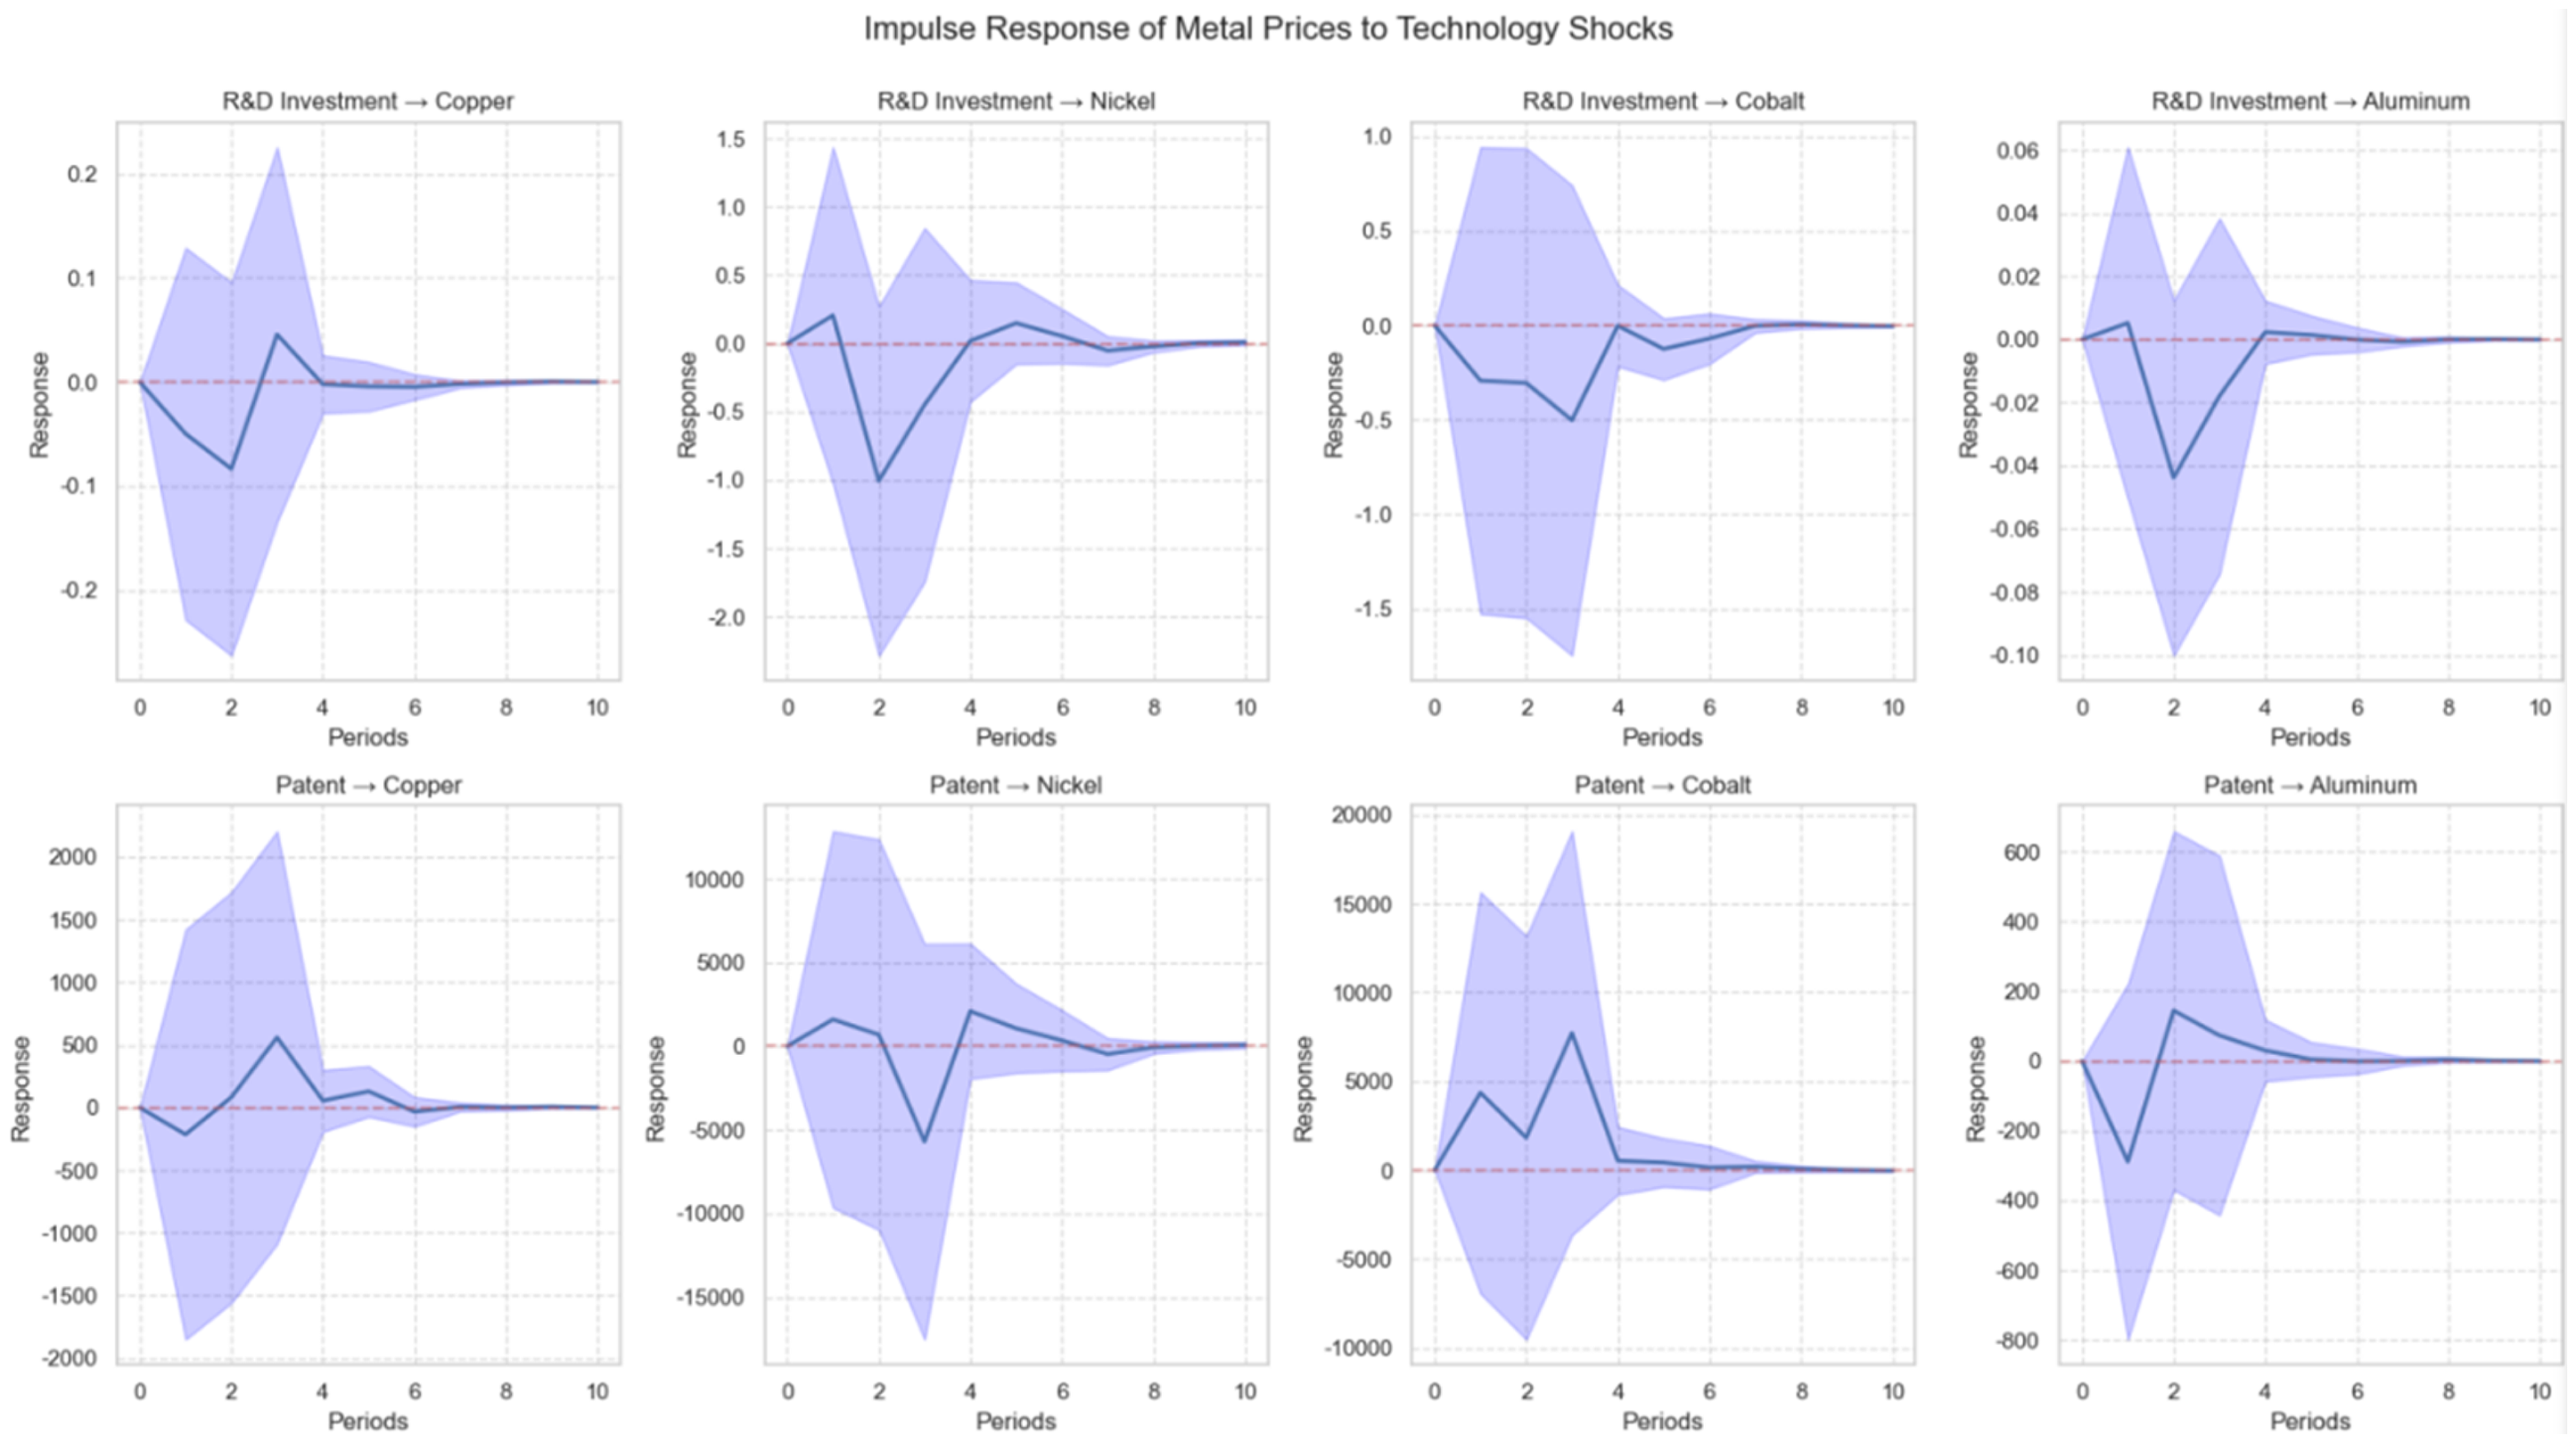
Impulse response images of technology shocks on metal prices.
The transmission of cleantech investment shocks is characterized by a “short-term surge and long-term convergence.” The impact on copper prices reaches a negative peak of −0.06 in the third period and then gradually rebounds toward zero, which is related to the rigid demand for copper in grid renovation. Short-term investment fluctuations may trigger concerns about overcapacity, but the long-term demand for grid upgrades sustains the price correction. The impact on aluminum prices, on the other hand, is relatively muted, peaking at only 0.1, as aluminum's application in PV modules is technologically mature and demand is less sensitive to investment fluctuations, echoing the low skewness of aluminum prices (−0.8042) in Table 6.
Robustness test
By simulating the impact of policy shocks on the metal market, three-dimensional visualization results of variance decomposition (FEVD) and residual stability are developed to verify the model's robustness under different shock transmission paths. First, the variance decomposition data (FEVD) shows the contribution of policy shocks to metal price volatility over the 1–12 month forecast period, with nickel's contribution rising from 35% to 55% and aluminum's increasing from 5% to 10%. Both are combined with stochastic perturbations to simulate real-world uncertainty. Second, the residual stability data indicate the standard deviation of the model's fitting error with 1–4 order lags. Copper stabilizes around 0.019–0.022, and cobalt stabilizes between 0.019 and 0.022, with cobalt's stability range being 0.023–0.026, reflecting the consistency in the model's fitting accuracy.
As shown in Figure 9, the FEVD chart of nickel in the upper-left corner indicates that the contribution of policy shocks to nickel price volatility exhibits a steady upward trend as the forecast period extends. The volatility remains within the range of 30%-60%, and the smooth curvature suggests there are no significant sudden changes in long-term effects. The FEVD chart of aluminum in the upper-right corner indicates that the contribution is low, although stable, confirming that aluminum markets exhibit consistent low sensitivity to policy shocks. The standard deviation of the residuals for copper in the lower-left corner indicates that the error term does not fluctuate drastically across different lag orders, confirming the model's stable fit to copper prices. Similarly, the residuals for cobalt in the lower-right corner show low volatility, suggesting that high volatility in the cobalt market does not introduce systematic bias into the model's residuals.
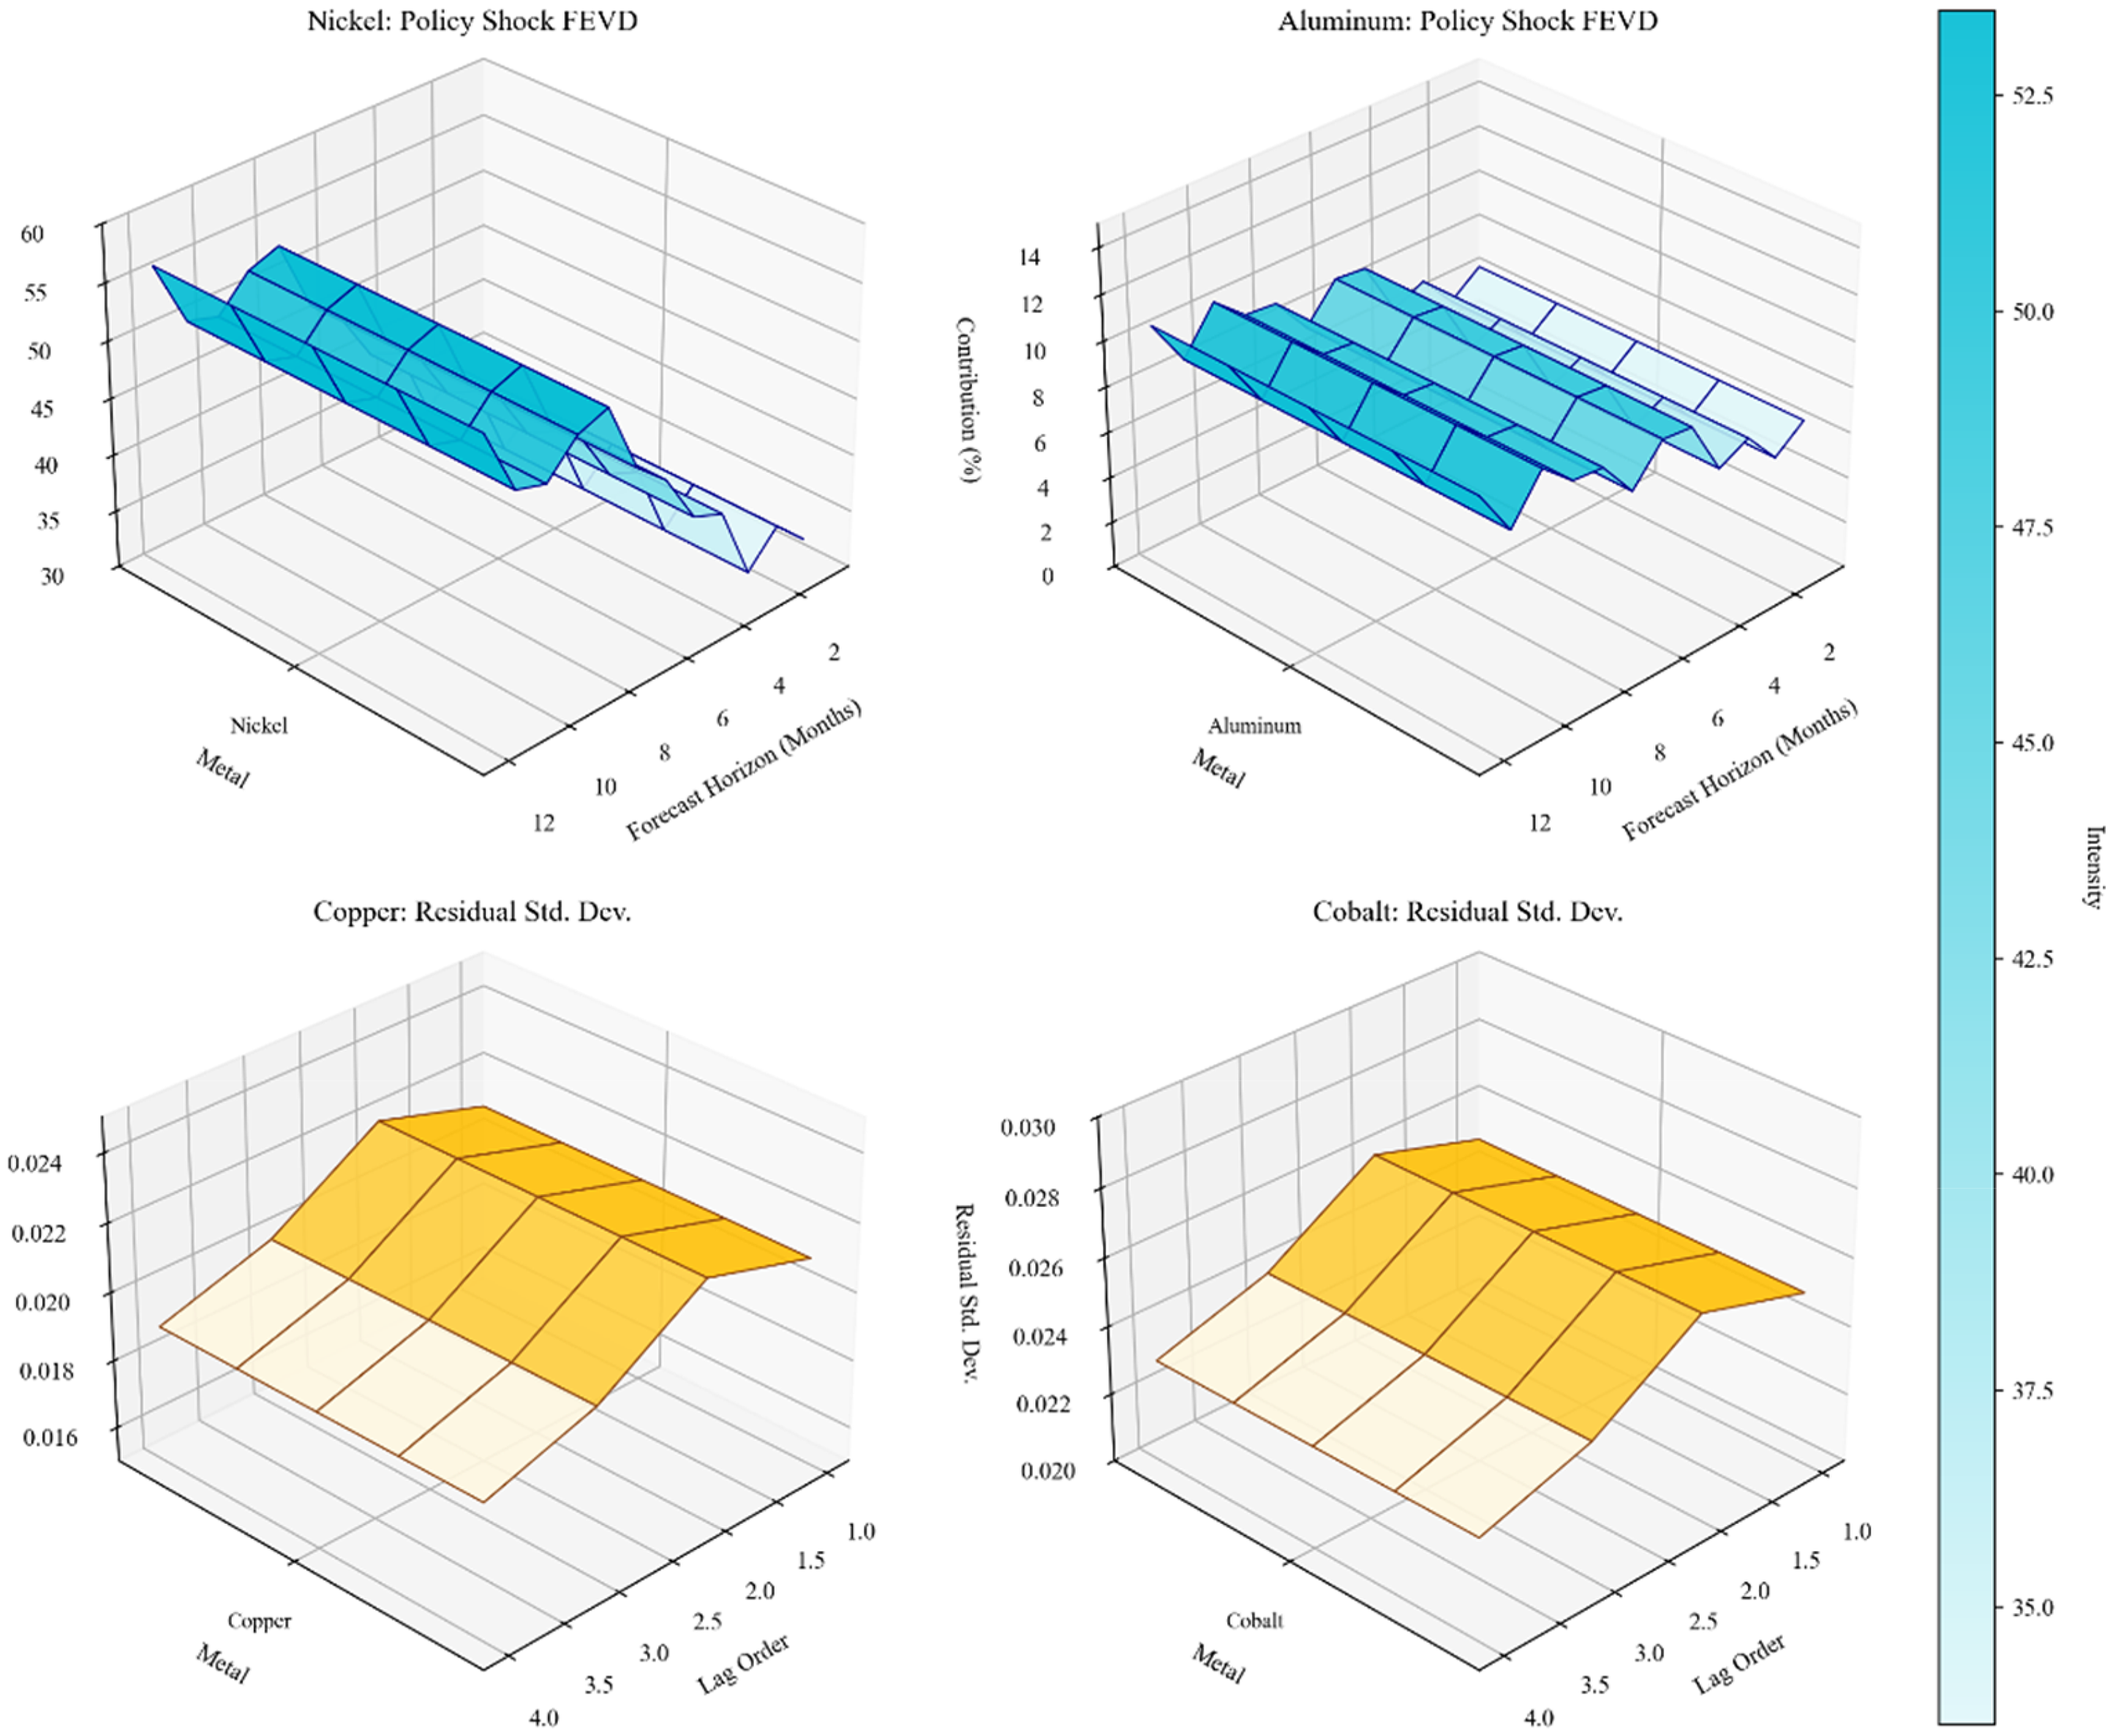
Results of robustness testing.
The results indicate that the model is robust in analyzing the impact of policy shocks on metal markets. The variance decomposition results show that the contribution of policy shocks to different metals (nickel > cobalt > copper > aluminum) aligns with the strategic position of these metals in clean energy technology (nickel and cobalt are key materials for batteries, while aluminum and copper have lower demand elasticity), and this trend remains stable over the period. The residual stability data demonstrate that, regardless of lag order adjustments, the model fitting errors stay within a narrow range without abnormal fluctuations, which is consistent with the model's design logic. This finding aligns with the model's underlying assumptions.
Discussion
Intertemporal effects of technology shocks
Most current studies on the impact of technology shocks from the energy transition on the metal market focus on a single technology pathway or changes in the demand for a single metal. McNulty and Jowitt 1 highlight a single influence of technological advances on demand for metals. The study by Månberger and Stenqvist 25 attempts to analyze metal demand from a multi-technology pathway perspective; however, it fails to account for the time lag involved in technology diffusion due to its static model. Ali et al. 26 focus on short-term demand shocks while neglecting the long-term effects of technological innovation when analyzing China's clean energy policy.
The innovation of this paper is the development of a dynamic analytical framework that moves beyond the static view of existing studies. By introducing the TVP-SVAR-SV model, it can simultaneously analyze the differing impacts of short-term technological breakthroughs and long-term technological evolution on the metal market. Song et al. 27 noted that there is heterogeneity in how technological innovations are transmitted across different segments of the industrial chain, and this paper further highlights specific examples of such heterogeneity in key metals, including aluminum, copper, cobalt, and nickel. Through dynamic impulse response analysis, the time lag effect of technological shocks is demonstrated, showing that the influence of technological innovation on the metal market is often delayed rather than immediate, gradually becoming apparent as technology is adopted and applied.
Policy-driven nonlinear transmission mechanisms
In studies of energy transition, numerous literature sources, such as Zhang and Wei, 28 focus on policy-driven technological development of clean energy, emphasizing the impacts of policies like carbon taxes and subsidies on the demand for metals. However, these studies tend to analyze policies as a single factor. In terms of research methodology, most of them adopt static models, and the carbon pricing analysis by Kaufman et al. 17 fails to capture the time-varying characteristics of policy effects. Meanwhile, the assessment framework is narrow, with scholars such as He et al. 18 primarily focusing on the impact of policies on the supply-demand balance, while ignoring market volatility caused by policy uncertainty.
Addressing the limitations of previous studies on policy shocks in energy transition, this paper overcomes the constraints of traditional static analysis by developing a time-varying parameter (TVP-SVAR-SV) model with policy dummy variables. This approach further uncovers the pathways and decay patterns of policy shocks through dynamic impulse response analysis. Based on these findings, the study reveals the interaction between policy effects and technological progress, offering a new perspective on the policy time lag.
Conclusions and implications
Conclusions
Based on resource dependence theory and innovation diffusion theory, this paper utilizes supply and demand data for China's key metals—aluminum, copper, cobalt, and nickel—as well as global prices, from 2018 to 2025. By combining the TVP-SVAR-SV model with the GARCH model, it decomposes energy transition shocks into demand shocks, supply shocks, risk shocks, technology shocks, and policy shocks. This approach systematically analyzes the dynamic effects of various shocks on the metal market and their time-lag effects. The study finds that the influence of energy transition on the metal market displays significant cross-cycle differences and nonlinear characteristics. Specifically, demand shocks have the most immediate impact on prices, while supply shocks and risk shocks increase market volatility. Conversely, technological and policy shocks produce long-term, gradual effects.
Demand shocks in China's key metal markets show notable differences, with cobalt exhibiting the strongest response. Empirical results indicate that during the accelerated energy transition period (2020–2023), the cumulative impact of cobalt demand shocks on prices peaks at 0.52 in the third month, significantly higher than aluminum (0.21) and copper (0.16). This is directly related to China's power battery industry chain expanding at a rate of 45% per year. China's cobalt consumption accounts for 42% of global consumption, and its demand volatility is quickly transmitted to the international market through trade networks, resulting in short-term price spikes. However, the effect of demand shocks diminishes by 38% after six months, implying that global mines are gradually adjusting capacity to meet demand growth. During the transition period, the magnitude of the demand shock response decreases to 62% of its value during the acceleration phase. Additionally, the response time for aluminum extends to five months, aligning with the slowdown in China's photovoltaic (PV) installation growth.
China's key metals supply system faces serious challenges, with the cobalt supply chain particularly vulnerable. Research shows that China's cobalt supply shock has a negative extreme of −0.54 in month 2, causing the global cobalt price to respond with a value of 2.56 in month 4, which is close to the statistical maximum of 2.596. This occurs because China's cobalt processing capacity accounts for 70% of the world's industrial output, and a 10% disruption in raw material supply from the DRC results in a 7% decline in China's refined cobalt production, which is further amplified by global market volatility through the price index. In contrast, the supply shock response for aluminum is only 0.37, as the localization rate of its industrial chain is as high as 80%. This high localization rate, autonomy, and control over the supply chain significantly reduce the impact of external shocks. During the adjustment period, the average value of the price response to supply shocks dropped to 0.008, and the transmission efficiency of supply fluctuations on prices decreased by 60%.
Risk shocks worsen short-term volatility in China's key metals markets, driven by geopolitical and speculative activities, with cobalt and nickel being especially sensitive. Empirical analysis reveals that geopolitical risk contributed to cobalt price volatility, reaching a peak of 0.853 during the acceleration period, which is 2.3 times higher than that of aluminum. This difference is closely related to China's high reliance on the DRC for cobalt imports (78%), while diverse sources of bauxite imports help buffer against risk shocks. The GARCH model results for speculative risk indicate a volatility mean of 0.0158 and a kurtosis of 5.2345, suggesting that speculative activity has a strong influence on cobalt prices. The 2022 LME nickel price forcing event further confirms the role of market speculation in extreme price swings. During the adjustment, the price response to risk shocks decreased to 0.32, as China's promotion of the “One Belt, One Road” initiative led to a decrease in import source concentration and significantly improved the market's ability to hedge risks.
The impact of technology shocks has a significant time lag, and the effect of different technology paths on China's key metal demand varies considerably. Impulse response analysis reveals that the short-term response of renewable energy patents to cobalt prices peaked at 600 and then gradually declined, whereas nickel prices exhibited a stepwise increase, with a cumulative response of 2000 by the 10th period. This suggests that breakthroughs in power battery technology instantly boost cobalt demand, while the long-term adoption of high-energy-density batteries continues to drive up nickel demand. The short-term impact of cleantech investment on copper prices peaks negatively at −0.06 but stabilizes over time. Aluminium prices respond relatively mildly to technology shocks, reaching only a peak of 0.1, since aluminum's use in photovoltaic modules is technologically mature and demand is less sensitive to investment fluctuations.
The response of China's key metals market to policy shocks is characterized by asymmetry. Using the 2019 Indonesian nickel ore export ban as an example, the short-term impact of the policy shock on nickel prices reaches 0.105, while aluminum prices respond negatively at −0.052. This difference arises because China's nickel imports are heavily reliant on Indonesia (83% of total), whereas the aluminum industry has a high level of independence (80%). In the medium term, the nickel price response diminishes to 0.033, indicating that the ferronickel substitution process (with an 18% substitution rate in 2023) gradually alleviates supply pressures. The variance decomposition of policy shocks (FEVD) further confirms that its influence on nickel price volatility increases from 35% to 55%, while its effect on aluminum prices remains only between 5% and 10%.
Implications
First, China should enhance the top-level design of the key metal supply chain by integrating energy storage technology innovation, alternative material R&D, and recycling technology into national science and technology priorities, as well as establishing a dynamic reserve mechanism to address short-term price fluctuations. On the international stage, it can strengthen long-term cooperation with resource-rich countries through the Belt and Road Initiative and promote the creation of a multilateral mineral data-sharing platform to enhance the transparency of the global supply chain.
Second, Chinese enterprises need to accelerate their digital transformation of the supply chain, utilizing blockchain and other technologies to achieve raw material traceability and intelligent inventory management. They should also collaborate with financial institutions to develop metal futures derivatives and enhance the price risk hedging system. At the same time, they should increase cooperation with scientific research institutions, focusing on overcoming key technological challenges such as the efficient recycling of used batteries.
Thirdly, the international community should establish a coordination mechanism for early warning of key metals and develop stable trade rules by major consuming and resource countries to prevent significant market disruptions caused by unilateral export restrictions. Additionally, a dedicated fund could be created within the framework of the G20 and other organizations to help developing countries enhance their technological capacity for metal recycling and clean smelting.
Although this study offers a thorough analysis of the multidimensional impacts of the energy transition on China's key metals market, some limitations remain. First, the quantitative analysis of technology substitution paths is still lacking, particularly in the need for a more detailed model of how different battery technology routes impact metal demand. Additionally, while the study highlights the asymmetric effects of policy shocks, it does not sufficiently explore the long-term impacts of the synergistic effects of the carbon market, green subsidies, and other policy tools. These areas could be improved by incorporating a more comprehensive simulation of future policy scenarios.
Footnotes

Funding
National Natural Science Foundation of China (72473105).
Conflict of interest statement
The authors report that there are no competing interests to declare.
Data availability statement
The data are available from the corresponding author on reasonable request.