
Abstract
With an increased population, resource depletion, energy consumption, and carbon emissions have tended to increase manifold. Thus, it is an imperative concern all over the globe. However, targeting BRICS (Brazil, Russia, India, China, and South Africa) nations entails static significance as BRICS are not only the developed economies yet those economies that generate major share of the global emissions. Therefore, the current study delves into the interconnectedness among CO2 emissions, greenhouse gas emissions, urbanization, fossil fuel energy consumption, foreign direct investment, and energy usage within the BRICS economies. The increased urbanization which is a result of increased population and globalization incurs imperative influences on carbon emissions. Besides, the greenhouses have been renowned as leading channel that generates carbon emissions. Therefore, their long-run cointegration along with their dynamic contribution needs to be analyzed comparatively. This research uses the time series data from 1990 to 2024. The literature mainly focuses on the combined cointegration of these forces for BRICS nations. Conversely, this study also entails a panel estimation for these nations in order to analyze the magnitude contribution of the considered variables. For statistical analysis employing the autoregressive distributed lagged (ARDL) bounds testing, panel quantile regression, and the Dumitrescu and Hurlin causality testing approaches, we scrutinize the long-term causal relationships between all variables. The empirical findings reveal the existence of long-term equilibrium cointegration among the variables. In essence, our study concludes that in the case of BRICS economies, the level of CO2 emissions is significantly influenced by urbanization and greenhouse gas emissions.
Introduction
Energy is an imperative component of a nation's development. A large share of economic activities depends on energy, such as most of the manufacturing industries can’t proceed without energy. However, a substantial increase in energy consumption levels diverts an economy's attention toward two utmost concerns. A rise in energy-consuming activities results in resource depletion (mainly oil) and global warming (greenhouse gases that, in turn, resulting in the Ozone depletion). An increase in CO2 emissions not only influences biophysical ecosystems but also human society and economic activities. It was labeled as a “Super wicked Problem.” Therefore, there is a need to initialize such methods and policies that incur low CO2 emissions. Many researchers present the usage of renewable energy consumption for reducing carbon emissions levels.1,2
When we consider CO2 emissions, there is a crucial point that is BRICS (Brazilian, Russian, Indian, China, and South African) economies. BRICS economies have been regarded as the rapidly growing nations, since from the past few decades which had have a sizeable influence all over the globe. In the phase of the 2008 financial crisis, when global economic growth was slowed abruptly, BRICS economies had high potential economic growth. All five economies possess many common characteristics. BRICS economies are industrialized economies, referred to as the five major emerging market economies globally. The total land area possessed by “BRIC” is 26% of the global total land territory and their population is 42% of the global total population. The international influence of these four economies is also rising day by day. 2
However, targeting BRICS nations entails static significance as BRICS are not only developed economies but also those economies that generate major share of the global emissions. Therefore, the current study delves into the interconnectedness among CO2 emissions, greenhouse gas emissions, urbanization, fossil fuel energy consumption, foreign direct investment, and energy usage within the BRICS economies. Following the World Bank (WB) 2018 report, the GDP (in billion US) of BRICS economies accounts for 23.3% of the World's total GDP. Trade exports (in billion US dollars) of BRICS economies account for 18% and FDI inflow accounts for 16.5% of the World's total. According to WB 3 statistics, from 2008 to 2018, BRICS economies share in the World's economic growth accounts for 51.3% of the total. Along with rapid development and growth BRICS economies incur high levels of CO2 emissions. BRICS economies account for 40% of the World's energy consumption and significantly contribute to global environmental degradation.3,4
With an increased population, resource depletion, energy consumption, and carbon emissions have tended to increase manifold. Thus, it is an imperative concern not only for developing but also for the developed ones. The increased urbanization which is a result of increased population and globalization, incurs imperative influences on carbon emissions. Besides, the greenhouses have been renowned as a leading channel that generates carbon emissions. Therefore, their long-run cointegration along with their dynamic contribution, needs to be analyzed comparatively. As like previously done research, this paper aims to explain energy consumption and its impact in the form of carbon emissions. Additionally, it also explains a cross-country comparison or an individual-state analysis for each economy of the BRICS group.5,6
The literature mainly focuses on the combined cointegration of these forces for BRICS nations. Although little attention has been focused on the heterogeneity analysis or the comparative analysis of BRICS nations, individually.7–9 Conversely, this study also entails a panel estimation for these nations in order to analyze the magnitude contribution of the considered variables. The empirical model of this research has been generated by clearly considering available literature and their used variables. This article enriches the scientific community by signifying the importance of addressing CO2 emissions in developed economies (such as BRICS). A comparative analysis of each economy has been displayed to highlight the major contributors to carbon emissions in BRICS.
Besides, this article integrates that urbanization and greenhouse gases are the two leading contributors to carbon emissions in BRICS economies, which need to be considered while forming environmental quality regulations and policies. Most of the research just checked energy consumption and its influence on BRICS economies’ growth and environment. Although few studies included Urbanization and FDI influence, in this regard. Therefore, we aimed to cover them in our model as well. Additionally, to explain the recent trend, we tried to cover the least possible and recent data coverage, such as data gathered from 1970 to 2024.
The current study was aimed at the following objectives:
To scrutinize the empirical significance of greenhouse gas emissions in determining carbon emissions of BRICS economies; To evaluate the comparative analysis of BRICS nations by decoupling them into aggregate (panel) and disaggregate integration (time series); Elucidate the influence of urbanization in promoting carbon emissions in BRICS economies; To illustrate the statistical difference between greenhouse gases and the overall energy consumption in distorting CO2 statistics; And to integrate the interconnectedness between CO2 emissions, urbanization, and energy consumption.
This research highlights the empirical significance of CO2 neutrality policies and their achievement in the context of BRICS economies. Despite being developed economies, BRICS economies primarily encounter the issue of increased carbon emissions. This research highlights two static contributors to this increasing CO2 trend, which are “urbanization” and “greenhouse gas emissions.” In light of the calculated results, both contributors confirmed their empirical significance in BRICS. And thus, urbanization and greenhouse gases are labeled as the “twin-wicked problem” of BRICS economies. This conclusion holds for both aggregate and disaggregate analysis.
Furthermore, the impact of greenhouse gas emissions, urbanization, and fossil fuel consumption on carbon emissions is also deliberated in this research. This research has been organized in an organized manner. Firstly, a brief introduction about CO2 emissions and BRICS economies is provided. Secondly, literature that considers BRICS economies and CO2 emissions is documented. The third statistical model and methodological approach followed in this research was exhibited. In the end, the results, discussion, and conclusion gained from this research are documented.
Review of related literature
Sebri and Ben-Salha 10 augmented the causal dynamics amid CO2 emissions, economic growth, trade openness, and energy consumption. For empirical evidence, researchers selected BRICS economies over the period from 1971 to 2010. Granger causality results confirm the bidirectional association between renewable energy consumption and economic growth. The vector error correlation model (VECM) confirmed that the consumption of renewable energy stimulates economic growth in the case of BRICS economies. Tugcu, Ozturk, and Aslan 11 confirmed the existence of a statistically significant relationship between CO2 emissions and economic growth.
Antonakakis et al. 12 examined the ethical dilemma between energy consumption, economic growth, and CO2 emission. This research considers 106 countries belonging to different income groups. The panel VAR model was utilized over the time period 1971 to 2011. After empirical examination, bidirectional causality between energy consumption and economic growth is declared. Research proved the negative moral dilemma that a high growth rate is linked with the unsustainable situation of the environment and low growth with a sustainable environment situation. Yang and Zhao 13 and Jammazi and Aloui 4 examined the interplay between CO2 emissions, economic growth, and energy consumption. Their results confirmed a statistically significant correlation between the examined variables.
Dong et al. 14 documented the role of renewable energy consumption and natural gas in determining CO2 emissions. The main objective of this research is to check whether renewable energy consumption and natural gas usage incur low CO2 emissions or not. For estimation, researchers gathered panel data on BRICS economies. This research utilized the per capita CO2 emissions, GDP, renewable energy consumption, and natural gas as research variables. Results confirmed that the environmental Kuznets curve holds for the case of BRICS economies. Wang et al. 15 determined the role of structural change, scale change, and technological change in reducing CO2 emissions. For empiric estimation research, considered nonmetallic sector was considered (as the nonmetallic sector produces high levels of CO2 emissions globally) was selected. Data from eleven major countries from 1995 to 2009 were collected. Researchers first highlighted key drivers of CO2 emissions in G7 and in BRICS, then evaluated low-carbon (CO2 emission) development for the nonmetallic segment by using the TOPSIS model. Zhang and Wang 16 documented the influence of CO2 emissions and signified significant results.
Mi 1 and Inglesi-Lotz 17 decomposed the CO2 emissions in South Africa. This study examined the expected indication of the rebound effect and decomposed the CO2 emission in BRICS (by examining South Africa's economic data series over 2008–2014). Results confirmed the negative association between energy intensity/consumption and CO2 intensity. As energy intensity decreases (possible technological development), CO2 emission rises. Moreover, this negative association occurred in South Africa only from 2008 to 2014.
Dong et al. 18 empirically analyzed the association between CO2 emissions, population growth, economic growth, and renewable energy. Economic growth and population growth are positive, while renewable energy consumption negatively relates to CO2 emissions. However, causality estimates showed different causality associations between variables across the six examined regions. Paramatia et al. 19 discovered the role of renewable energy consumption in reducing CO2 emissions.
Mallick et al. 20 examined the skewed pattern of income distribution and also considered the case of environmental quality for the economies of BRICS. The researcher chooses the “quantile-on-quantile regression” (QQR) technique. Results disclosed that in the case of Brazil and India, as income level rises, both poor and rich people tend to influence the environment (increase CO2 emissions). In the case of South Africa and China rich tend to cause environmental degradation as compared to the poor. Lange and Ziegler 21 determined the influence of CO2 emissions on the economic growth of an entity. Farha Fatema and Islam 22 highlighted the relationship between technology-intensive trade, CO2 emissions, and economic growth in BRICS economies. The technique utilized by the researcher was the ARDL bound testing approach. Empirical estimation confirmed long-term causality between the examined variables. Balsalobre-Lorente et al. 23 integrated a quantitative approach for examining CO2 emissions in BRICS economies.
Liu et al. 2 explored the role of real output (GDP) and renewable energy in determining CO2 emissions for BRICS economies. Results displayed long-term affiliation between the examined variables. Destek and Sarkodie 24 and Wang et al. 25 argued about CO2 emissions in BRICS economies. Adedoyin et al. 26 discovered the relationship between coal rent, CO2 emissions, and economic growth. Researchers also considered the regulatory quality (law and order situation) in selected BRICS countries. Shahbaz and Sinha 27 exhibited the CO2 emissions environmental Kuznets curve and also developed the role of globalization in determining CO2 emissions.
Wang et al. 5 examined the cointegration between globalization, economic growth, and Urbanization as imperative drivers for the sustainable management of resources. For the empirical study, BRICS economies have been targeted from 1985 to 2020. And for statistical analysis, two-stage least squares (2-SLS) was employed. Results confirmed long-run association between the examined variables. They also proved the empirical significance of the pollution haven hypothesis. Similarly, Qing et al. 28 and Kartal et al. 29 also signified the long-run association between energy consumption, carbon emissions, and economic growth.
Xu et al. 30 highlighted the load-capacity factor specifically for Brazilian economy. Their findings signified the utilization of renewable energy for mitigating environmental degradation. Similarly, Yang et al. 7 signified the load-capacity forces of carbon emissions. For empirical examination, BRICS nations have been analyzed from 1990 to 2018. Estimates delineated that GDP growth, globalization, and energy usage adversely affect the load-capacity force in BRICS and to mitigate these emissions, hydrocarbon energy must be utilized.
Ojekemi et al. 31 demonstrated the active contribution of financial risk, renewable energy usage, and economic risk on the load capacity of BRICS. The FMOLS, fixed effect, and the quantile regression method of moments (QRMM) results disclosed that economic risk and financial risk along with renewable energy usage influence load capacity in BRICS. Kartal et al. 6 explained the stringency of environmental policies and energy transition in determining ecological footprint of BRICS nations. Their study signified the usage of renewable energy resources (energy transition) in order to improve the ecological footprint of BRICS economies. A stimulating marginal effect of economic growth has been witnessed for all economies, except for Brazil.
Dauda et al. 32 examined the impact of innovation and economic growth on CO2 emissions for various economies. Eighteen developed and developing examined from 1990 to 2016. Results showed that innovation reduces CO2 emissions in G7 but increases in the case of MENA & BRICS economies. Fernández et al. 33 and Liobikienė and Butkus 34 considered the role of innovation and R&D in influencing the relationship between CO2 emissions and economic growth. Estimates of these studies affirm significant results. Zhang and Wang 35 discovered the role of service sector development and renewable energy consumption in determining CO2 emissions for BRICS economies. Results exhibited that service sector development did not lead to low CO2 emissions in BRICS economies from 1996 to 2017. Ummalla and Samal 36 and Zhou and Li 37 argued that renewable energy significantly reduces CO2 emissions. He et al. 38 explored the association between trade, CO2 emissions, and FDI by using the ARDL bound testing approach. For estimation, researchers consider the experience of BRICS economies. Huang et al. 39 integrated the affiliation between FDI, foreign trade, and CO2 emissions. Results confirmed cointegration between the examined variables.
Wen et al. 8 explained the long-run cointegration between CO2 emissions and coal consumption for BRICS nations. The empirical findings signified that there exist both positive as well as negative influences of coal consumption on carbon emissions for different economies. Additionally, economic output per capita significantly determines carbon emissions for selected economies. Magazzino and Mele 9 incorporated machine learning methodology for exploring the integration between carbon emissions, energy usage, and economic growth. A time series of data for the Russian economy has been studied during 1970 to 2017. Findings postulated that with sustained economic growth carbon emissions can be reduced, in quality terminology.
Jama and Abdi 40 scrutinized the cointegration between environmental sustainability, energy usage, urbanization, and FDI in case of Somalia. By covering the time span of 1991 to 2020, an ARDL methodology has been applied. As is familiar with BRICS economies, urbanization, FDI, and energy usage significantly influence carbon emissions in Somalian economy. This affirmed the empirical significance of urbanization in determining carbon emissions not only for BRICS but also for other economies as well. Dutta and Hazarika 41 exhibited the interconnectedness between carbon emissions and the urbanization level by analyzing panel estimation for selected 68 lower-income (LC) and low-middle-income (LMC) economies. Similarly, urbanization has been introduced as a key promoter for CO2 emissions in all targeted nations. However, FDI reflects varying effects across selected regions.
Hao et al. 42 documented soil moisture control in context of greenhouse gas emissions and carbon sequestration. In this regard, a “peak-&-decline” carbon emissions pattern has been observed in this research. Conversely, sustainable soil management policies can significantly assist in sequestration of carbon emissions. Ahmed et al. 43 explicated the attainment of sustainable environmental related goals and carbon neutrality. In this regard, influence of greenhouse gases, solar energy, and government stability has also been analyzed. The obtained statistics of QRMM affirmed the destructive contribution of the usage of greenhouse gases and fossil fuels which in turn significantly hinder the attainment of carbon neutrality. This result is consistent with the BRICS economies.
Research gap
The above-displayed literature examination shows that BRICS economies significantly contribute to global carbon emissions thus, there is a need to investigate BRICS nations to overcome the challenges of increased environmental degradation.8,35 Although little attention has been focused on the heterogeneity analysis or the comparative analysis of BRICS nations, individually.7–9 Conversely, this study also entails a panel estimation for these nations in order to analyze the magnitude contribution of the considered variables.2,40 The empirical model of this research has been generated by clearly considering available literature and their used variables. Conversely, in literature, little work has been done about increased urbanization and greenhouse gas emissions. Therefore, this research also aims to elucidate the nexus between urbanization, greenhouse gas emissions, and carbon emissions. Similarly, the role of trade openness (or FDI) has also been signified by the researchers which was also considered in this research, as well.38,39
Conceptual framework
In literature, a vast list of theories concerning urbanization, environmental degradation, and greenhouse gases has been displayed. With time, these bundles increased manifold and the proposed theories have been advanced to the next level. Out of these theories, three primitive base theories encompass the “environmental Kuznets curve,” “load-capacity factor,” and the “twin city Gap.” The environmental Kuznets curve suggests that with increased economic development there is an increase in environmental degradation which is attributed to increased consumption of available resources. However, after a specified threshold level, environmental deterioration tends to decrease with increased economic development. This declining trend in some research has been attributed to technological innovation and environmental regulations. This theory has also been attributed to the inverted U-shape hypothesis.24,27
Similarly, the load-capacity factor (LCF) theory deliberates the conceptual flow concerning the attainment of environmental sustainability in an economy. In this regard, key drivers of the load capacity that influence ecological footprints are addressed. In short, it entails the proxy drivers that reduce the regenerative or reproductive capacity of available resources in an economy. The increased human demand is the primitive driver highlighted fostering resource depletion and environmental degradation (or increased carbon emissions). Contrary to the Kuznets curve, LCF not only considers carbon emissions but is a broad conception that entails greenhouse gas emissions, ecological footprint, and energy transformation.7,30
Conversely, the twin city (rural–urban) gap theory demonstrates the interconnectedness between two different cities or areas that share social, economic, and geographical ties. This theory has also been renowned as rural–urban disparity in the literature. The key driver behind this gap expansion is labeled as urbanization. It postulates that both areas can gain benefits by bridging the gap between available facilities in these two regions. In sum, it highlights the potential gains of coordination and cooperation between two adjacent regions. 44 The primitive target of this research is to highlight the contribution of urbanization and greenhouse gas emissions in context of CO2 emissions in BRICS economies. This long run integration has been illustrated with the help of following conceptual framework graph (Figure 1).

Conceptual framework. Source: Researchers creation from MS Word.
Conversely, to scrutinize the contribution of urbanization and greenhouse gasses in each targeted nation, individually. This research modeling has been decoupled into two major analyses (Figure 2).
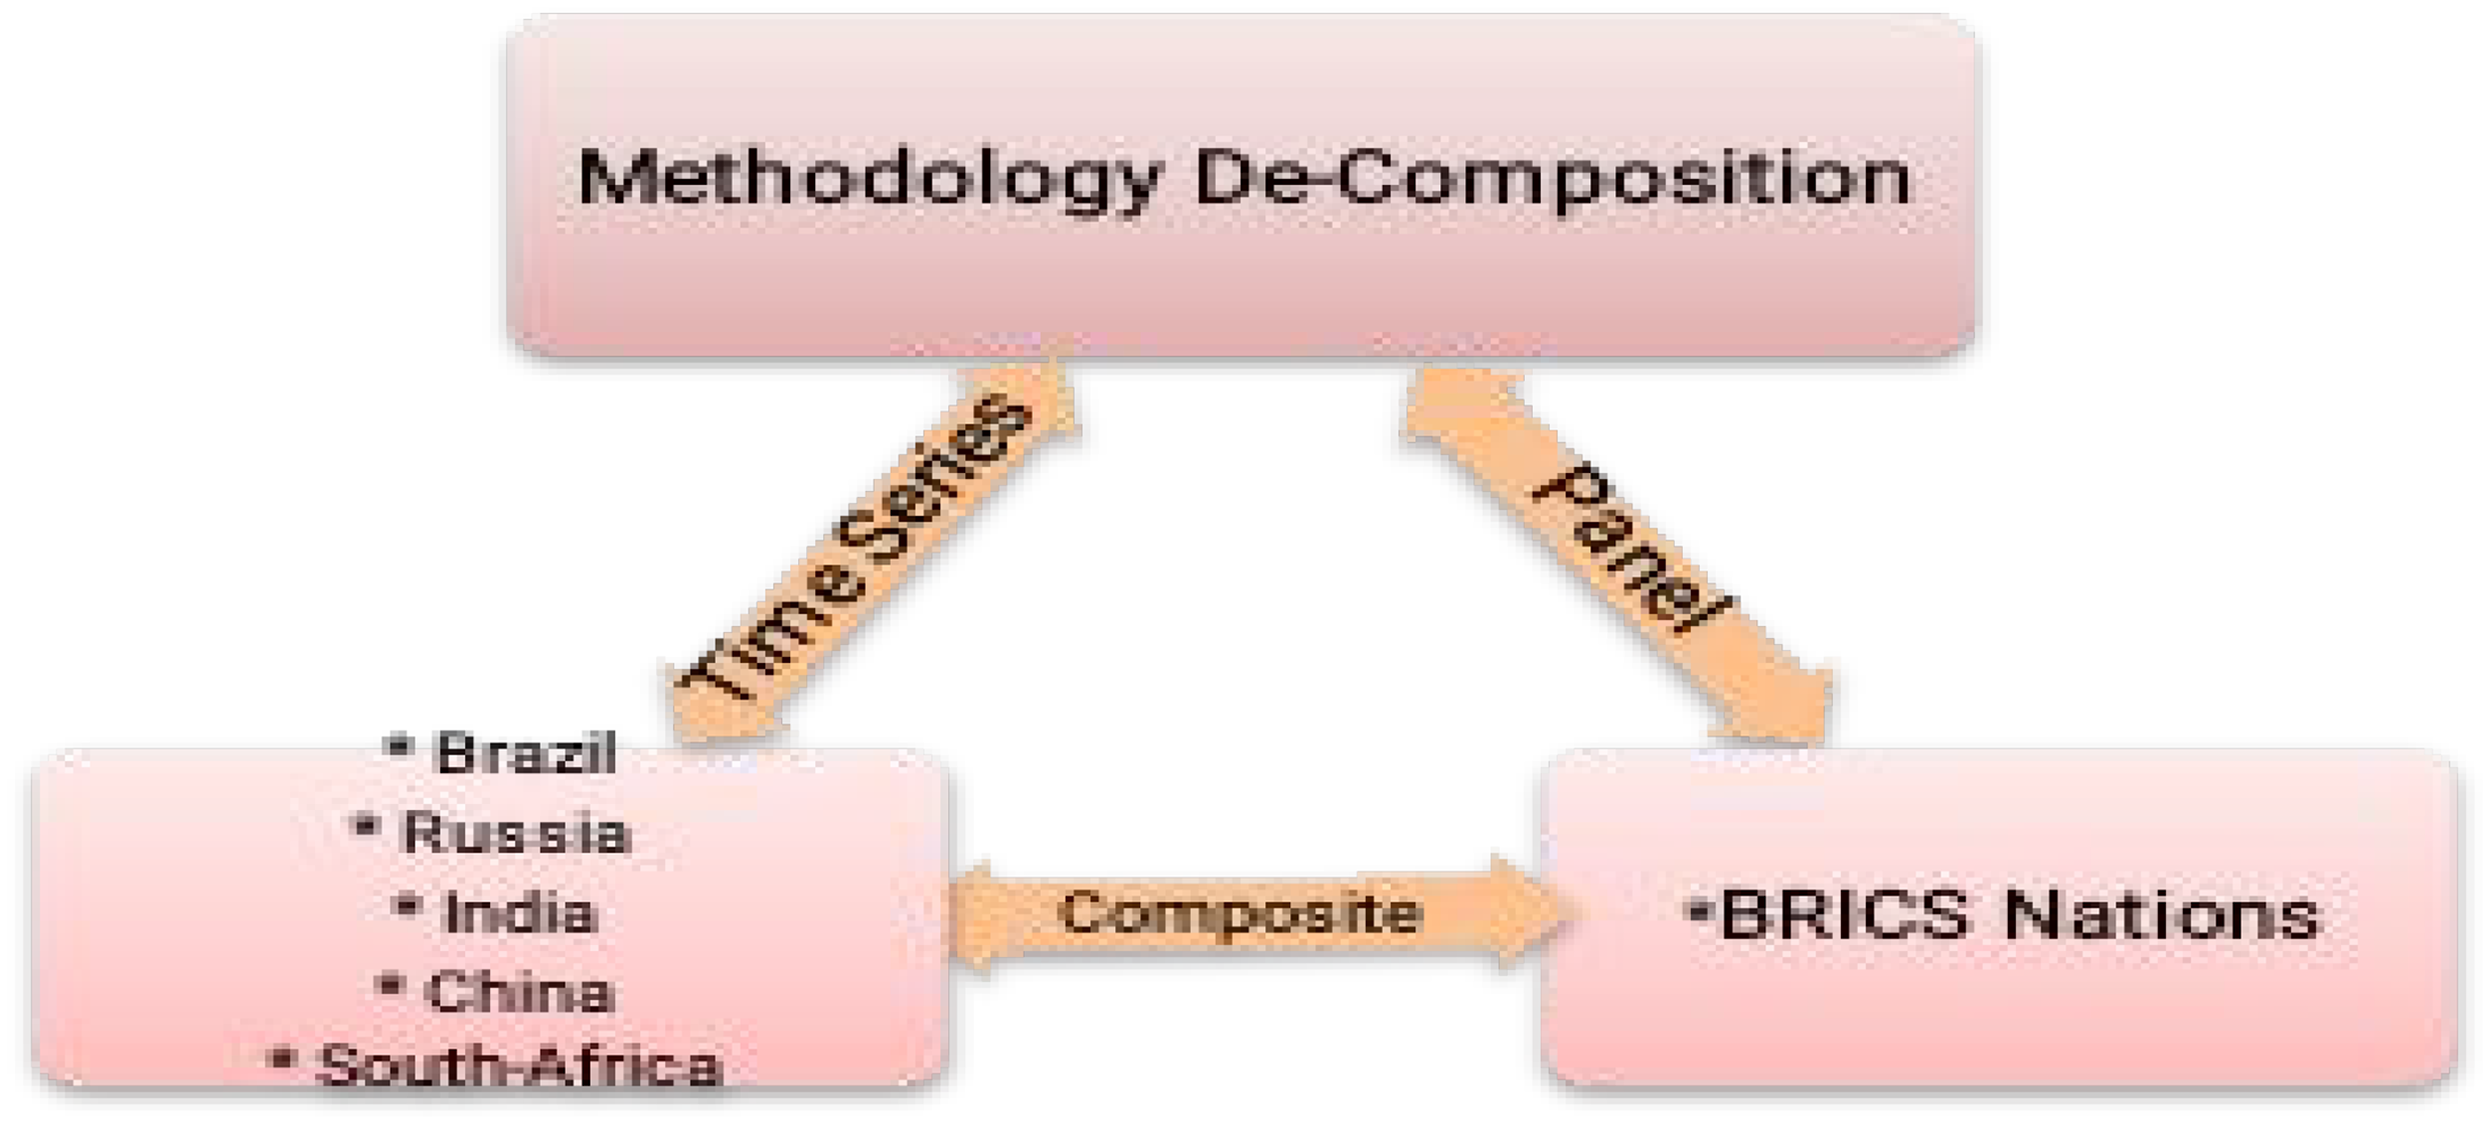
Methodology de-composition. Source: Researchers creation from MS Word.
This research aims to incorporate a mixed statistical methodology in its empirical examination. This methodology comprises time series analysis (disaggregate analysis) and panel series (Aggregate) analysis.
Research methodology
The primary objective of this research is to assess the relationship between CO2 emissions, urbanization, and greenhouse gas emissions. This section documents the methodology employed by the researcher. Time series data along with panel data, have been accumulated for the period of 1970 to 2024 for the BRICS economies. CO2 emissions (kt) serve as the dependent variable, while ENG, URB, LGRG, FDI, and FOSF are designated as the independent or explanatory variables in this study. Based on the data availability, the researcher chooses 1970 to 2024 as examined span period. Besides, in time series analysis, it is better to use a data set over 30 to 50 years to capture the series trend over time. Therefore, researchers use 1970–2024 as a period for analysis. All the data for these examined variables have been gathered from World Development Indicators, an online data portal. 45
Model specification
With an increased population, resource depletion, energy consumption, and carbon emissions have tended to increase manifold. Thus, it is an imperative concern not only for developing but also for the developed ones. The increased urbanization which is a result of increased population and globalization, incurs imperative influences on carbon emissions. Besides, the greenhouses have been renowned as leading channel that generates carbon emissions. Therefore their long-run cointegration along with their dynamic contribution, needs to be analyzed comparatively. As like previously done research, this article aims to explain energy consumption and its impact in the form of carbon emissions. Additionally, it also explains a cross-country comparison or an individual-state analysis for each economy of the BRICS group.
Besides, this article integrates that urbanization and greenhouse gases are the two leading contributors to carbon emissions in BRICS economies, which need to be considered while forming environmental quality regulations and policies.42,46,47 Most of the research just checked energy consumption and its influence on BRICS economies’ growth and environment. Although few studies included urbanization and FDI influence, in this regard.48–50 Therefore, we aimed to cover them in our model as well. Additionally, to explain the recent trend, we tried to cover the least possible and recent data coverage, such as data gathered from 1970 to 2024.
Literature proved that there's long term cointegration exists between CO2 emissions, greenhouse gas emissions, and urbanization. The examined model has been generated by clearly seeing available literature and their used variables, most of the research just checked energy consumption and its influence on the BRICS economy's growth and environment.
14
Although few studies included urbanization and FDI influence in this regard, we aimed to cover them in our model as well. In order to analyze the magnitude contribution of the considered variables, following panel model has been constructed. The empirical model of this research has been generated by clearly considering available literature and their used variables. Therefore, to check this statement statistically or to estimate this cointegration between the examined variables statistically researcher utilized the following econometric research model for the BRICS economies panel analysis:

This model explains the panel integration of this research. However, in literature, it was observed that researchers mainly focus on the combined cointegration of these forces (or panel analysis) for BRICS nations. Although little attention has been focused on the heterogeneity analysis or the comparative analysis of BRICS nations individually. Therefore, this study entails a heterogeneous or disaggregate analysis estimation for the selected nations, individually. This article enriches the scientific community by signifying the importance of addressing CO2 emissions in developed economies (such as BRICS). A comparative analysis of each economy has been displayed to highlight the major contributors to carbon emissions in BRICS. Conversely, the following models entail disaggregate analysis models for this research;

The following model illustrates the considered econometric research model for the case of Brazilian economy.

The following model illustrates the considered econometric research model for the case of Russian economy.

The following model illustrates the considered econometric research model for the case of Indian economy.

The following model illustrates the considered econometric research model for the case of Chinese economy.

The following model illustrates the considered econometric research model for the case of South African economy. All above detailed models have been formulated by considering the empirical methodologies of some previous studies namely Wang et al., 46 Donget al., 14 Liu et al. (2017), Abam et al., 48 and Tagala et al. 47
Here, abbreviations reflect:

Examined variables of the study. Source: Researchers generation using MS-Word.
The above-displayed model examined the role of greenhouse gas emissions (GHG), urbanization (URB), fossil fuel consumption (FOSF), foreign direct investment (FDI), and energy usage (ENG) in determining CO2 emissions for the case of BRICS economies.
Data collection
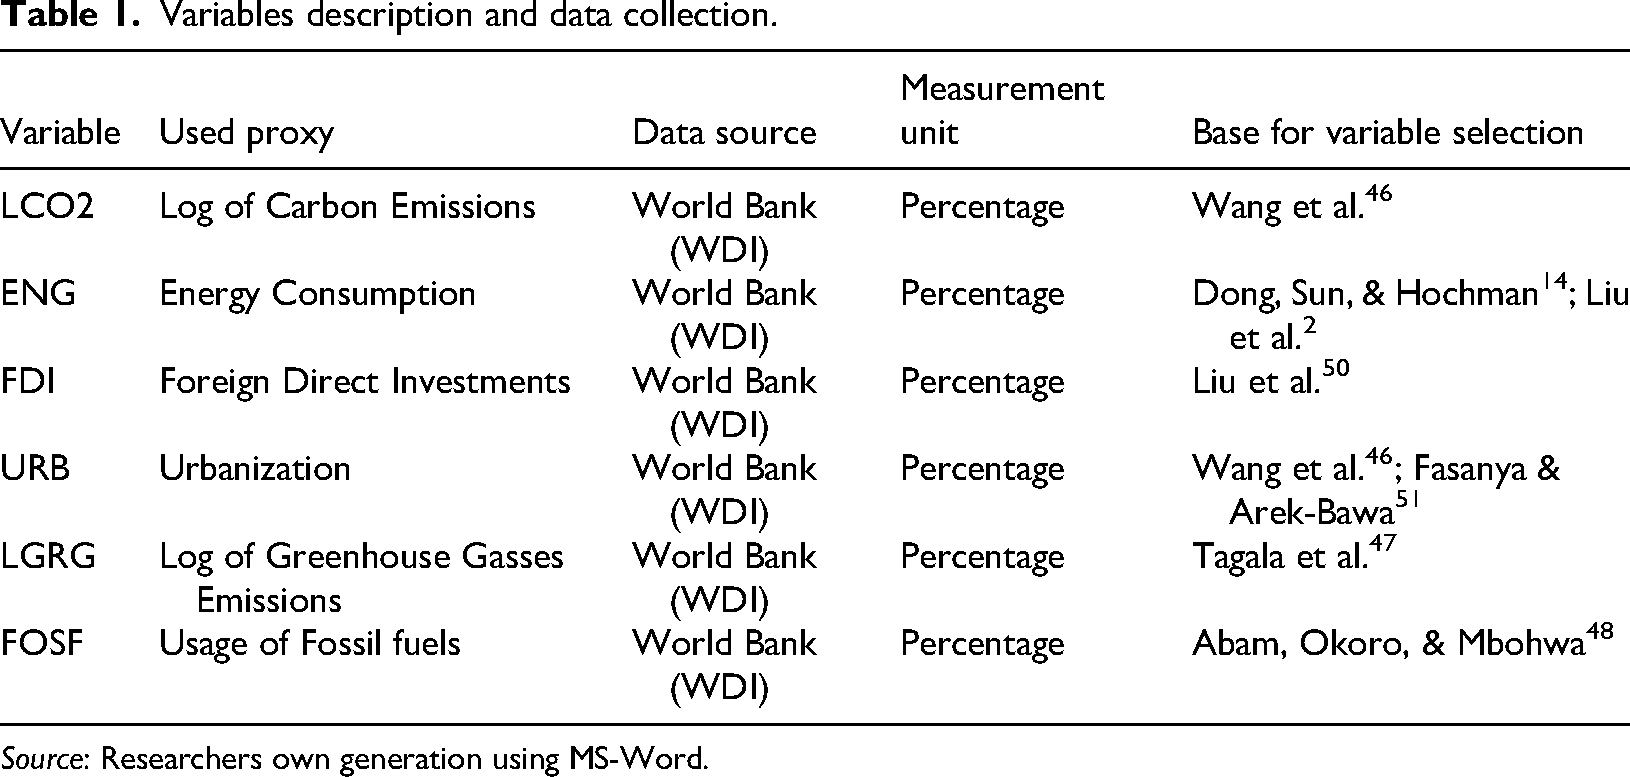
This research incorporates CO2 emissions as a dependent variable, while ENG, FDI, FOSF, URB, and LGRG are independent variables. Data for all variables have been collected throughout 1970 to 2024. Data for CO2 emissions in metric tons, energy use (kg of oil equivalent per capita), urban population growth (annual %), foreign direct investment inflows (% GDP share), energy consumption (total consumption of energy), fossil fuel consumption (% of total), and greenhouse gas emissions (kt of CO2 equivalent) are collected. The data for carbon emissions and greenhouse gases has been converted into percentages by taking log transformation. Furthermore, data for all variables have been collected from the World Development Indicators official website (Table 1).
Variables description and data collection.
Source: Researchers own generation using MS-Word.
Table 1 shows the abbreviations used in the modeling along with their full description. Besides, it highlights the data source for all examined data series which is World Bank (or World Development Indicators). Conversely, the unit of measurement for all examined variables is consistent which is in percentage units. A large number of studies examined the association between greenhouse gases, urbanization, and carbon emissions namely Wang et al. 46 and Tagala et al. 47 Although there is a conflict in the obtained statistics of urbanization.46,48,51 Therefore, this study integrates them in empirical estimation. Similarly, in literature, there is a mix of evidence for FDI effect.49,50 Conversely, recent literature disclosed a highly static mitigating effect of fossil fuel consumption by stating that mitigating fossil fuel consumption can lower the carbon emissions by 40%. 48 Based on these findings, our research models have been formulated.
Procedure of estimation
This section primarily focuses on the statistical tests utilized in this study, their interpretation, and the conclusions drawn from the estimation. The estimation procedure is divided into four major sections: individual analysis and panel analysis. Before this, the researcher presents descriptive statistics and then displays the correlation matrix. The third part examines short-run ARDL cointegration, followed by the exhibition of long-run cointegration. Bound testing and the CUSUM graphs exhibition. In the fourth section, panel quantile long-run regression analysis has been detailed along with the Histogram and the residual plotting.
Descriptive statistics
Descriptive statistics serve to replicate extensive data series in an organized and summarized manner. They provide a nuanced interpretation of the data and the sample, along with its measures. Descriptive statistics is an exercise aimed at presenting a quantifiable description in a comprehensible format. In any study, researchers may employ various measurement methods. However, descriptive statistics enable researchers to condense large amounts of data in a meaningful way. Each descriptive statistic distills vast amounts of data into a concise summary.
Table 2 provides a succinct overview of the dataset examined in this research. It presents information about the mean, median, sum, and number of observations in the dataset. Additionally, it delineates the range of the data series by specifying the maximum and minimum values. The kurtosis and skewness values offer insights into the degree of weakness, flatness, and skewness of the examined factors. In essence, the descriptive table encapsulates the key characteristics of the dataset under examination.
Descriptive statistics.

Source: Researchers own generation using Stata-14.
BRICS: Brazil, Russia, India, China, and South Africa.
Correlation matrix
The correlation matrix illustrates the correlation between two factors and provides insights into the direction of their association. It indicates whether a variable is positively or negatively correlated with another variable. The values in the correlation matrix range between 0 and 1. A value close to 1 signifies a strong correlation, while a value near 0 indicates a weak correlation between two variables.
The correlation heatplot replicates the correlation coefficient between examined variables with the help of different color scheme as shown in the following:
In Table 3 and Figure 4, the correlation between the examined variables for the case of BRICS economies is displayed. All variables exhibit a perfect correlation with themselves, as indicated by the diagonal number 1. Additionally, the correlation of each variable with other variables ranges between 0 and 1. In Table 3, some variables demonstrate a negative correlation (denoted by a negative sign), while others display a positive correlation (indicated by a positive sign). A value close to 1 suggests a strong correlation, whereas a value near 0 indicates a weak correlation between two variables. If the correlation value is 0.99 or above, it suggests the presence of multicollinearity.

Correlation heatplot. Source: Researchers own generation using Stata-14.
Correlation matrix.

Source: Researchers own generation using Stata-14.
BRICS: Brazil, Russia, India, China, and South Africa.
Unit root analysis
The unit root analysis reflects whether the examined parameters of research are statistically stationary or not. The unit root analysis requires that mean, covariance, and the variance of a series are constant over time and there does not exist any kind of trend in the preserved dataset. For time series analysis Augmented-Dickey-Fuller (ADF stat) analysis is applied, while for panel series Levin-Lin-Chu (LLC stat) analysis is applied using Stata-14.
In Table 4, unit root estimates for time series models along with panel model series have been explicated. Here, for time series estimation, ADF unit root has been applied. Besides, for panel series of BRICS economies LLC unit-root has been applied. All the examined variables are statistically stationary. Although, significance level varies among examined series, as shown with *, **, and *** stars.
Unit root test results for BRICS countries across selected variables.

Source: Researchers own generation using Stata-14.
BRICS: Brazil, Russia, India, China, and South Africa.
*significant (p < 0.05); **highly significant (p < 0.01); ***very highly significant (p < 0.001).
Autoregressive distribution lagged model and the cointegration analysis
The term “ARDL” stands for autoregressive distributed lag model. it is a classical least squares regression approach that considers lags of both the dependent and explanatory variables as regressors. 52 Regression models of this type have been utilized for several decades. However, in modern times, they have emerged as an important tool for testing the presence of long-run associations among the examined time series.
In its general form, an “ARDL Model” looks like this:
The model is “autoregressive” in the sense that Yt is “explicated” (in part) by Lagged values of itself. The model has a “distributed lag” factor in the sense that it uses the consecutive lags of the “x” independent variable. Often, the modern value of Xt itself is eliminated from the distributed lagged models’ cognition. The cointegration offers opportunities for transforming variables into stationarity. It is a statistical concept that involves the aggregation (X1, X2, X3,…, Xn) of time-series data of variables. A univariate time series “y” is integrated if it can be made stationary through differencing. The number of differences required to achieve stationarity is known as the order of integration, typically denoted by I(0) for stationary series. For cointegration analysis, the time series must be of rank 1. If a linear combination of the time series is integrated of rank zero, then it is termed as cointegrated. Cointegration analysis examines the potential correlation between respective time series in the long term. The concept of cointegration was first proposed by Granger, 53 building on the work of Granger and Newbold 54 on spurious regression. Cointegration implies a state where two or more nonstationary time series are linked in such a way that they cannot diverge from equilibrium in the long run.
In Table 5, short-run cointegration or affiliation between the examined variables of this study, for the case of BRICS economies, is presented. Table 5 has been divided into five subsections that show short-run estimates for each state individually. Researchers can’t rely on short-run estimates as short run stats change rapidly. Therefore, for replicating a reliable image, long-run results are important. However, almost all variables show significant cointegration in the short run. A negative value of Coin Eq is less than “1” in all models which indicates that there's a long-run affiliation among the dependent and independent variables of the study and also demonstrates the significance of study estimates and the accuracy of the results. Value of Coin Eq also assured that there is long-run cointegration among the variables of the study. Table 5 also depicts that there is significant affiliation between CO2, ENG, FDI, FOSF, URB, and LGRG.
Short-run cointegration.

Source: Researchers own generation using Eviews-9.
Note: P-values are given in parentheses and the *, **, and *** indicate statistical significance at 1%, 5%, and 10%, respectively.
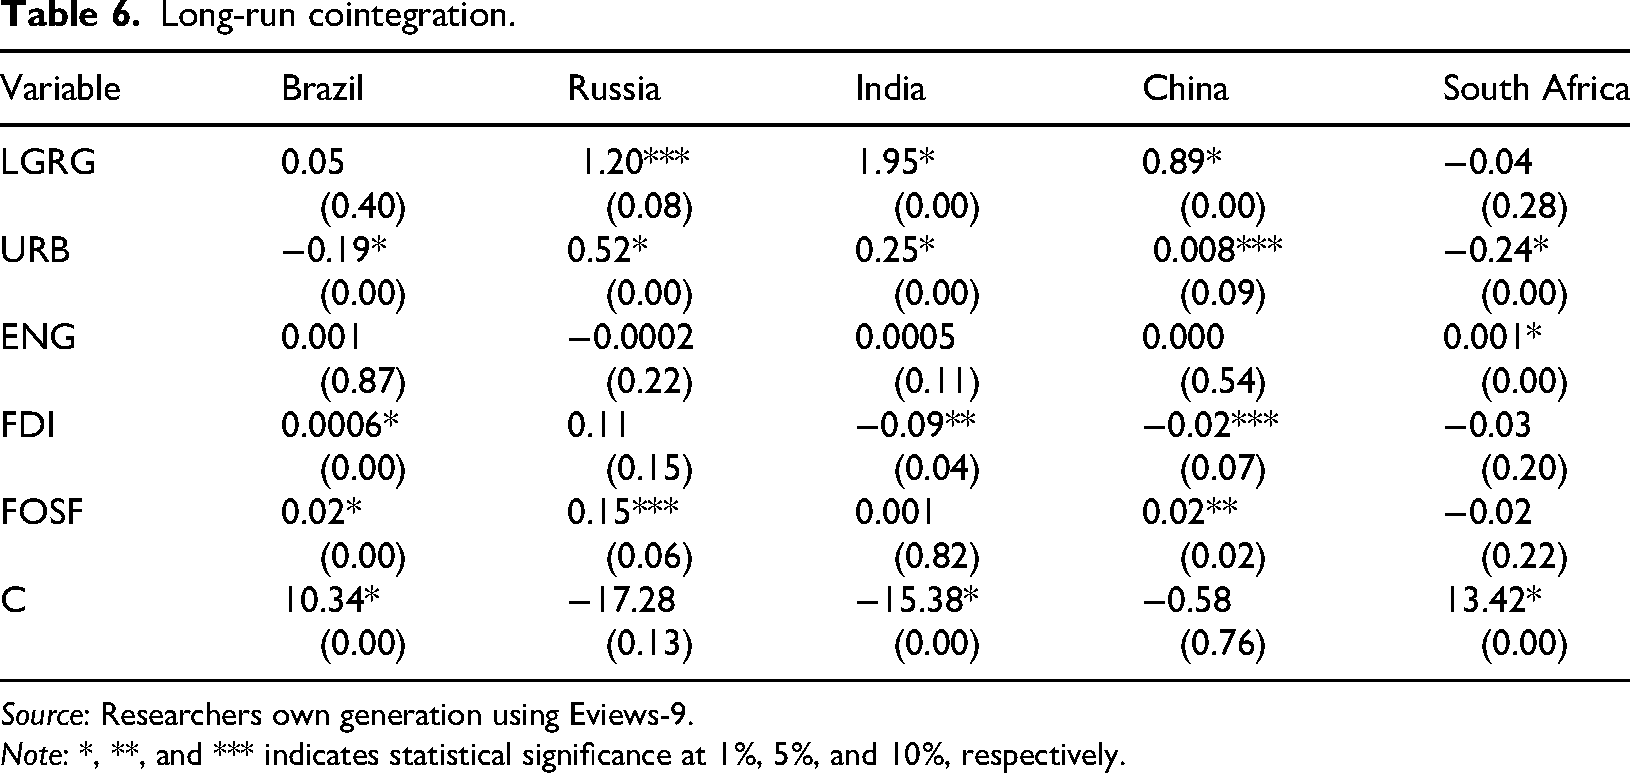
In Table 6, long-run estimates are exhibited for BRICS economies. In the case of Brazil's long-run estimates, all variables are statistically significant at 1% except LGRG, and ENG which are statistically insignificant at 1%. Except for urbanization all variables (ENG, FDI, FOSF, and LGRG) positively correlate with CO2 emissions. In other terms, because of an increase in ENG, FDI, FOSF, and LGRG the CO2 emission will increase.12,13,20 Greenhouse gas emissions (LGRG), FDI, fossil fuel consumption (FOSF), and increased energy use (ENG) raise CO2 emission levels. In case of an increase in urbanization, CO2 will decrease. The reason behind this negative association is that with urbanization usage of modern technologies increases, and production methods may improve which in turn reduces CO2 emission levels. 15 In the case of Russia, all variables are statistically significant, except for ENG and FDI. Furthermore, except for Energy usage (ENG), all variables (FDI, LGRG, URB, and FOSF) confirmed a positive correlation with CO2 emissions. In other terms, because of an increase in FDI, FOSF, URB, and LGRG, the CO2 emissions will increase. In case of an increase in Energy usage (ENG), the CO2 emission level will decrease. In the case of India, all variables are statistically significant, except FOSF, and ENG.
Long-run cointegration.
Source: Researchers own generation using Eviews-9.
Note: *, **, and *** indicates statistical significance at 1%, 5%, and 10%, respectively.
Furthermore, except for FDI all variables (URB, ENG, FOSF, and LGRG) confirmed a positive correlation with CO2 emissions. In other terms, because of an increase in URB, ENG, FOSF, and LGRG the CO2 emission will increase. In case of an increase in FDI, the CO2 emission level will decrease. In the case of China, all variables are statistically significant except ENG. Furthermore, all variables (ENG, URB, FOSF, and LGRG), except FDI, confirmed a positive association with CO2 emissions. In other terms, because of an increase in ENG, URB, FOSF, and LGRG, the CO2 emission will increase. For the case of South Africa, except LGRG, FDI, and FOSF all variables are statistically significant. Furthermore, except for ENG all variables (URB, FDI, FOSF, and LGRG) confirmed a negative correlation with CO2 emissions.1,17 In other terms, because of an increase in URB, FDI, FOSF, and LGRG the CO2 emission will increase. By comparing the estimates of this study with the literature, researchers can signify that these results are statistically consistent with other observed research. The bidirectional association exists between CO2 emissions, ENG, FDI, FOSF, LGRG, and URB as previously explored by Sebri and Ben-Salha, 10 Dong et al., 14 for the case of BRICS economies.
The bound test reflects the overall significance of the examined model, it is a part of ARDL estimation in order to elucidate the validity and the overall significance as shown below:
In the above-exhibited Table 7, a bound test table is presented. Significant bound test F-statistic value showed that there is long-run cointegration exists between the examined model, and the model is statistically significant. The F-statistics value for all five models is statistically significant at 1%, 5%, and 10% significance levels.
Bound test.

Source: Researchers own generation using Eviews-9.
Note: * and ** indicate statistical significance at 1% and 5%, respectively.
Panel quantile regression estimation
The panel quantile regression is a modified version of ordinary least squares (OLS) which utilizes different quantiles from a conditional distribution. This observes the change in the observed relationship at different quantile levels, such as 0.1, 0.5, and 0.7 quantiles. This estimation is much better for handling the prevailing heterogeneity at a varying distributional scale. The panel quantile regression estimates for different quantiles have been regressed as follows.
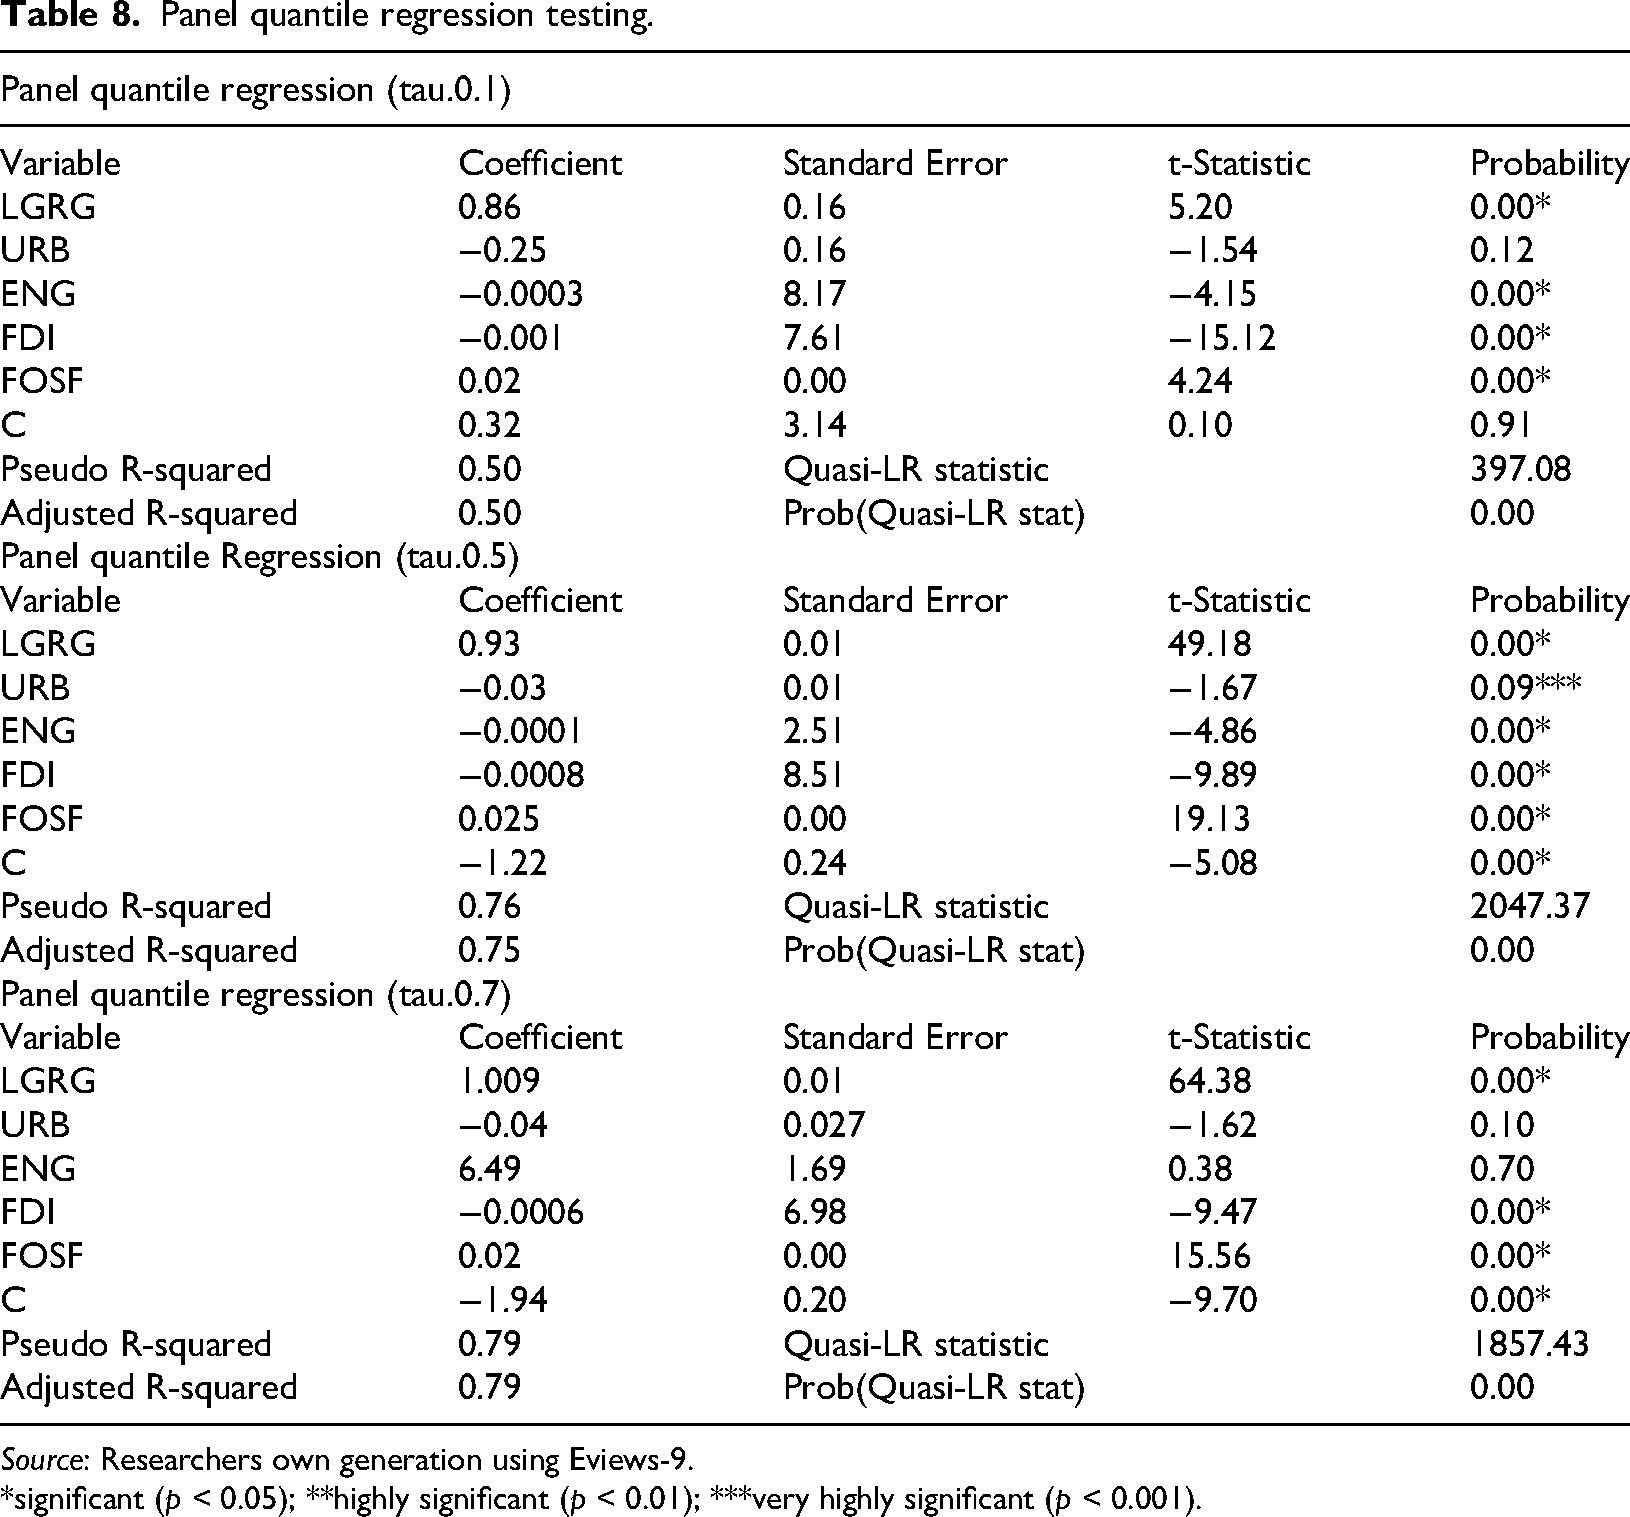
In Table 8, long-run estimates of panel quantile regression have been exhibited at quantile (or tau) 0.1, 0.5, and 0.7. All variables significantly confirmed their long-run association at quantile 0.1, except for urbanization. The role of urbanization is insignificant for quantile 0.1. Additionally, except for energy usage, FDI and urbanization, all variables confirmed a positive association here. This shows that with increased urbanization, FDI, and energy usage, carbon emissions will tend to decrease by a quantile of 0.1.12,13,20 The R-squared and adjusted R-squared values are 0.50 and 0.50, showing that the model explains 50% variation in the dependent variable. On the contrary, at quantile of 0.5, all variables confirmed their statistical significance. Additionally, energy usage, FDI and urbanization assert negative influences, while all others confirmed positive associations. Here, R-squared and adjusted R-squared values are 0.76 and 0.75, showing that the model explains 76% variation in the dependent variable. Similarly, for the case of quantile 0.7, all variables are significant except for URB, and ENG. Conversely, here URB and ENG cause a negative influence on carbon emissions.1,13,17,20 Additionally, R-squared and adjusted R-squared values are 0.79 and 0.79, showing that the model explains 79% variation in the dependent variable. These three models (for quantile 0.1, 0.5, and 0.7) are jointly stable and significant as the Quasi-LR statistics, which show overall model significance is statistically significant. In sum, based on all these quantile estimations, we can conclude that greenhouse gases cause an increase in the CO2 emission level in BRICS while urbanization assists in lowering the CO2 emission level in BRICS economies. In this regard, FDI also asserts an inverse effect on CO2 emission level of BRICS.
Panel quantile regression testing.
Source: Researchers own generation using Eviews-9.
*significant (p < 0.05); **highly significant (p < 0.01); ***very highly significant (p < 0.001).
Dumitrescu and Hurlin causality
The Dumitrescu and Hurlin causality also known as D-H causality, has been introduced by two researchers named “Dumitrescu” and “Hurlin.” This estimation is mainly utilized for panel data set in order to explain the cause and effect association between the examined series (Table 9).
Dumitrescu and Hurlin causality testing.
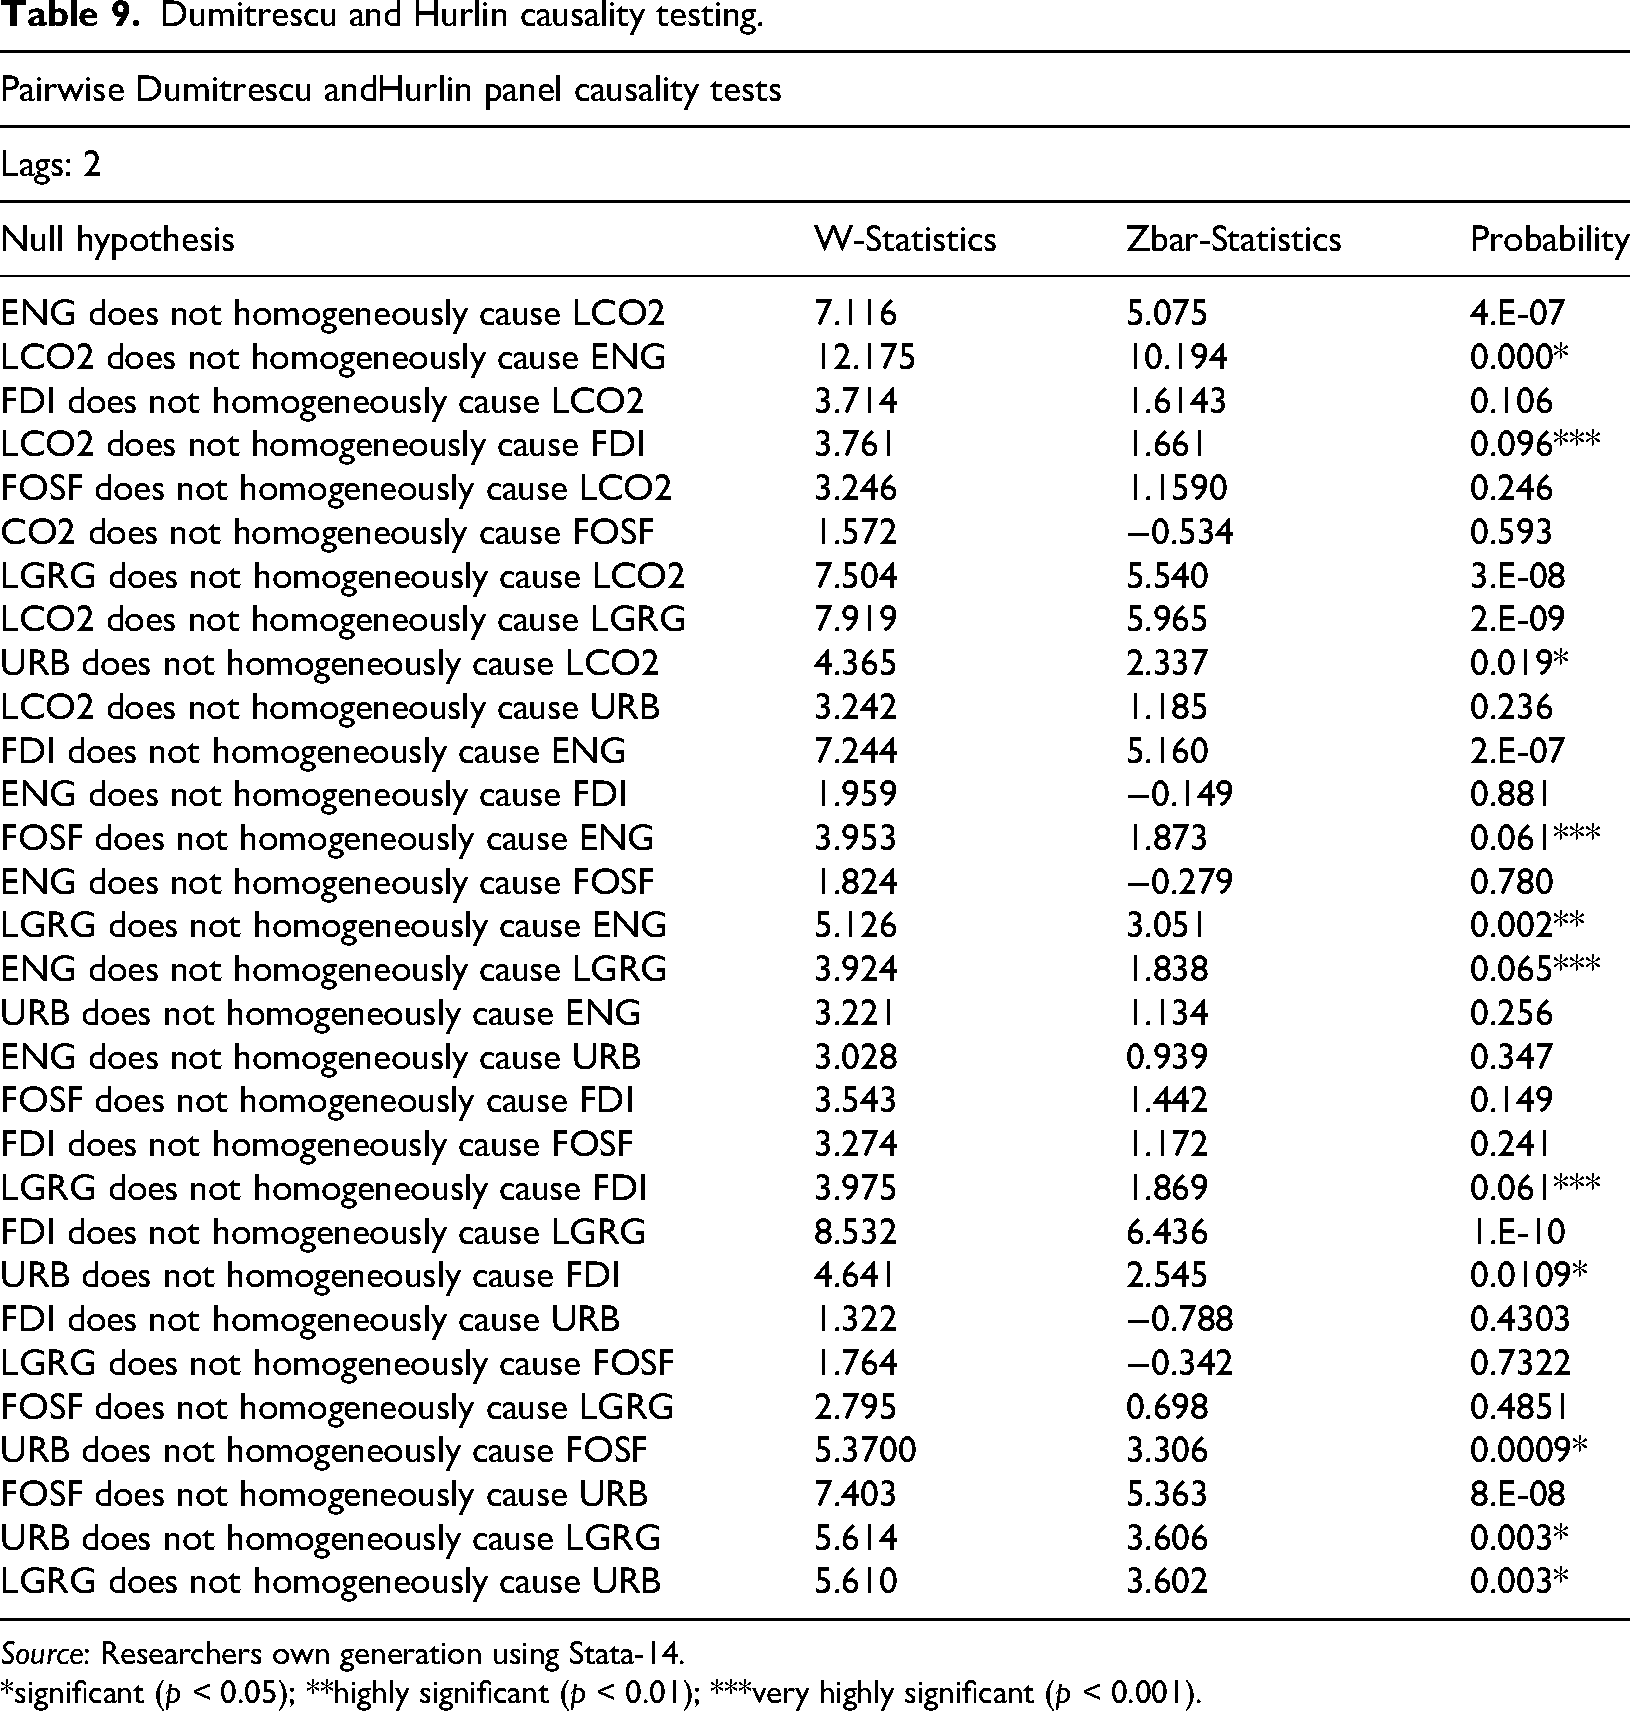
Source: Researchers own generation using Stata-14.
*significant (p < 0.05); **highly significant (p < 0.01); ***very highly significant (p < 0.001).
Table 9 shows the long-run cointegration between the examined variables by utilizing Dumitrescu and Hurlin causality analysis. Here, ENG does not homogenously cause CO2 (fails to reject the null hypothesis) but CO2 does cause ENG (significantly rejects the null). Similarly, FDI does not homogenously cause CO2, but CO2 does cause FDI. On the contrary, FOSF does not homogenously cause CO2, and CO2 does not cause FOSF. Similarly, LGRG and URB do not homogenously cause CO2, and CO2 also does not cause LGRG and URB. The homogenous causality between other variable combinations has been shown in the remaining cases.
Diagnosis and stability analysis
This section entails different diagnosis and stability checking estimation techniques applied by the researcher.
Ramsey-RESET outlier test
The Ramsey-RESET is an outlier diagnosis test used for the detection of outliers in the examined data series. This is a test for diagnosing the misspecification (omitted variable) and nonlinearity issue. This observes the perceived change in the fitted values by adding each predicting variable (Table 10).
Ramsey-RESET for outlier detection.
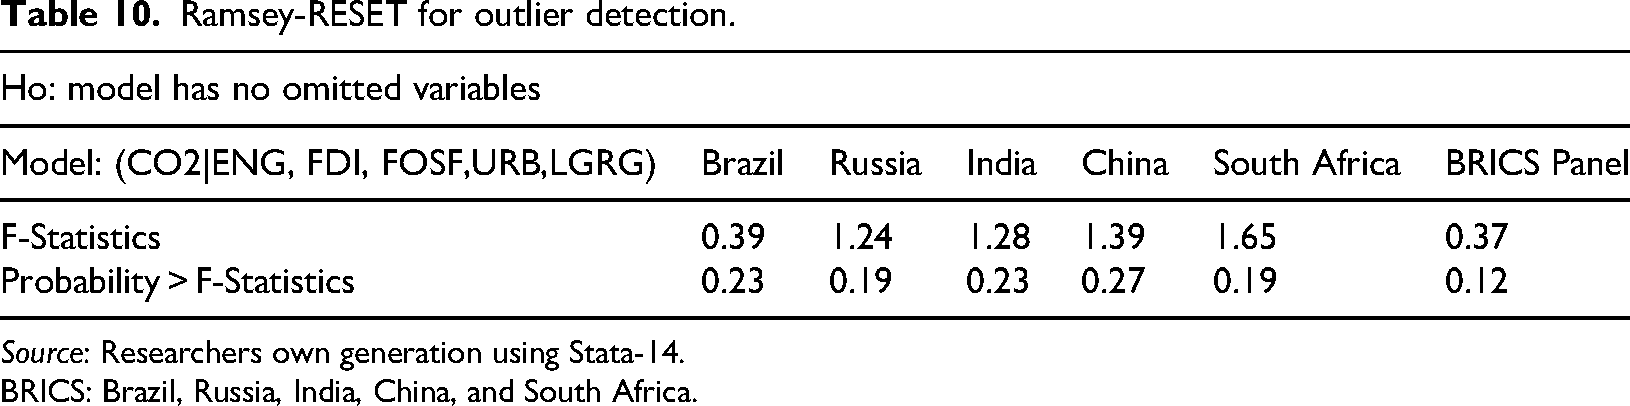
Source: Researchers own generation using Stata-14.
BRICS: Brazil, Russia, India, China, and South Africa.
Table 10 represents the model selection for this research. Table 10 highlights the presence of outliers or the omission of any redundant indicators. Based on the obtained results from Ramsey-RESET, researcher rejected the presence of outliers in all examined models. Thus, we accept the null hypothesis of this estimation, validating that there is no omitted variable in examined models.
Residual plots for adding each indicator
The following residual plot shows the change in actual coefficient by adding each additional predictor into a model. This also explicates the empirical as well as statistical significance of each predictor in determining the dependent variable of the study (Figure 5).

Adding indicator residual plotting. Source: Researchers own generation using Stata-14.
The following table explicates the effect of adding a variable in the examined panel model. This graph represents the change in the overall cointegration by adding variables. The statistics in these plots signify that adding a variable asserts a statistically significant effect on the overall cointegration of the model.
Autocorrelation and heteroscedasticity diagnosis
This section covers the detection of autocorrelation and heteroscedasticity in our examined panel model. The autocorrelation diagnosis determines that does the error term correlates with another period error term or not. While heteroscedasticity diagnosis statistics checks whether the variance remains constant over the period or not. In this regard, the following estimation techniques have been applied (Table 11).
Autocorrelation and heteroskedasticity diagnosis.
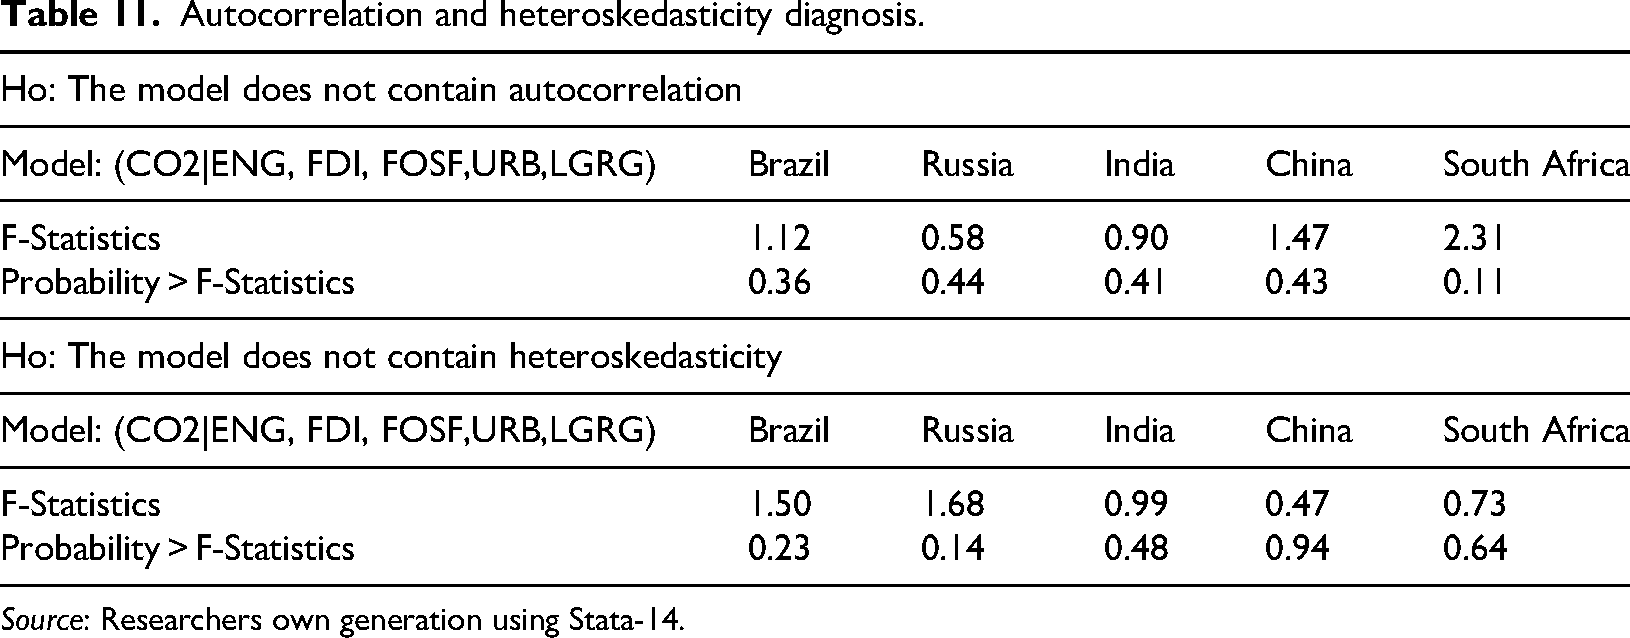
Source: Researchers own generation using Stata-14.
Table 11 explains the diagnostic tests for autocorrelation and heteroskedasticity. In all examined models, there does not exist any autocorrelation and heteroskedasticity. Therefore, we can’t reject the null hypothesis which states that model does not contain autocorrelation and heteroskedasticity, respectively (Figure 6).
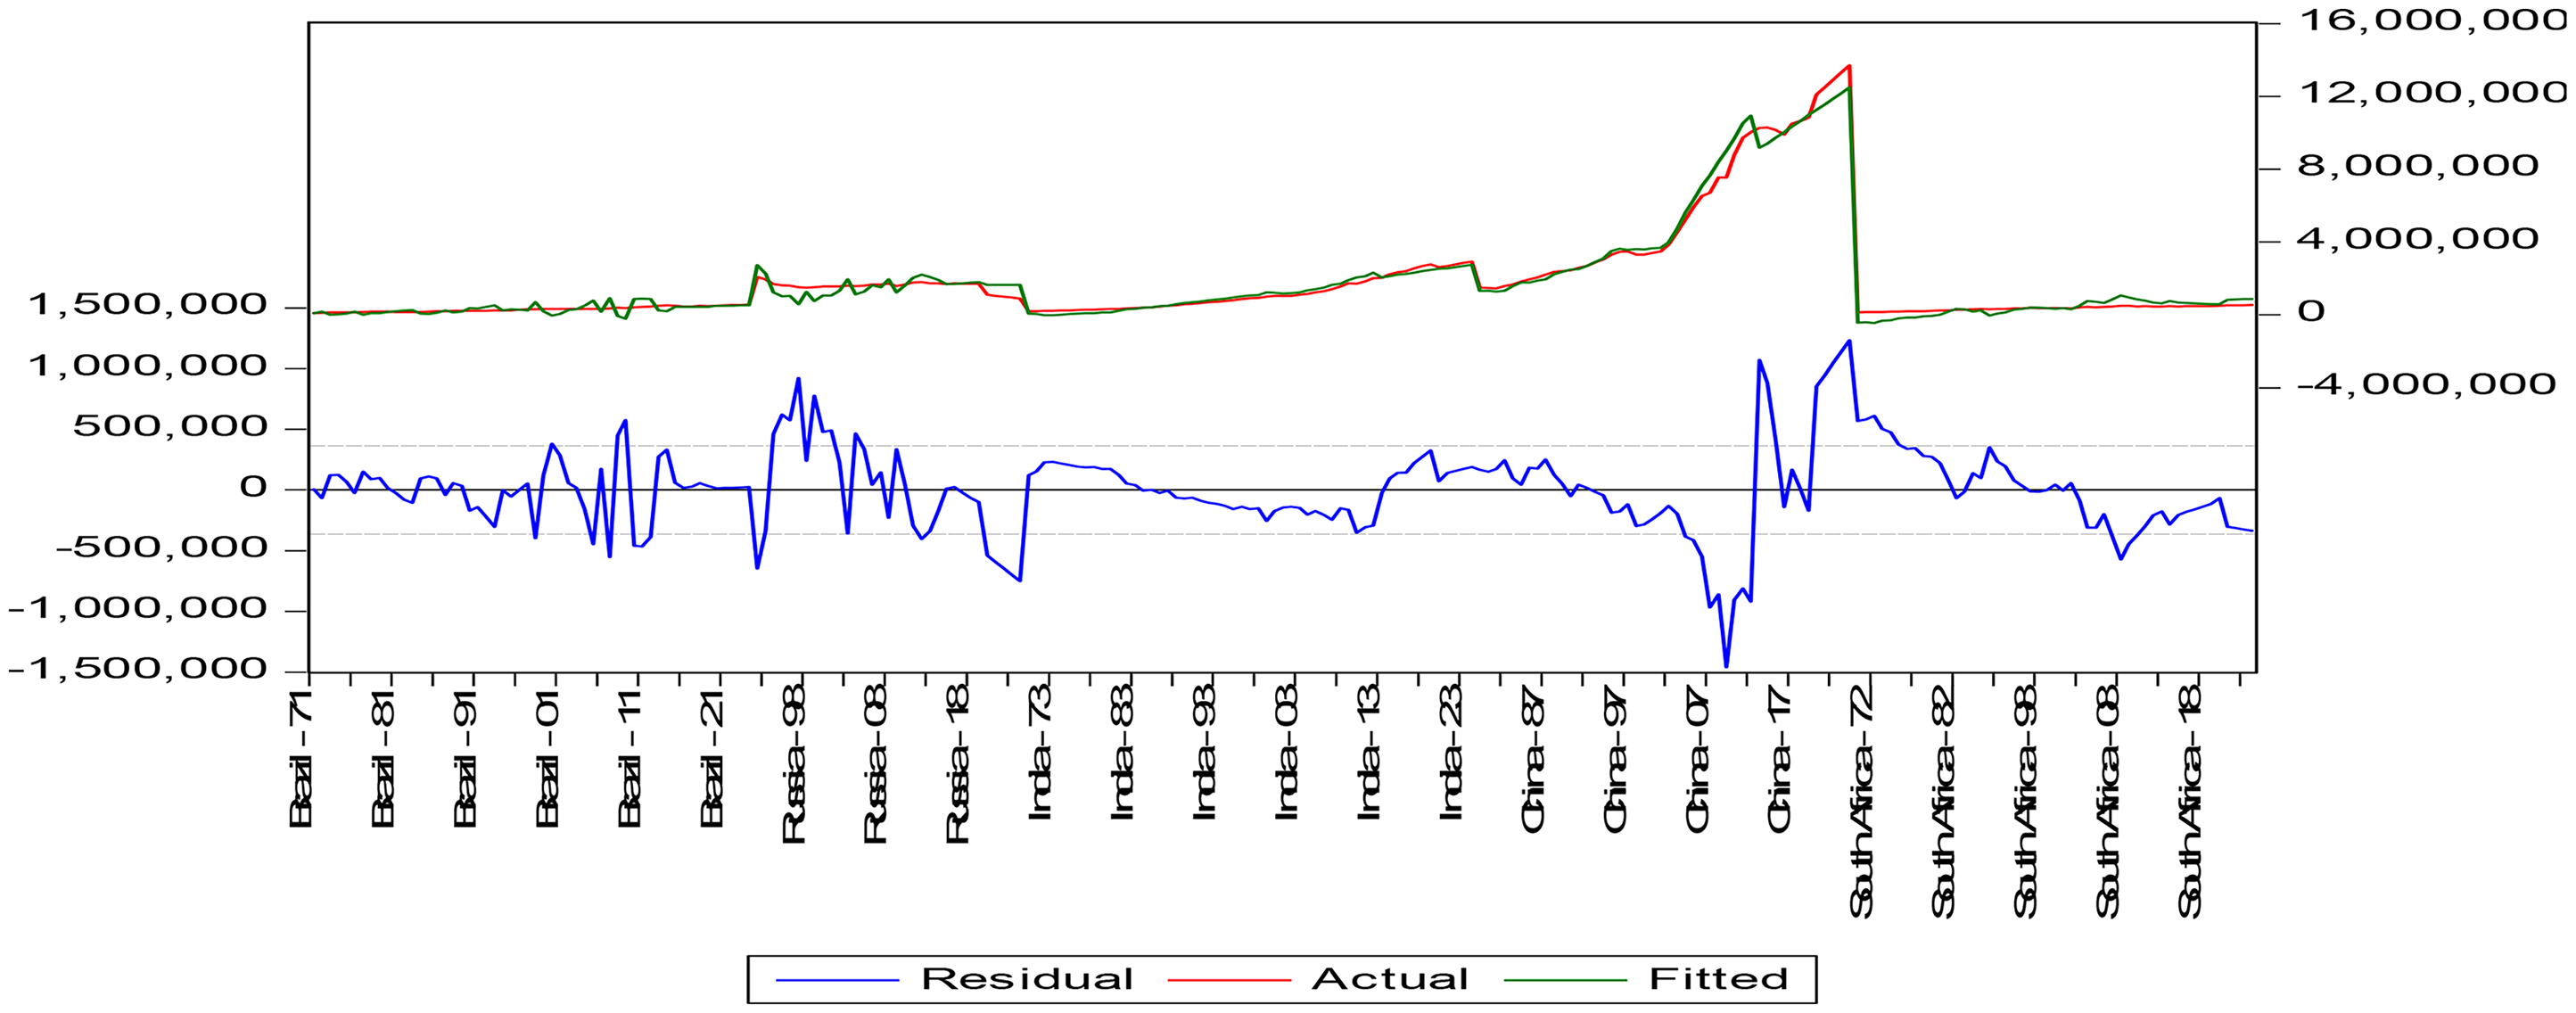
Actual, fitted, residuals plot for BRICS panel. Source: Researchers own generation using Eviews-9. BRICS: Brazil, Russia, India, China, and South Africa.
The following graph shows the actual-fitted residual plot of the examined panel model. The actual and fitted lines are in harmony and move along with each other, so the model is statistically stable. Besides, here residuals are quite below our estimated and actual lines.
Histogram plot for normality checking
The histogram plot is usually used to demonstrate the normal distribution or the shape of the data series. This also highlights the distributional characteristics of a data series such as modality, skewness, and outliers. The bar height shows the frequency or observation in a specific data range (Figure 7).
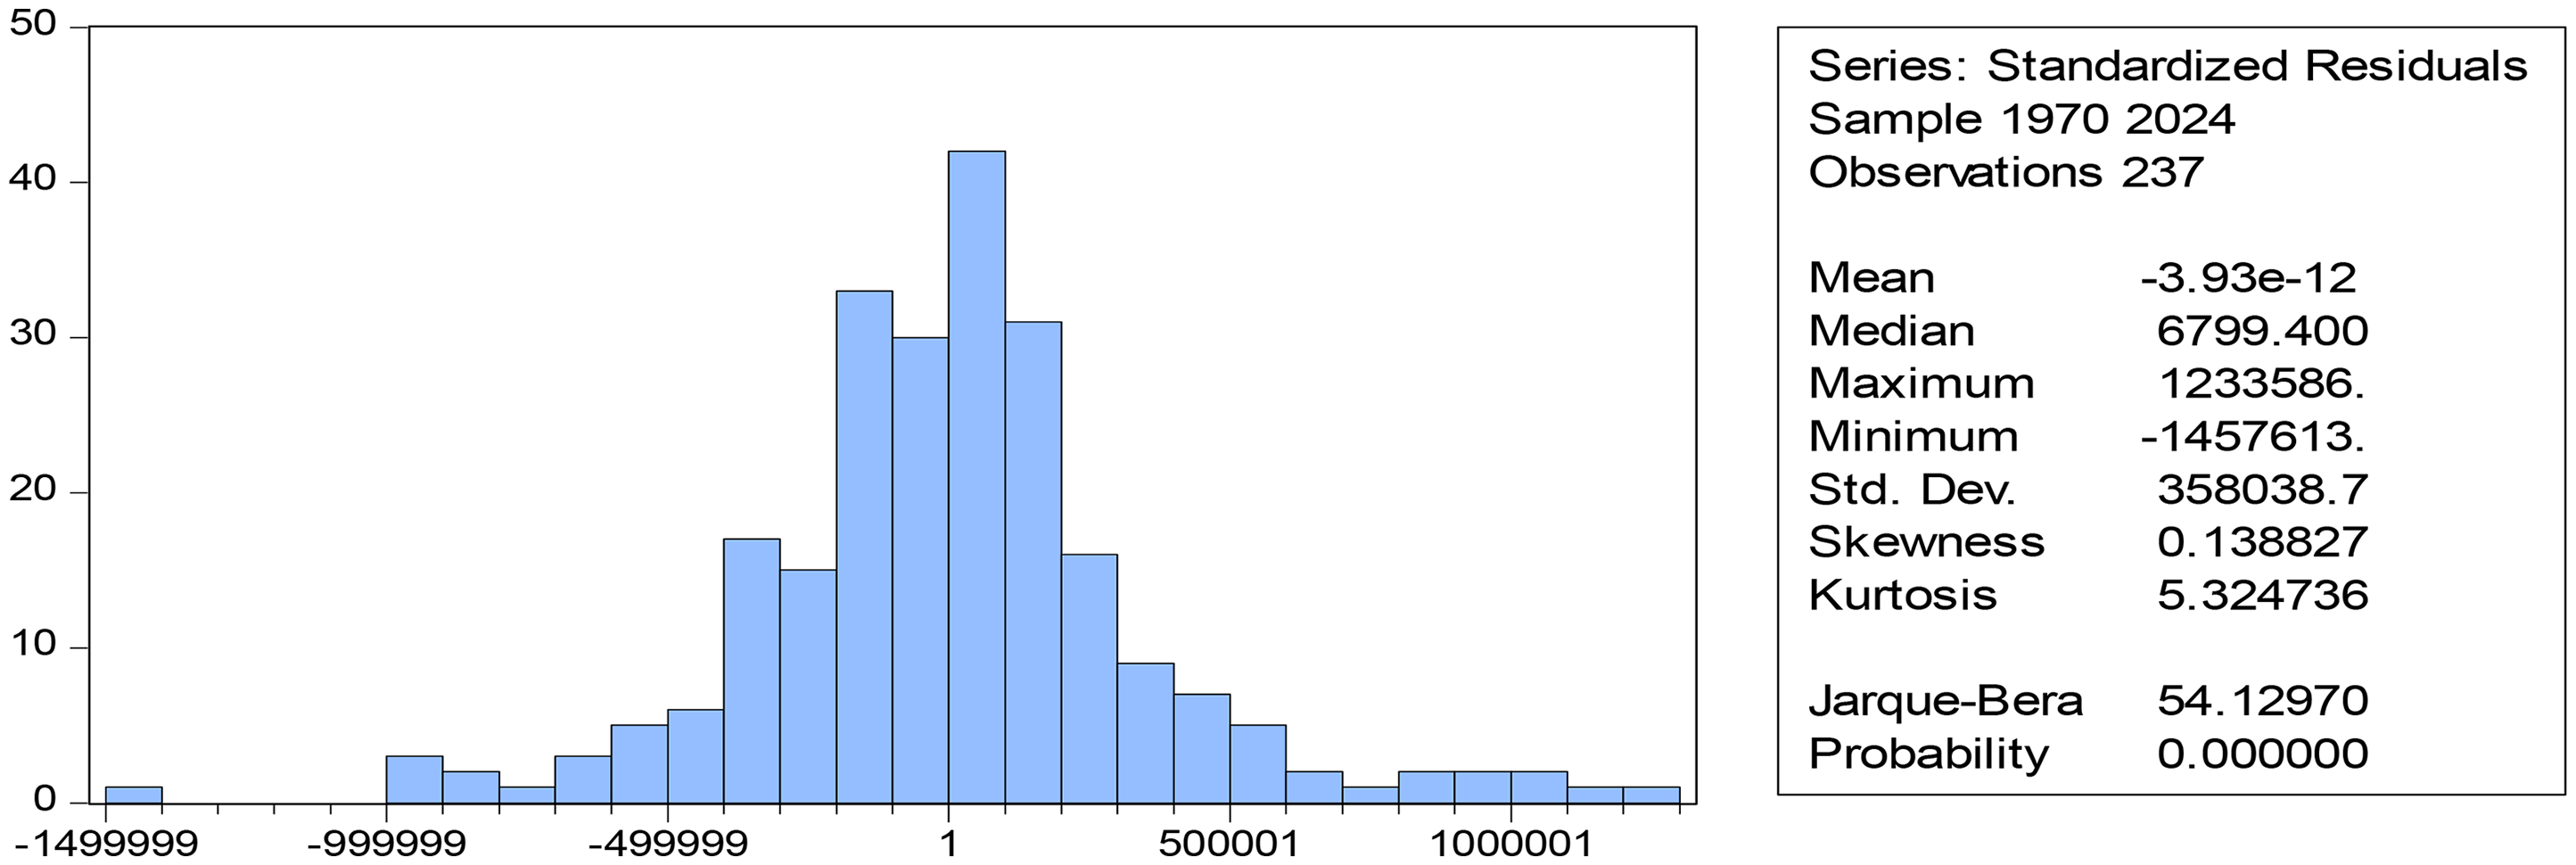
Histogram plot for BRICS panel. Source: Researchers own generation using Eviews-9. BRICS: Brazil, Russia, India, China, and South Africa.
The following graph shows the normal distribution of the examined panel model and reflects its salient features. The Histogram is bell-shaped thus our examined series is normally distributed.
CUSUM plots
The CUSUM or the cumulative sum of squares plots show the models stability and the overall significance of a time series dataset utilized (Figure 8).
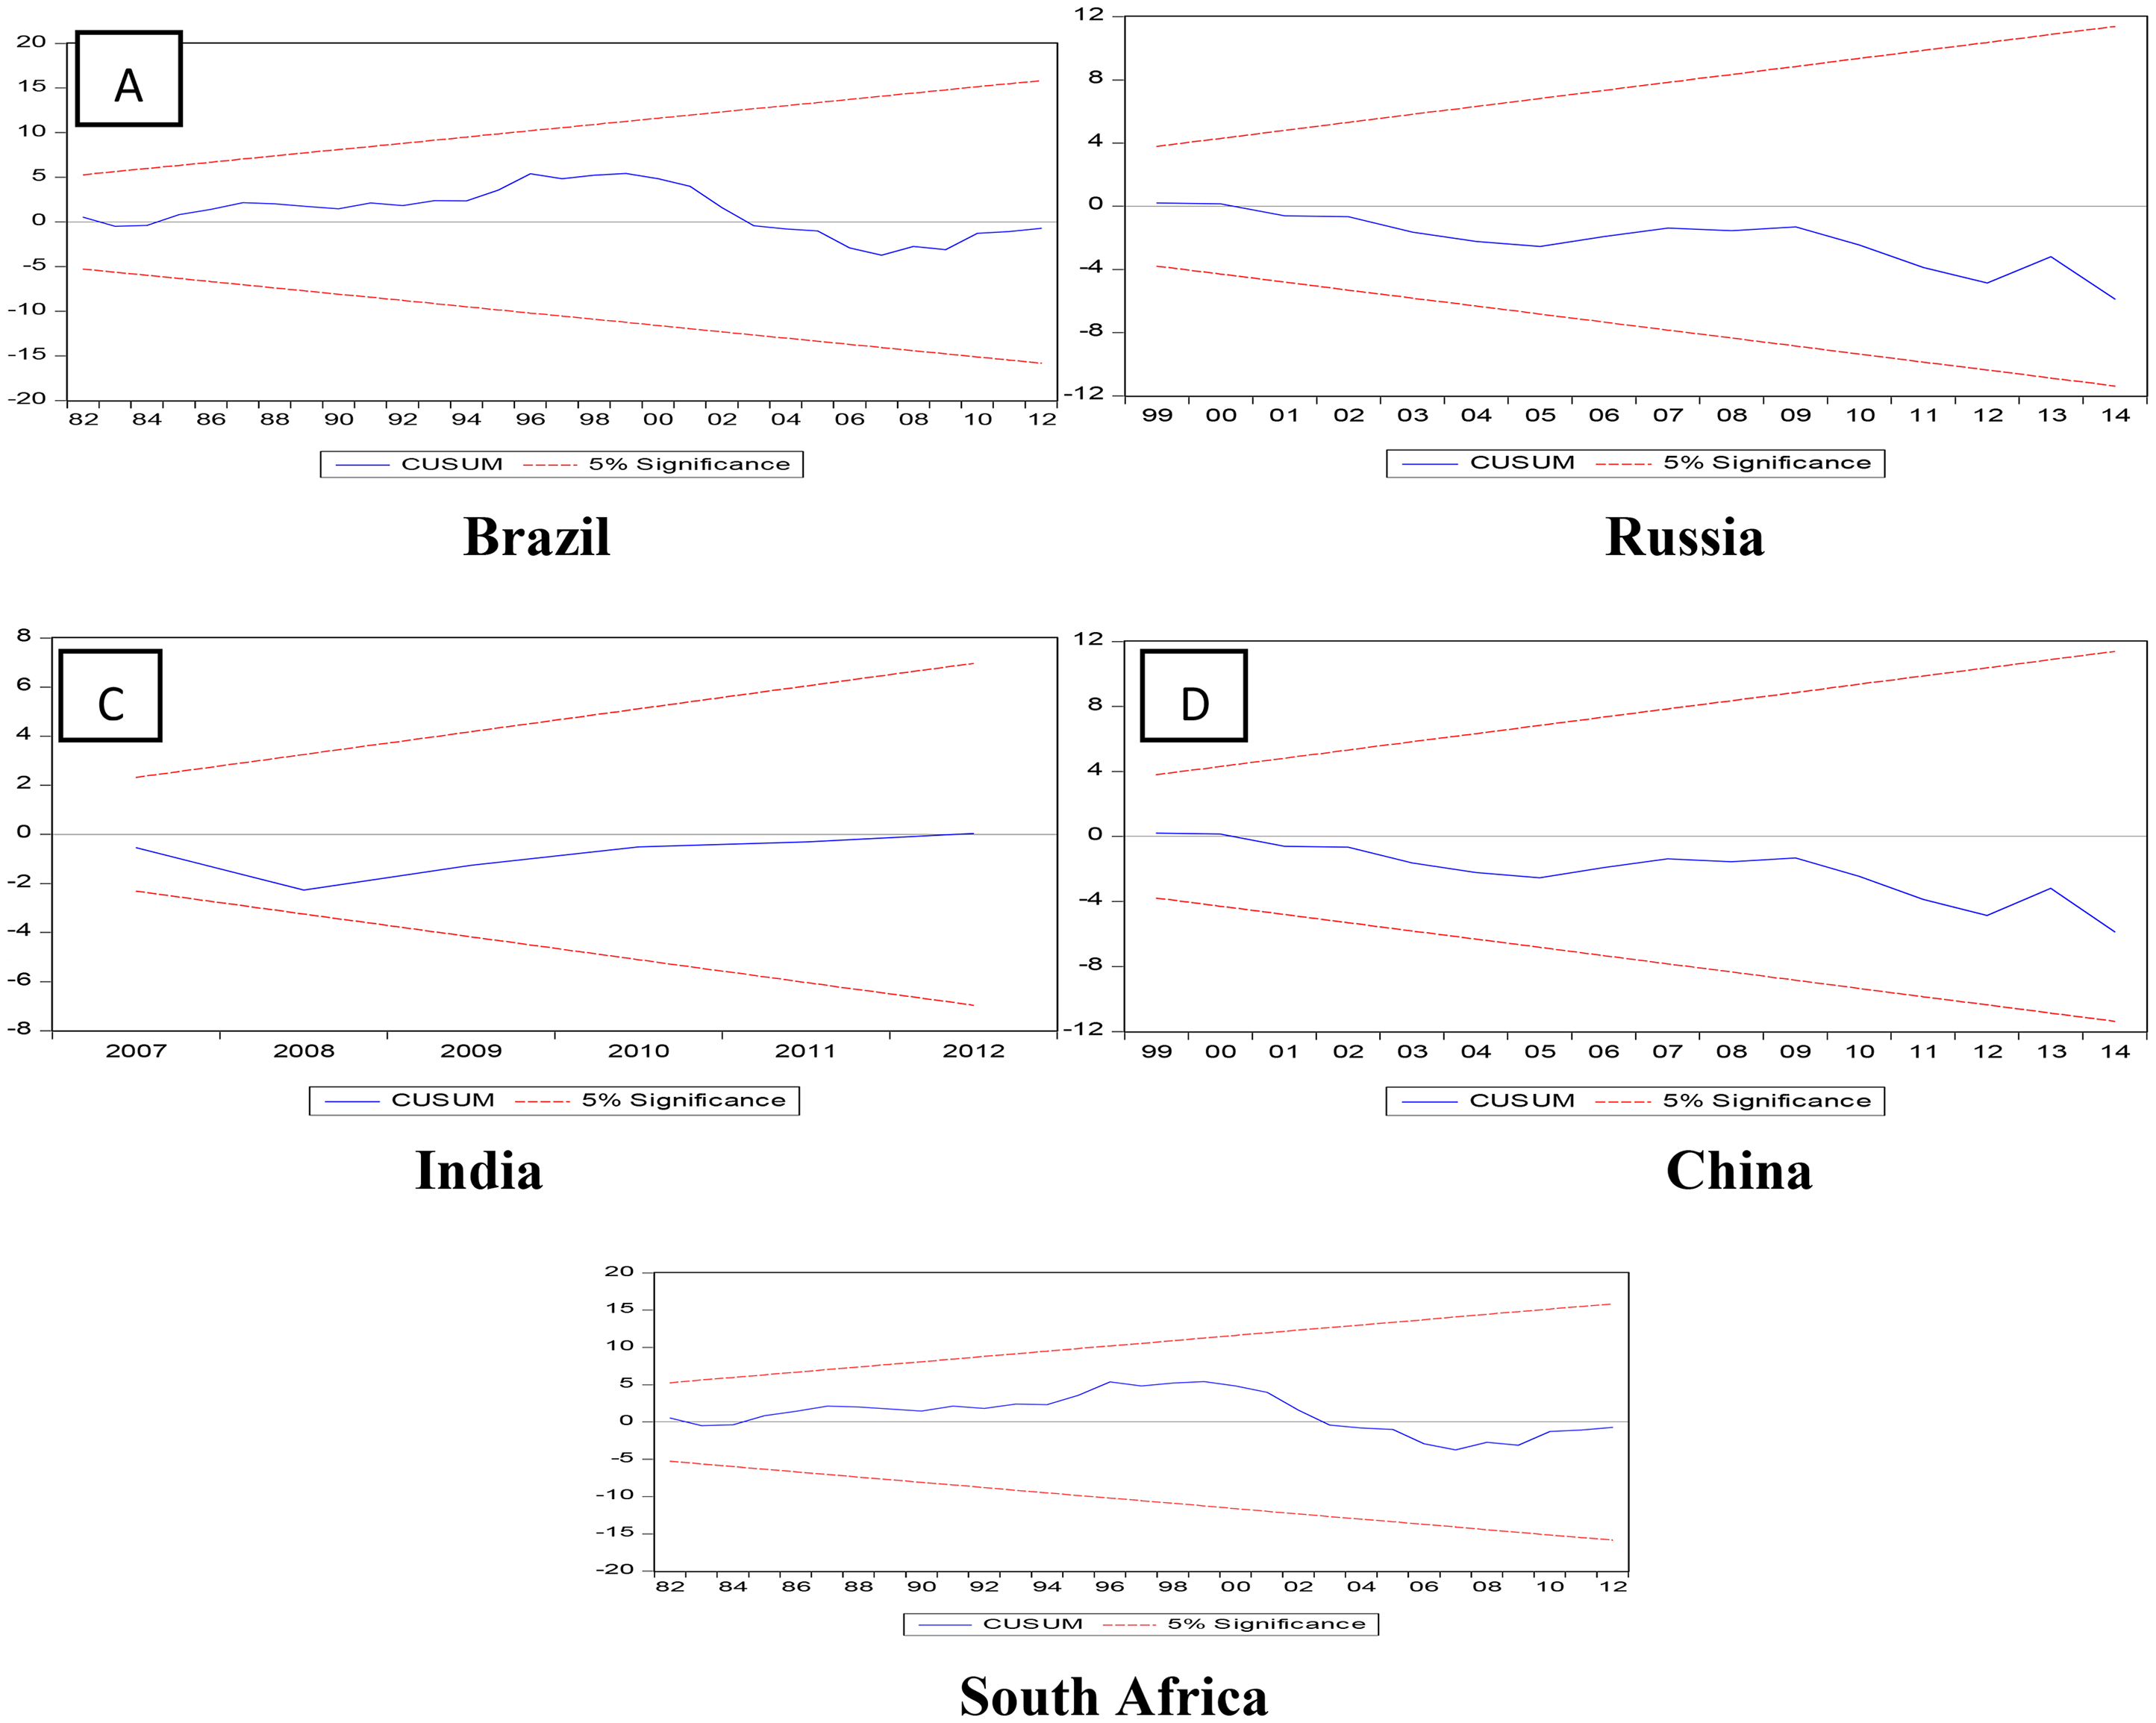
CUSUM plots of BRICS countries. Source: Researchers own generation using Eviews-9. BRICS: Brazil, Russia, India, China, and South Africa.
The CUSUM graphs replicate the stability of the model examined. In Figure 9, CUSUM plots for BRICS have been displayed respectively. In all the above-displayed tables critical line (red) lines between blue lines. Therefore, all models are statistically significant.
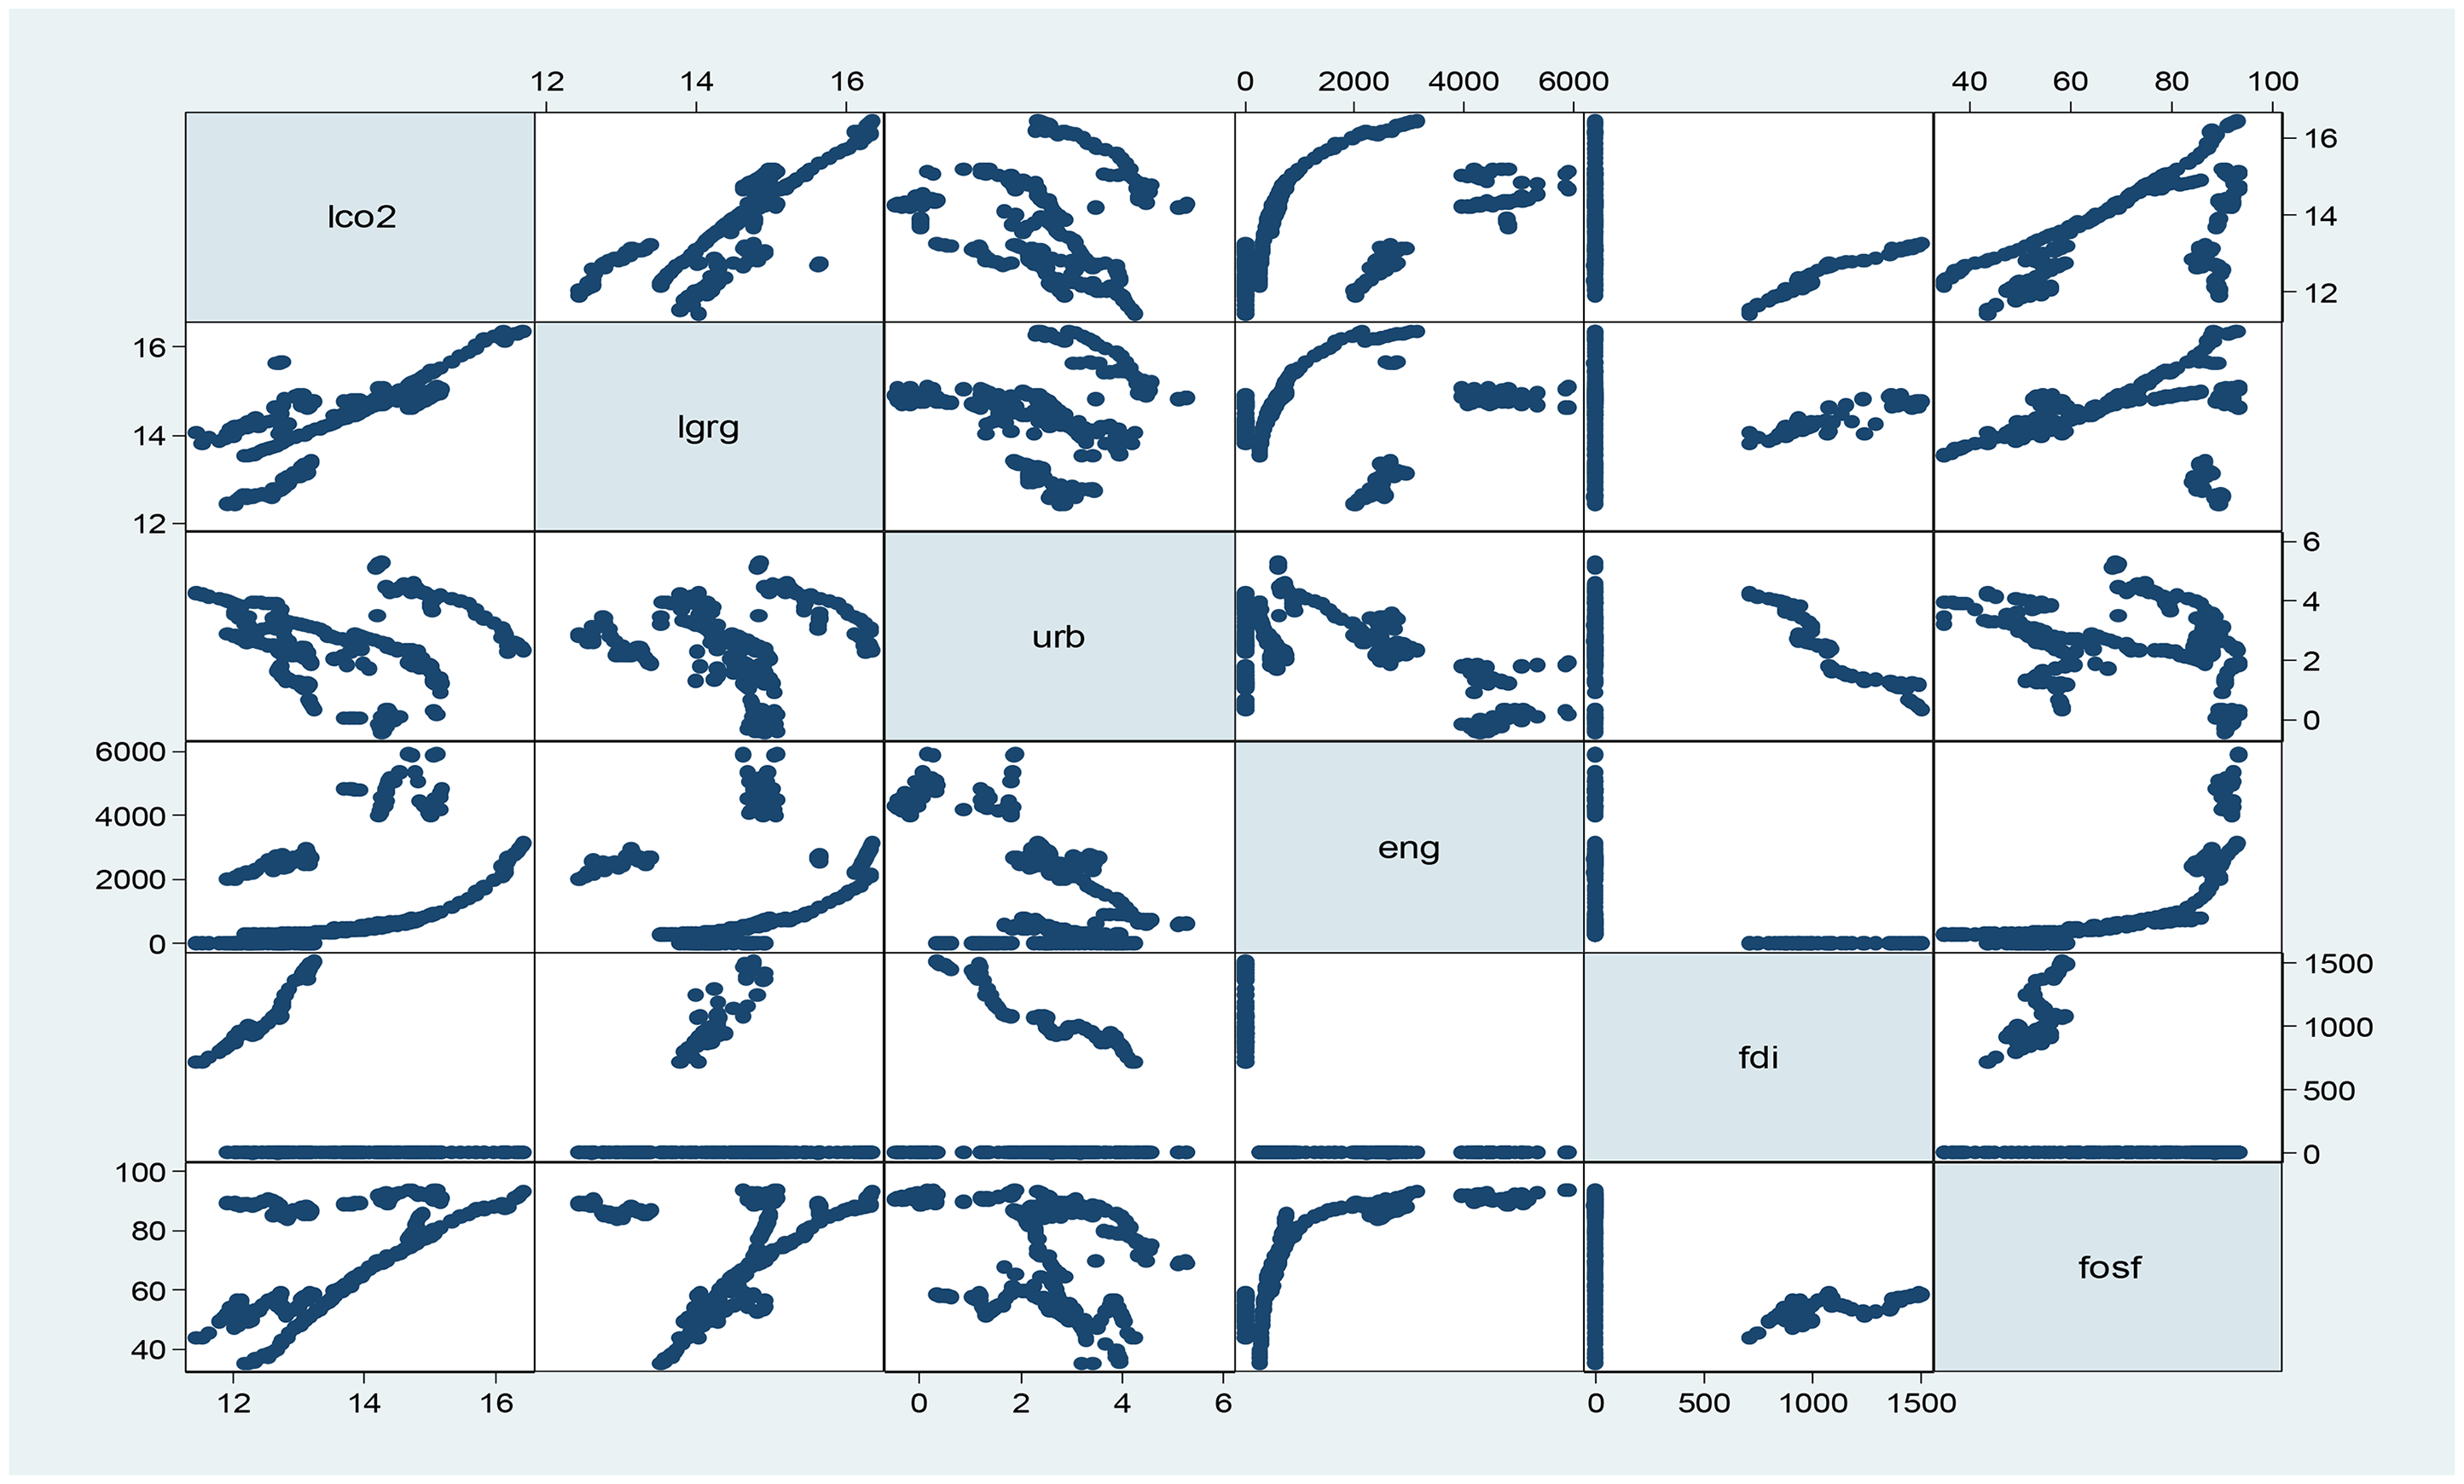
Scatter plots for examined parameters. Source: Researchers own generation using Stata-14.
The scatter plot in Figure 9 illustrates the residuals for each examined series. Here, in each graph, residuals are scattered randomly around the plot, which reflects that residuals are homogeneous for the examined panel model of this research.
Normality plotting
The normality plots or the P-P plots, show the normal distribution of the examined panel dataset. This normality visualization easily highlights the deviation in the examined data series. It is an informal test best fit for exploratory analysis (Figure 10).

Normality detection using probability plots (P-P). Source: Researchers own generation using Stata-14.
The normal distribution has been diagnosed using P-P plots. All examined variables range away from the critical center-line, thus signifying that all examined variables are normally distributed around their mean.
Conclusion
With an increased population, resource depletion, energy consumption, and carbon emissions have tended to increase manifold. Thus, it is an imperative concern all over the globe. The increased urbanization which is a result of increased population and globalization, incurs imperative influences on carbon emissions. 46 Besides, the greenhouses have been renowned as a leading channel that generates carbon emissions. 47 Therefore their long run cointegration along with their dynamic contribution, needs to be analyzed comparatively. In this regard, BRICS economies have been targeted by the analyzer. However, targeting BRICS nations entails static significance as BRICS are not only developed economies but also those economies that generate a major share of global emissions.
Therefore, the current study delves into the interconnectedness among CO2 emissions, greenhouse gas emissions, urbanization, fossil fuel energy consumption, foreign direct investment, and energy usage within the BRICS economies. This research covers the time spanning from 1970 to 2024 by using time series. The literature mainly focuses on the combined cointegration of these forces for BRICS nations. Although little attention has been focused on the heterogeneity analysis or the comparative analysis of BRICS nations individually.
Conversely, this study also entails a panel estimation for these nations in order to analyze the magnitude contribution of the considered variables. This research paper employs the ARDL bounds testing approach for investigating the correlation between CO2 emissions, greenhouse gas emissions, urbanization, fossil fuel energy consumption, FDI, and energy use in the BRICS economies. Though a large number of studies have been conducted recently concerning CO2 emissions but few of them have considered the association between CO2 emissions and greenhouse gas emissions. Yet the role of urbanization and FDI was still under debate.47,48 Therefore, this study aims to explicate the role of FDI and urbanization in BRICS economies that contribute 40% of CO2 emissions globally.
For statistical analysis, the researcher scrutinizes the long-term causal relationships between carbon emissions, energy consumption, foreign direct investment, fossil fuel consumption, greenhouse gases, and urbanization. The empirical evidence obtained from the ARDL bound testing, panel quantile cointegration, and Dumitrescu and Hurlin causality testing approaches specifies that the models examined in this research are statistically significant.
The increase in carbon emissions (attributed to urbanization and GHS) can be cut down via introducing energy efficient yet less resources (such as fossil fuels), along with the adoption of renewable energy.28,42,43 In the case of China, FDI inflows have an insignificant effect which is attributed to the resources-intensive and labor-intensive manufacturing. The sector concentration toward resources intensive production leads to massive environmental concerns.49,50 It was also observed that impact of FDI inflows lies mainly on the scale effect and the usage of pollution control equipment costs. 50 Conversely, in South Africa, urbanization is insignificant. The examined literature disclosed that urbanization asserts a significant effect only if it is augmented with the World uncertainty. 51
Besides, the empirical findings, derived from ARDL and panel cointegration estimates, reveal the existence of long-term equilibrium cointegration among the variables under examination. To ensure the stability of our models, we employ histograms, residual analysis, and the CUSUM analysis, which confirms the consistency of our findings. In essence, our study concludes that in the case of BRICS economies, the level of CO2 emissions is significantly influenced by urbanization and greenhouse gas emissions.
An imperative contribution of FDI has also been witnessed here. Thus, researchers stressed integrating urbanization and greenhouse gas emissions while forming environment-related policies in BRICS economies. Additionally, significant contribution of foreign direct investment cannot be ignored in this regard. Estimates also suggest that an increase in CO2 emission levels, which is the chief origin behind global warming, prompts policymakers to decrease greenhouse gas emissions by considering some methods of scaling down fossil fuel energy consumption and relying more on renewable energy sources. 48 In sum, after examining this study, one can conclude that in the case of BRICS economies, there is an interconnectedness between CO2 emissions, urbanization and greenhouse gas emissions.
Results discussion
This section provides a summary of the results of the statistical analysis of this research. The correlation matrix confirms that there exists an association between the examined research variables. Besides, it shows that the examined variables rule out the presence of multicollinearity as there is no correlation that exceeds more than 0.90. In addition, unit root analysis shows that all examined variables are statistically stationary and thus rule out the presence of unit root or any trend pattern in the examined series. As all the variables are stationary at level the researcher implies panel-quantile-integration. Besides, some of these variables (in disaggregate analysis) are stationary both at level and first-difference, thus permitting the application of ARDL methodology.
The ARDL estimates postulate the disaggregate analysis of BRICS economies by evaluating individual economies, respectively. The estimates of short-run ARDL are not consistent and thus provide an insignificant contribution of the examined variables. In order to reflect the consistent impact of examined indicators, long run ARDL estimates have been deliberated. Conversely, the long-run ARDL results confirmed that both urbanization and greenhouse gas emissions significantly contribute the carbon emissions in all targeted economies, except for South Africa (urbanization is insignificant here). Similarly, all examined variables are empirically significant in all targeted economies, except for China and South Africa. The increase in carbon emissions (attributed to urbanization and GHS) can be cut down via introducing energy efficient yet less resources (such as fossil fuels), along with the adoption of renewable energy.28,42,43
In the case of China, FDI inflows have an insignificant effect which is attributed to the resources-intensive and labor-intensive manufacturing. The sector concentration toward resources intensive production leads to massive environmental concerns.49,50 It was also observed that the impact of FDI inflows lies mainly on the scale effect and the usage of pollution control equipment costs. 50 Conversely, in South Africa, urbanization is insignificant. The examined literature disclosed that urbanization asserts a significant effect only if it is augmented with the World uncertainty. 51
The findings of panel-quantile regression delineate the panel estimation, in order to specify the magnitude effect on BRICS economies. The panel-quantile regression estimates have been decomposed at three different quantile levels which are the 10th, 5th, and 7th quantiles. The overall results confirmed that both urbanization and greenhouse gas emissions significantly contribute to the carbon emissions in all targeted BRICS economies. In this regard, all examined variables are empirically significant at all specified quantile thresholds. Although at quantile 10th urbanization is insignificant, while at 5th and 7th quantiles energy consumption (ENG) is insignificant.46,47
In addition to this, panel causality has also been tested using the causality test of Dumitrescu and Hurlin (D-H). This causality test shows that there exists static causality between the examined indicators of this research. Although the nature of causality varies among variables, some indicators assert bidirectional while some assert unidirectional causality.28,47 In the end, some diagnostic statistics have been performed which integrate the absence of outliers, multicollinearity, autocorrelation, and heteroscedasticity in the examined models of this research. Besides, for results validation and robustness CUSUM analysis has been deliberated which signifies the statistical significance of examined models.
Policy implications
In light of the obtained empirical results, researchers suggested the following policy implications:
The static policies for promoting less-intensive GHS industries must be formulated to mitigate the contribution of greenhouse gases to the overall carbon emissions of BRICS. In this regard, govt. can offer tax exemption or some other benefits to those industries that consider less-intensive GHS formation in their production. With increased urbanization GHS pollution increases, therefore, there is need to bridge the twin-city gap (rural–urban disparity) while forming urbanization controlling and environment-related policies in BRICS economies. Increased foreign investment level raises carbon emissions by accelerating the industrialization process. Thus, to transpose this negative effect, there is need to allocate or divert FDI inflows primarily towards low-carbon-intensive industries by attesting multiple incentives (such as tax exemption) in these industries. Fossil fuel energy consumption significantly increases carbon emissions, thus policymakers must consider the decoupling of economic growth from the traditional fossil fuels that produce greenhouse gas emissions. Therefore some static policies are required for managing the usage of nonrenewable resources in BRICS nations.
Research contribution to the existing literature
This research attempts to enrich the existing literature via empirically probing the interconnectedness between greenhouse gases, urbanization, and energy consumption, and carbon emission. An empirical investigation has been carried out for the case of selected highly pollution raising economies referred to as the BRICS nations. As BRICS economies play a static role in the global economic growth, they require a strategic shift towards low-carbon intensive industries on an urgent basis. This research deliberates that the perceived growth models in BRICS nations are primarily tied to the production of carbon-intensive industries, which raises concerns about the environmental sustainability as well as the development of such trajectories.
Therefore, this research underscores the significance of environmental governance in forming long-term ecological as well as economic outcomes. Thus, advocates the adoption of less resources intensive production methodologies along with green technologies, clean industrial processes, and strongly provoking regulatory frameworks in order to mitigate the negative influence of greenhouse gases and urbanization. Along with a panel estimation, this research decouples the targeted economies into a time-series estimation for visualizing a heterogeneous analysis to obtain a crystal insight into the observed phenomenon.
The given literature mainly focuses on the combined cointegration of these forces for BRICS nations. Although little attention has been focused on the heterogeneity analysis or the comparative analysis of BRICS nations, individually.7–9 This research also aims to elucidate the nexus between urbanization, greenhouse gas emissions, and carbon emissions. Similarly, the role of trade openness (or FDI) has also been signified by the researchers, which was also considered in this research, as well.38,39 This article enriches the scientific community by signifying the importance of addressing CO2 emissions in developed economies (such as BRICS). A comparative analysis of each economy has been displayed to highlight the major contributors to carbon emissions in BRICS.
Limitations and future research considerations
In this research main focus has been cast toward energy consumption and carbon emissions. Here are the study limitations:
This study has not entailed the influence of renewable energy and nonrenewable energy, even though we examined the role of greenhouse gases and fossil fuel energy consumption in determining the carbon emissions of BRICS. There is a need to consider carbon emissions and greenhouse gases association for the case of developing economies, where the situation of environmental degradation is much more serious than in developed economies. The increased in carbon emissions can witness a cut down via introducing energy efficient yet less resources (such as fossil fuels) intensive, along with the adoption of renewable energy. The introduction of technological innovations and globalization needs to be addressed in determining the carbon emissions of BRICS economies.
Supplemental Material
sj-docx-1-eae-10.1177_0958305X251395643 - Supplemental material for Exploring the nexus between urbanization dynamics and greenhouse gas emissions: A comparative analysis of CO2 trends in BRICS economies
Supplemental material, sj-docx-1-eae-10.1177_0958305X251395643 for Exploring the nexus between urbanization dynamics and greenhouse gas emissions: A comparative analysis of CO2 trends in BRICS economies by He Jiang, Khizra Sardar and Hina Ali in Energy & Environment
Footnotes
Funding
The authors disclosed receipt of the following financial support for the research, authorship, and/or publication of this article: This work is financially supported by National Social Science Foundation Project, 21BJY058; Ministry of Education Humanities and Social Sciences Fund Project, 23YJC630067; 2024 Guangdong Philosophy and Social Sciences Planning Project, GD24XGL032; 2025 Guangzhou Philosophy and Social Sciences Development 14th Five Year Plan Project (Co construction), 2025GZGJ293; Social Science Planning Project of Foshan City in 2025, 2025-GJ120; 2025 Zhengzhou Social Science Research Project, ZSLX2025+0722; The soft science research project of the China National Intellectual Property Administration in 2025, SS25-A-19; Intellectual Property Soft Science Research Project of Henan Province in 2025, 20250106001; 20250106006; 2025 School Teaching Quality and Teaching Reform Project, 2025ZLGC17; 2022 Private Education Special Project Research Project, 2022-MBJYZXKT-014.
Declaration of conflicting interests
The authors declared no potential conflicts of interest with respect to the research, authorship, and/or publication of this article.
Availability of data and materials
The datasets used and/or analyzed during the current study available from the corresponding author on reasonable request.
Supplemental material
Supplemental material for this article is available online.
Author Biographies
References
Supplementary Material
Please find the following supplemental material available below.
For Open Access articles published under a Creative Commons License, all supplemental material carries the same license as the article it is associated with.
For non-Open Access articles published, all supplemental material carries a non-exclusive license, and permission requests for re-use of supplemental material or any part of supplemental material shall be sent directly to the copyright owner as specified in the copyright notice associated with the article.