



Abstract
Aside from all the other factors, the connection between energy poverty (EP) and financial inclusion (FINC) in developing countries has not been given enough attention. This study applies a theoretical framework to define the optimal associations, which means it captures the best relations between FINC and EP. This research analyzes the impact of FINC on EP in a panel of 66 developing countries from 2004 to 2022. The countries selected constitute a broad set of developing economies with differing degrees of financial inclusiveness, institutional quality, government expenditures, economic growth, and human capital, thus making them representative of the developing world. The study employs dynamic common correlated effects and method of moments quantile regression estimation techniques to account for the varying effects that inclusion has on different quantiles. The main finding is that inclusion greatly lessens EP, which is its most significant contribution to the services of energy in developing countries. The study empirically validates the Armey curve for selected countries, demonstrating a nonlinear relationship between government spending and EP. This study adds to an enriched comprehension of this relationship and offers policy recommendations that enhance rural financial services with mobile banking and microfinance for clean energy investments and integrate financial literacy with energy initiatives. Strengthen governance and attract private investment through transparent regulations and public-private partnerships.
Introduction
The question of energy poverty (EP) remains a combative issue in numerous regions worldwide. Unlike their counterparts in developed nations, those in developing countries cope with meeting the rising demand for energy. The notion of “energy poverty” has ignited debate among investigators. The Over 2 billion people rely on solid biomass, kerosene, or coal for cooking, lacking access to clean cooking facilities. Household air pollution from these sources contributes to approximately 3.7 million premature deaths annually. Progress in clean cooking access has been significantly slower than in electricity access. 1 The United Nations Development Programme (UNDP) projects that EP will remain a significant challenge, with over 670 million people expected to lack electricity access by 2030. 2 Energy stands as a decisive driver of economic activity, assisting the contentment of basic human needs and the accomplishment of satisfactory living standards. Nevertheless, the extensive availability of affordable and environmentally friendly energy remains elusive, giving way to the issue known as EP. 3 In more precise terms, EP involves the insufficiency of sufficient, affordable, dependable, top-notch, secure, and eco-friendly energy services to sustenance both economic progress and human well-being. EP denotes to the condition where individuals and businesses lack consistent access to essential energy products. It is linked with the execution of the sustainable development goals (SDGs), particularly those intended at reducing poverty, eradicating hunger, enhancing health, encouraging gender equality, taking action on climate change and energy, and safeguarding biodiversity.4–8
The association between energy usage and social advancement is convoluted, and tackling EP holds worth for overall scientific and societal development. The International Energy Agency (IEA) summits that in developing nations, the lack of access to electricity or modern clean energy services often stems from financial and logistical challenges. Thus, these countries rely primarily on outdated solid bioenergy, lacking access to low-pollution and clean energy substitutes. The extensive use of highly polluting solid bioenergy adds to air pollution, unfavorably affecting public health, productivity, and educational outcomes.9,10 It is observed that the electricity access rate has increased from 87% (2015) to 91% (2021) over the years. Still, 675 million people lacked access to electricity in 2021, mostly in LDCs. Figure 1 shows the trend of EP in different regions.
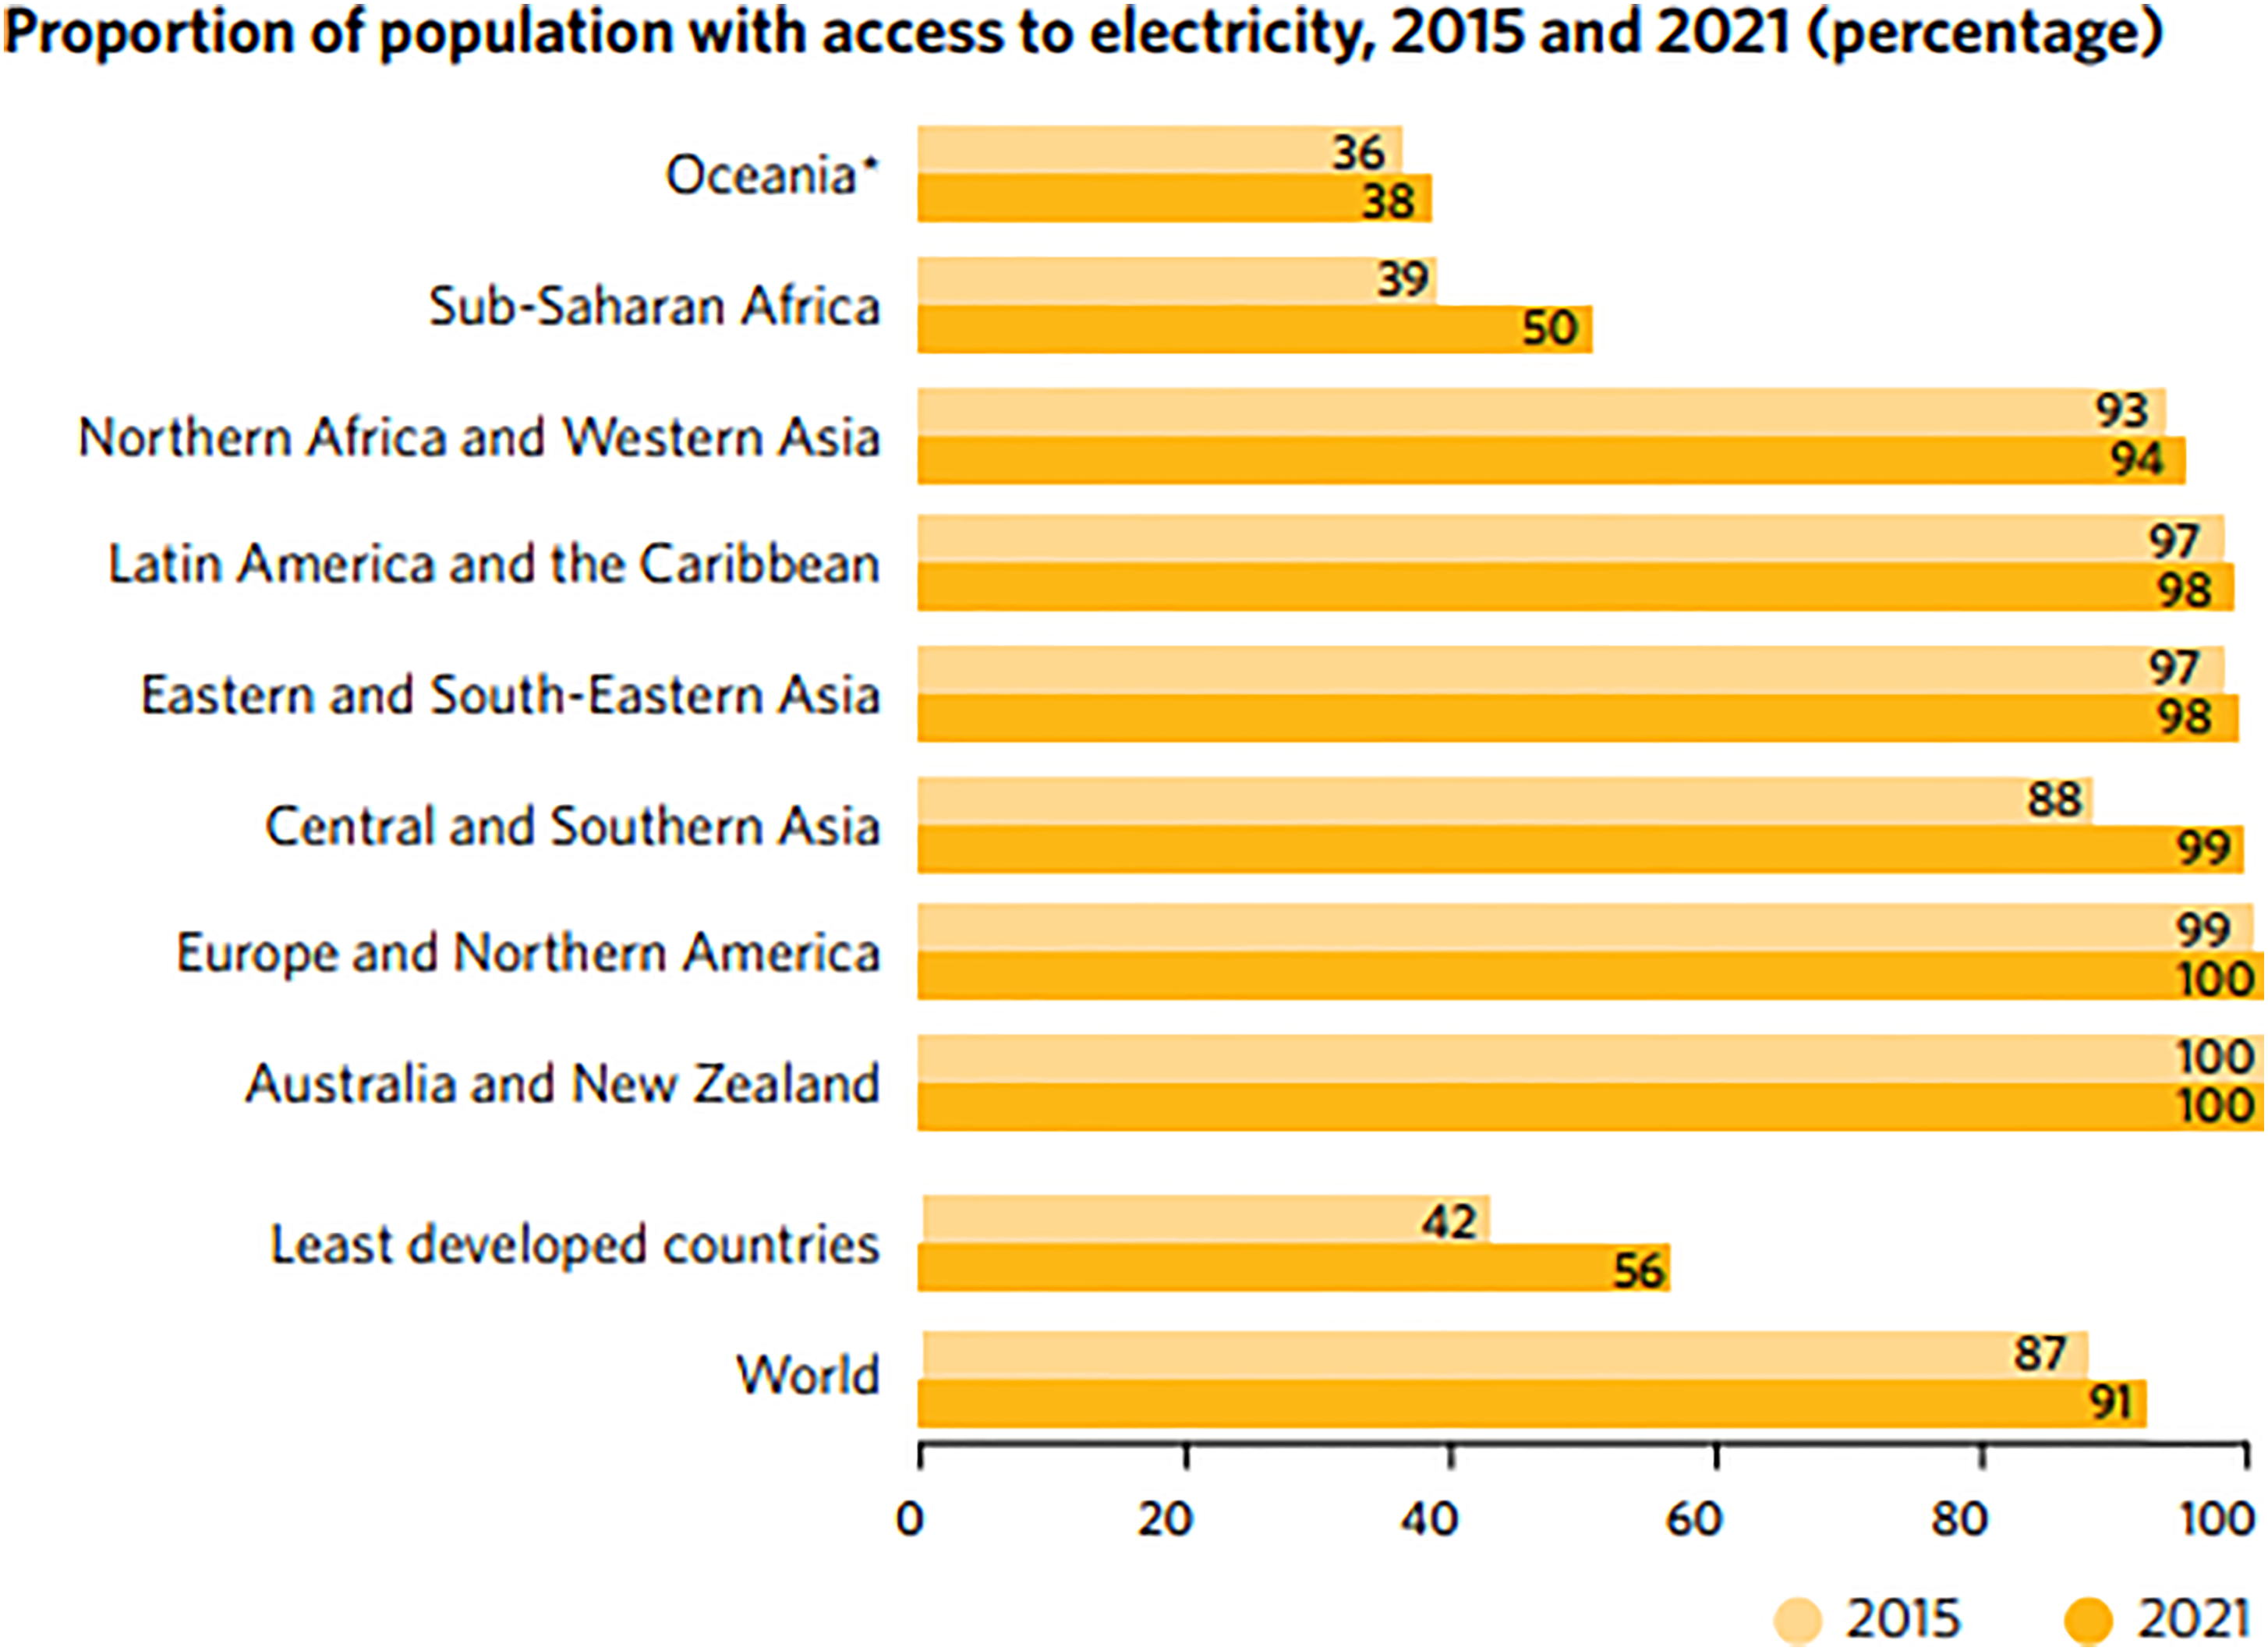
Trends of energy poverty in different regions.

Conceptual framework and hypothetical signs.
Financial inclusion (FINC) plays a key role in addressing EP by empowering access to formal financial amenities for low-income persons in Figure 2. Disparate financial development, which mainly satisfies to the affluent, FINC emphases on democratizing financial services, predominantly for those in need. By confirming that the economically disadvantaged have access to loans, deposits, and credit, FINC policies contribute to reducing EP on a worldwide. Furthermore, FINC is necessary for advancing efforts to alleviate EP, as it permits marginalized communities to involve in sustainable initiatives through avenues like green loans and financial assistance.5–8
This study contributes novel insights to the literature on FINC and EP by going beyond the conventional linear approaches and integrating a nonlinear fiscal framework, specifically, the Armey curve into the analysis, while also exploring previously under-examined interaction effects. Unlike prior studies that either focus solely on the direct impact of FINC or use country-specific analyses (e.g., Refs.5,11), our research offers a comprehensive panel-based investigation across 66 diverse developing countries using advanced econometric techniques such as the dynamic common correlated effects (DCCE) and method of moments quantile regression (MMQR) estimators. This enables the identification of heterogeneity and quantile-dependent relationships that traditional mean-based methods often overlook. Moreover, by incorporating interaction terms (e.g., FINC × IQ and FINC × HUC), our findings extend existing theories by showing that the effectiveness of FINC in alleviating EP is contingent upon complementary institutional and human capital (HUC) factors, an area that has not been thoroughly explored in the current literature. Therefore, this study not only validates but also enriches and challenges the prevailing theoretical frameworks, such as the energy ladder and fuel stacking theories, by introducing the moderating roles of governance quality and human development in the FINC–EP nexus.
Government expenditure stands as a fundamental pillar of fiscal policy, yet research into its impressions often yield mixed outcomes.12,13 Scholarly address advocates a potential trade-off between the advantages and downsides of government spending (GS). 14 Incremental spending by a lean government might foster economic growth concluded a crowding-in effect. Though, excessive public spending may lead to a crowding-out upshot detrimental to economic development. 15 Therefore, it may show nonlinear dynamics.
Our focus is increasingly drawn to developing countries due to their significant challenges with EP. At the same time, these regions are experiencing a notable surge in FINC. Over the past two decades, access to financial services has seen remarkable progress in developing countries. However, account ownership in these nations still falls short compared to high-income economies and the global average. This disparity highlights the need for more comprehensive research, as the current literature offers a limited perspective. To address this gap, further studies are essential to fully understand and enhance FINC in developing countries, aiming to bridge the divide and foster sustainable economic growth.
The study formulated the following hypothesis to check the determinant EP.
H1: Financial inclusion affects energy poverty. H2: Government expenditure affects energy poverty. H3: Institutional quality affects energy poverty. H4: Human capital affects energy poverty. H5: Economic growth affects energy poverty.
EP greatly intertwines with numerous socio-economic aspects illustrating the great intertwining of financial, institutional, and economic facets that comes with energy deprivation. FINC (H1) conveniently aids in solving the issue of EP by extending credit, savings, and microfinance to the marginalized populace which allows them to modernize their energy solutions. Government expenditure (H2) also greatly affects EP through public spending on energy infrastructure and other subsidies that aid in rural electrification and its accessibility, making it easier and cheaper for the public. Furthermore, the quality of institutions (H3) is an important factor where the existence of clear rules, good governance, and strong anticorruption institutions makes it possible for the people to receive energy as well as helps in the realization of energy projects. Furthermore, HUC (H4), consisting of education and skill, enable individuals to better their social status and enables them to make rational decisions in terms of the energy they use and the technologies employed to use energy efficiently. To some extent, economic growth (H5) improves EP by increasing people's incomes and bringing in new investment into energy infrastructure, but this is only to the level which such policies are inclusive within the economy. All these emphasize the inclusiveness nature of financial, institutional, and economic in solving EP, and aid in developing strategies to achieve sustainable development.
This research probes into the interconnection among FINC and EP, progressing standing studies in six momentous ways. Firstly, it is an exclusive inspection of the ramifications of FINC and GS on EP, a unique contribution to the literature. Secondly, the focus is concentrating towards developing countries, where the quick progress of FINC contrasts sharply with persistent EP despite plentiful natural resources. Given the considerable portion of the population lacking reliable electricity and clean cooking facilities, indulgent the link among FINC and EP is imperative for constructing effective policies. Additionally, developing nations are highly susceptible to the effects of climate change. Hence, it is essential to ascertain sustainable energy solutions that discourse both EP and environmental concerns. Thirdly, unlike conventional EP studies that merely measure access to electricity and a single aspect of FINC, we employ an ample approach. By utilizing four indicators each for EP and FINC, we construct a composite index, offering a more inclusive understanding of their relationship. Fourthly, we inspect both linear and non-linear connections, including interaction effects between FINC and EP. Fifthly, the findings are appropriate for addressing EP in developing nations, aligning with sustainable development goal 7 (SDG 7). As attaining the SDGs has become essential to domestic development agendas, this study bridges these goals with the imperative of energy access. Furthermore, to assist sustainable economic development, policymakers in developing regions entail a nuanced understanding of the implications of FINC and EP. Thus, this study will aid in the formulation of frameworks and policies pointed at meeting the SDGs by 2030. Lastly, advanced econometric techniques such as DCCE and MMQR are employed to address structural breaks and cross-sectional dependence, ensuring robust outcomes. These findings can serve as a blueprint for regions facing alike challenges, setting a precedent for effective policy responses globally.
The arrangement of remaining parts is as follows: In the “Review of literature” section, we offer a theoretical and previous empirical review. “Methodology” section outlines methodologies. “Results” section four delves into the results. This study formulates conclusions for each model in “Robustness check” section, integrates them, and offers policy recommendations.
Review of literature
Theoretical linkage
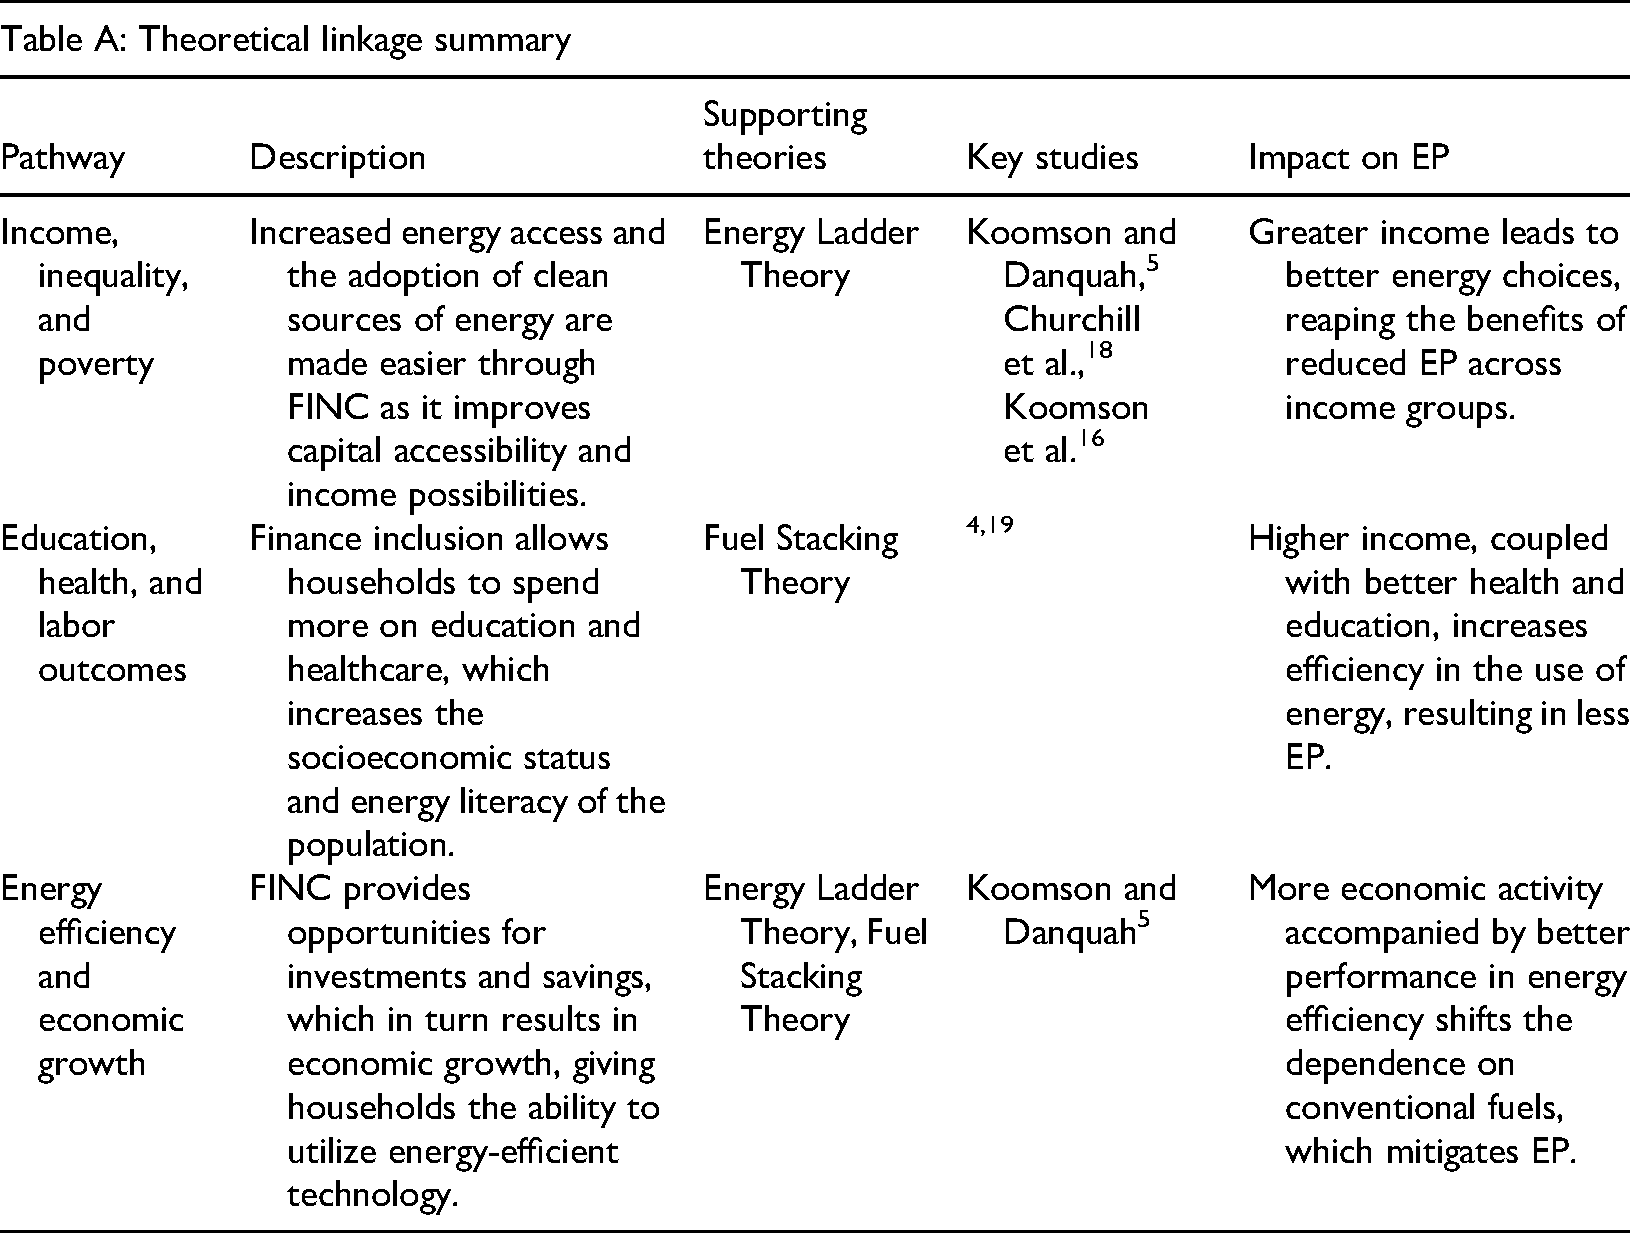
The income-strata model, as discussed by Koomson and Danquah, 5 suggests three major paths of interrelationship between FINC and EP. The first is broad-based household income, inequality, and poverty. There is a causal relationship, wherein the level of income equalization and inclusion reaped, the more inclusive energy consumption becomes. These resources allow households to invest in capital. In turn, this enables households to improve on, in order of numbers of goods and services, and thus income. Capital motivates households to upgrade their energy resources for multipurpose possibilities, eventually moving to cleaner options such as LPG or electricity. This is captured by the energy ladder theory. In doing so, it increases the ability to consume energy due to adequate income, which eliminates EP across almost all income groups. 16 These phenomena stimulate energy providers to broaden the energy services market to provide more of these benefits at lower prices. The influence of FINC on the distribution of income has impacts on EP. 17 There is an increasing and mutually reinforcing relationship between FINC and EP, as the initial evidence from a wide range of literature shows, in whom income functions as a link in the income hypothesis. 18
By improving educational, health, and employment opportunities, FINC has a notable impact on EP. Financial services facilitate households’ expenditure on education and healthcare, which enhances productivity and income, thereby alleviating EP. The fuel stacking theory considers changes in energy-using behavior resulting from economic growth to also be a function of urbanization, technology, and other components of the standard of living. This explains the theory's relevance to the study's framework as better educational and health indicators motivate households to adopt more sophisticated energy technologies. Increased FINC makes it easier to achieve financial literacy that serves enabling purposes, such as controlling and managing energy spending to prevent wastage. Through education insurance, FINC increases the level of schooling, which increases the likelihood of seeking higher education. More people who are educated understand energy-saving policies, which reduces the likelihood of EP among households. Observational data from India provides evidence of the negative relationship between EP and spending on education, illustrating how financing education helps mitigate EP.4,19 This illustrates how a household is empowered to manage education and resources through FINC and subsequently demonstrates how FINC has an intrarelational influence on EP.
Thirdly, FINC affects EP intimately through various channels, such as energy efficiency and economic growth. Economically, as referenced in the literature, FINC has a major impact because it enables the collection and distribution of savings and investments into economically productive activities. 5 There is economic enhancement, which engenders a growth in population wealth as well as income per capita in democracies. With increasing income, the population can utilize more energy and transition to cleaner, more efficient fuels. Consequently, EP decreases as per capita income increases, in line with the energy ladder theory. Various studies have highlighted how FINC benefits economies that have low income by fostering growth. Furthermore, FINC can influence EP by promoting energy efficiency. As households access financial services and see their incomes rise, they are encouraged to embrace efficient energy technologies. Hence, this pattern resonates with the fuel stacking theory, which posits that households with higher socioeconomic status and income levels tend to utilize a combination of energy sources, prioritizing those with better efficiency.
The Keynesian model argues that GS helps in economic growth and development by stimulating demand, while the neoclassical point of view agrees that GS increases investment, but it also raises interest rates and, therefore, “crowds out” private capital.20,21 At the same time, the Ricardian perspective argues that GS does not really affect economic activity since people tend to save in anticipation of future taxation. 22 Public finance argues that public spending, to a certain extent, is beneficial for economic growth due to improved public services provision. However, excessive spending tends to retards growth due to increased drain on resources in competition with the private sector and negative returns on privately funded investments. 23 This relationship has been captured by the Armey curve, which describes a nonlinear association between the size of government and economic growth, in particular an inverted U-shape. 24 This theory additionally posits that spending positively affects growth only to a point, after which it tends to ‘crowd out’ private investment and increases the inefficiency of resource allocation. Therefore, this suggests that the government can spend on critical components such as infrastructure and energy supply for poverty alleviation.
Empirical review
Studies supporting FINC as a tool for EP reduction.5–8,11,25–28 Previous literature grouped into different findings about the linkage of FINC with EP. Some concluded with EP alleviation with increase of inclusion. Koomson and Danquah 5 discovered that amplified FINC correlates with a drop in EP in Ghana. The study employed 2SLS regression and result found negative association between them. For instance, Dogan et al. 11 also explore the connection between FINC and EP in Turkey, discloses that FINC notably diminishes EP. This research explores how FINC affects EP, utilizing data from the 2018 in Turkey. The study employed a two-stage least squares approach, the study addresses the potential endogeneity issue. The results demonstrate that FINC significantly mitigates EP, especially in female-headed households. Xia et al. explore the link amid FINC and EP in China, highlighting the role of fiscal decentralization. Using multiple EP indices, the study finds that greater fiscal decentralization and country risks worsen EP, while economic growth, renewable energy, and technological innovation help alleviate it. The effects are the strongest for accessibility-related measures. Similarly, Apergis et al. 25 study over the period 2001–2016 in a panel of 30 developing countries also found the effect of FINC on EP. Using the generalized method of moments (GMM) estimation technique, this study scrutinizes the nexus amid FINC and EP. The results suggest that education reduces the occurrence of EP. Cui et al. 26 among all the nations, a comparative study across showed that improved FINC and green energy technologies are two vital strategies to tackle efficiently with EP problem. In this regard, we employed the spatial Durbin model on panel data of 40 countries in order to investigate factors driving positive economic inclusive growth (2010–2020). This paper found that Inclusive Growth shows significant spatial autocorrelation, and its determinants include FINC, renewable energy consumption. Inclusive growth was also down-modulated by the upgrade of industrial structures, while upgrading their efficiency weakened renewable energy's impact in this arena. These findings indicate that the policy must focus on expanding inclusive finance, optimizing energy structure and transforming economic development model to promote sustainable and balanced growth. Essel-Gaisey and Chiang 27 delve into the correlation concerning FINC and environmental poverty, focusing on the Ghanaian context. Environmental poverty holds significance in EP, as mitigating environmental issues can enhance energy production. This study centers on Ghana during the period from 2010 to 2015. The authors construct multidimensional indices of FINC, encircling factors. Khan et al.6–8 uncovered a link amid FINC and EP across six emerging nations covering 2004 to 2019. With the CS-ARDL model, their analysis showed a permanent link between EP and FINC. Using the ARDL approach, Li et al. 28 studied the link between FINC and EP in South Asian countries. They found out that widening the financial services to the poor households has a substantial influence on mitigating EP because of FINC.
Similarly, studies examining fiscal policies, public debt, and government expenditures.13,29–35 Whajah et al. 29 state that larger government size is associated with better inclusive growth positively and negative association approach to public debt to Inclusive growth. Divino et al. 30 are using data on 27 Brazilian states between the years of 2004–2010 to examine how GS affects economic growth. The study of Khurshid et al. 31 the effect of carbon taxes, environmental innovation and ecological policy on sustainable development goals and uses data from 15 Southern and Western-EU countries for the years (2000–2018). Whereas eco-innovations and environmental policies are capable of reducing emissions in both the long term as well as shorter-term basis, carbon taxes have a pronounced short-run influence on mitigation effort. Zhao et al.’s 32 findings, in a theoretical paper, explore the determinants of EP in European countries. Firstly, EP is alleviated in the sense that bilateral trade enhances access to (energy). However, globalization is also responsible for the rising prices of energy that has in turn led to more EP.
This study of Farooq et al. 33 employs advanced econometric methods to address the impact of debt on EP alleviation over 2000–2017 in developing countries within the OIC economies. Using four indicators to create an EP alleviation index, the study applies the dynamic common correlated effect estimator. Institutional quality (IQ) significantly influences this effect. The findings recommend maintaining public debt at an optimal level and enhancing institutional efficiency to improve EP alleviation in OIC countries. The research of Nguyen and Su 13 on public expenditures in EP for 2002–2015 across the 56 developing countries. The study identified an inverted U-shaped relationship with EP. Dimnwobi et al. 36 analyze the triadic relationship between EP, agricultural productivity and environmental degradation in Sub-Saharan Africa (SSA). The results indicate that EP aggravates environmental degradation, and as a result, agricultural productivity suffers. The study calls for the formulation of sustainable energy policies that would not only increase productivity but also conserve the environment. In Liu and Wang 34 investigates the international history of the fight against EP in a context that has questions of efficiency and sustainability in elimination of this disparity over long periods. The research is conducted utilizing a systematic literature review methodology and uses evidence from works that focus on government budgetary outlays regarding such undertakings. This illustrates the influence of GS on the expansion and development of infrastructure and the deployment of energy technology. In addition, other financial and regulatory incentives have shown how the private sector supremely positively participates in innovative activities in the energy sector. In an EU cross-sectional study, Kwilinski et al. 35 uncover the existence of a causal relationship between EP and democratic values by exploring how access to affordable, reliable electricity impacts economic stability, health outcomes, and democratic participation. This study uses a newly developed composite index employing the entropy method for EP and another existing indicator, namely the voice and accountability index (VEA) from World Bank to measure democratic governance in EU countries over 2006–2022. Results indicate VEA quality significantly increases EP index values.
As EP and FINC have many other forms of correlation, we are aware of how these two variables relate especially outside the advanced economies. There have been many studies showing how FINC can mitigate EP like providing credit, savings accounts, as well as insurance policies, which allows households to modernize their energy equipment. Moreover, most of these studies do not apply a big-picture theoretical framework that explains myriad factors such as socioeconomic parameters, institutional feature, and the ecologic one. The literature on the nonlinear interaction between FINC and EP, particularly how different degrees of FINC can have differing impacts of energy access is very thin. In addition, most empirical work based on cross-section data, which is not sufficient to capture the reality of the dynamics of the phenomena over time. There is a literature gap to appreciate the range of empirical analyzes seeking the paradigm of FINC and EP within new boundaries of regions and new methodological frameworks to better appreciate the phenomenon. Looking ahead, research will likely benefit from the use of longitudinal panel data, the examination of indirect pathways, and the incorporation of nonlinear frameworks to better understand the myriad ways FINC contributes to EP in various contexts.
Methodology
The primary independent variable under examination is FINC, while the dependent variable is EP. Financial development refers to the efficiency and depth of financial markets, while FINC ensures broad access to financial services. While interrelated, they are distinct; a developed financial system may still have exclusion issues. While financial development generally refers to the depth, efficiency, and stability of financial institutions and markets, FINC pertains specifically to the accessibility and usage of financial services by underserved populations. This study exclusively focuses on the latter. Policies should address both for inclusive growth.37,38 Additionally, several control variables have been integrated, such as government expenditures, IQ, economic growth, and the HUC index. A comprehensive description of these variables and their respective data sources is provided in Table 1. The study considers the 66 developing countries in analysis and a list of countries in given in Appendix A. The study covers the data range 2004–2022 on the basis of countries data availability. In this study, panel data from 66 developing countries were selected based on data availability. To address missing data, appropriate techniques were used to ensure accuracy and reliability. If missing values were minimal and randomly distributed, mean or median imputation was applied. For larger gaps, linear interpolation or multiple imputation methods were used to estimate missing values while preserving data integrity. 39 Countries with excessive missing observations for key variables were excluded to maintain robustness and ensure a balanced or nearly balanced panel for reliable empirical analysis. 40 Although country selection is influenced by data availability, the final sample includes countries from Africa, Asia, and Latin America, providing a representative cross-section. Nonetheless, we acknowledge the potential for selection bias, which may limit the generalizability of our findings to other developing nations not included.
Variable measurement and data source.
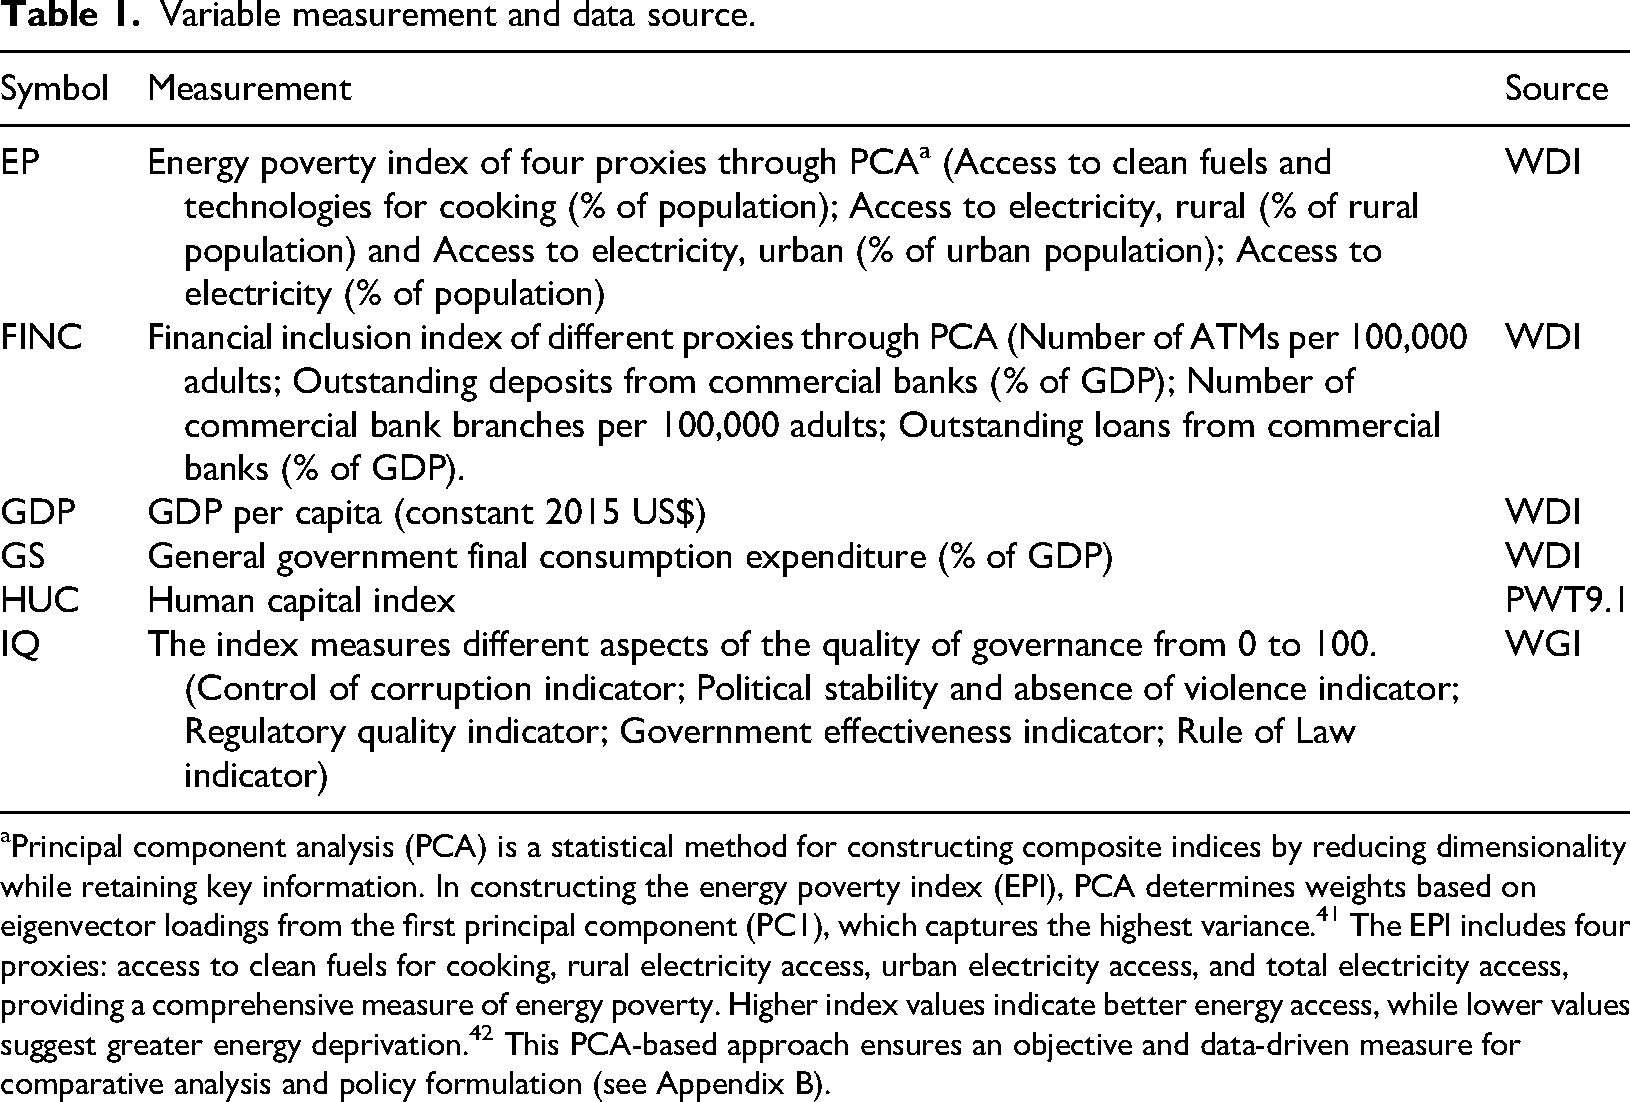
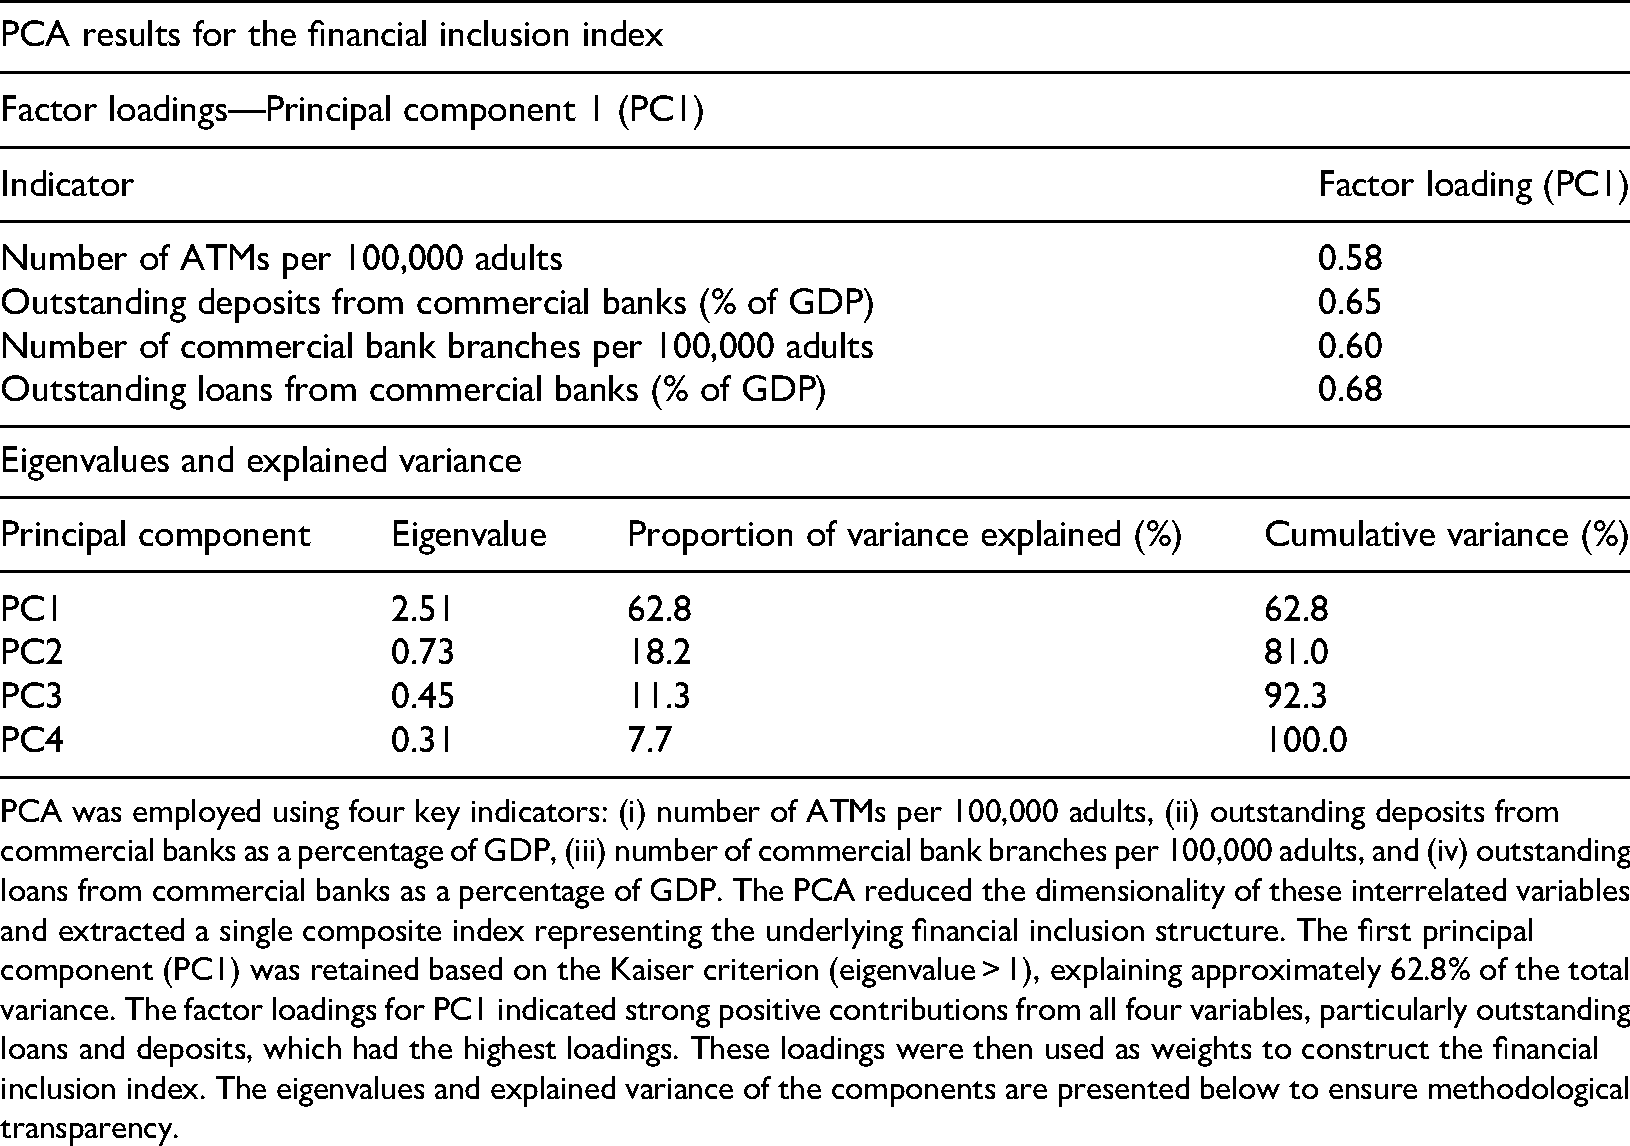
Principal component analysis (PCA) is a statistical method for constructing composite indices by reducing dimensionality while retaining key information. In constructing the energy poverty index (EPI), PCA determines weights based on eigenvector loadings from the first principal component (PC1), which captures the highest variance. 41 The EPI includes four proxies: access to clean fuels for cooking, rural electricity access, urban electricity access, and total electricity access, providing a comprehensive measure of energy poverty. Higher index values indicate better energy access, while lower values suggest greater energy deprivation. 42 This PCA-based approach ensures an objective and data-driven measure for comparative analysis and policy formulation (see Appendix B).
This study focused on the impact of economic growth, IQ, HUC, government expenditure, and FINC on reducing EP in developing economies. To estimate the theoretical relationships between FINC and EP as articulated in the theoretical linkage section of this study, the researcher modeled the dependency between those variables. This study rests on the Armey 43 curve incorporating the GS2 term as a squared one. In the literature on public finance, there exists an assumption on the presence of a nonlinear association, called the Armey curve, where GS leads to growth up to a point, then hinders growth beyond that threshold.23,24,44–47
Grasping the factors that contribute to EP requires one to choose different control variables, such as IQ, economic growth, and the HUC index. There is great supportive evidence for these variables as they either have been shown to directly or indirectly influence energy accessibility and affordability. This approach improves the accuracy of the findings because examining additional factors isolate the impacts of the focus variables. The level of IQ defined by governance, the rule of law, and degree of corruption has a lot to do with the level of EP. Good institutions can facilitate investment in energy infrastructure and the equitable provision of services, including access to energy resources.33,48 One of the direct drivers of EP is economic growth because as people's income rises, their access to energy improves. The availability of resources fuels higher spending on energy infrastructure, the subsidization of energy, and the provision of energy services. 49 A core component of investment in economic growth is education, which results in the creation of HUC.
Improving finances enables households to access various resources such as energy services, thus reducing EP.5,25 Control variables are chosen based on EP's empirical and theoretical accounts. Government stability (GS), IQ, HUC, and GDP are important economy and governance determinants of the impact of FINC. GS and IQ capture the governance framework that determines access to finance, while HUC is the embodiment of the knowledge and skills required to use the financial services offered. GDP is an economic variable that affects energy spending and investment in energy infrastructure. These factors were selected because of the documented relationships between these variables and financial and energy outcomes, which makes the model adequate.
The model specification is as follows:
In equation (1), the various components such as EP, FINC, GS, IQ, HUC, and GDP are defined as EP, FINC, and GS along with its square term (GS2), IQ, HUC, and economic growth, respectively.
To construct a composite index for the EP indicators, principal component analysis (PCA) is applied following the procedure of the study
3
with the provided expression:
PCA evaluates the degree of contribution each indicator has on overall variation as defined by FVi in equation (2). These contributions to the standardized variance are termed as the weights from PCA and are utilized to compute PCA as a linear combination of the four variables, which are proxies for EP.
In the measurement of IQ, different indicators are used, but governance indicators are the most common ones.50,51 In this study, we utilize six governance indicators, listed in Table 1, as proxies for IQ and four indicators for FINC. Although each indicator captures different aspects of IQ and FINC, incorporating all of them into a single model might lead to multicollinearity due to their high intercorrelation.6–8 To address this issue, we follow previous research by applying PCA to create a single composite IQ index and FINC index, which enhances analytical power and mitigates multicollinearity.52,53
Figure 3 shows the econometric strategy for this study. This show the complete flow chart of empirical strategy.
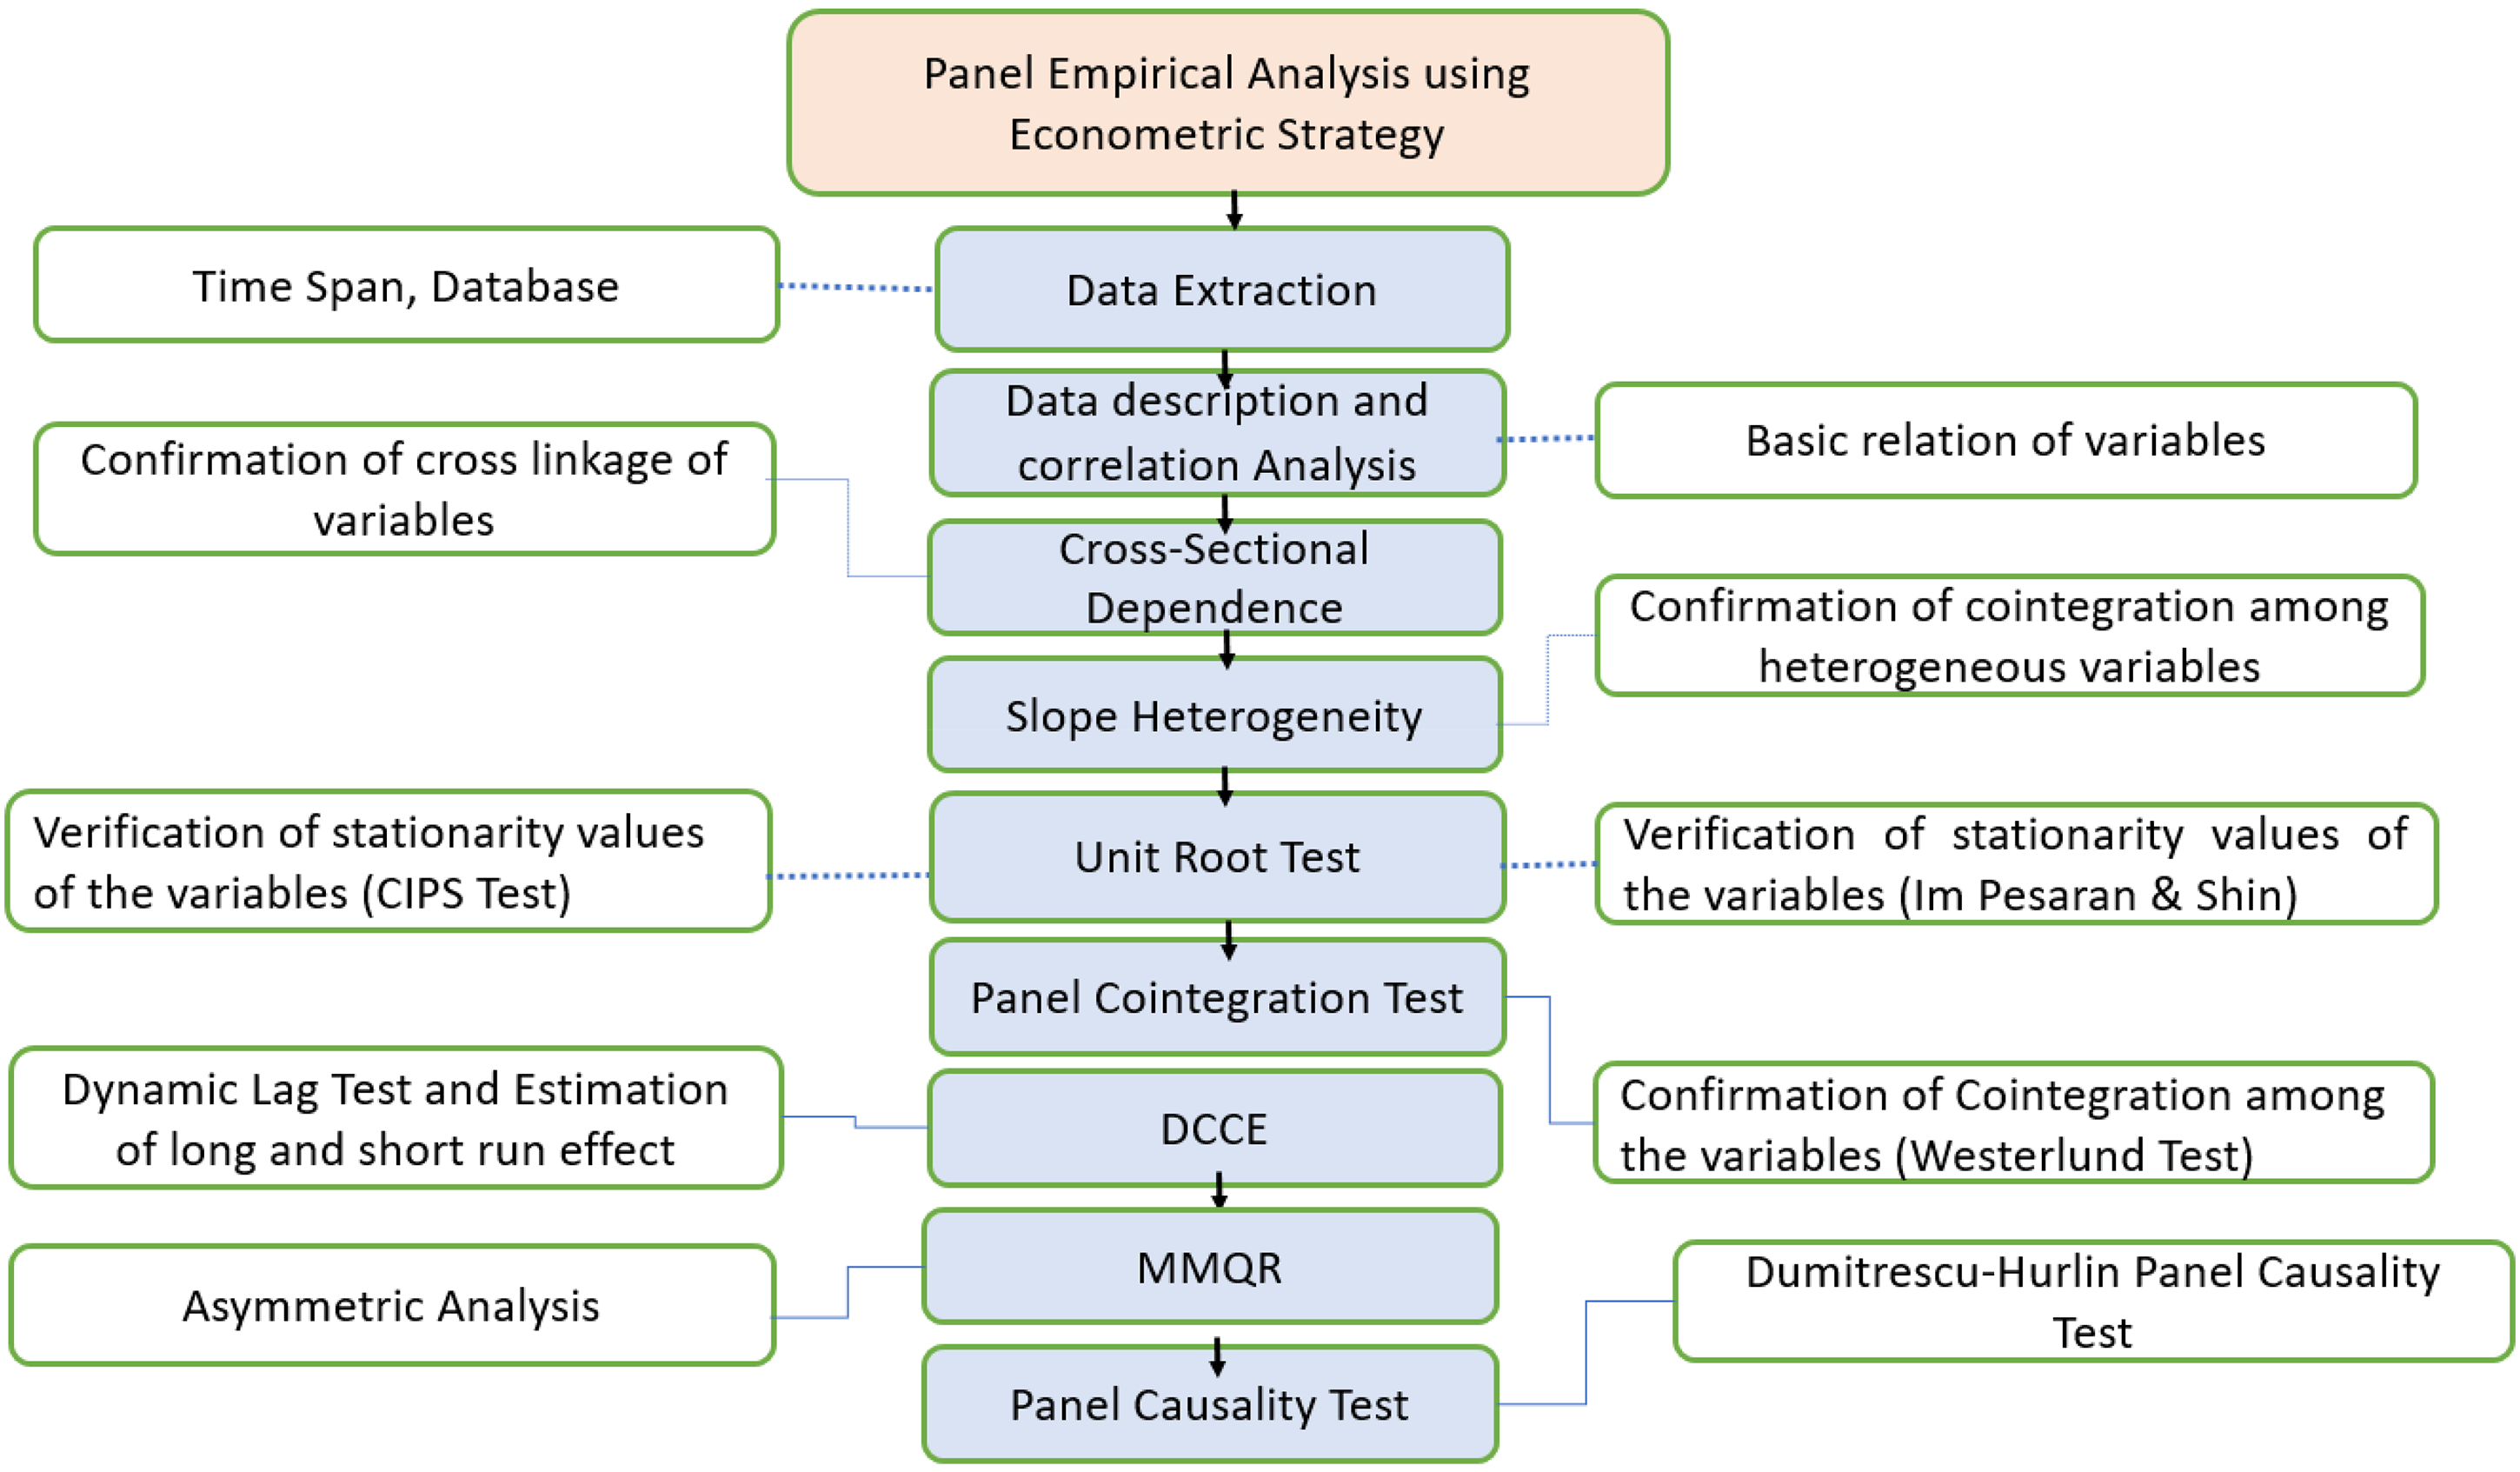
Panel empirical analysis strategy.
Cross-sectional dependence
Panel data analysis often pivots on assessing cross-sectional dependence, a feature pivotal for correct estimation. This dependency, if unaddressed, can announce bias, inconsistency, and inefficiency into coefficient estimates. Especially in the realm of variable association, cross-sectional correlations within sample data are common. 54 Consequently, shocks or policies affecting one nation may resound across borders. Given these dynamics, it' imperious to scrutinize cross-sectional dependence before probing into variable unit root estimation. Such dependence be present, espousing a second-generation method proves more suitable than the first-generation counterpart. 55
Unit root test
Due to the presence of cross-sectional dependence, the data undergoes second-generation unit root tests to avoid misleading upshots. Specifically, the cross-sectionally augmented Im-Pesaran-Shin (CIPS) test, pioneered by Pesaran, 56 is utilized. These methodologies effectively address the cross-sectional dependence among the individual units. Traditional unit root tests become untrustworthy in the occurrence of cross-sectional dependence. The introduction of the CIPS test addresses this issue, offering dependable estimates.
Slope homogeneity test
Additionally, a slope homogeneity test developing by the Pesaran and Yamagata. 57 Rejecting the null hypothesis signposts the presence of slope heterogeneity within the provided panel sample.
Cointegration test
Since all-time series are nonstationary, the next step is to assess the co-integration links between them, as noted by Westerlund. 58 It provided residual-based panel data testing that does not require the elimination of temporal dependence in the data set, which is very convenient.
DCCE estimation method
Different aspects may cause systemic shocks similar to those seen during the global financial crisis that could have cross-sectional dependence consequences. If unaccounted variables are connected with the independent variables in regression models, those problems can produce results that estimates are ambiguous. The solution provided by Chudik and Pesaran
59
in cases where there is CSD and slope heterogeneity is the use of DCCE. This approach successfully tackles these difficulties through the application of the dynamic common correlated effects estimator.55,60 The study prefer the DCCE estimator over the Common Correlated Effects Mean Group (CCEMG) estimator due to its superior capability in managing both slope heterogeneity and cross-sectional dependence in dynamic panel settings. The DCCE estimator, developed by Chudik and Pesaran,
59
extends the traditional common correlated effects (CCE) framework by incorporating lagged values of cross-sectional averages of both the dependent and independent variables. This feature allows it to account for unobserved common factors that might be correlated with the regressors, such as global shocks or regional spillovers which are typical in macro-panel data comprising multiple countries.
59
By including these cross-sectional averages, the estimator effectively controls for cross-sectional dependence stemming from shared external influences across countries.61,62 Additionally, the DCCE estimator is designed for dynamic panels, where past values of the dependent variable influence current outcomes. This is especially relevant in studies of EP, which tend to exhibit inertia due to the gradual nature of infrastructure improvements and policy implementation. Unlike the static CCEMG estimator proposed by Pesaran,
61
which averages heterogeneous slope coefficients across cross-sections while including contemporaneous cross-sectional means, the DCCE estimator adds lag dynamics and better captures temporal persistence in the data.

This research also used the Dumitrescu and Hurlin’s 63 approach to establish causality between the variables. The reason for selecting Dumitrescu and Hurlin 63 was that it effectively deals with heterogeneity and cross-sectional dependence in the panel data, things that are overlooked by the traditional Granger causality test. Moreover, this procedure is proficient at offering robust estimates even with limited sample sizes.
MMQR estimation method
Research on panel data consistently encounters heterogeneity, necessitating the identification of such variations. The existence of heterogeneity in panel data introduces uncertainty into the final upshots, raising questions about whether the results stem from genuine associations or are distorted by the observed heterogeneity. However, not all panel estimation techniques hold the capacity to discriminate and address this heterogeneity. Hence, a specific technique is required for this purpose. Given the likelihood of encountering heterogeneity, the current study opted for a quantile-based approach capable of effectively managing such variations.
Quantile-based techniques are chosen for their ability to address heterogeneity by examining relationships in connection with quantiles. The utilization of a quantile-based technique was first observed in the panel study by Koenker and Bassett.
64
Even though it remains tethered to the classical OLS method, quantile-based estimates are much more flexible because of their focus on quantile linkages. These techniques are also robust to outliers, which improves estimates relative to traditional methods. Unlike average-based tests, quantile-based assessment procedures, as shown by Binder and Coad,
65
produce results from a far more considerate approach to the data, which yields insightful findings. Out of the many options in the quantile family, the current study selected Machado and Silva
66
MMQR. In adding to dealing with heterogeneity and outliers, as Canay
67
argue, this method is also effective in the occurrence of serious fixed effects distortion of the outcome. It also improves the robustness of the output by using the estimate from the overlapping calculations during estimation processes. The quantiles denoted as Qy(τ/X), which contribute to the outcome through the quantile-based associations amid explanatory and explained variables.
Explaining equation (1) in more detail, the calculation of parameters and probability description is elaborated as follows: P{δ1 + Z′itγ > 0} = 1.
(α, β′, δ, γ′)′. Additionally, the fixed effects of the cross sections are represented by i, represented as (αi, δi), i = 1, …, n. Furthermore, X symbolizes the reflection of components with k reflecting vectors which are assumed to be known. These vectors are further described through Z, illustrating the transformation resulting from differentiation. Moreover, Z includes modules denoted as l, expressed in equation (6).


Pertaining to equation (3), the vector computed for the predictor variables is represented by X′it. Additionally, to enhance reliability, a natural logarithm was applied to all studied variables, considering their varied measurements, thus making them more homogenous. Consequently, the computed quantiles of the regressand variable are denoted by Qy(τ /Xit), and the natural logarithm is reflected through Yit. These computations are performed according to the order of predictor variables.
The optimization of the computed quantile for the τth sample, denoted as q(τ), is obtained by minimizing the following expression:
Referring to equation (8), the assessing function ρτ(A) = (τ−1)AI{A ≤ 0}+TAI{A > 0}. Additionally, based on the hypotheses, five predictor variables (FINC, IQ, GS, GS2, HUC, and GDP) are considered, with EP reflecting the dependent variable EP. The outcomes of this optimization are further elaborated in the subsequent section.
The MMQR and DCCE estimation techniques were chosen for their ability to handle heterogeneity, cross-sectional dependence, and nonlinear relationships in panel data. MMQR captures varying effects across different quantiles, offering deeper insights than mean-based methods like OLS or GMM. 66 At the same time, DCCE accounts for cross-sectional dependence, which reduces bias from unobserved common shocks, thus making it better than traditional panel models. 59 These methods ensure robust, policy-relevant findings in economic and environmental studies.
Results
Table 2 displays the correlations among the variables under study, namely FINC, GS, IQ, HUC, GDP, and EP. Notably, there is a significant negative correlation between FINC and EP. In addition, GS, IQ, HUC, GDP, EP, and every one of them are deeply interrelated.
Correlation matrix.
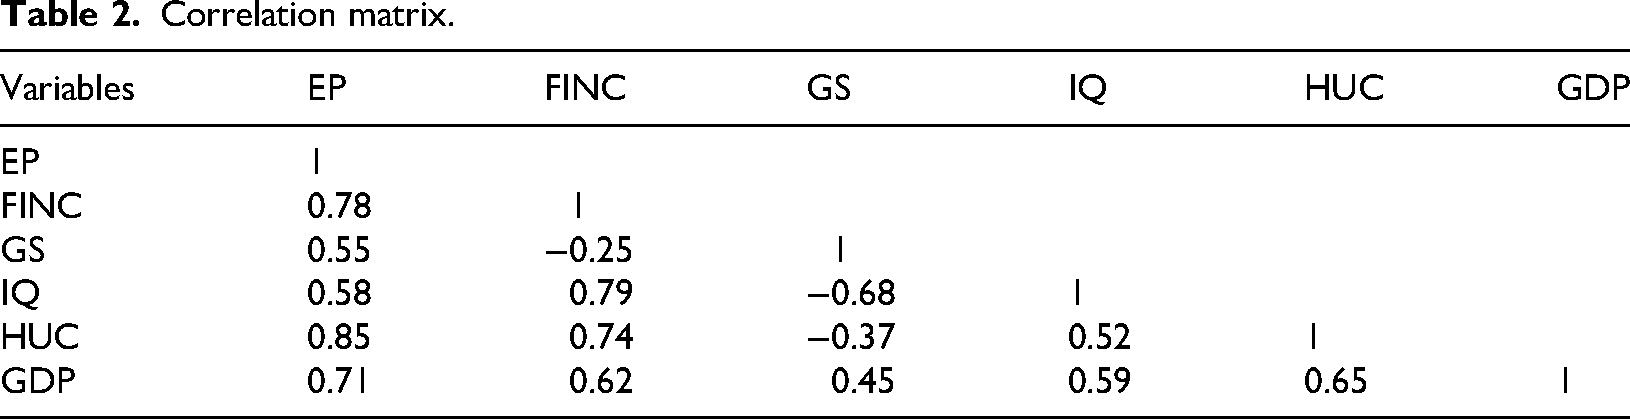
Table 3 reveals that the probability values from the CD test for FINC and EP are highly significant, indicating rejection of the null hypothesis at the 1% level. These findings strongly suggest the presence of considerable cross-sectional dependence within the panel data. The analysis of other control variables similarly highlights this cross-sectional dependence. Hereafter, it is imperative to account for such dependency when conducting empirical analyses on panel data. Table 3 also displays the findings of the slope homogeneity test by Pesaran and Yamagata. 57 The results indicate rejection of the null hypothesis of slope homogeneity, suggesting the presence of slope heterogeneity within our panel sample.
Heterogeneous slope coefficient and cross-section dependence test.
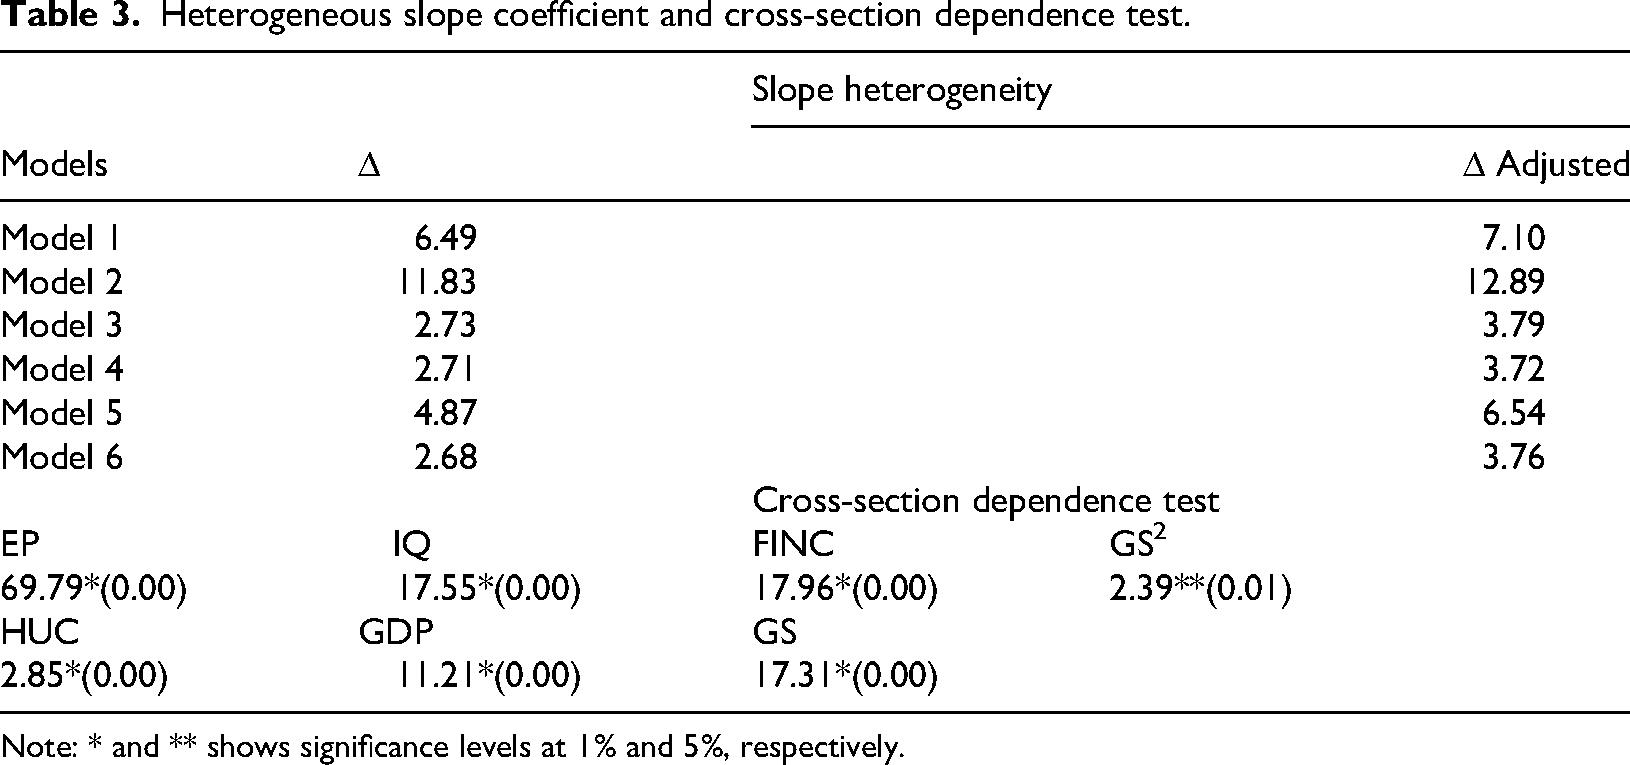
Note: * and ** shows significance levels at 1% and 5%, respectively.
Table 4 presents the stationary test outcomes of Pesaran's CIPS Test. 56 The result indicates all variables are stationary at order (I(1)), with the exception of IQ and GS2, which remains stationary at both I(0) and I(1). This test results allow further investigation direction about concerned methodology that provides reliable results.
Stationary tests.
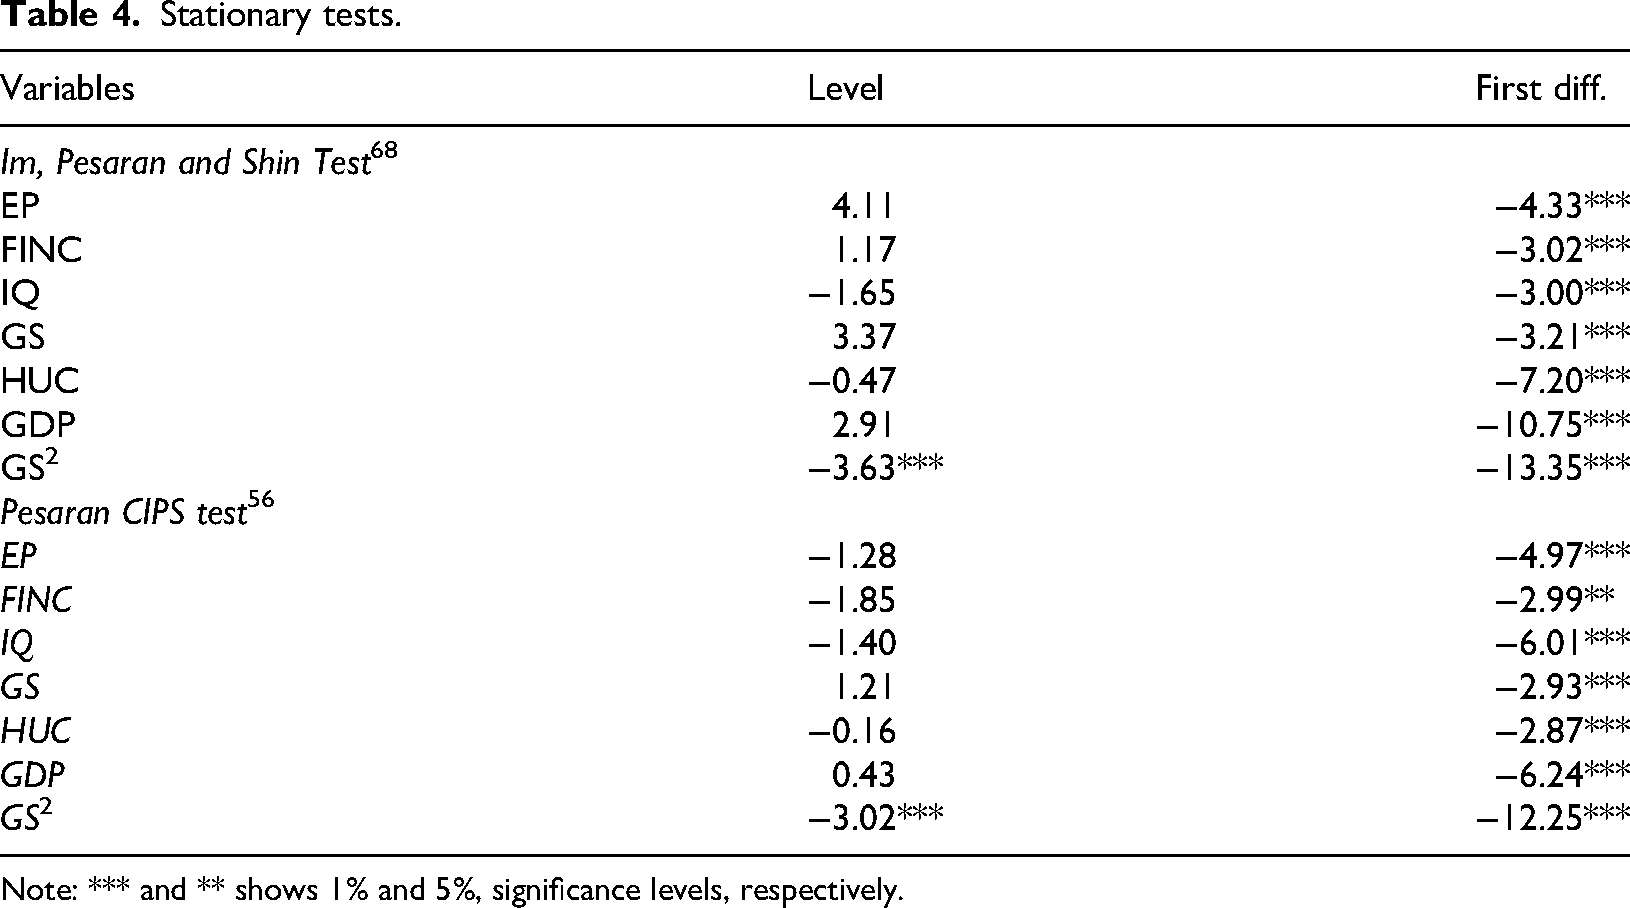
Note: *** and ** shows 1% and 5%, significance levels, respectively.
Cointegration test.
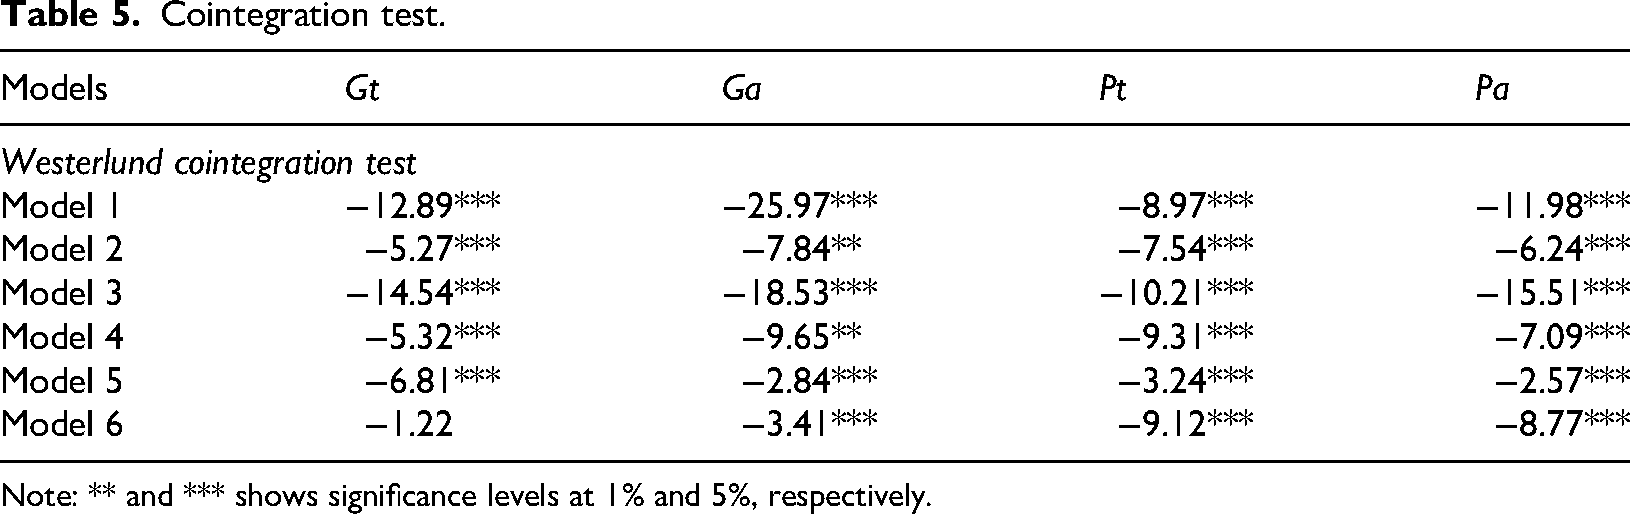
Note: ** and *** shows significance levels at 1% and 5%, respectively.
Westerlund 58 cointegration applied for variables association (see Table 5). Across all models (1–6), the probability values of Ga, Gt, Pa, and Pt demonstrate high significance, leading to the rejection of the null hypothesis that suggests no cointegration. This indicates substantial long-term connections among FINC, GS, IQ, HUC, GDP, and EP.
The research utilizes the DCCE method, with findings presented in Table 6. The empirical evidence consistently demonstrates a positive and significant relationship between FINC and the alleviation of EP across all models (1–6). This implies that improved access to financial services correlates with a reduction in EP, leading to increased availability of clean fuels and technologies for cooking, among other benefits. Moreover, the upshots indicate that financial services level in developing nations plays a key role in accelerating the eradication of EP. One possible drawback is the risk of financial instability due to over-lending, where excessive credit expansion, particularly in weak regulatory environments, may lead to high default rates and banking sector vulnerabilities. 69 Additionally, unequal access to financial resources may lead to disparities, where only certain groups benefit from FINC, exacerbating socio-economic inequalities. 70 In addition, if these households experience minimal income growth to repay the loans, short-term credit reliance due to energy-focused investments may place them under an unaffordable debt burden. 71 Such issues warrant appropriate regulations around lending, FINC, and access to financial literacy to ensure sustainability in economic opportunities accompany energy inclusivity. While FINC has demonstrated strong potential in mitigating EP by enhancing access to financial services, it is equally important to acknowledge the potential risks it may pose if not carefully managed. One such concern is the risk of over-lending, particularly in under regulated environments, which can lead to financial instability among low-income households. Empirical evidence from Kenya's mobile lending boom illustrates this issue: the rapid expansion of digital credit led to a surge in short-term borrowing, resulting in increased default rates and the exclusion of many borrowers from formal credit systems due to negative listings on credit registries. 72 Similarly, in Bangladesh, while microfinance schemes have supported investments in solar energy and improved household welfare, some borrowers have faced unsustainable debt burdens due to high interest rates and limited repayment capacity. 73 These examples highlight that without accompanying measures such as financial literacy programs, consumer protection policies, and robust regulatory frameworks, FINC may inadvertently increase vulnerability among the very populations it seeks to empower. Therefore, policies aimed at promoting inclusive finance must also prioritize responsible lending practices to ensure long-term sustainability and resilience.
DCCE estimation method.

Note: Values in brackets denote the SE. ** and *** denotes the significance levels at 5%, and 1%, respectively.
Further, the analysis supports the impacts of GS and its squared term (GS2) over EP within all models. This demonstrates the application of the Armey curve theory in the context of EP through observing both its positive and negative aspects. The nonlinear effect of GS indicates that while moderate and well-targeted expenditure aids in lessening EP, poorly managed or excessive expenditure leads to an opposite outcome. Thus, to effectively alleviate EP, there needs to be fiscal discipline and efficient allocation of resources. These results corroborate the findings of Fang et al., 74 Koomson and Danquah, 5 and Murshed and Ozturk, 75 validating the strong relationship between FINC and EP. Such financial inclusivity indicates that the lack of expensive financing results in more access to energy under most circumstances. However, the results diverge from Zhao et al., 76 who found no significant impact of FINC on EP in the Republic of Korea, possibly due to differences in economic structure, energy policies, or financial market maturity. This contrast highlights the context-dependent nature of FINC's effects and underscores the need for tailored policy approaches.
GS impact on EP exhibits both linear and non-linear effects. Notably, model 6 demonstrates consistent negative impacts of the GS2 on EP. The DCCE estimation method, confirm findings, suggesting an inverted-U association amid GS and EP. Moreover, this implies that an increase in GS could decrease EP, while excessive spending would worsen the problem; a U-shaped correlation indicates. The results designate that strong IQ has the probable to lessen the opposing effects of GS on EP. This means that spending to combat EP becomes less ineffective with great IQ. This conclusion complements the observations made by Apergis et al., 25 who notice that education mitigates the burden of EP in developing poor regions. Less educated people consume more energy and are first satisfied by primary energy sources. In addition, high levels of education increase the embrace of energy-efficient products. This illustrates the large contribution educated individuals have in overcoming EP. The results suggest that IQ improves the effect of FINC on EP through effective regulation and access to finance. Strong governance has led to financial sector reforms in Rwanda, improving access to energy in rural areas. 77 On the other hand, weak institutions in Nigeria have limited the efficacy of FINC in combating EP. 78
Similarly, GDP has a quantifiable positive influence on EP. This implies that the growth of the economy in these synergistic countries has improved the availability of fuels and technologies for homes and kitchens, albeit at the heightened cost of energy expenditure. In relations of the EP accessibility dimension, these conclusions counter the claims made by Said and Acheampong, 79 who contended there is a negative correlation between economic advancement and EP in SSA countries.
The study's findings explicitly connect back to the hypotheses, confirming them based on empirical results. H1 is confirmed, as FINC significantly reduces EP by improving access to financial services that facilitate energy investments. H2 is partially confirmed, with government expenditure showing a nonlinear effect moderate spending reduces EP, but excessive spending may lead to inefficiencies. H3 is confirmed since IQ facilitates governance and regulatory frameworks, which increases energy access. H4 is confirmed, as HUC is a contributing factor in the reduction of EP due to the adoption of technology and energy-efficient practices. H5 is confirmed because in reducing EP, enhanced economic growth increases energy value, augments infrastructure development, and makes energy easily accessible. These findings confirm the expectations aligned with theoretical frameworks and emphasize important policies.
It is quite intriguing that foresightedness factors like (FINC × GS), (FINC × IQ), (FINC × HUC), and (FINC × GDP) exhibit the impact which boost the impact of FINC on EP and how these interaction terms affect the outcome. In multifaceted social and economic systems where numerous variables interact in intricate ways, it is often necessary to go beyond looking at interaction terms in statistical models because they account for effects that cannot be captured by individual contributions only, which is often the case in systems where relationships are non-additive. They allow us to analyze the moderating effect more clearly. The influence of FINC on EP through the prism of GS, IQ, HUC, and Gross Domestic Product (GDP) emerges through interaction terms (FINC × GS), (FINC × IQ), (FINC × HUC), (FINC × GDP) and thus in need of these interactions to be analyzed, given they are all theoretically supported. These elements strengthen the relationships that other sophisticated analyses would ignore, enabling better fitting models and improving models along with their context-specific effect analysis, enabling more sophisticated understanding, precise prediction models, and impact-informed policy analysis. These findings are critical. They show that the policies must change by adopting a more comprehensive methodology focused on FINC along with other governance and institutional reforms, HUC development, and economic growth policies, integration which empowers achieving sustainable energy access. The interaction terms included in the analysis such as (FINC × IQ) and (FINC × HUC) carry important implications for policy design. These terms indicate that the effectiveness of FINC in reducing EP is significantly influenced by complementary factors such as governance quality and human development. For example, the positive and significant coefficient of (FINC × IQ) suggests that FINC has a stronger impact on EP alleviation in countries where IQ is high where regulatory frameworks, anti-corruption measures, and service delivery mechanisms are robust. This implies that in weak institutional settings, FINC alone may not yield substantial improvements unless paired with governance reforms. Similarly, the significance of (FINC × HUC) highlights the role of education and skills in enhancing the effectiveness of financial services; households with higher HUC are more likely to make informed financial decisions, invest in clean energy solutions, and manage credit responsibly. Policymakers should therefore interpret these findings as a call for integrated policies: promoting FINC must go hand-in-hand with improving institutional governance and HUC development to maximize its impact on energy access. Rather than standalone initiatives, multi-sector strategies that combine financial, educational, and institutional reforms are more likely to produce sustainable and inclusive energy outcomes.
The results of MMQR are tabulated in Table 7. Interestingly, the findings of MMQR in Table 7 suggest that FINC has a statistically significant positive effect on EP in the 10th to 90th quantiles. In any case, these estimates suggest that the impact FINC has on EP decreases as the quantile increases. This is, however, consistent with earlier findings. The impact of incorporating GS² in the model is to capture possible non-linear impacts whereby GS may have a positive effect on a country's or region's economic and environmental activities at lower levels but results in inefficiencies at higher levels. 80 While no formal nonlinearity test is applicable, the MMQR captures the varying impact at different quantiles, which, without explicitly showing, attend to non-linear functions of the quantile variables. 64 The specification is flexible, consistent with other works that impose quadratic terms to explore threshold responses within economic models. 81
MMQR estimation results.

Note: *, **, and *** shows significance levels at 1%, 5%, and 10% respectively.
Causality test.

Also, Table 7 shows that FINC has positive impacts on EP in the interaction terms (FINCGS, FINCIQ, FINCHUC, and FINCGDP), confirming the relevance of the Armey curve in developing countries. Despite the evaluated coefficients on the effect of FINC on EP becoming less pronounced at higher quantiles, it remains significant only within the quantiles. This means that with higher levels of FINC, there is a reduction in EP due to increased access to electricity among the economically disadvantaged. In essence, FINC significantly benefits lower-income groups by bolstering their electricity access, consistent with prior research by Dogan et al. 11 This underscores how the expansion of FINC in SSA countries parallels the heightened access to energy and electricity among individuals, coinciding with the enrichment of the banking system. The MMQR results indicate a significant negative correlation between GS2 and EP that consistent with previous findings.
The study employs the Dumitrescu and Hurlin panel causality method to investigate causal connections (see Table 8). The results of the panel causality test indicate a bidirectional causality between FINC, GS, and GDP, and both dimensions of EP. Conversely, IQ and HUC exhibit a unidirectional causality with EP. This implies that policy interventions in FINC, GS, and GDP significantly influence EP in developing nations.
Robustness check
To formally validate the presence of nonlinearity, we employ Hansen's 82 panel threshold regression. The findings in Table 9 confirm a statistically significant threshold effect, supporting the inverted-U relationship suggested by the Armey curve. The results of Hansen's 82 panel threshold regression provide robust evidence of a nonlinear relationship between GS and EP, confirming the presence of a threshold effect. The estimated threshold value for GS is 4.75, which separates two distinct regimes in terms of policy effectiveness. Below the threshold (GS ≤ 4.75), the coefficients for key variables—including FINC, IQ, HUC, and GDP—are all negative and statistically significant, suggesting that increases in these factors substantially reduce EP. Notably, FINC shows the strongest marginal impact (–0.284), indicating that expanding access to financial services is particularly effective when public spending is moderate. Above the threshold (GS > 4.75), the coefficients for these variables weaken considerably and become statistically insignificant in most cases. This indicates diminishing returns to GS, consistent with the inverted-U hypothesis of the Armey curve. When public spending exceeds the optimal threshold, its efficiency in reducing EP declines—possibly due to misallocation, inefficiencies, or bureaucratic constraints. The significant F-statistic (14.62) and bootstrap p-value (.017) further validate the threshold effect. These results imply that well-calibrated fiscal policies, combined with strengthened FINC, institutional governance, and HUC investment, are crucial in alleviating EP—especially when public spending is maintained at optimal levels.
Hansen's panel threshold regression results. 82
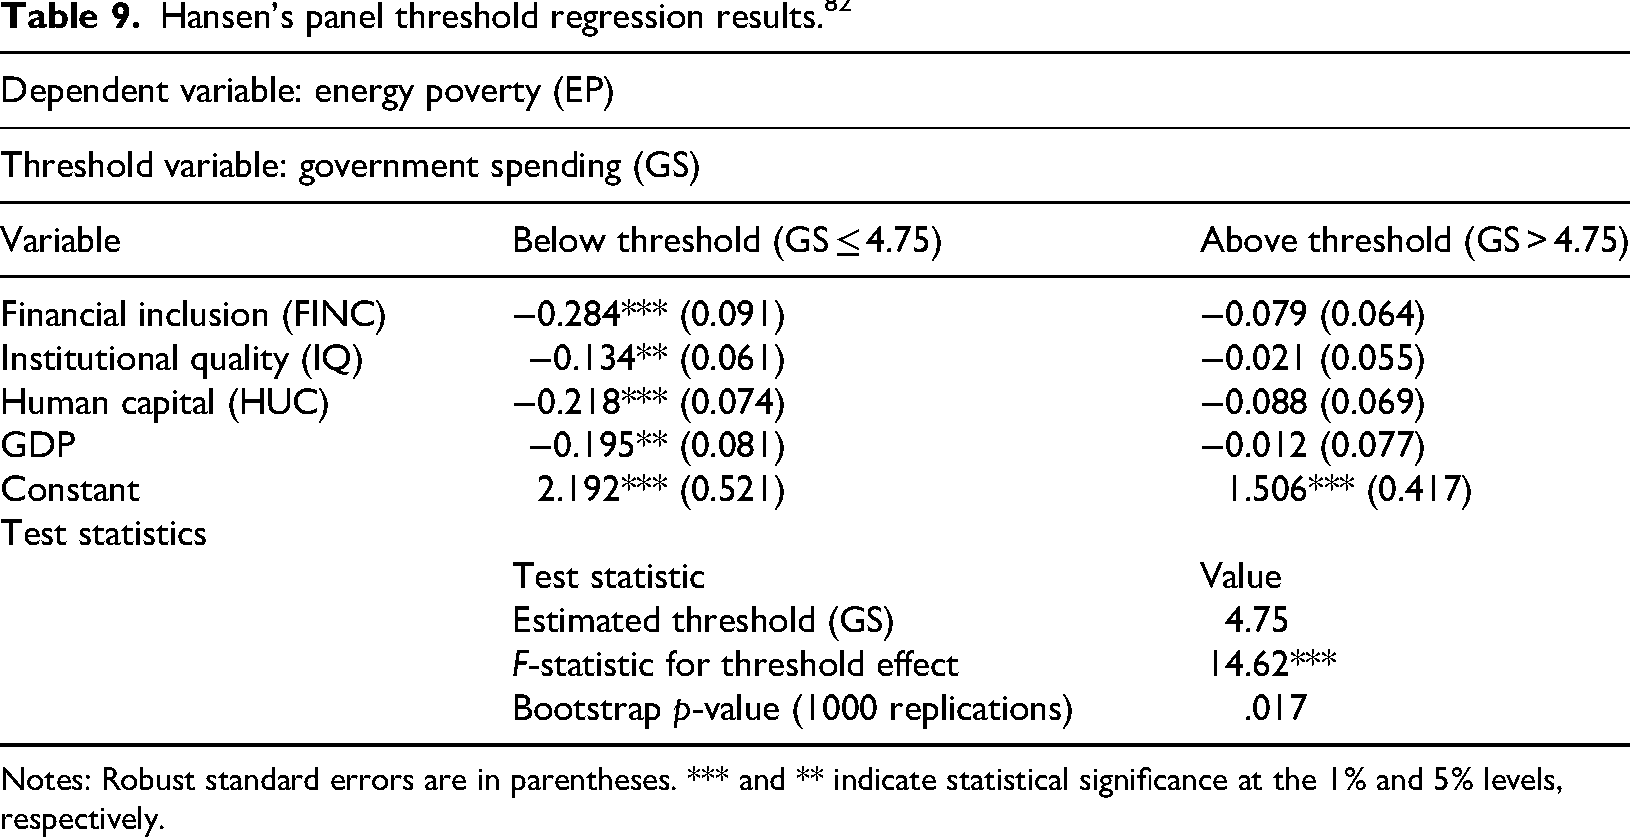
Notes: Robust standard errors are in parentheses. *** and ** indicate statistical significance at the 1% and 5% levels, respectively.
Conclusion
This research analyzes the effect that FINC has on overcoming EP, using panel data from 66 developing countries over the period of 2004–2022. The DCCE and MMQR methods are applied to close the gap on the relationship between FINC and EP reduction, addressing an important area of the available literature. Its main theoretical contribution is to the discussions on FINC and EP by showing how deteriorating EP through clean cooking technologies, fuels, and electricity access is enhanced in its mitigation by FINC in developing countries. The research also found out that the effect of FINC on EP is pronounced and varies by level of income distribution, which also leads to further understanding that FINC does much more than promote access to energy it enhances financial literacy of households and SMEs, thus enabling economically rational considerations towards energy use. The research points out the importance of these findings as it highlights the socio-economic context as a contingent factor of the efficiency of FINC programs, which means that policy responses should be more specific. Because of the reliance in the finding, the results suggest that for financial policy or energy policy, governments’ actions should consider the creation of policy structures that not only support inclusive financing but also aim at enhancing public financial literacy. Consequently, these actions will prepare people and firms to easily obtain suitable financial products that will lead to sustainable energy access and poverty reduction. To strengthen the applicability of our findings, the study acknowledges the importance of tailoring policy recommendations to the specific capacities of governments, particularly those with limited financial resources. For instance, in Rwanda, the government successfully expanded rural energy access through a combination of FINC initiatives and partnerships with mobile money providers like MTN Mobile Money and energy firms such as BBOXX. These efforts enabled pay-as-you-go (PAYG) solar systems financed via micro-loans, reducing upfront costs for off-grid households. Similarly, Bangladesh's Infrastructure Development Company Limited (IDCOL) leveraged concessional donor funding to subsidize solar home systems while integrating microfinance institutions to provide end-user financing, creating a scalable model for clean energy deployment. These examples demonstrate that even resource-constrained governments can foster FINC and energy access through strategic use of blended finance, international partnerships, and targeted subsidies. As such, we recommend that governments prioritize policies that encourage mobile banking integration, incentivize private sector participation, and utilize existing microfinance networks to extend clean energy solutions in underserved areas.
The GS and EP relationship warrants careful analysis from the policymakers’ perspective. Governments need to spend constructively and deepen investments in renewable energy infrastructure, rural electrification, and energy efficiency projects. GS in the case of EP is often characterized as erratic, which shows the need for budgetary allocation to be restrained and made systematically. This relationship explains why strategic spending without thought-out social planning can exacerbate social expenditures, including EP. Policymakers should assume that there is a certain level of GS as a percentage of GDP, which is optimal and will result in balanced economic growth together with immediate social expenditures. Policymakers must consider the design of some programs aimed at FINC by targeting access to microfinance, credit, and mobile banking services for poor clients so that they can afford cleaner energy. Financial institutions and governments can create synergies to promote investments in green technologies and energy-saving devices. In addition, combining conservation campaigns with education on energy use ensures that marginalized communities have the means and knowledge to use sustainable energy options. These slopes confirm that improving FINC leads to a decrease in EP, which need not be the same across all segments, making the deduced declines more pronounced. This supports the assumption that policies implemented by the government in a bid to deepen FINC greatly assist in accomplishing Sustainable Development Goal 7. Through these specific steps, it is possible to make considerable progress in meeting EP and promoting more inclusive and sustainable development in developing economies.
There are several ways to carry this research further. Firstly, there is the issue of gauging EP using empirical methodologies that center on the EP index. Alongside the possibility of measuring reliability constraints, future investigations may focus on macroeconomic relationships and their impact. There are also more micro-level dynamics that could be looked into, although these might be difficult due to lack of data. Secondly, prospective analyses could look into the relationship between FINC and EP in different countries and regions. Such focused analysis would help to formulate precise policies that suit each individual country better. Furthermore, further research must focus on using other approaches regarding methodology, like using panel data or mixed methods, to meet the outcomes and lessen the gaps in approach. This study is subject to certain limitations. First, data gaps restrict our sample to 66 countries, possibly introducing selection bias. Second, some potentially influential variables such as infrastructure quality or cultural factors are omitted due to data unavailability. Third, while robust to several checks, our results remain associational, not causal.
Footnotes
Abbreviations
Consent for publication
All the authors are agreed.
Ethical statement
It is declared that our manuscript is only submitted in Energy and Environment.
Author contributions
Jiachen Zhao contributed to writing‒original draft, methodology, investigation, conceptualization, formal analysis, data curation, and writing‒review and editing.
Funding
The author received no financial support for the research, authorship, and/or publication of this article.
Declaration of conflicting interests
The author declared no potential conflicts of interest with respect to the research, authorship, and/or publication of this article.
Data availability
Data are grabbed through an online database and will be available on demand.
Author biography
Appendix A

| List of countries | ||||
|---|---|---|---|---|
| Africa | ||||
| Algeria | Cameroon | Mexico | Sierra Leone | South Africa |
| Angola | Congo, Rep | Senegal | Zambia | Zimbabwe |
| Gambia | Ghana | Tunisia | Burkina Faso | |
| Mali | Mauritius | Botswana | Gabon | |
| Niger | Nigeria | Egypt | Madagascar | |
| Togo | Sudan | Mozambique | Namibia | |
| Asia | ||||
| Bahrain | Bangladesh | Brunei Darussalam | Myanmar | Turkey |
| India | Indonesia | Iran | Qatar | United Arab Emirates |
| Jordan | Kuwait | Malaysia | Thailand | China |
| Nepal | Pakistan | Philippines | Saudi Arabia | Singapore |
| Sri Lanka | ||||
| Latin America and the Caribbean | ||||
| Argentina | El Salvador | Jamaica | Paraguay | Barbados |
| Chile | Guatemala | Bolivia | Costa Rica | Uruguay |
| Colombia | Peru | Haiti | Nicaragua | Brazil |
| Ecuador | Honduras | Panama | Venezuela, RB | |
Sample developing countries and classification. Source: Country classification 83
Appendix B
| PCA results for the financial inclusion index | |
|---|---|
| Factor loadings—Principal component 1 (PC1) | |
| Indicator | Factor loading (PC1) |
| Number of ATMs per 100,000 adults | 0.58 |
| Outstanding deposits from commercial banks (% of GDP) | 0.65 |
| Number of commercial bank branches per 100,000 adults | 0.60 |
| Outstanding loans from commercial banks (% of GDP) | 0.68 |
| Eigenvalues and explained variance | |||
|---|---|---|---|
| Principal component | Eigenvalue | Proportion of variance explained (%) | Cumulative variance (%) |
| PC1 | 2.51 | 62.8 | 62.8 |
| PC2 | 0.73 | 18.2 | 81.0 |
| PC3 | 0.45 | 11.3 | 92.3 |
| PC4 | 0.31 | 7.7 | 100.0 |
PCA was employed using four key indicators: (i) number of ATMs per 100,000 adults, (ii) outstanding deposits from commercial banks as a percentage of GDP, (iii) number of commercial bank branches per 100,000 adults, and (iv) outstanding loans from commercial banks as a percentage of GDP. The PCA reduced the dimensionality of these interrelated variables and extracted a single composite index representing the underlying financial inclusion structure. The first principal component (PC1) was retained based on the Kaiser criterion (eigenvalue > 1), explaining approximately 62.8% of the total variance. The factor loadings for PC1 indicated strong positive contributions from all four variables, particularly outstanding loans and deposits, which had the highest loadings. These loadings were then used as weights to construct the financial inclusion index. The eigenvalues and explained variance of the components are presented below to ensure methodological transparency.