



Abstract
Introduction
Obstructive Sleep Apnoea Syndrome (OSAS) is a potentially fatal chronic condition that affects a broad spectrum of adult populations. 1 The highest prevalence is found in middle-aged males. 2 The state is defined by repeated episodes of a full or partial collapse of the upper airway during sleep, resulting in a lack of airflow. There are several OSAS management techniques developed during the last decade. These include Continuous Positive Airway Pressure (CPAP) therapy and several non-reversible surgical procedures, such as Mandibular Advancement Surgery (MAS). 3 Maxilla Mandibular Advancement (MMA) is a procedure that involves osteotomy of the upper and lower jaws. 4 The improvement of jaw systems following anterior placement of hyoid bone and maxilla, passively encourages the soft palate and tongue to move anteriorly, thereby extending the pharyngeal space. 5 However, MMA is a very invasive procedure that usually results in cosmetic and functional alterations that leads to complications. Human UA airflow narrowing that causes snoring is an important scientific topic that has engaged the profession for many years. OSA treatments have depended heavily on a cross-sectional image of the patient's upper airways to disclose the patient's shrinking airway gap 6 and increasing UA length. Due to restrictions, treatment decision-making depends entirely on the UA cross-section assessment, which results in non-responsive treatment. Not all OSA patients respond well to surgical intervention. 7 A comprehensive evaluation of UA is mandatory to further understand OSA's behaviour. OSA is extensively studied using CFD. The efficacy of numerous OSA prediction turbulence models has already been investigated. A previous study established that, depending on the circumstances, a limited number of turbulence models best fit experimental data. 8 This study demonstrated that a strong correlation between the CFD turbulence model and the physical model justifies its application in UA investigations.
Method
This section explained modelling the UA using CFD for OSA airflow analysis. The process begins with the image processing of the Computerized Tomography (CT) scan onto 3D modelling. The 3D model then progressed to physical experimental validation and CFD simulation. The data for this study is from a middle-aged woman with OSA. She has gone through a successful mandibular advancement surgery. The data is obtained from the University of Malaya Medical Center with clearance for research purposes. The identity of the data sources individual is protected and undisclosed.
Image processing
This study's CT image data consist of two CT scan images of pre-and post- Mandibular Advancement Surgery (MAS). The CT data is processed using Materialise Mimics Research 21.0 (Belgium) software to differentiate the air void from other tissue. The method uses the airways segmentation tool to extract the airways, covering the whole CT scan of the patient's head. Figure 1(a) shows the air void inside the airways, whereas Figure 1(b) shows the airway filled with a segmentation9–11 mask. The mask's pixel accuracy is kept at an optimum level to ensure the resulting outcome's validity. 12
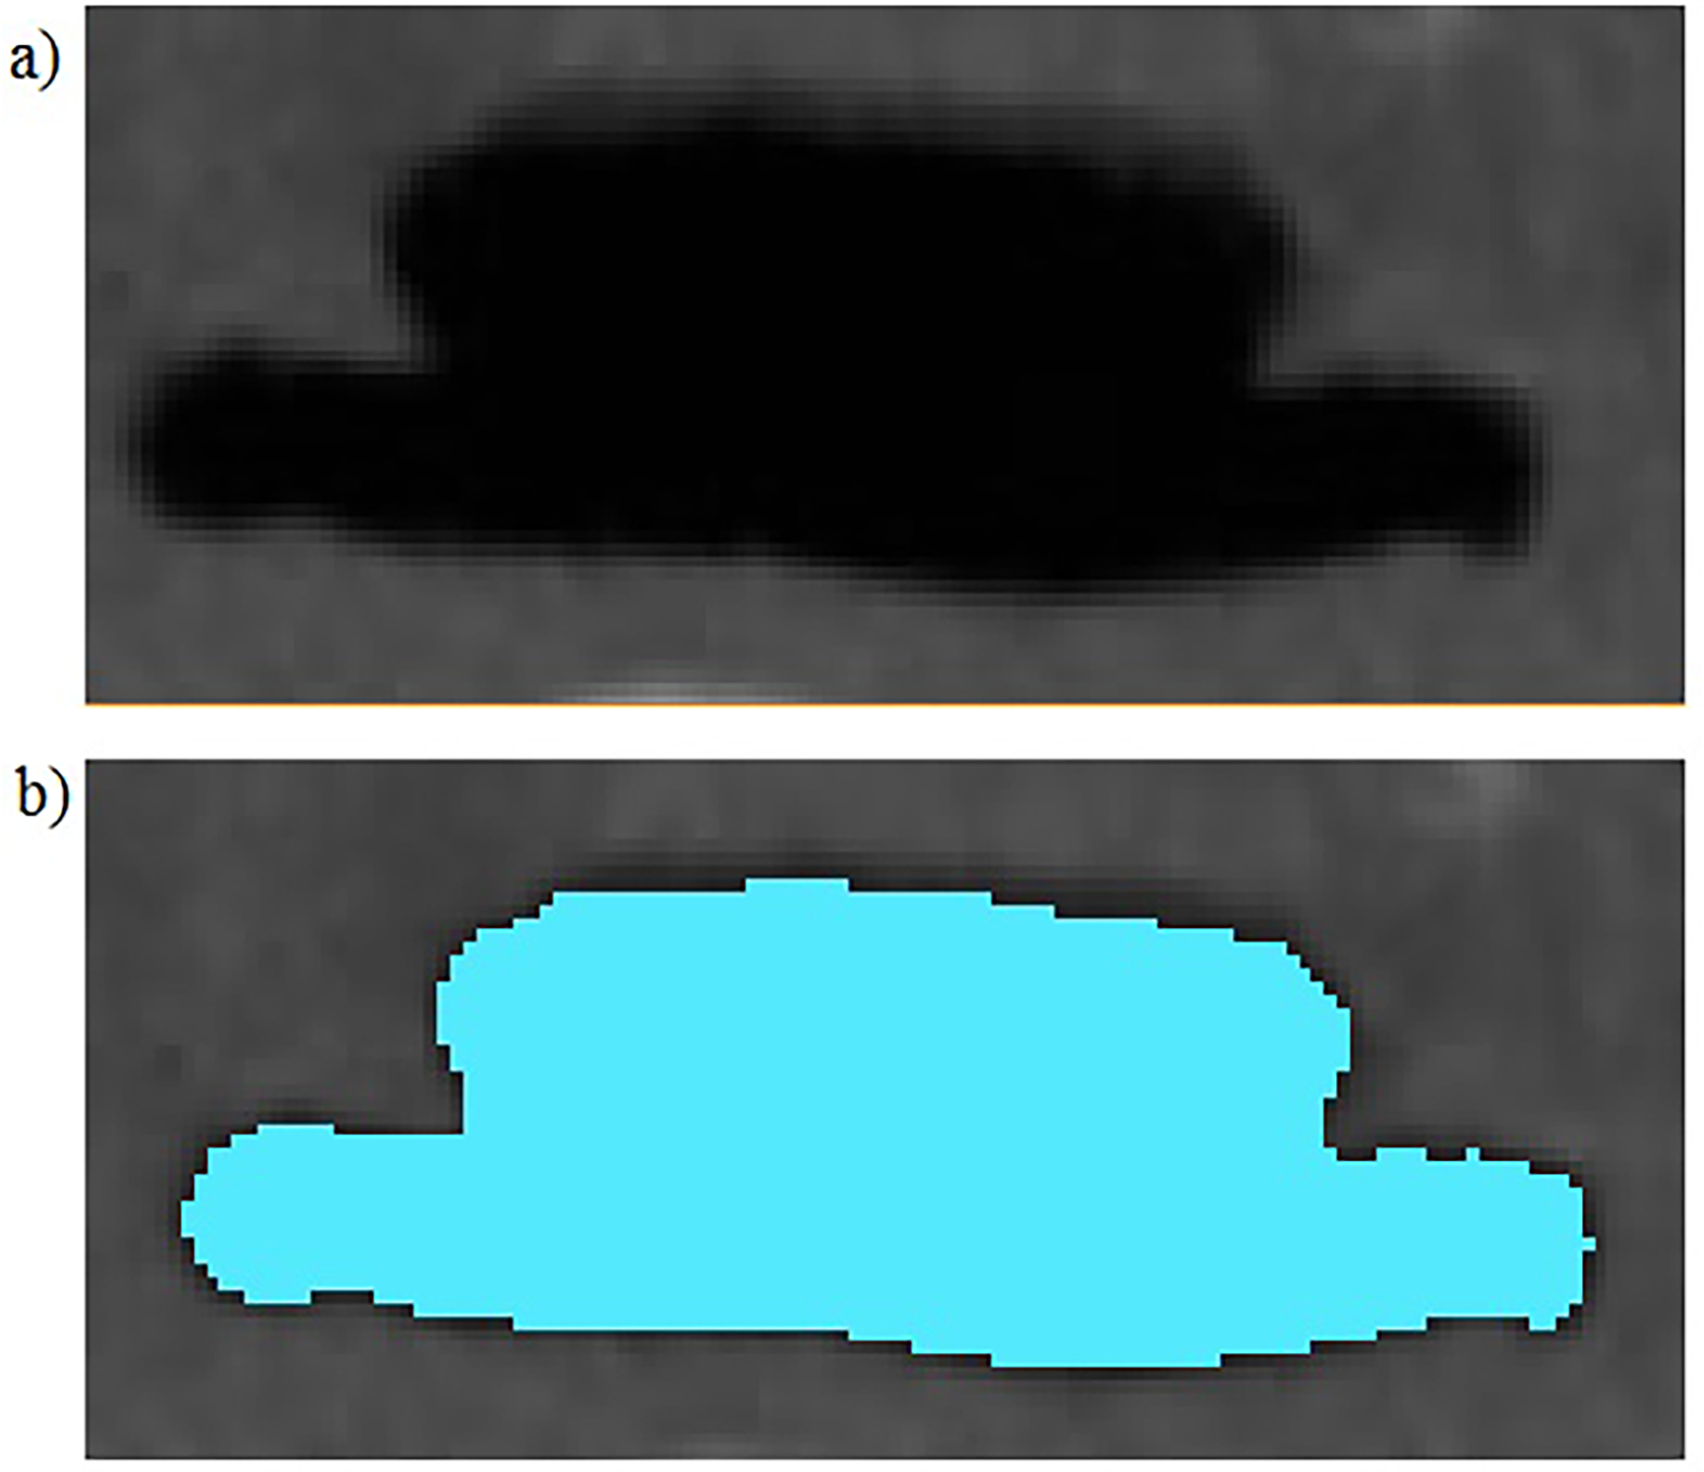
Ct slice image using Materialise Mimics software.
The segmentation mask starts from the nasal cavity until the bottom of the UA, as shown in Figure 2. Figure 2(b) shows the cross-section of the mask, which excludes the nasal cavity. The nasal cavity does not contribute to the flow regime change at the start of UA; hence it must be removed.13,14
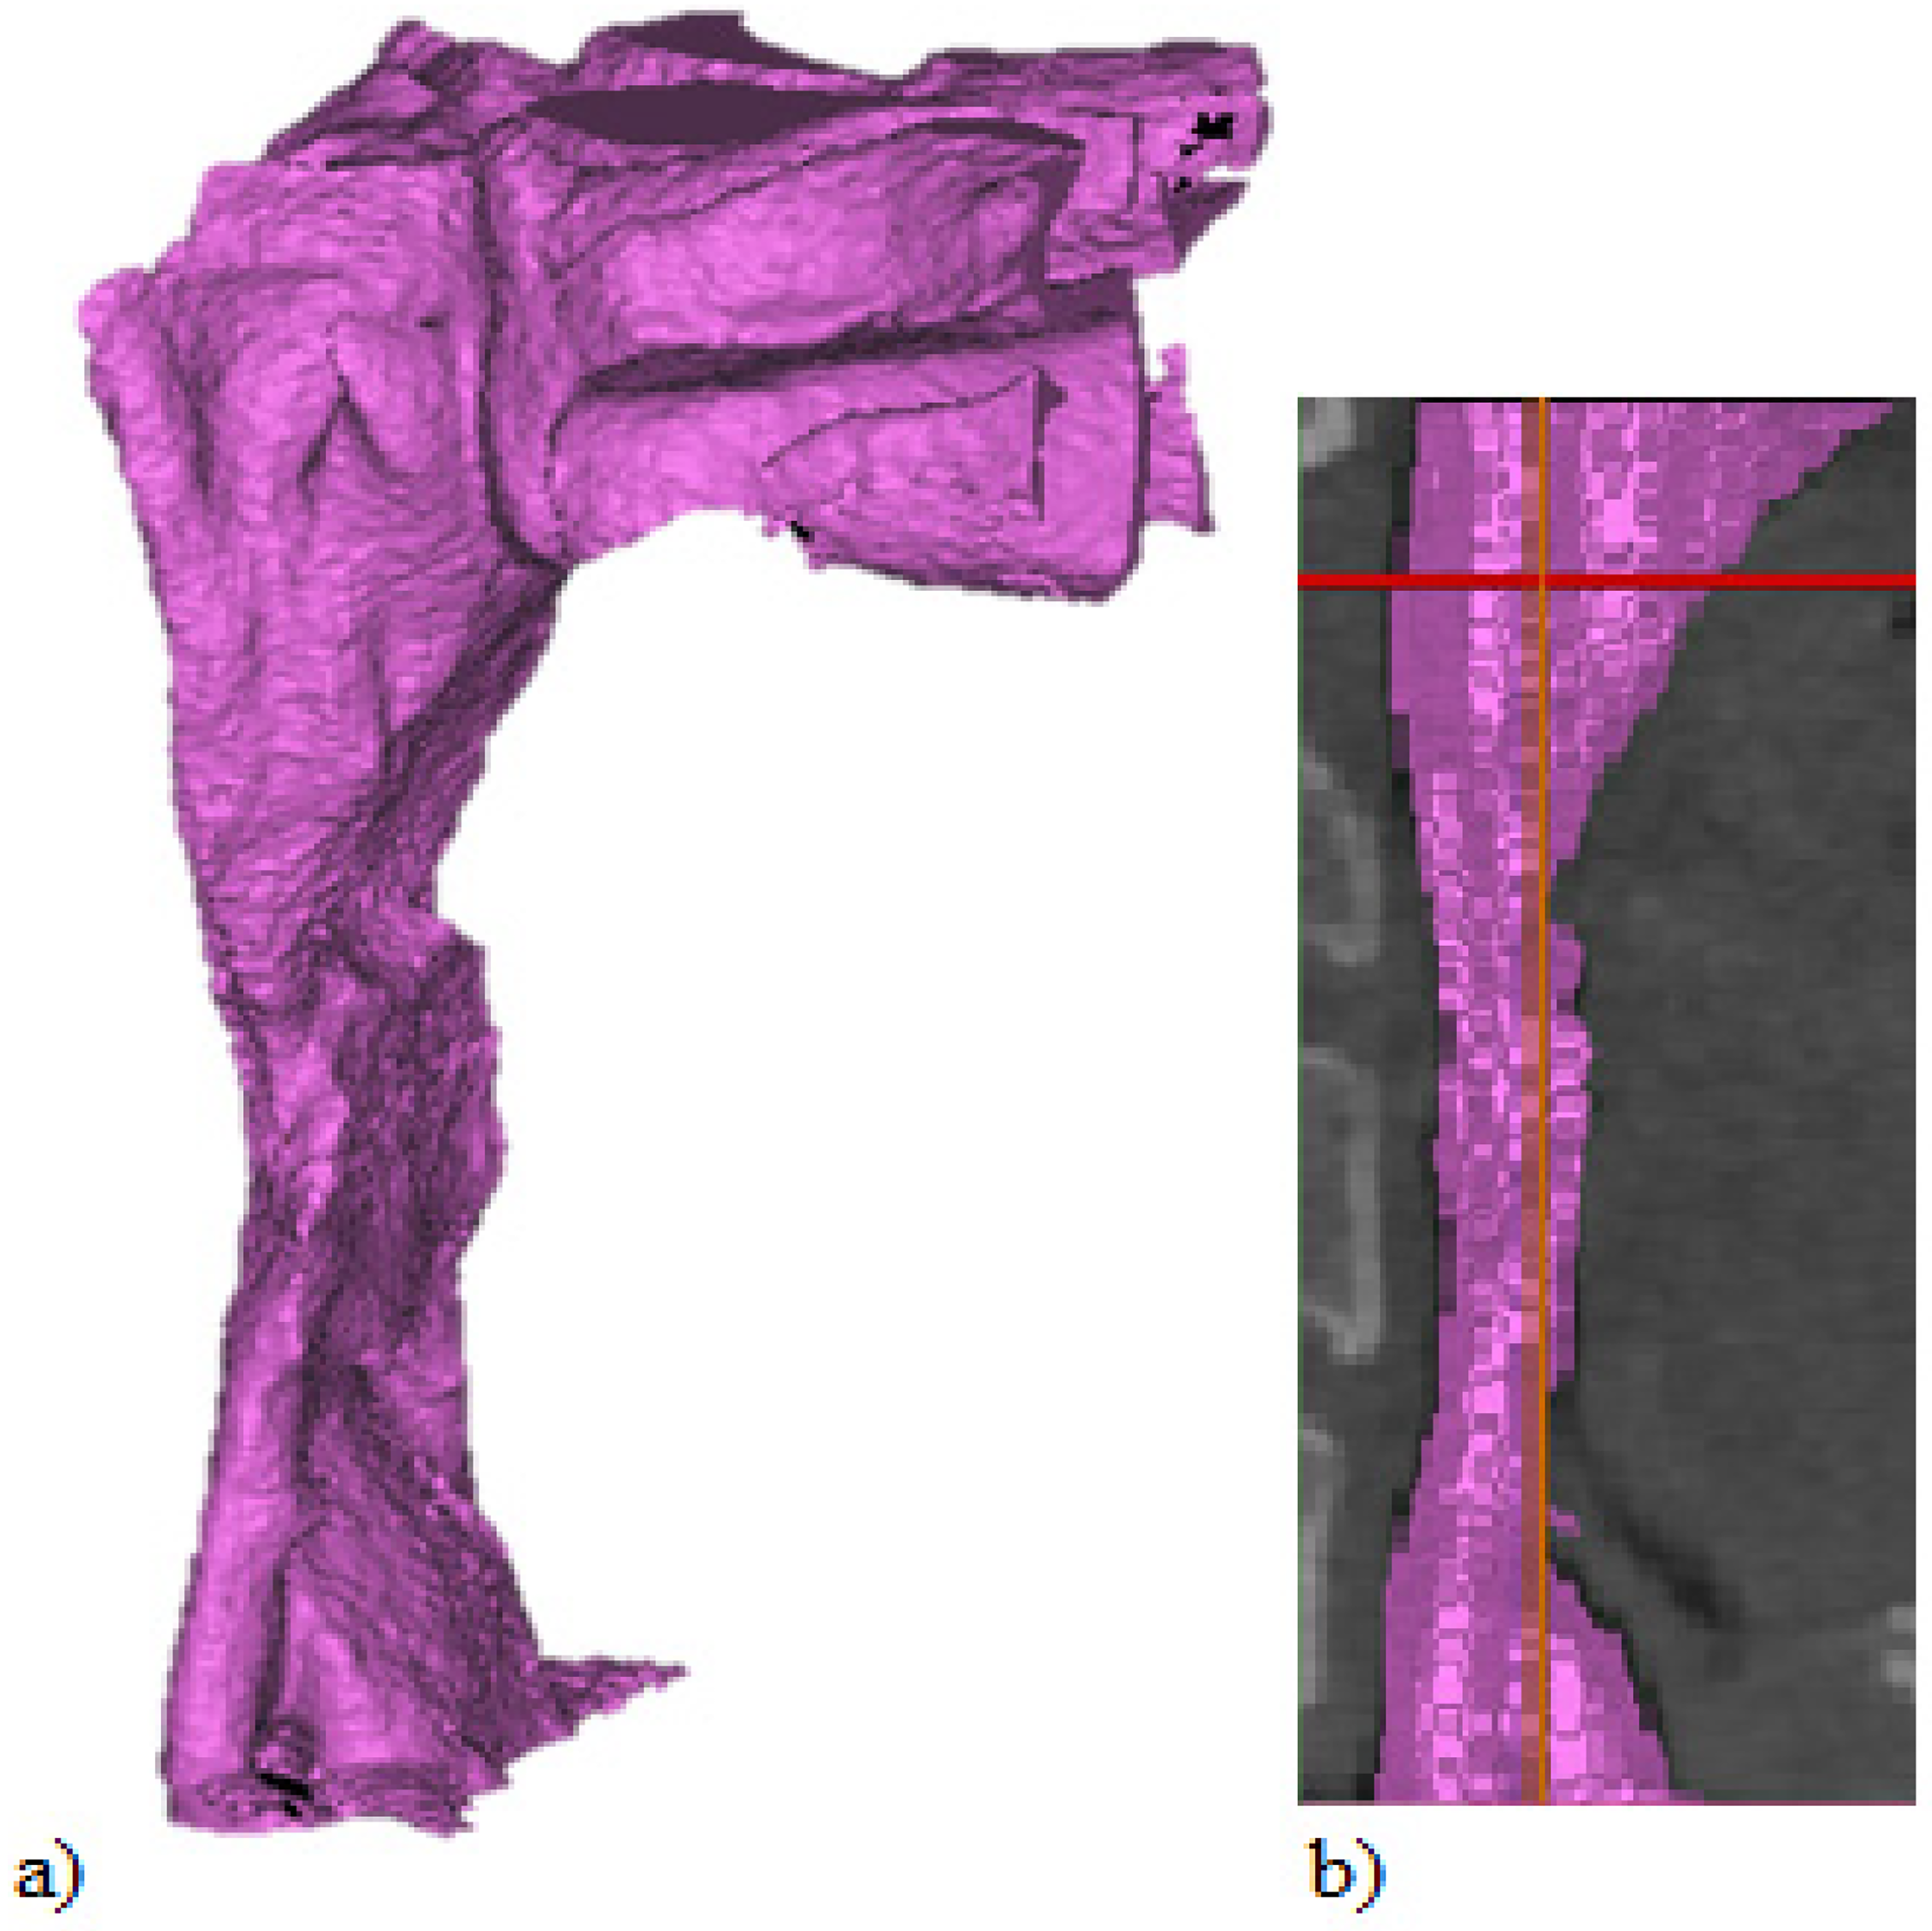
(a) Full upper airways segmentation, (b) Upper airways without nasal cavity.
The mask is smooth at 100 iterations, including manually removing all the spike and the micro wall void to ensure error-free meshing, transforming the mask into a 3D part for further processing. 15 Next, the 3D component is processed using Materialise 3-Matic 13.0 (Belgium) software for further wall surface treatment. The following step is to manually smooth any sharp edges to reduce mesh concentration at sharp edges or voids, limiting meshing capabilities and resulting in poor CFD convergence16,17 . This 3D UA model is used for physical experimental validation and CFD simulation. The 3D model is transferred into advanced 3D modelling software Dassault Systemes CATIA V5 R20 (France) to create an inlet and outlet channel and the pressure reading tube. The detailed dimension of the channel is shown in Fig. 3. The image shows thirteen 2 mm diameter pressure tubes along the centre surface for pressure reading.
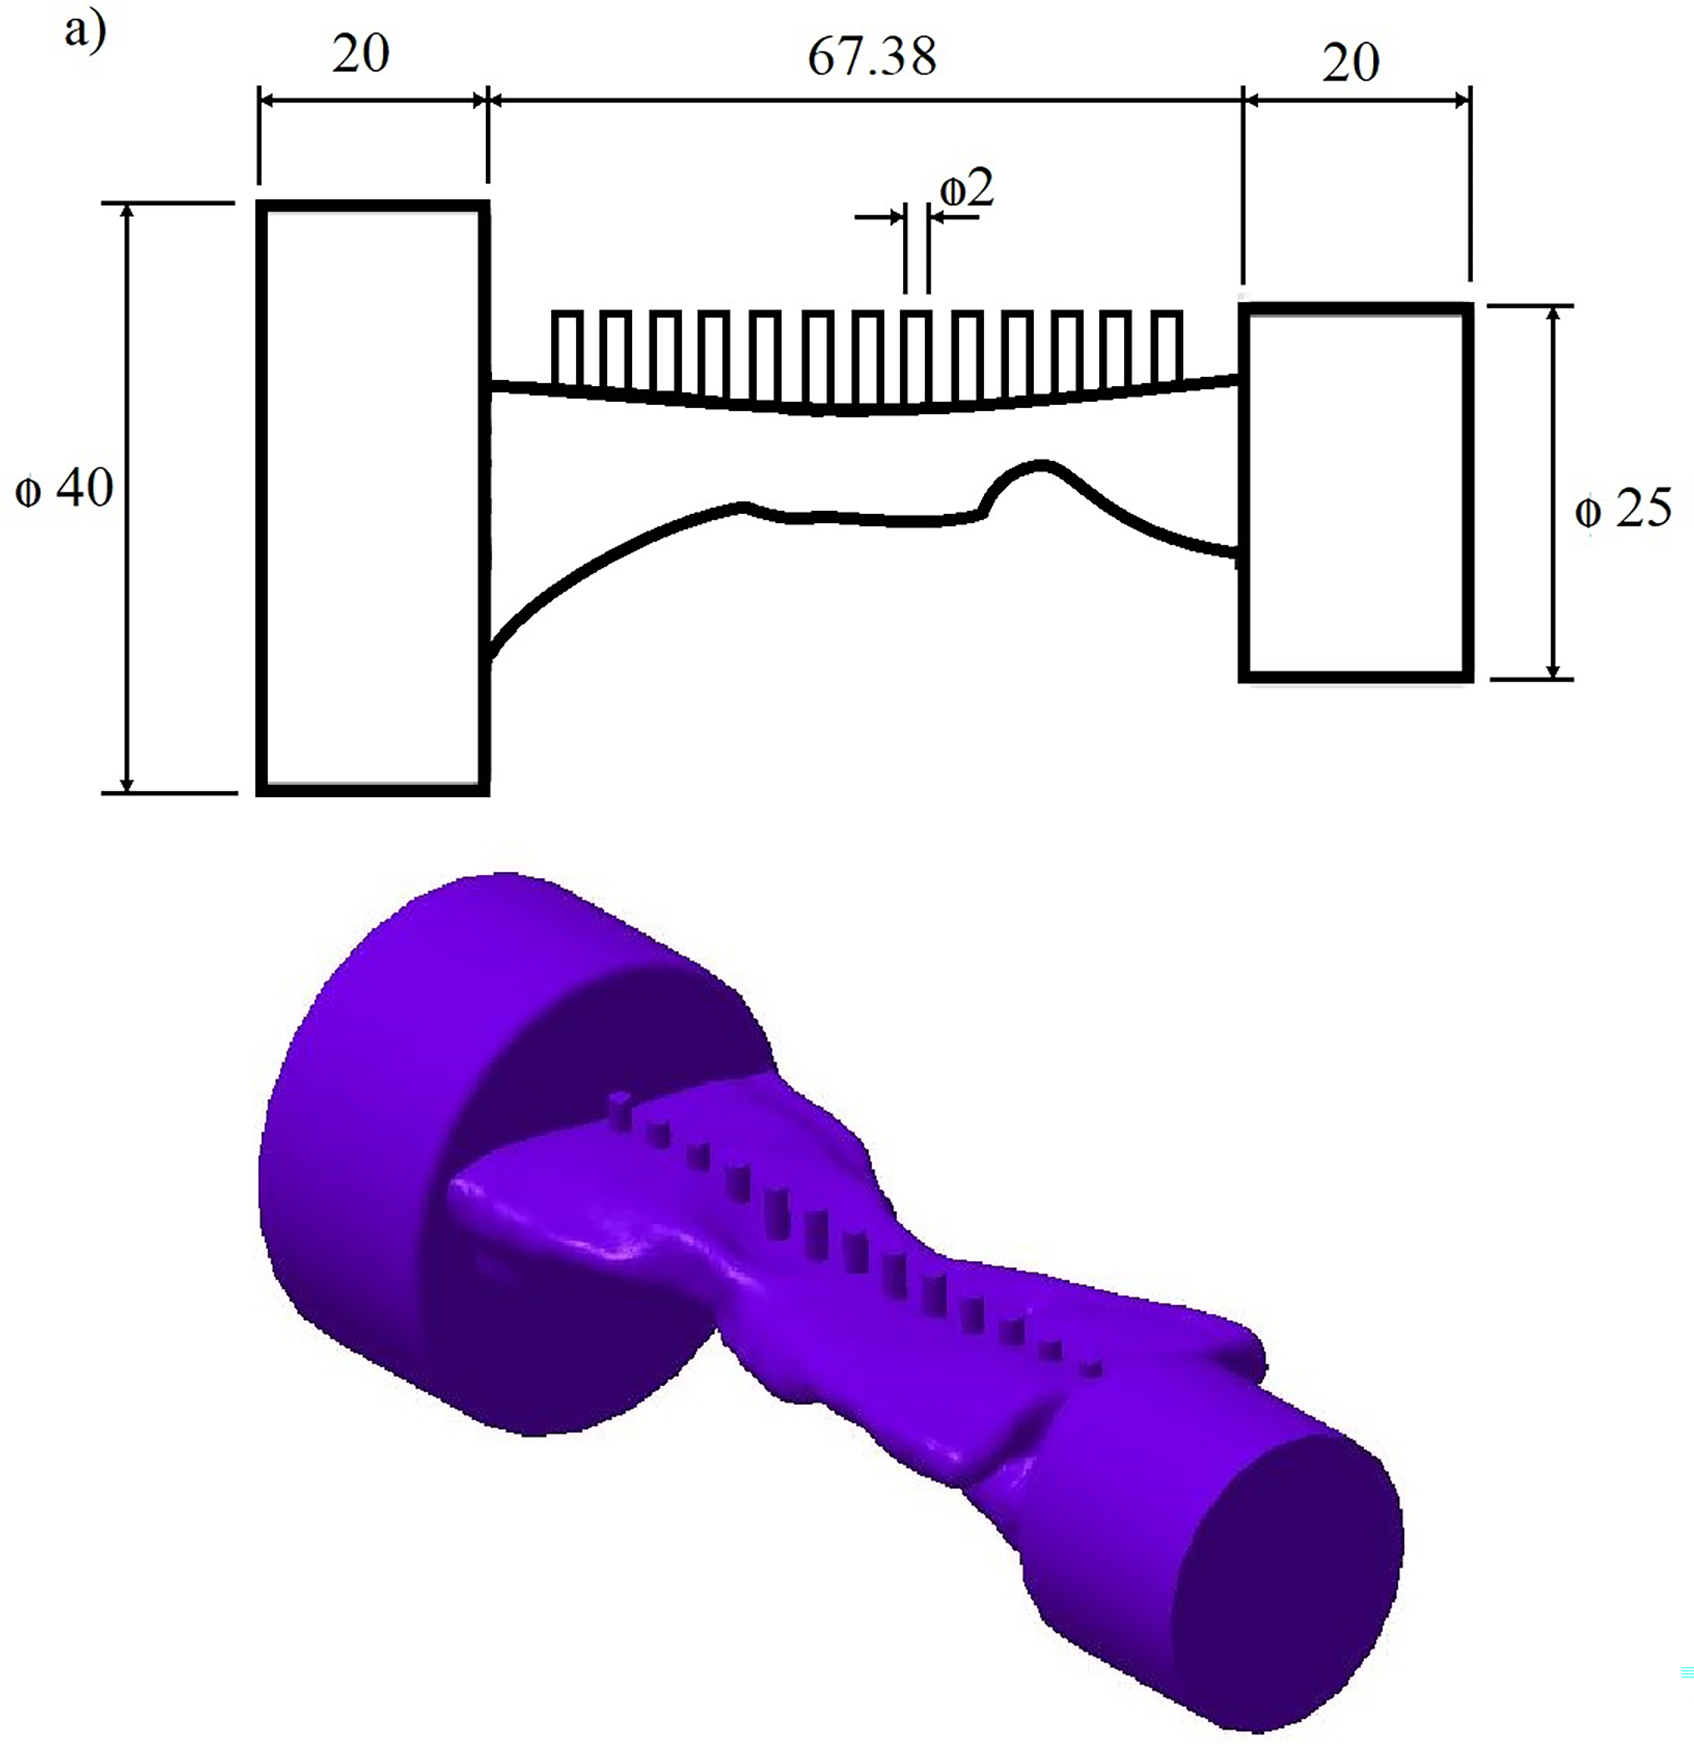
(a) Geometry details of modified UA, (b) 3D CAD model of modified UA.
Experimental validation setup
The 3D model of the UA of OSA patients is separated into two to create the moulds for the physical experimental validation, as shown in Figure 4 (a). The mould walls are raised to 25 mm to ensure sufficient material coverage. These moulds model progress into the Standard Triangle Language (STL) file for processing in Selective Laser Sintering (SLS) prototyping machine model Farsoon 252P (China) available in the Faculty of Engineering Technology, Mechanical, and Manufacturing at Universiti Teknikal Malaysia (UTeM). The material used for prototype mould build-up is nylon plastic (FS 4100 PA). The nylon material has excellent mechanical properties, toughness, and biocompatibility. The product of the SLS build-up is shown in Figure 4 (b). A mixture of Rebound 25 rubber silicon (Smooth-On Inc, USA) was then cast onto the mould. 18 This silicone material provides an airtight wall with ample flexibility and seals to insert the measuring tube and funnel. The flexibility of the silicone allows the casting of complicated parts with undercut walls. A direct validation using the SLS model alone is not suitable as the SLS model does not provide an airtight wall as the material has porosity. Both A and B silicon parts are glued with each other, as shown in Figure 4 (c).
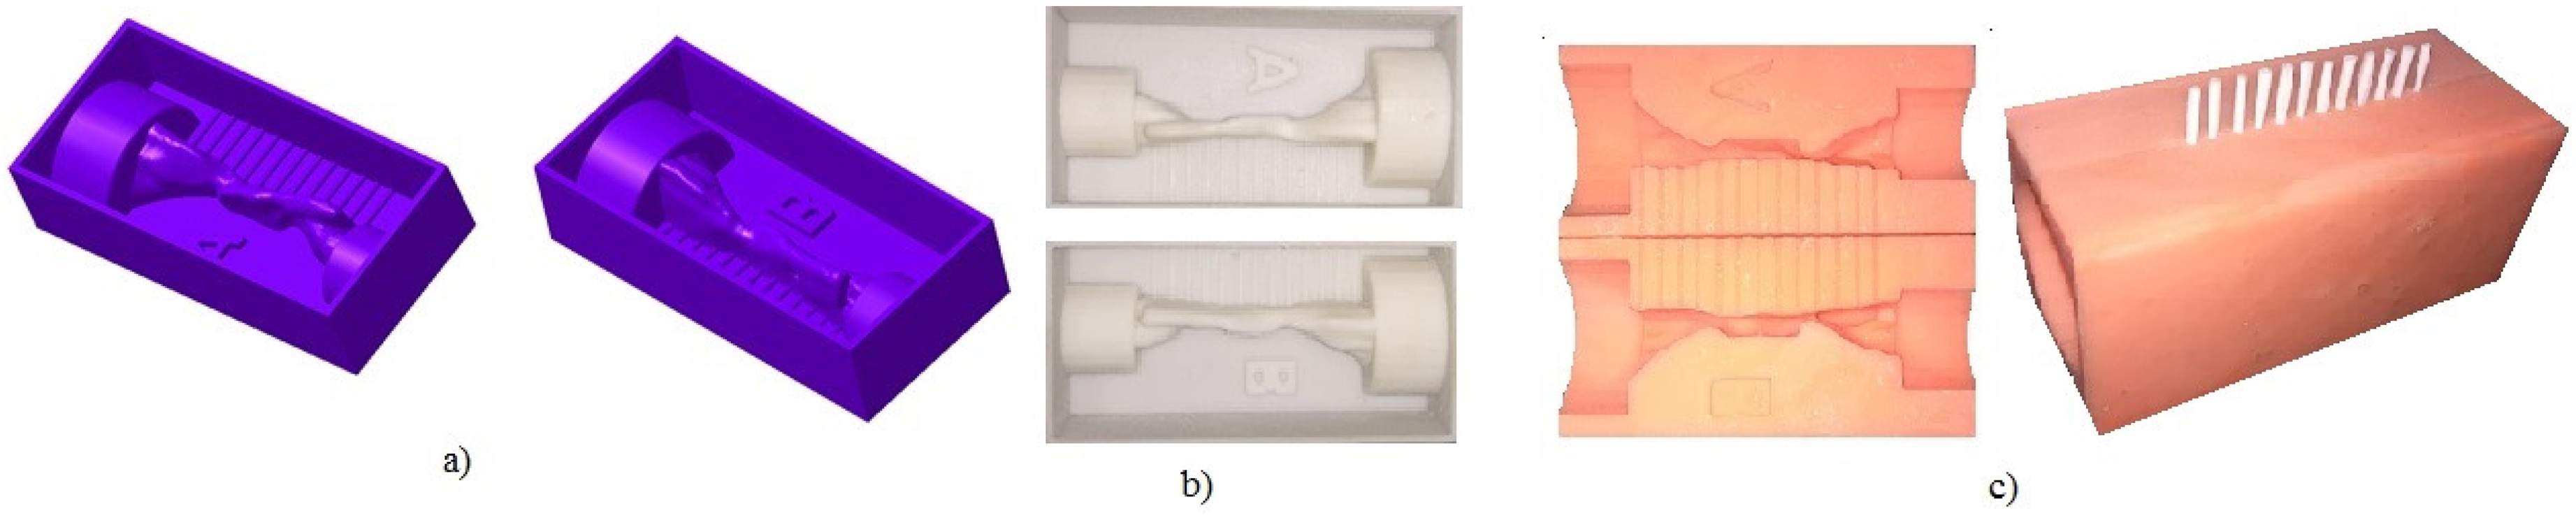
(a) 3D CAD of the mould, (b) SLS mould; silicon cast model of the UA.
As seen in Figure 5, a test rig diagram serves as a reference for validating the CFD simulation. This test rig is an adaptation of the one developed by Barber, Sutherland. 19 The test rig is powered by a 100 mm diameter marine air blower (12 V DC) which can provide a steady flow rate from zero to 270 CFM. A digital DC regulator regulates the blower flow rate. The inlet funnel is defined by connecting the blower to a 150 mm length PVC pipe with a 40 mm diameter as an inlet funnel. 25 mm diameter PVC pipe connected at the end of the rig as the outlet funnel. A digital velocity calculator (TSI 9565-P VelociCalc Multi-Function Ventilation Meter, USA) is used as a measuring device to measure airflow rate by multiple tools. TSI hot wire probe (960 Thermoanemometer Straight Probe Velocity and Temperature) is used to measure the airflow rate. The hot wire is chosen instead of the pitot tube. It provides a much more accurate flow rate reading at low airspeed with an accuracy of ±0.015 m/s. The velocity probe is placed in front of the Inlet entrance to ensure the same flow rate is achievable in the CFD simulation. The 13 pressure points attach to the device, which is switched manually for each point.

Physical experimental setup diagram.
The TSI device measured air pressure ranging from −3735 to +3735 Pa and a resolution of 0.1 Pa. Data processing progress using LogDat2™ data logger software by connecting the device to a computer. Studies considering the flow profiles for breathing in and breathing out conditions indicate an arrived at the midpoint of 30 per cent higher pressure loss and higher flow velocity than exhaling inhalation. Airflow enters the UA stream with higher turbulent kinetic energy and lower overall pressure, which increases the UA probability of collapsing. 14 Thus, the test rig's inlet is ideally at an inhale position, similar to the inlet location of CFD simulation. The detailed connection of the test rig is shown in Figure 5, while the actual setup of the test rig is shown in Figure 6.
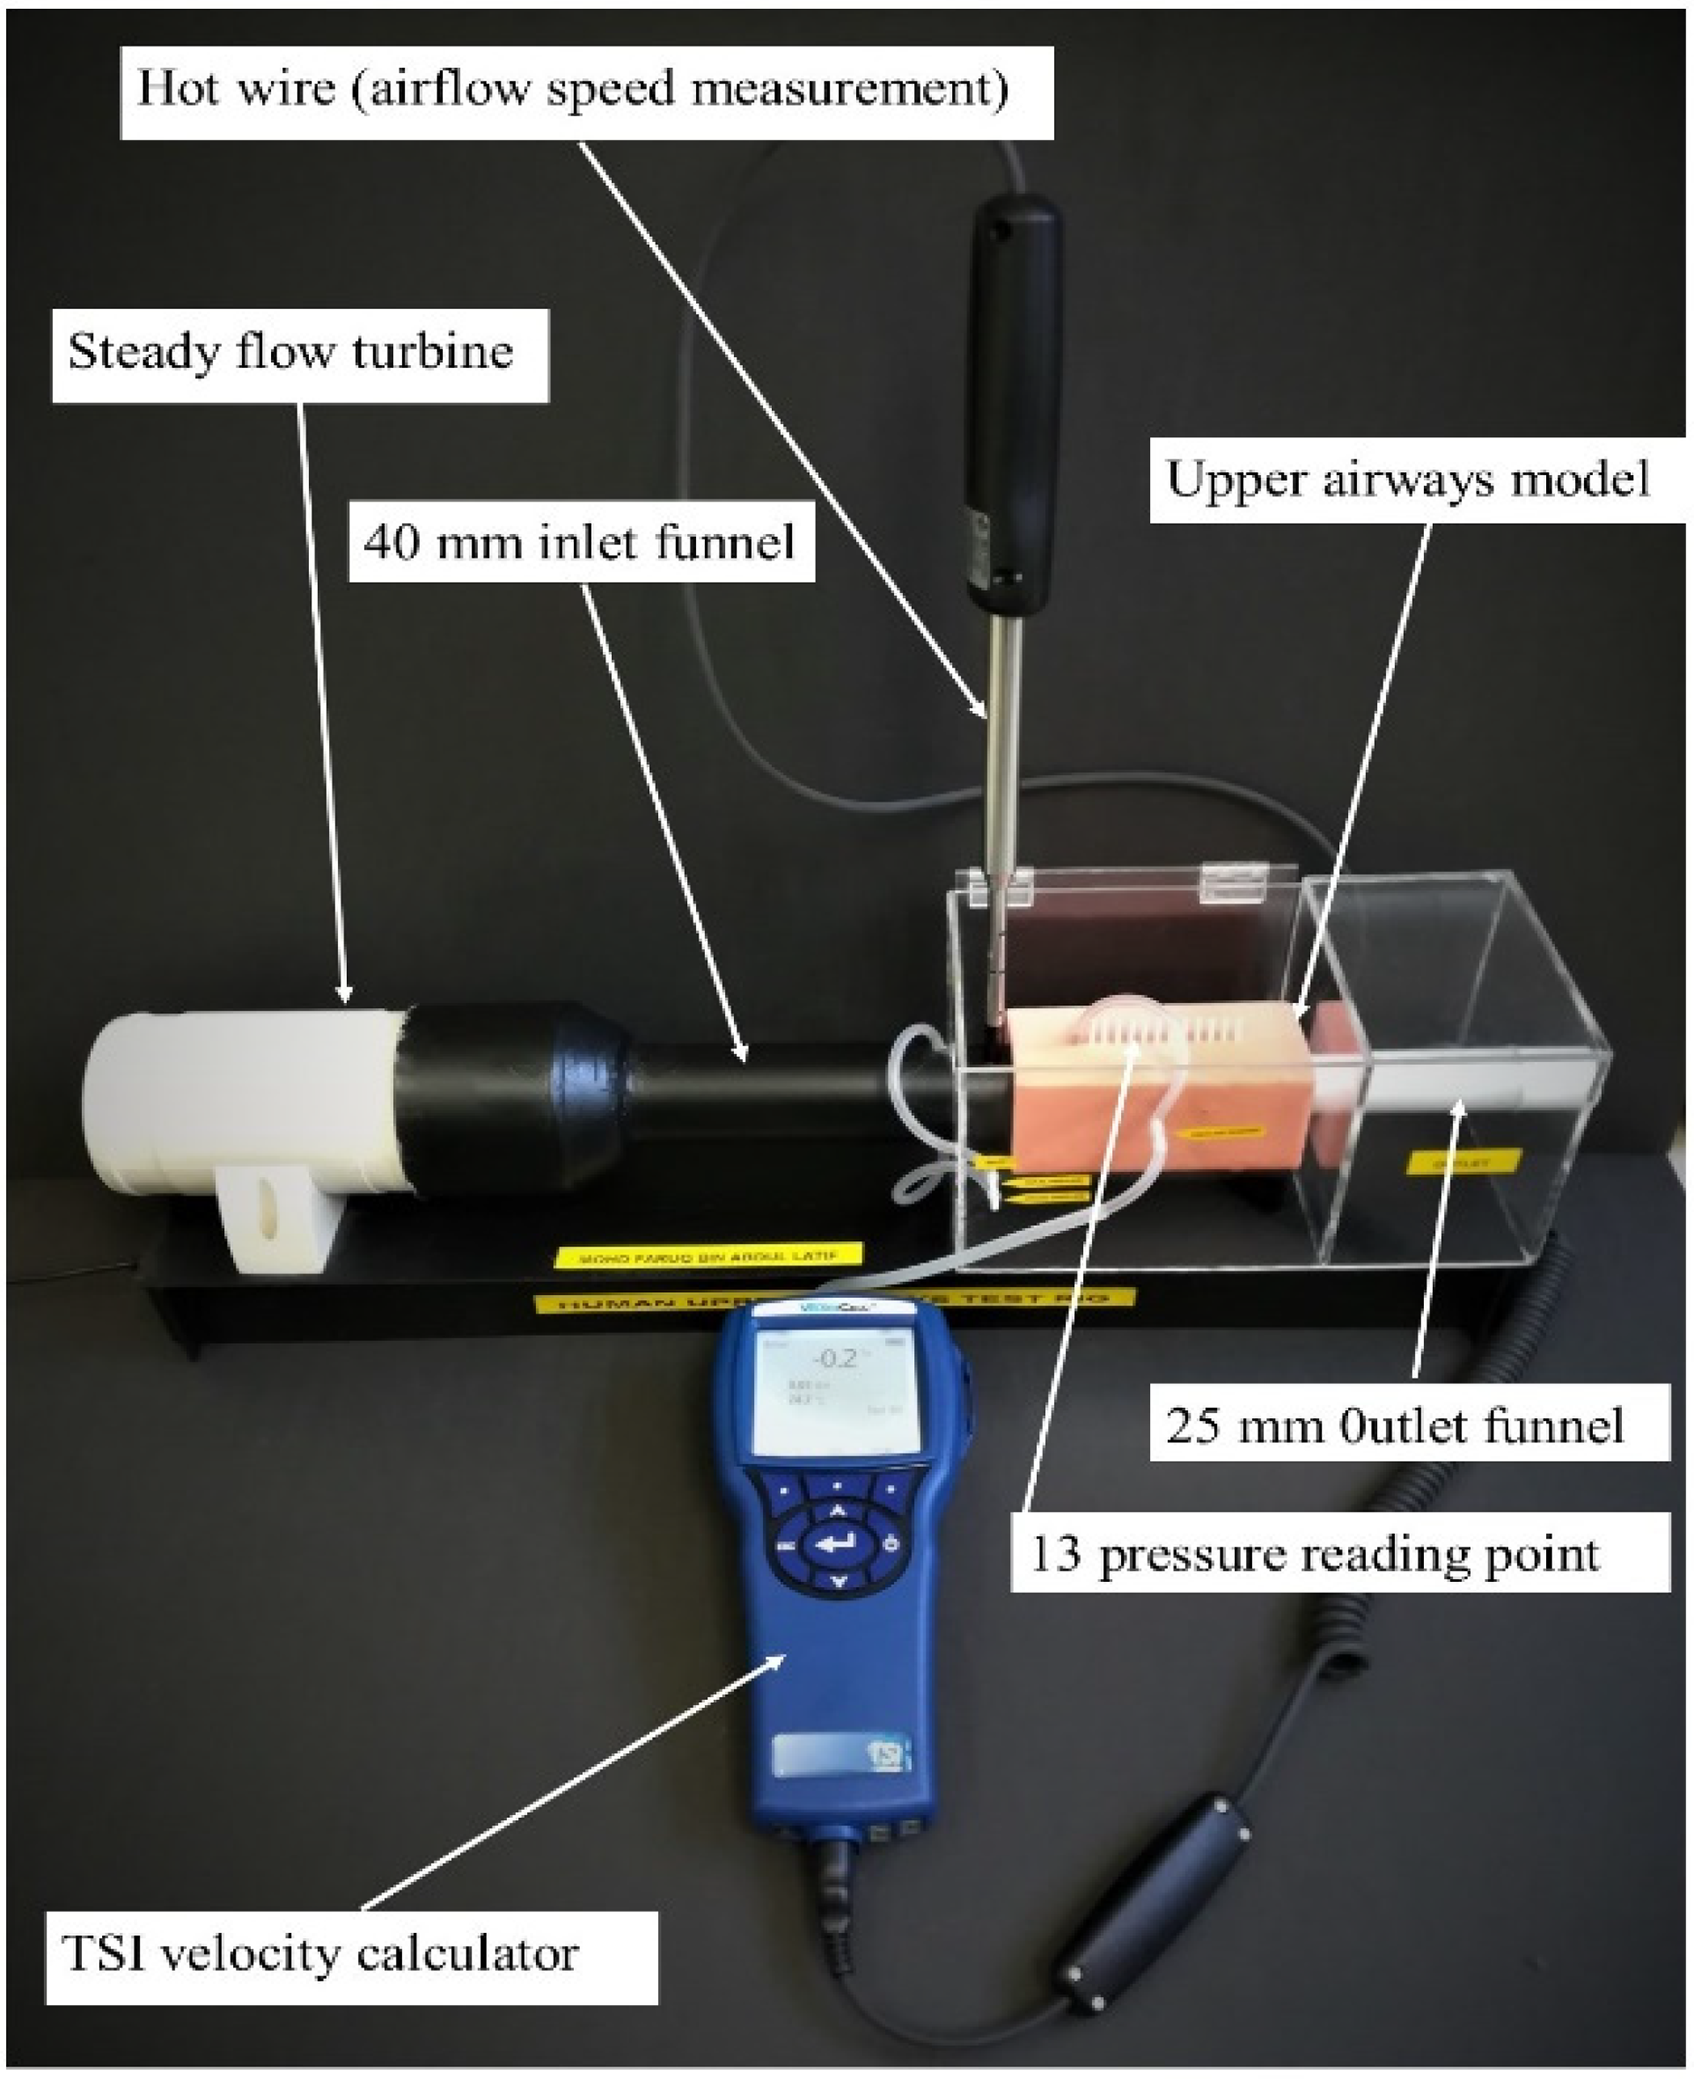
Actual physical validation test rig setup.
Computational fluid dynamic simulation (CFD)
The third-party meshing software (Altair, Hyper Mesh 2012, USA) generate the mesh of the 3D model. Typically, for internal fluid flow investigations, such as the UA, a hybrid mesh form model with at least five inflation layers is used to describe the near-wall effect better. 20 Researchers apply more exceptional mesh cells, usually for the UA, to solve the unevenly distributed mesh density problem, between 500,000 and 1.6 million cells. 21 In this case, the mesh size determines the validation result via grid sensitivity analysis once the simulation result agrees well.
ANSYS 16.0 Fluent (USA) is used to perform the simulation. The flow is modelled as incompressible given the low Mach number of the airflow. In the UA, the Reynolds number (Re) of the flow was calculated by (Eq 1):

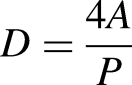
Where, A = cross-sectional area, Q = volumetric flow rate, D = hydraulic diameter, P = perimeter, v = kinematic viscosity
The Re varied from 468 to 20081 at 10 L/min, while Re varied from 702 to 3122 at 15 L/min.
The following are the governing equations:
Conservation of mass (Eq 2)

Conservation of linear momentum (Eq 3)

Where μ is viscosity, ρ is the fluid density, p is pressure, and u is the velocity components in x, y, and z-direction. The present analysis assumes that the airflow is constant and incompressible.
Large Eddy Simulation (LES) has become the preeminent turbulence model for the UA model simulation. Most research has shown strong agreement with the experimental outcome. 22 However, a significant issue with implementing the turbulence model is high computational costs. Therefore, it takes longer to solve, therefore not a preferred alternative for time-consuming clinical use. However, the Menter's Shear Stress Transport (SST) k – ω also agreed with the experimental outcome and was almost equivalent to the LES model. 23 The SST k – ω model is chosen for this simulation as the turbulence model. This turbulence model has advantages in solving complex transitional flows, including over the UA. 20
The employment of the k – ω SST turbulence model provides an enhanced description of flows involving adverse pressure gradients and curved boundary layers. 24 The airflow evaluation is at three different flow rates for physical validation and CFD modelling (10 L/min, 15 L/min, and 20 L/min).25,26
This analysis uses the equations expressed in incompressible Reynolds Averaged Navier Stokes (RANS) as expressed in Eq 4.


Where P is the fluid pressure, ʋ is the flow velocity, µ is the dynamic viscosity, ρf is the fluid density, Sij is the mean rate of the strain tensor, Rij is Reynold's stress tensor, and the bar denotes the time average. The current research uses the turbulence model k – ω SST to close the RANS equations. It provides a strengthened characterization of flows incorporating adverse pressure gradients and curved boundary layers. 25 The k – ω turbulence model is better for modelling laminar–transitional–turbulent airflows in the human respiratory tract. 27 The equation below shows the transport equations for turbulent kinetic energy, k (Eq 5), and specific turbulent dissipation rate, ω (Eq 6).
k-equation:

ω-equation:

ν, νT, and τi j are kinetic molecular viscosity, turbulent viscosity, and Reynolds stress tensor. νT = Cμ fμk/ω and function
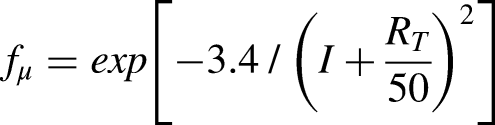
With RT = k/μω, μ is dynamic molecular viscosity.
Model constants are

Result
The graph of grid sensitivity analysis, as illustrated in Figure 7, shows CFD analysis with variable cell count compared with the physical validation at 13 pressure points. The pre-operation model's mesh cell count simulates at 900k, 1 million, 1.5 million, and 2.7 million cells. The result shows good agreement and an identical curve compared with the experimental result at 1.5 million and 2.7 million cells. The 900k cells and 1.0 million cells show a less agreeable result at the pharyngeal, where the negative pressure occurs. The 1.5 million cell grid was also tested at 15 L/min and 20 L/min, as presented in Figures 8 and 9, respectively.

Grid sensitivity analysis of pre-op tested at 10 L/min.

1.5 million cells grid of pre-op tested at 15 L/min.

2 million cells grid of pre-op tested at 20 L/min.
Both simulations show the same trend of the curve agreement compared with the experimental one. At 10 L/min, the highest-pressure difference at 52 mm is 0.51 Pa. A difference of 1.07 Pa at 42 mm at 15 L/min, while 2.01 Pa at 22 mm at 20 L/min. The pressure difference at other locations is meagre at all flow rates. Noticeable on the graph trend, the higher the flow rate, the greater the pressure is on the UA wall. Although pressure increase with the increment of flowrate, the curvature trend remains the same; thus, simulating an OSA sample case at any flowrate should be acceptable for evaluation. It is agreeable that the deference is exceptionally low and acceptable. Thus 1.5 million cells grid is decided as an acceptable grid size for the CFD simulation. The 1.5 million cell grid is chosen as the standard for this simulation. It shows good agreement compared with the experiment and is much more economical. This finding agreed well with the one done by Zhao, Barber. 28
Physical validation result
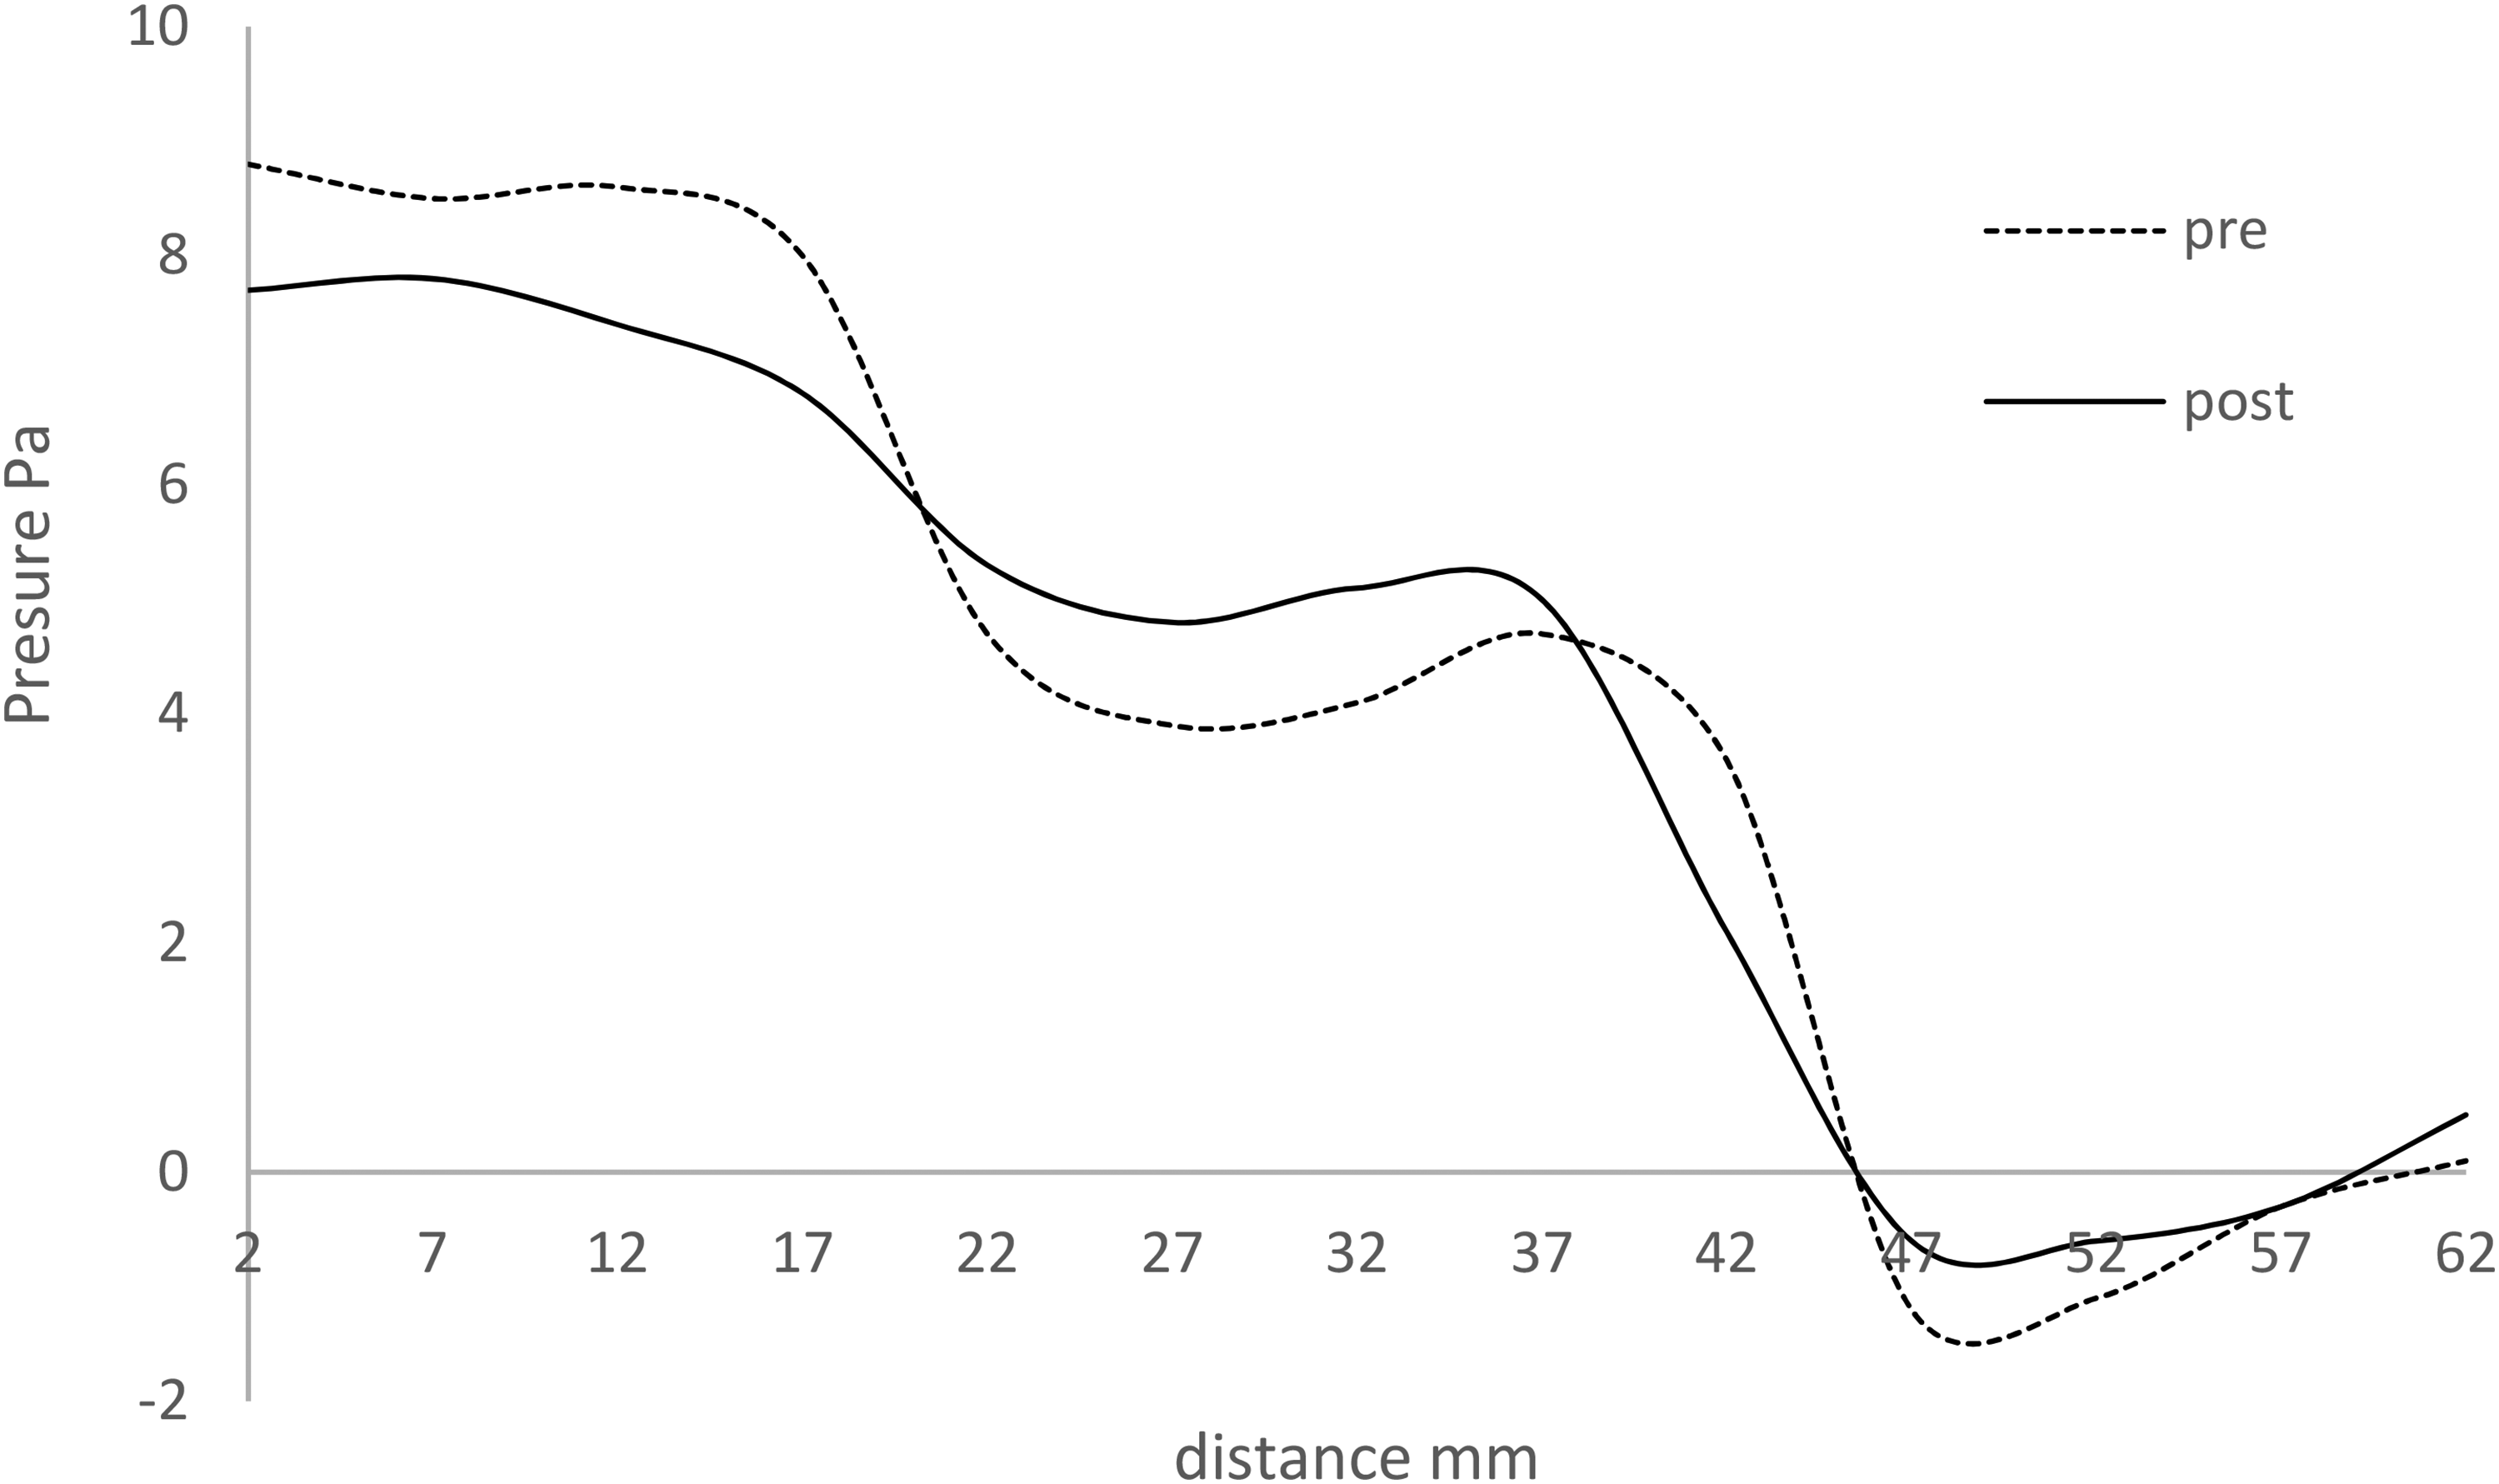
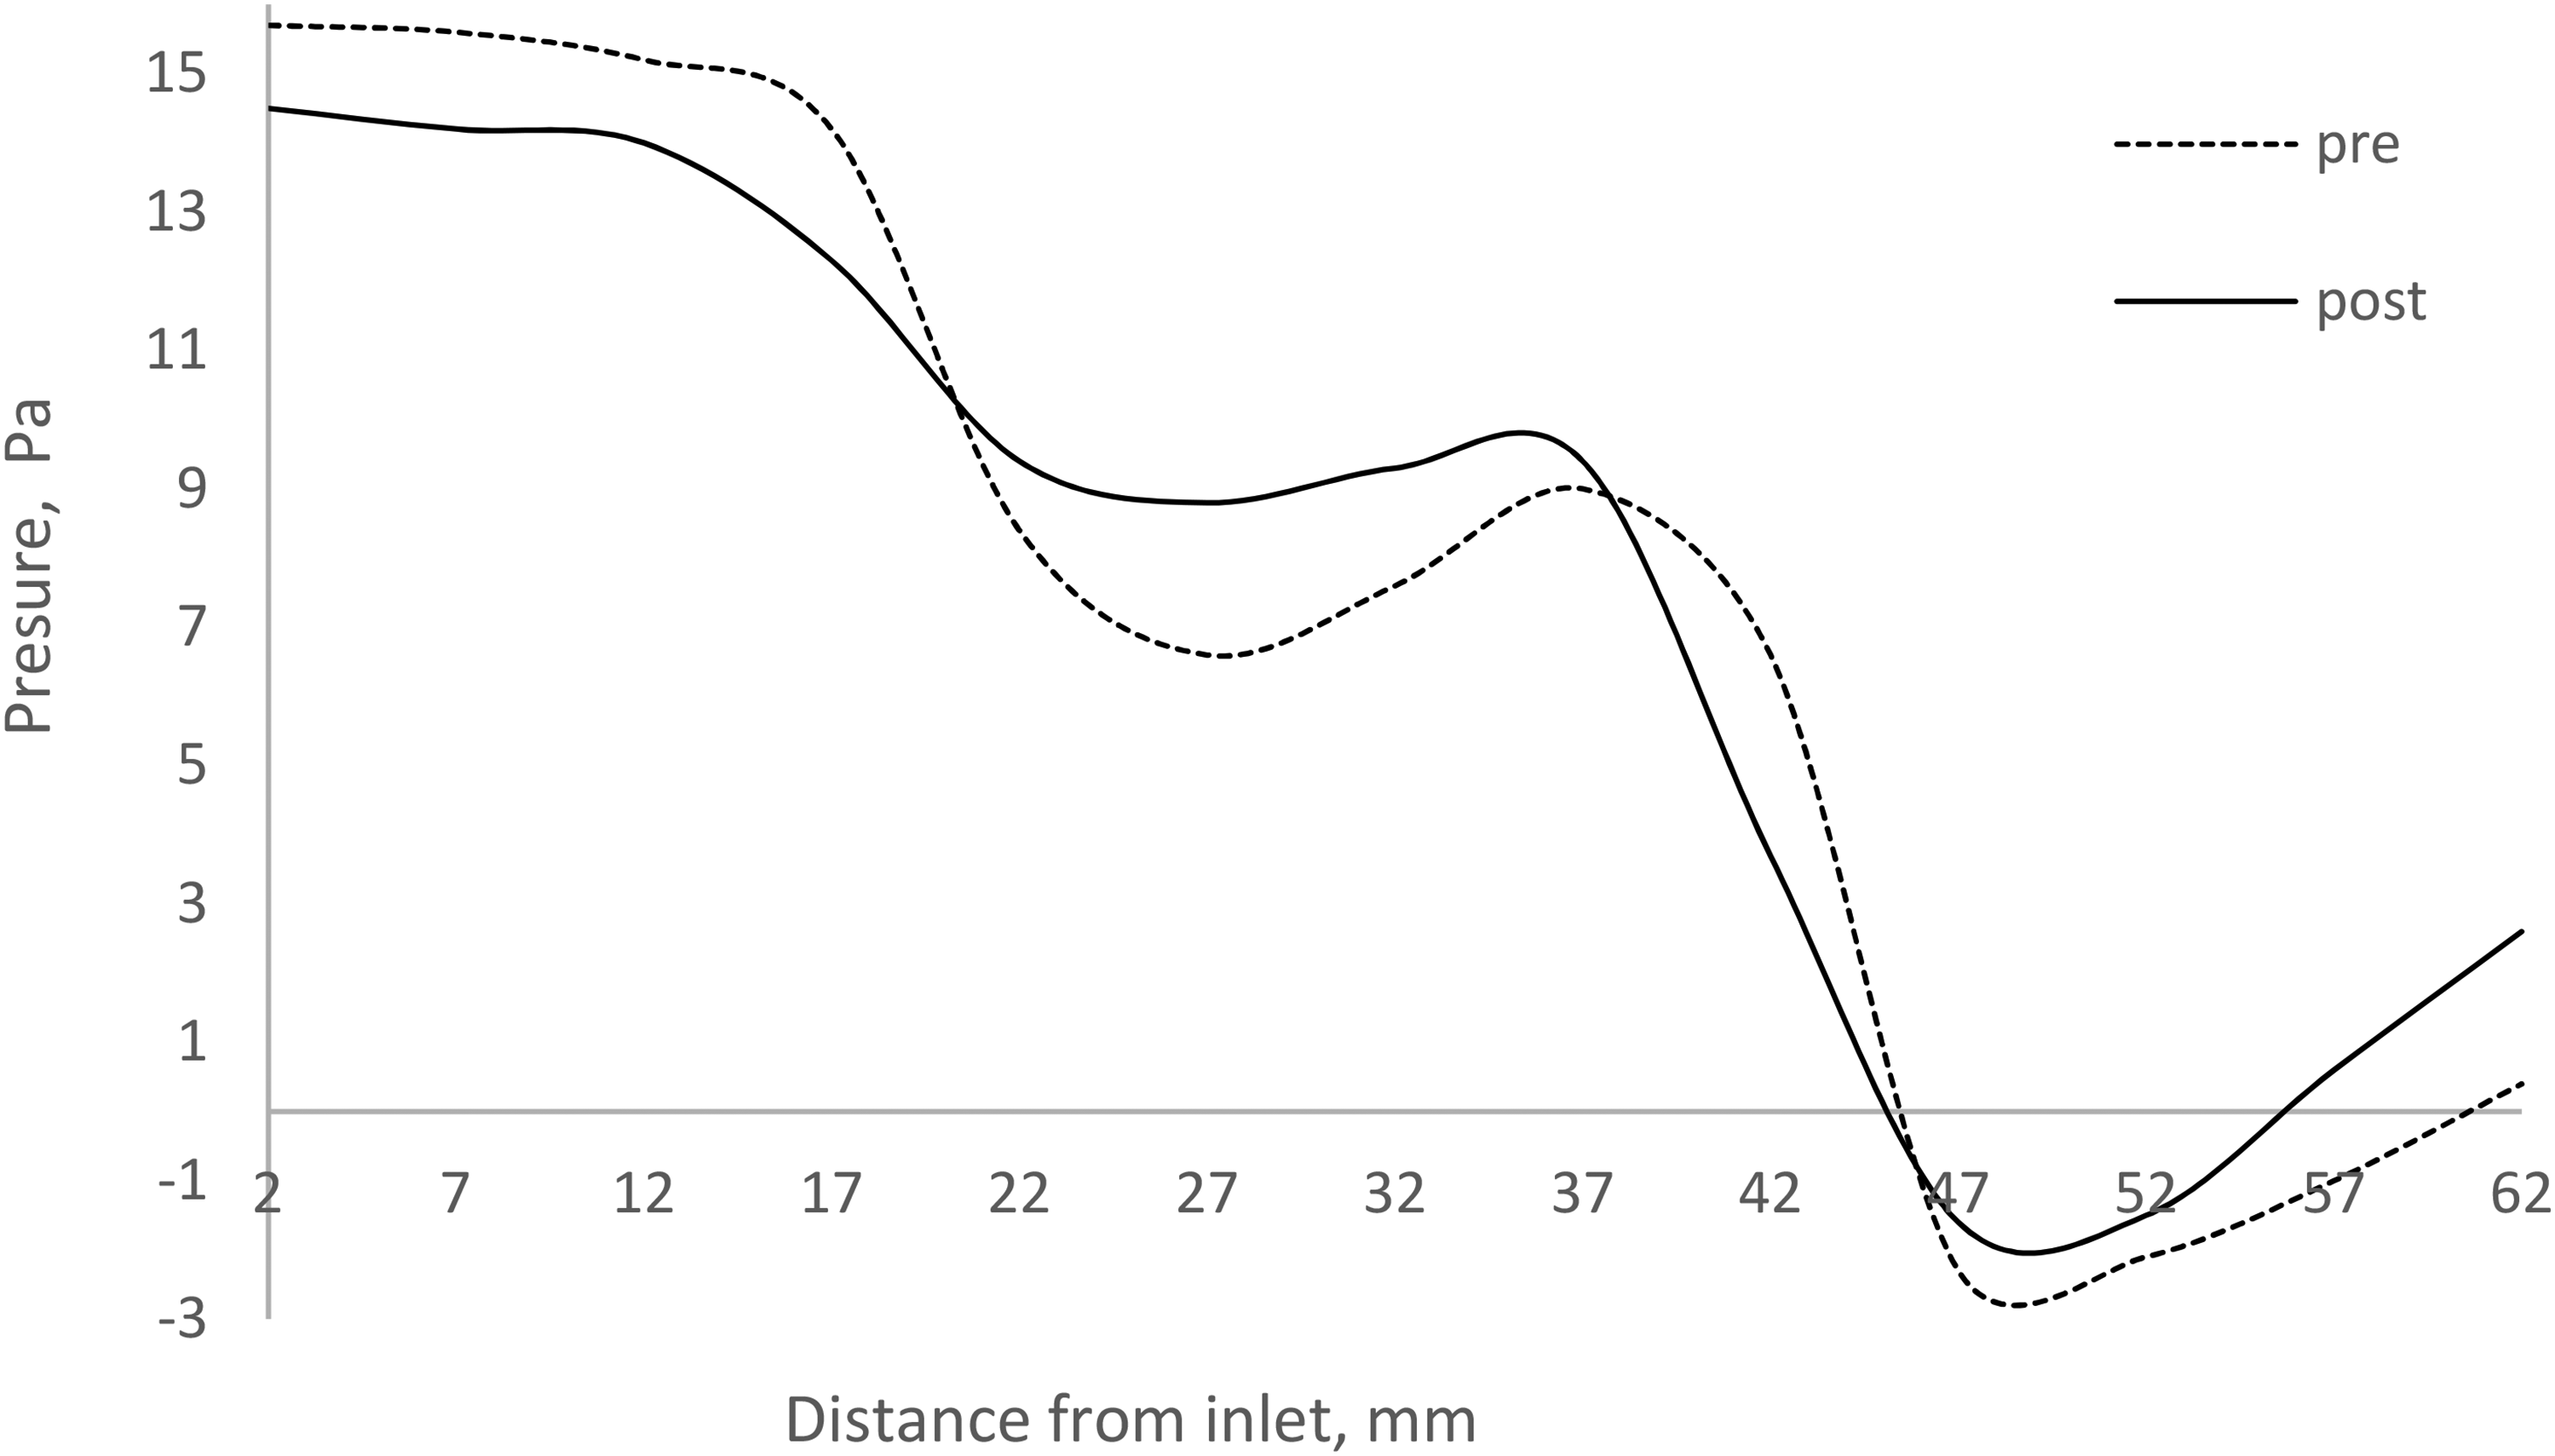
The physical validation was done for both pre-op and post-op to increase the confidence level of CFD analysis. The pre-op pressure plot shows the pressure is at the negative value at the pharynx area right before the larynx—the negative reading peak at −0.7 Pa at 10 L/min flowrates, as shown in Figure 10. The reading decreases exponentially with the increase of the airflow rate, where it peaked at −1.2 Pa at 15 l/min shown in Figure 11 and −2.3 Pa at 20 L/min shown in Figure 12. The negative value is the primary contributor to snoring. The pressure loads triggered by the induced opposing wall in the region with flow acceleration lead to adduction forces that, if significant enough, may lead the airways to collapse. 22 The negative wall pressure was reduced by 70% in the post-op. However, the reduction percentage decreases exponentially with the increase of air flow rate. At 15 L/min, the wall static pressure reduction is by 50%, whereas, at 20 L/min, the static pressure was reduced by 30%.
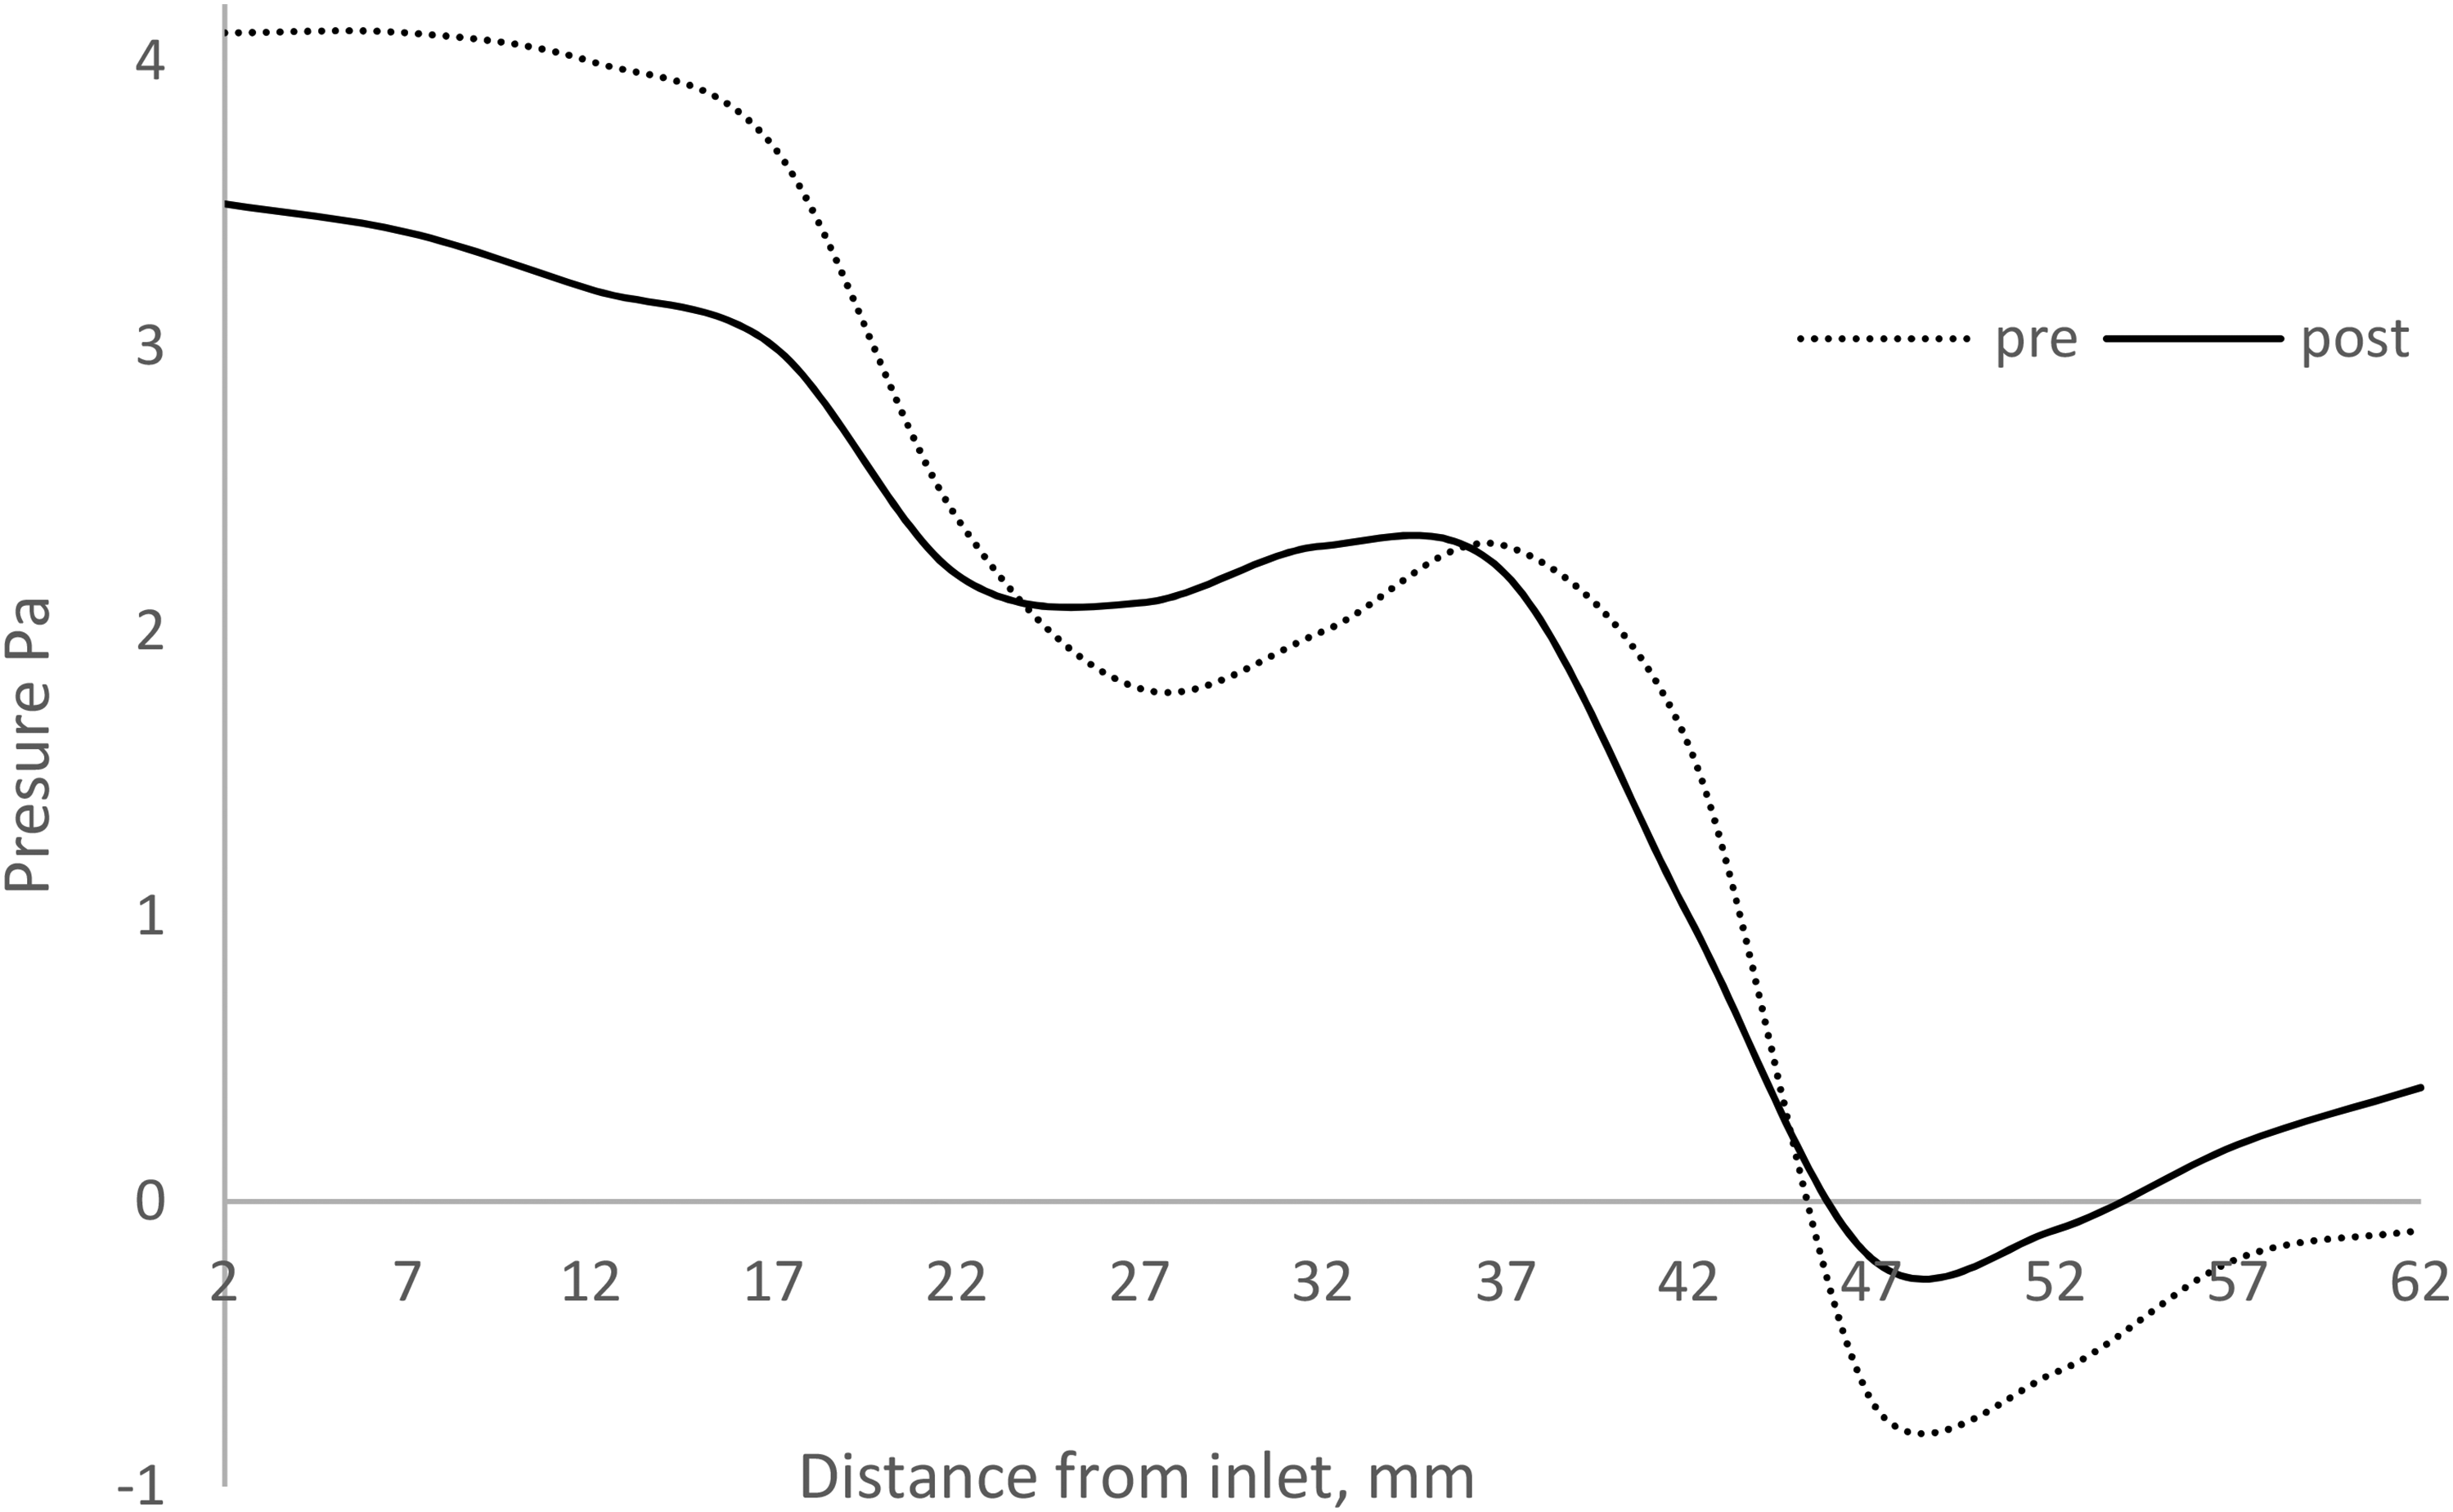
Physical validation pressure plot along the UAs’ surface for pre-op and post-op tested at 10 L/min.
Physical validation pressure plot along the UAs’ surface for pre-op and post-op tested at 15 l/min.
Physical validation pressure plot along the upper airways’ surface for pre-op and post-op tested at 20 l/min.
CFD validation
Because the UA are organic in shape, the physical validation pressure map is limited to several straight spots along their surface. That might not accurately portray the overall pressure. CFD validation provides a much robust result representation on the pressure distribution of the UA. Fourteen cross-section planes starting from the inlet to the outlet 5 mm apart with the average pressure on each plane were extracted and tabulated, as illustrated in Figure 13. The reading on the cross-sectional plane provides the overall pressure of the organic shape of the UA. The graph shows a similar trend to Figure 8, where the negative pressure occurs 45 mm from the inlet. The pressure in the middle of UA has increased after the surgery compared with the pre-surgery pressure reading. Details of the pressure contrast as shown in Figure 14. The pre-surgery reflects a higher-pressure difference across the UA. After the surgery, the pressure difference has reduced by 37%.
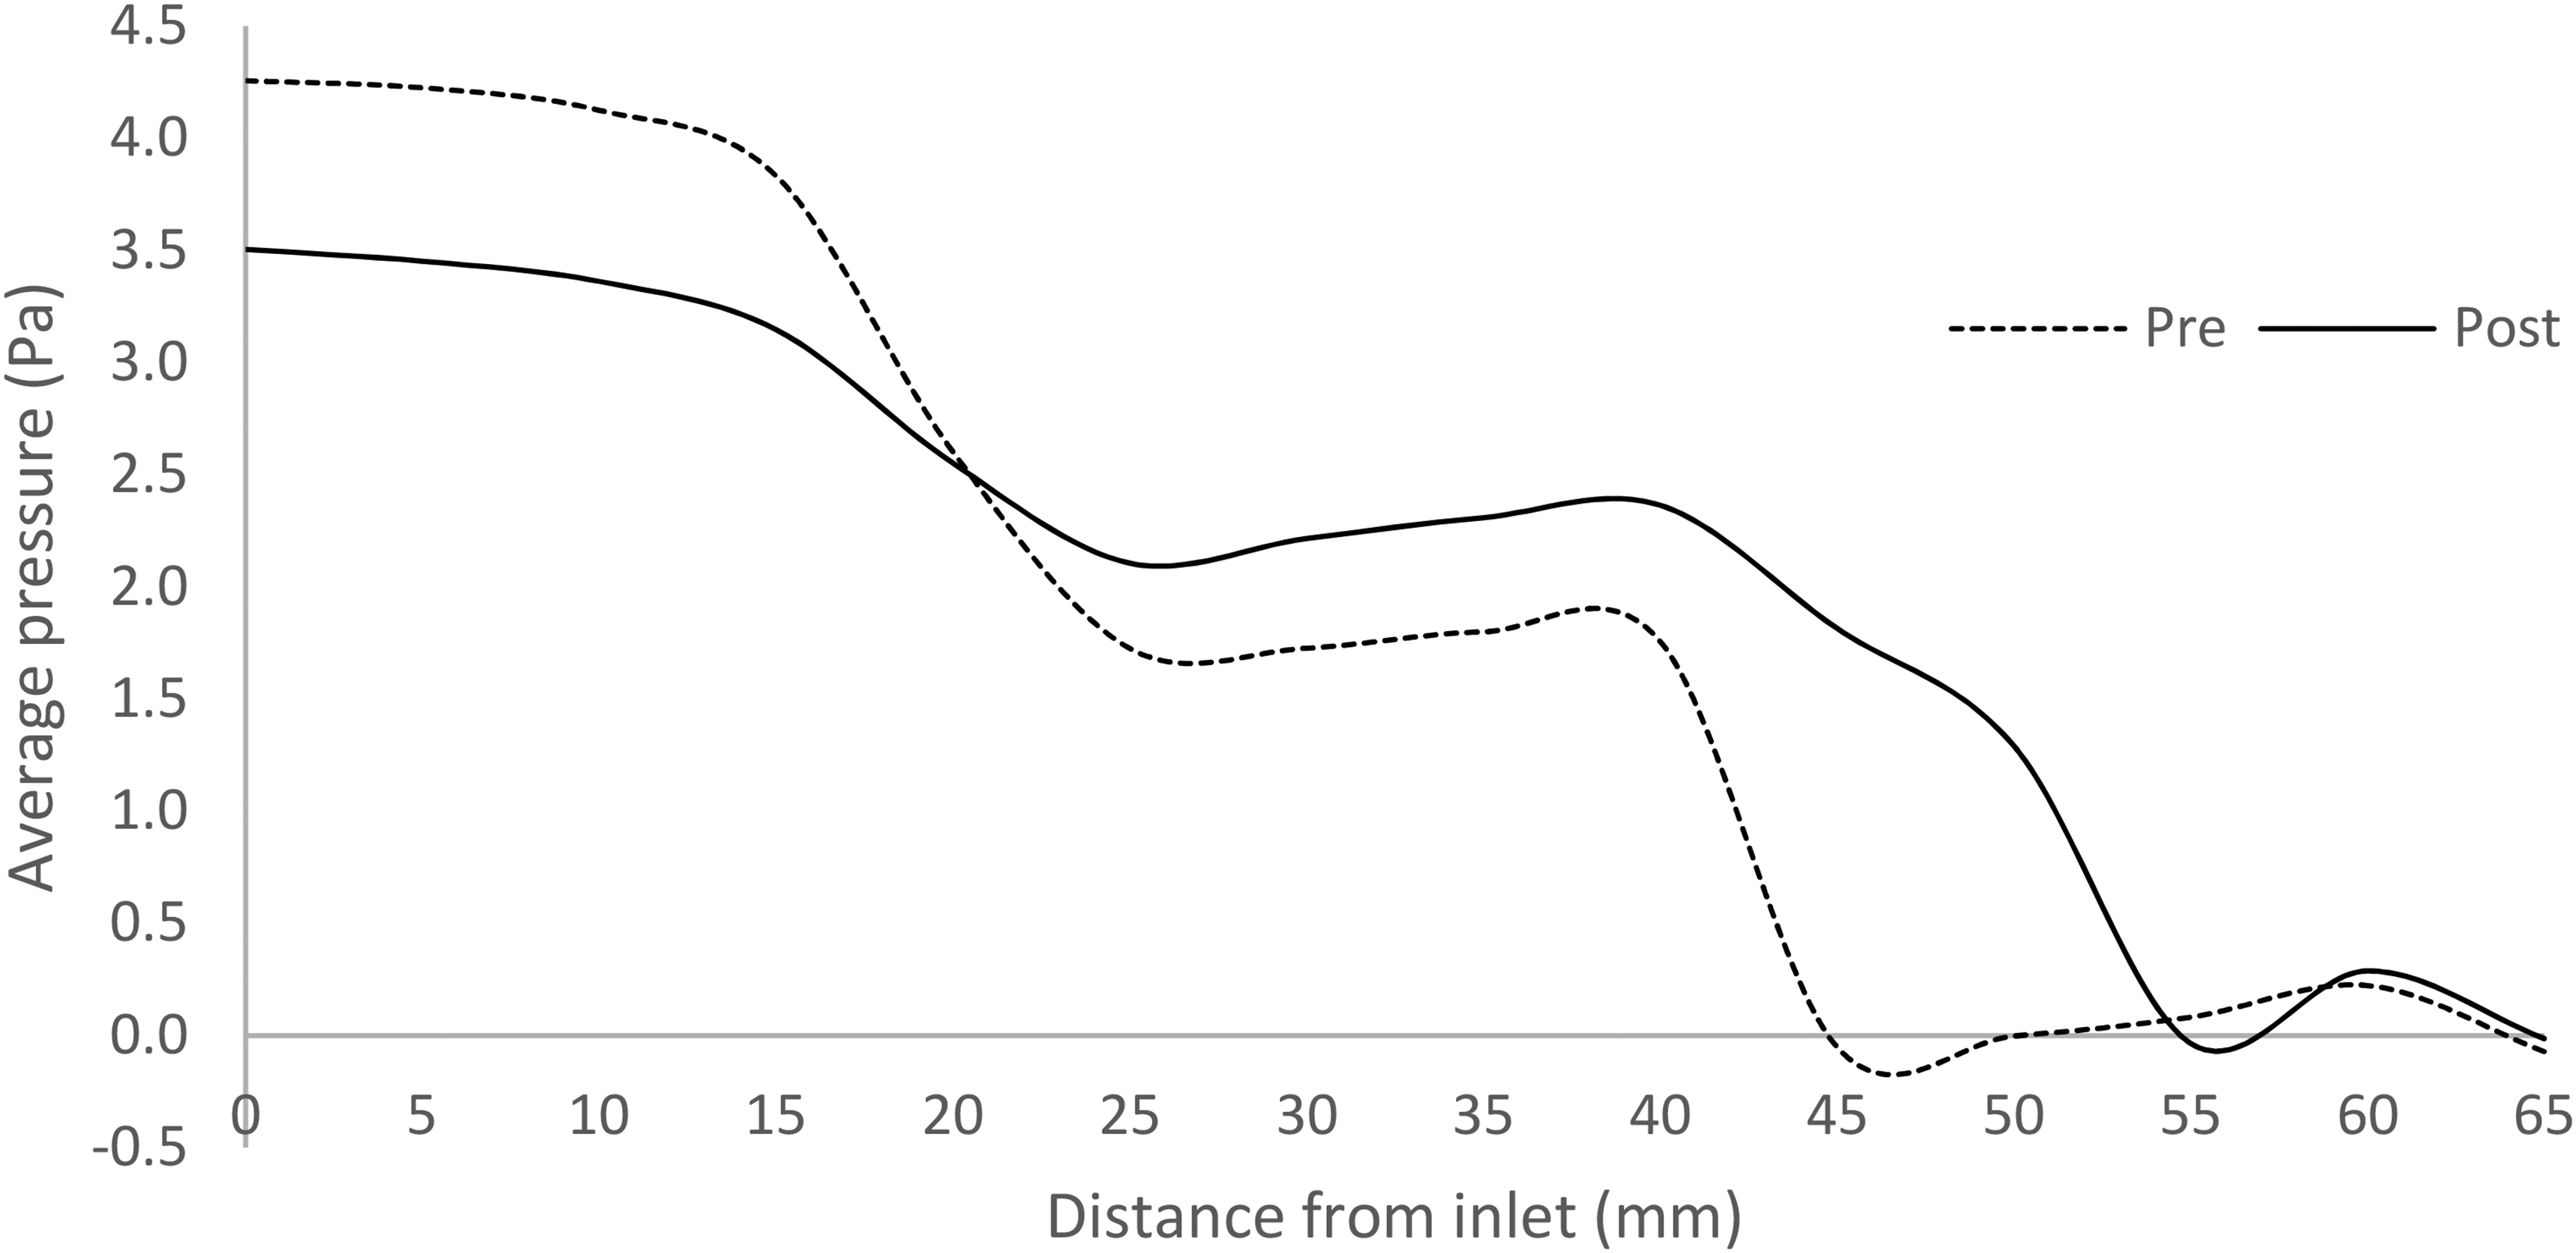
Average pressure on cross-planes of the upper airways.
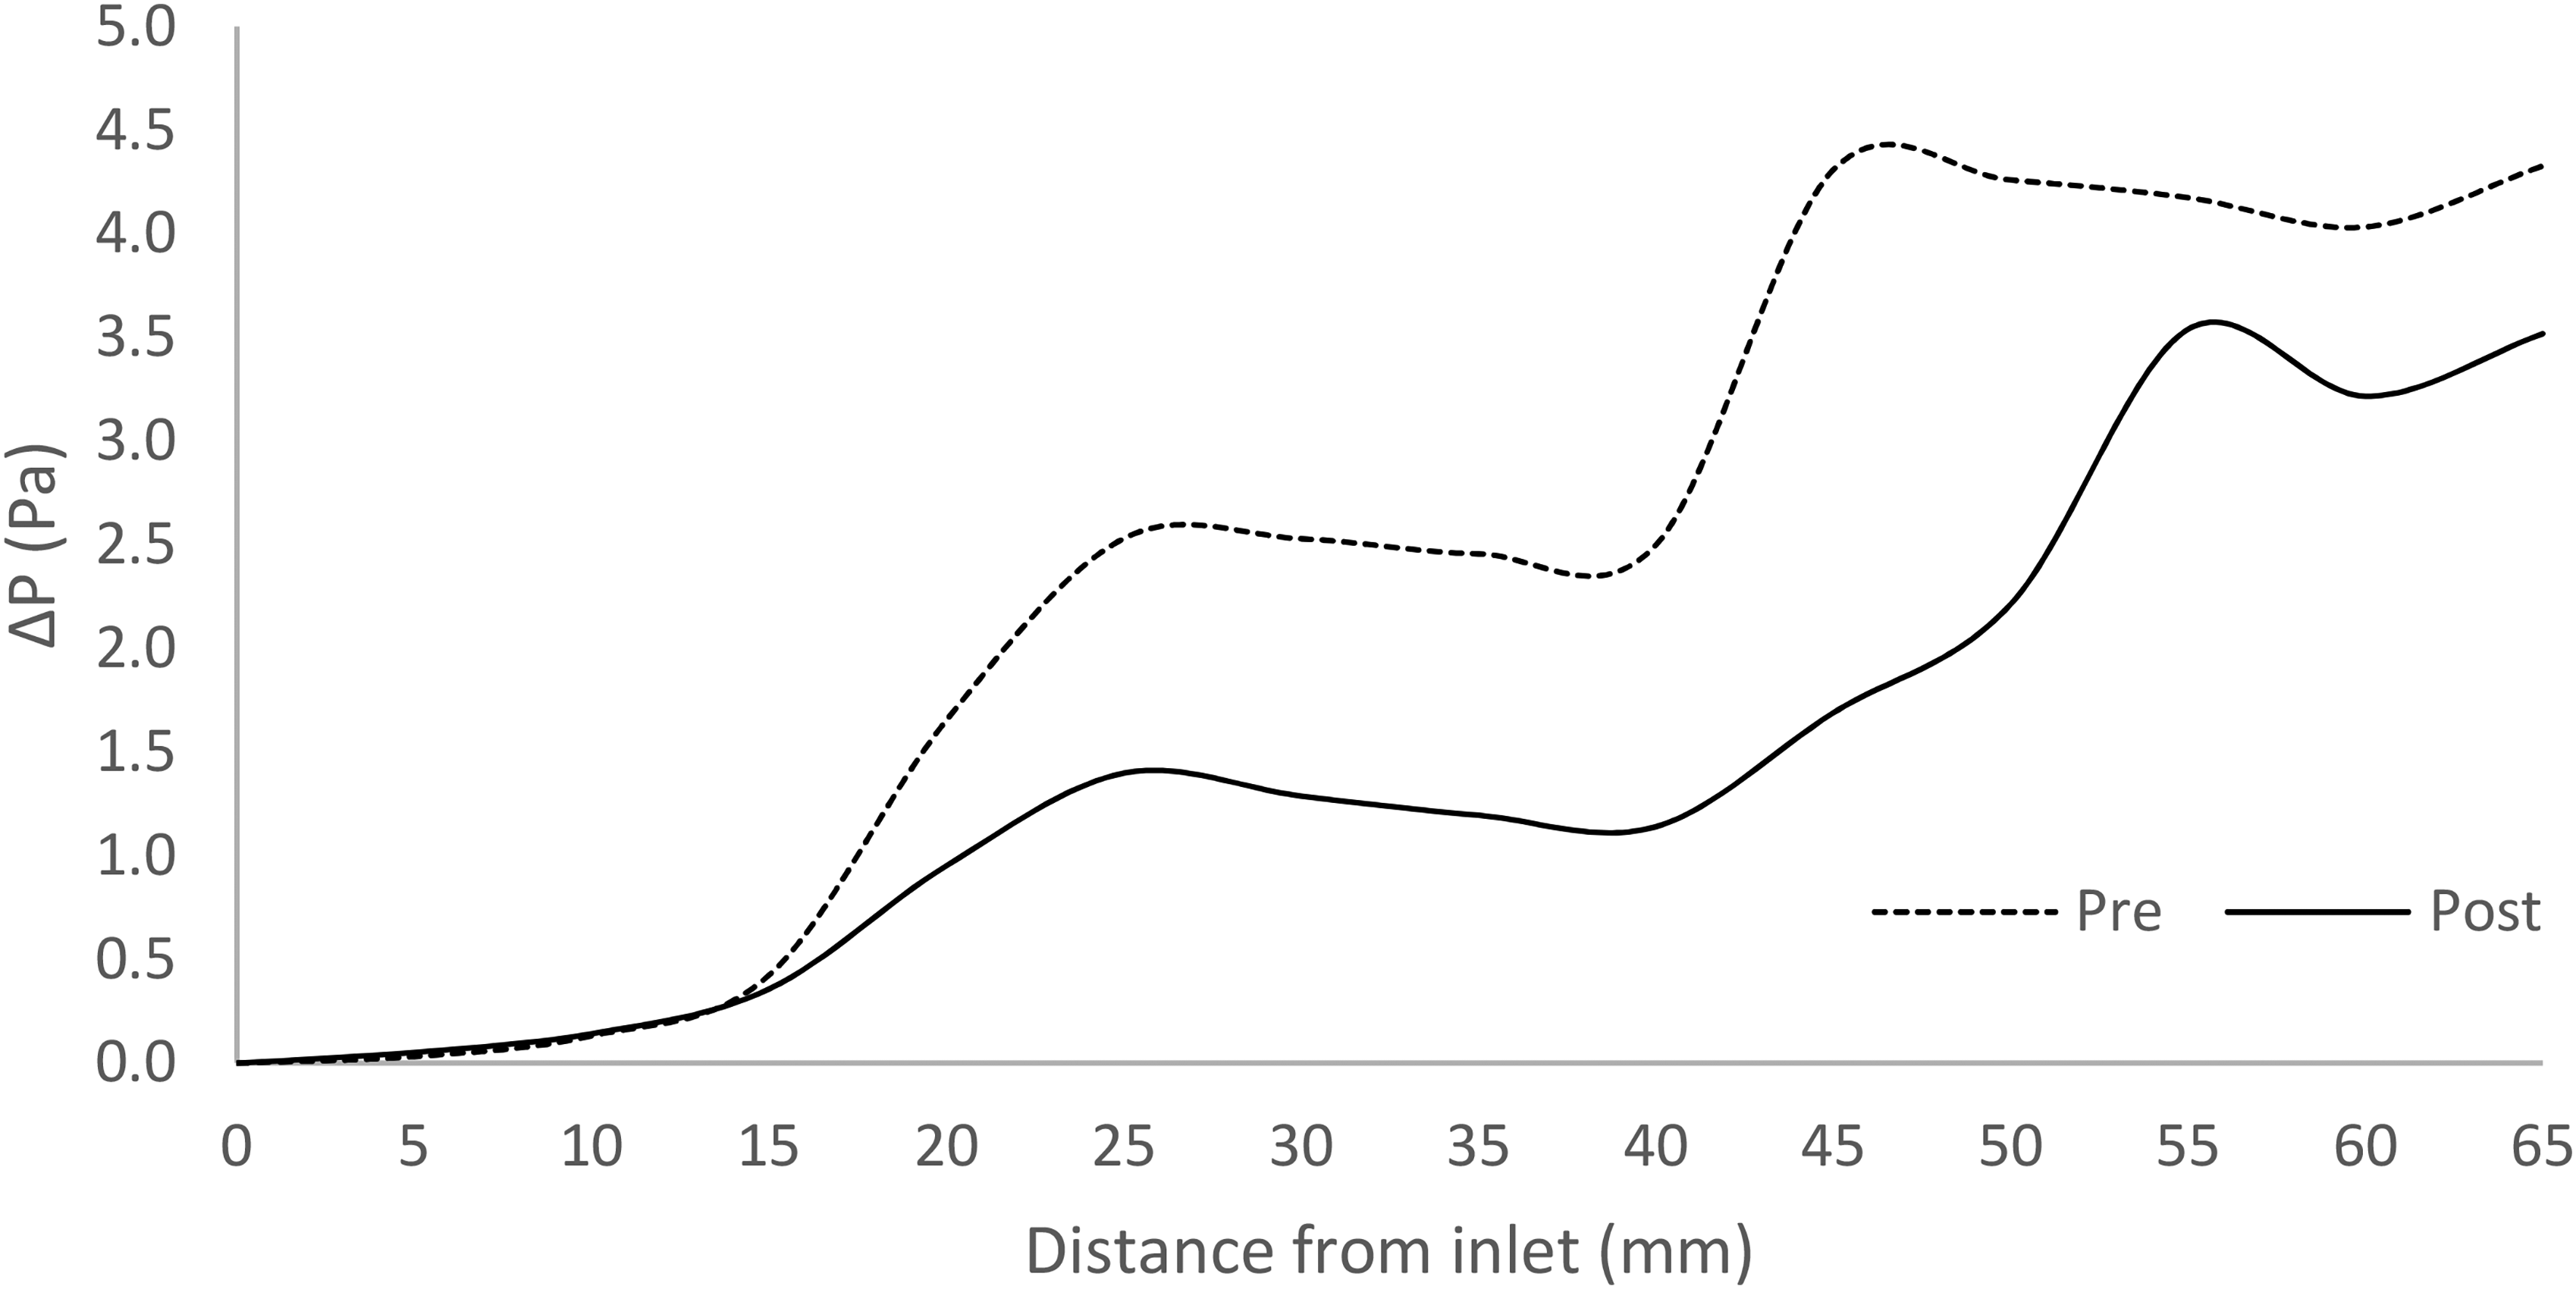
Pressure difference plot across the plane along the middle of UA.
The pressure contour on the surface of the UA, as shown in Figure 15, clearly shows that post-surgery poses a higher-pressure distribution across the surfaces with lower pressure differences from inlet to outlet. Maintaining a higher positive pressure across the UA is vital for OSA treatment. From the pre-op contour plot, it can conclude that the sudden narrowing of the UA shape reflected the higher surface pressure. Bernoulli's theory of a nozzle (Eq 7) observed that air would speed up due to the continuity equation and thus have a net positive amount of work performed on it. The work performed by force from pressure on the inlet side must be greater than the force's amount of adverse work from pressure on the outlet side. Thus, the pressure on the inlet must be larger than the pressure on the narrow side. The higher-pressure region reflects lesser airspeed, while the lower pressure region reflects high airspeed. For this study, the pre-op narrow region reflected lower pressure, thus having higher airspeed, as shown in Figure 16. The higher airspeed at the narrow region is called pharyngeal jetting.22,26,29,30
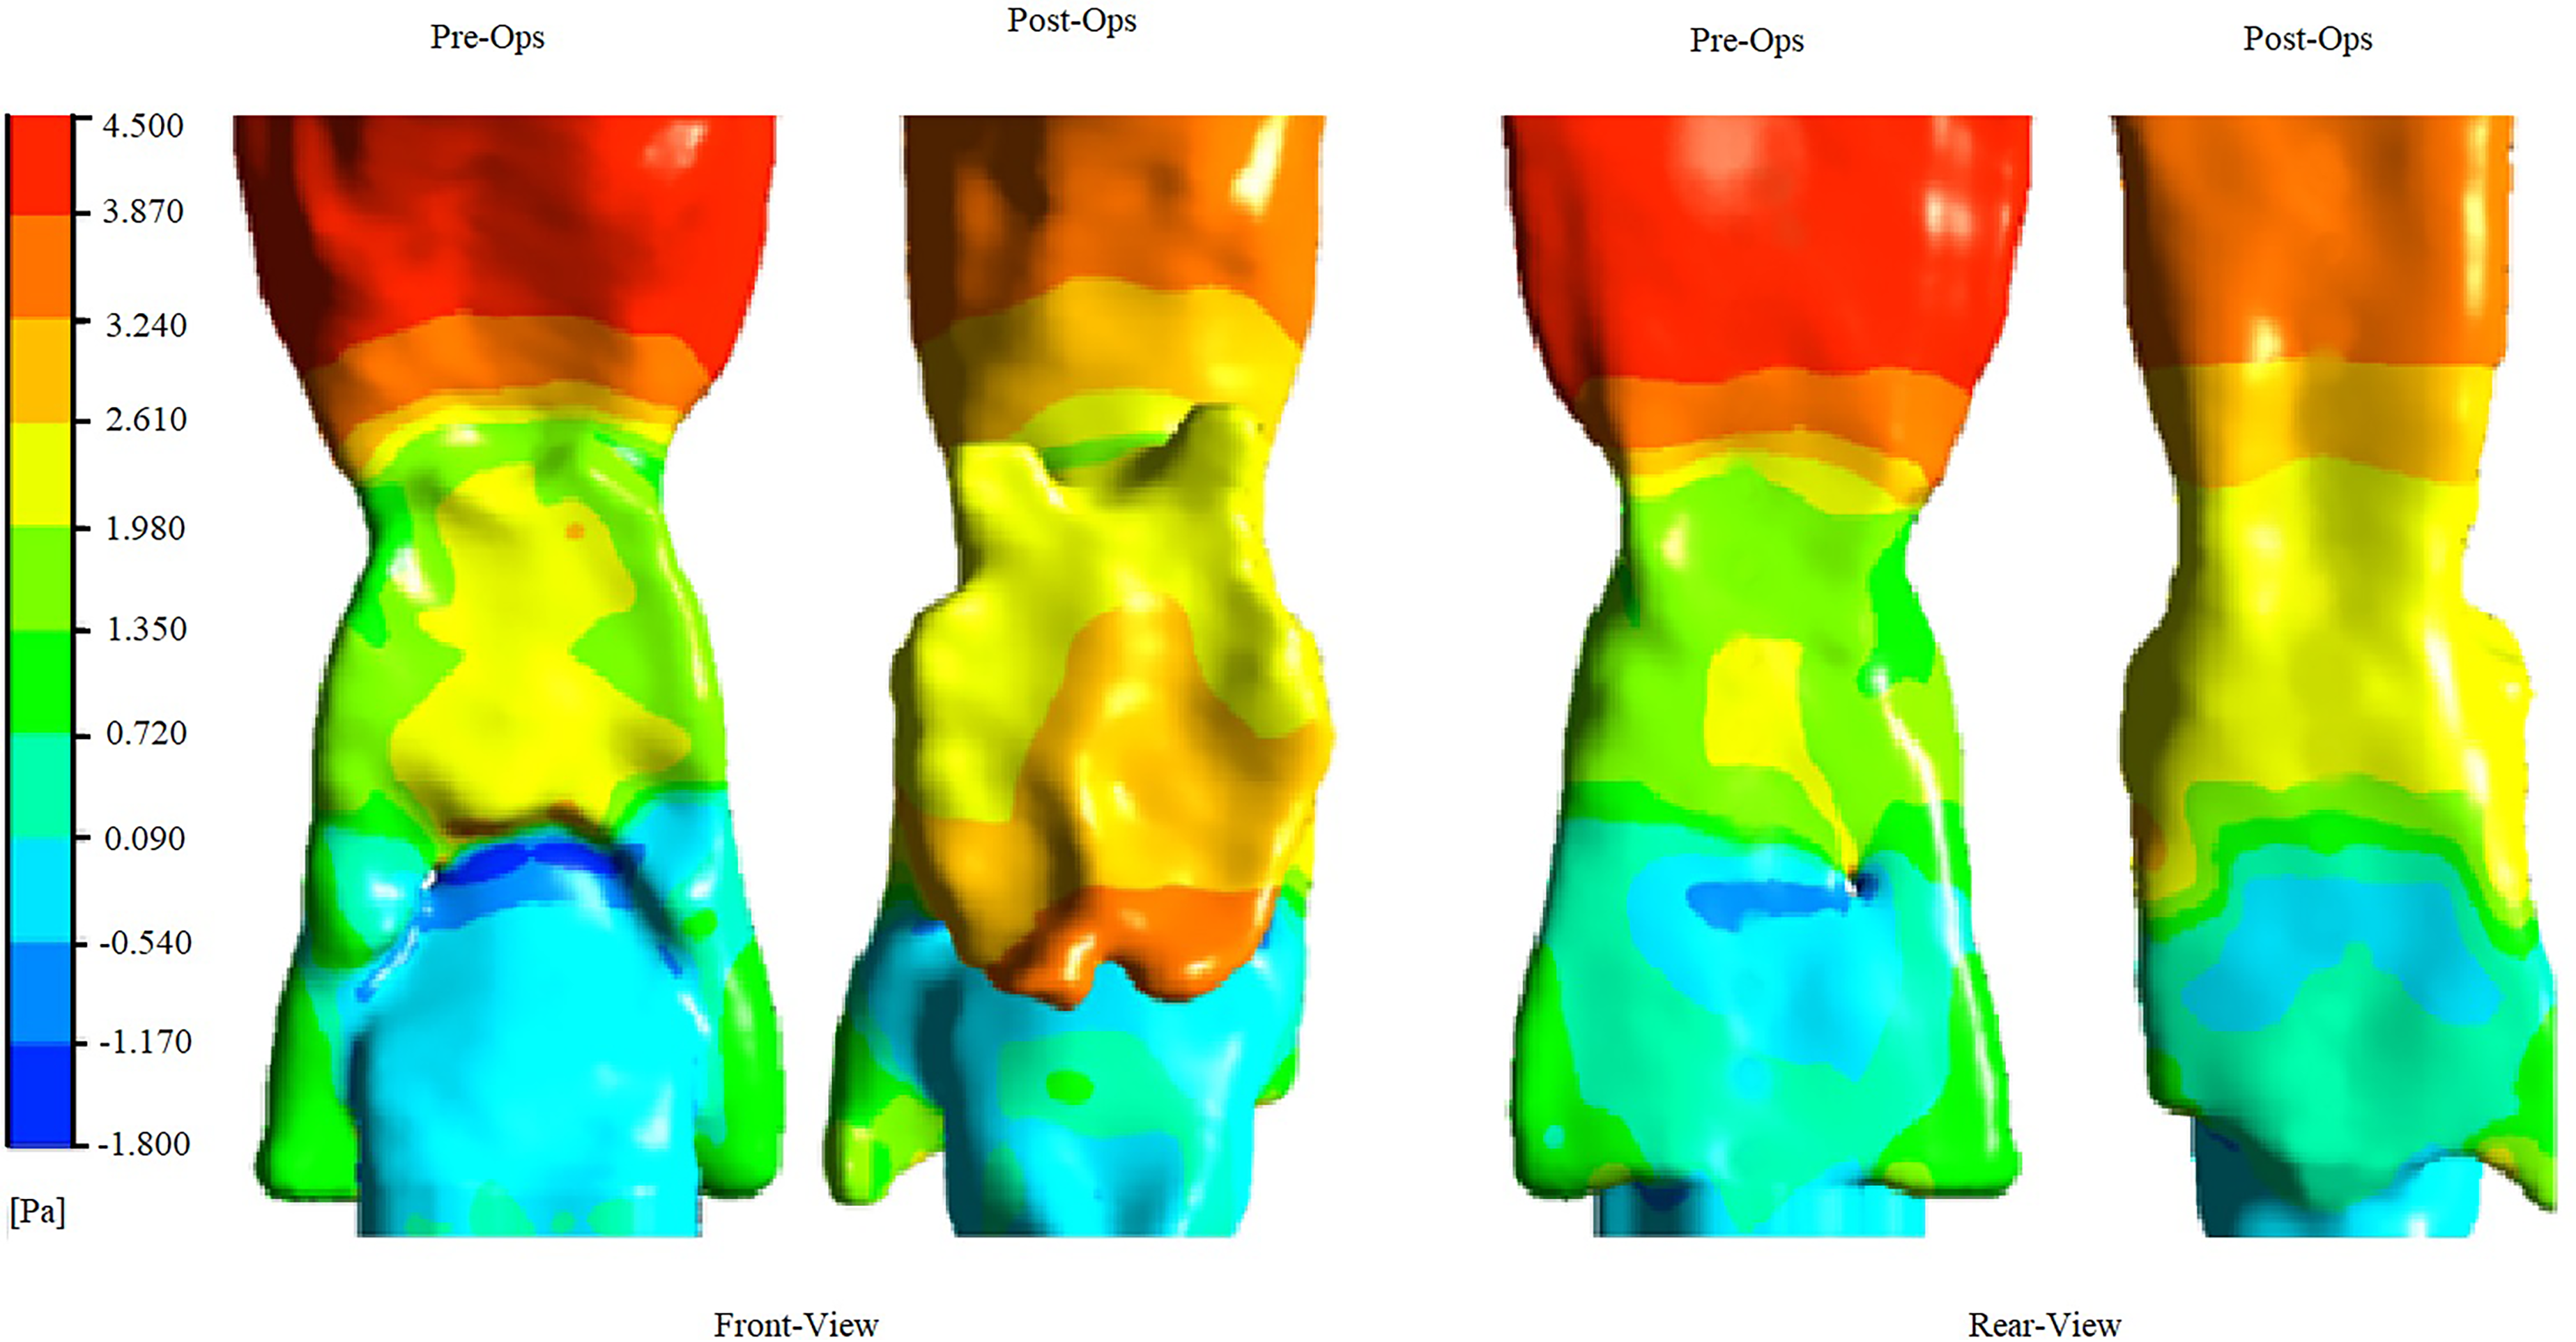
Pressure contour plot on the wall surface of UA.

Velocity contour plot of the UA taken at the middle plane.
Going further with the principle from the energy equation, the higher the air's velocity, poses lower the energy. At the same time, lower airspeed will reflect higher energy. The following is the Bernoulli equation.

For this study, post-op Turbulence Kinetic Energy (TKE) is higher than pre-op as post-op air velocity is lower, as shown in Figure 17.
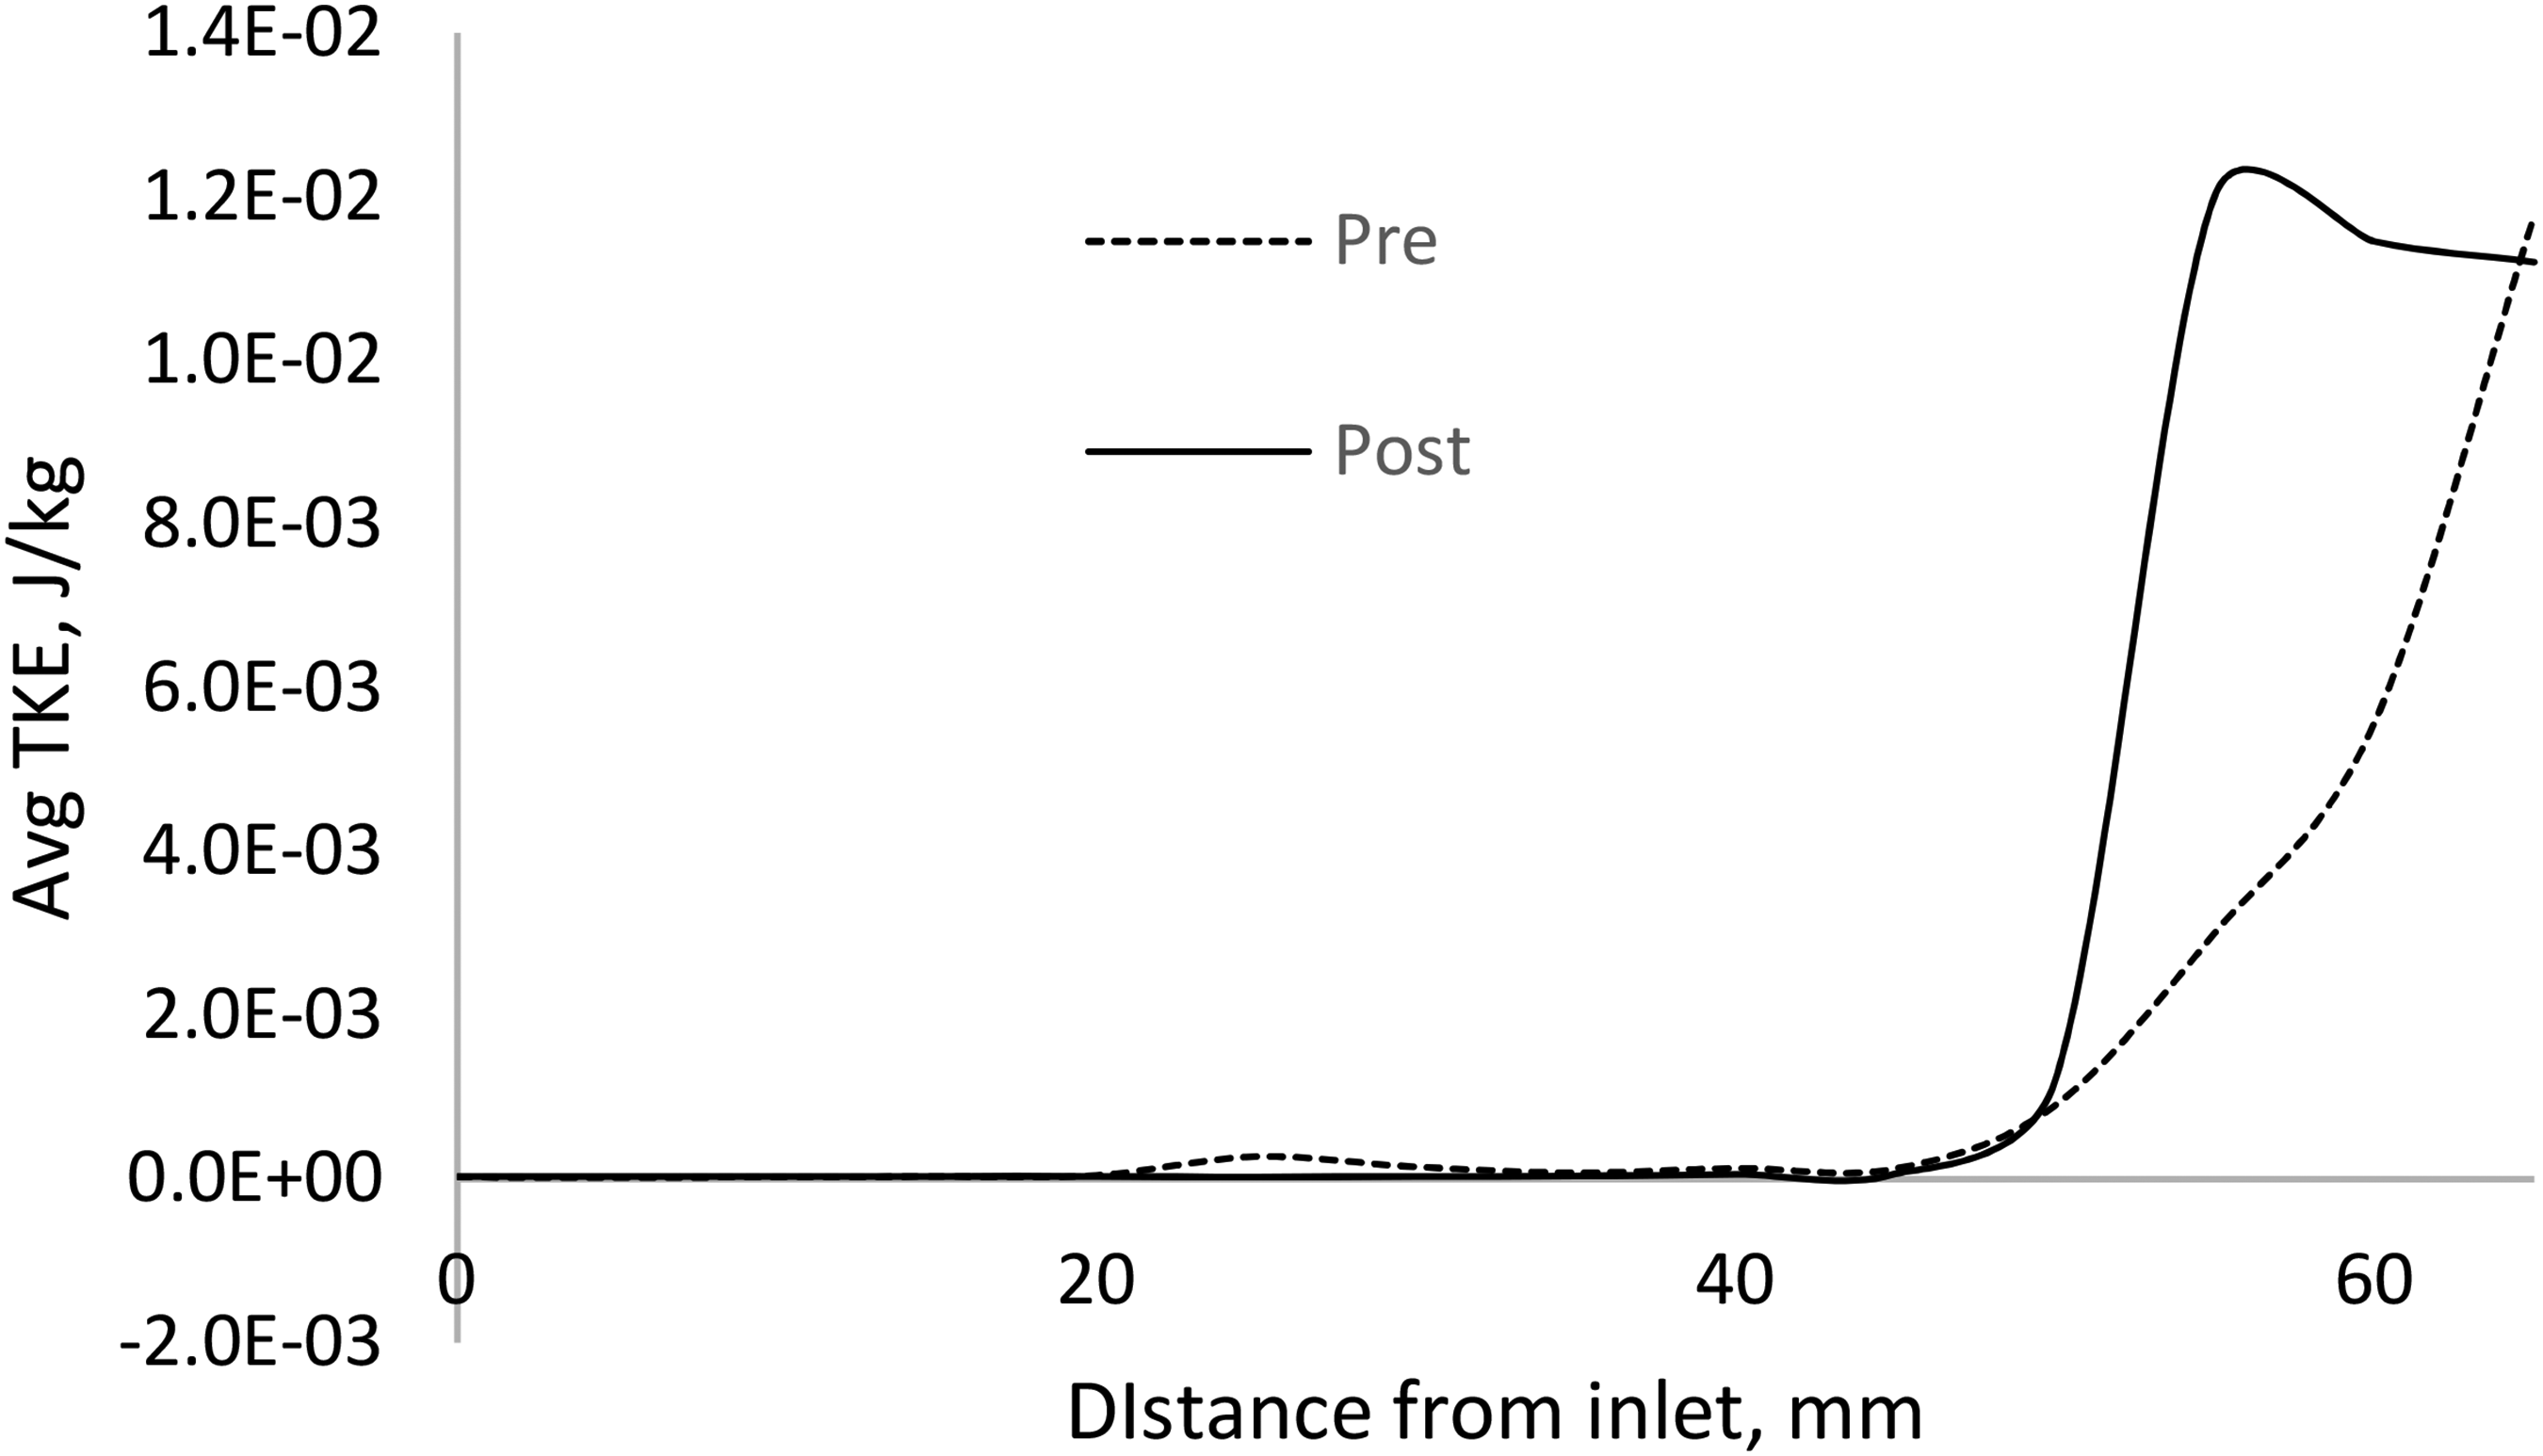
TKE plot taken on planes 5 mm apart across the UA from the inlet.
Discussion
The grid sensitivity analysis is a vital process to determine the validity of the result. This study has stressed that sensitivity analysis alone is not justifiable to determine the CFD optimized grid size. A comparable 1:1 ratio of a physical experiment in this study demonstrates a robust justification for grid size determination. The OSA in this study focused on the pressure distribution across the UA; thus, grid sensitivity analysis should demonstrate the validity of pressure distribution reading. The 13 pressure tap across the silicon cast model provides a reference benchmark reading for the CFD grid determination. There are no other actual means of getting the pressure distribution without tapping several pressure points on live patients. The result poses as close to the UA's actual steady airflow. The CAD for the CFD model in this study has the same added geometry as the physical model. Please note that removing the inlet, outlet, and pressure funnel will somehow change UA's airflow profile. At this validation stage, the CAD model's simplicity is not an excellent idea just for the sake of computing costs. The model should be comparable in flow control, air temperature, and geometry, as demonstrated by this study.
Once the optimum grid size is determined, in this case, at 1.5 million cells, the same mesh setting is the preferred mesh size setting for the CFD. Later, the simulation does not require an additional funnel to optimize the computing cost in the CFD case study. The airflow control of the physical and CFD also must be verified. In this case, the optimum grid size simulated at higher airflow at 15 L/min and 20 L/min. The 1.5 million grid size shows a good agreement at both flow rates. Thus, it can be securely concluded that the physical validation's airflow control has the same sensitivity as the CFD model. This study shows how cross-validation of physical validation with CFD validation and vice-versa could leverage the CFD simulation validity.
The physical validation in this study provides an excellent insight into the pressure distribution of the UA. In this study, the validation compares the pressure distribution of both pre-op and post-op silicon cast. Although it is a pressure point along a middle plane on the UA surface, this validation alone provides a good enough understanding of the pharyngeal jetting's negative pressure. The higher the breathing airflow (flow rate), the higher the negative pressure value at the pharyngeal jetting region. Based on the result, it is noticeable that post-op still recorded the negative pressure but in much less value in all flowrates. To rely on this result alone does not provide a strong justification for UA's overall pressure distribution. The UA geometry is an organic shape that is non-symmetric. Thus, a detailed post CFD analysis is required. As represented in the result section (Figure 12), the average pressure on planes across the UA shows that post-op has a much narrow pressure range than pre-op. The negative pressure has been reduced and shifted away from the jetting region. This result might be coincident because of the nature of the organic shape. However, the pressure difference graph shows that reducing the overall pressure difference does solve the OSA. In the result section, a good understanding of Bernoulli's principle provides better insight into UA airflow behavior. However, to prove that post-op pose significant TKE requires more case studies in the future.
This study presents a novel in vitro model for analyzing the mechanical effects of MAS on UA airflow dynamics in OSA patients. The primary focus was on developing and validating a CFD model against physical measurements obtained from a 1:1 scale replica of a patient's upper airway derived from clinical CT scan data. While the results of this in vitro analysis demonstrate a reduction in negative pressure in the pharyngeal region and improved airflow patterns following simulated MAS, the study's scope is limited to the mechanical perspective of the intervention. Direct clinical validation, involving in vivo measurements of upper airway pressure distribution before and after surgery, is ethically impossible at this stage due to the invasive nature of such procedures. Furthermore, the model is based on a single patient's anatomy, which limits the generalizability of the findings to a broader patient population. However, the observed improvements in airflow patterns and pressure reduction in the pharyngeal region align with clinical observations that MAS reduces upper airway collapsibility, as evidenced by significant improvements in the Apnea-Hypopnea Index (AHI) reported by various studies.18,21,23 Future research will focus on incorporating clinical data, such as post-operative polysomnography results, to further validate the model's predictive capabilities and to explore methods for expanding its applicability to a wider range of patient anatomies.
While direct in vivo pressure measurements present ethical challenges, the CFD model developed in this study offers valuable insights into the mechanical aspects of OSA with potential clinical relevance. The simulations demonstrate a clear relationship between upper airway geometry and the distribution of negative pressure, particularly in the velopharyngeal region. Specifically, the research found that reductions in minimum negative pressure following simulated MAS treatment correlated with improved AHI scores, a key clinical indicator of OSA severity. 31
A notable advancement in this study is the comprehensive analysis of TKE distribution within the upper airway, a feature not previously reported in OSA CFD modeling. The TKE findings provide unique insights into the complex flow patterns and potential sites of airway instability, offering a more nuanced understanding of the fluid dynamics involved in OSA. This novel approach to quantifying turbulence in the upper airway represents a significant contribution to the field and may lead to improved predictions of airway collapse and treatment outcomes.
The model's ability to identify patients with persistent high negative pressure despite simulated interventions suggests likely non-response to standard treatments. 28 By providing detailed insights into how upper airway geometry influences negative pressure distribution and TKE, this analysis contributes to a deeper understanding of OSA mechanisms and may aid in developing targeted treatment strategies. 26
The strengths of this study lie in its rigorous in vitro validation, detailed mechanical analysis including the novel TKE findings, and potential for simplified prediction of treatment outcomes. By demonstrating relationships between CFD-derived negative pressure, TKE, and clinically relevant AHI, this research offers a valuable tool for understanding and potentially predicting MAS treatment efficacy in OSA patients.
The methodology's robustness is evident in its comprehensive integration of detailed airway geometry, advanced CFD techniques, and rigorous in vitro validation. In contrast to previous investigations that often relied on simplified airway models or lacked experimental validation, this approach provides a more veracious and precise representation of upper airway dynamics. The inclusion of TKE analysis further distinguishes this study from prior work, offering a more complete picture of the fluid dynamic environment in OSA.
While direct clinical validation was beyond the scope of this investigation, the work establishes a solid foundation for future research aimed at translating these mechanical insights, including the novel TKE findings, into improved clinical outcomes for OSA patients. Subsequent studies correlating the CFD findings with clinical data could potentially validate the use of this model as a predictive tool in OSA management. Thus, while acknowledging the current limitations in direct clinical applicability, this study represents a significant advancement in the mechanical analysis of upper airway dynamics in OSA, with promising implications for future clinical research and practice.
Conclusion
This comprehensive CFD analysis of upper airway dynamics in obstructive OSA has demonstrated the importance of rigorous physical model validation to ensure the reliability and accuracy of turbulence modeling. The validation process undertaken in this study provides a robust cross-validation reference for future CFD investigations in the field of OSA research.
A key finding of this work is the clear relationship between reductions in the overall pressure difference across the upper airway and positive treatment outcomes, as reflected in improved AHI scores. This suggests that the CFD model presented may serve as a valuable tool for estimating the potential clinical benefits of various interventions, such as mandibular advancement or upper airway surgery.
Moreover, the novel analysis of TKE distribution within the upper airway offers unique insights into the complex fluid dynamics involved in OSA. The observation of increased TKE towards the posterior region of the upper airway highlights the potential role of turbulence in contributing to airway instability and collapse.
While this study did not directly correlate the CFD findings with post-operative clinical outcomes, the comprehensive methodology and validation approach provide a solid foundation for future research in this direction. Additional case studies comparing pre- and post-treatment TKE distributions, along with corresponding clinical data, will be crucial to further validate the predictive capabilities of this CFD model and its applicability in guiding personalized treatment strategies for OSA patients.
In conclusion, this work represents a significant advancement in the mechanical analysis of upper airway dynamics in obstructive sleep apnea. The integration of detailed patient-specific anatomy, advanced CFD techniques, and rigorous physical validation establishes a robust framework for understanding the complex interplay between airway geometry, fluid mechanics, and the potential for airway collapse. The findings, particularly the novel TKE analysis, pave the way for future studies to bridge the gap between mechanical insights and improved clinical outcomes in the management of this prevalent sleep-disordered breathing condition.
Footnotes
Acknowledgment
The authors would like to thank Ministry of Higher Education (MOHE), Malaysia for providing financial assistance under Fundamental Research grant Scheme (FRGS/1/2019/TK03/UTP/02/5) and Universiti Teknologi PETRONAS for providing the required facilities to conduct this research work. The authors extend their appreciation to the Deanship of Research and Graduate Studies at King Khalid University for funding this work through Small Research Project under grant number RGP.1/210/45

Funding
The authors received no financial support for the research, authorship, and/or publication of this article.
Declaration of conflicting interests
The authors declared no potential conflicts of interest with respect to the research, authorship, and/or publication of this article.