
Abstract
The current study investigates the curvature effect due to various angles of curvature on the blood flow in human artery. The stenosis is considered to have three sizes 70%, 80% and 90% blockage before the curve section of artery. Numerical study of four different angle of curvature was considered to understand the flow behavior of artery having various curvatures, on the hemodynamics factors that includes drop in arterial pressure, flow velocity as well as wall shear stress. It was found that, the augmentation of the flow resistance due to the curvature increases in presence of stenosis. It was also noted that the wall shear is higher at the outer wall as compared to the inside wall in four models considered. Results showed that both the curvature of artery and size of the stenosis have significant impact. These two factors should be considered by cardiologist to assess the complexity of stenosis.
Introduction
The development of atheroma which is mass of fatty and undesirable materials got deposited in the inner side of artery in a localize region, leads to undesirable impact on blood velocity, artery pressure along with other parameters namely shear stress on the walls of coronary arteries. This has been known for many years to cause the myocardial infraction. The myocardial infraction is considered as most chronic diseases in humans. There are many researchers who have worked on the topic and their clinical findings along with numerical simulations have proved that, the hemodynamic has a decisive role in the deposition of fatty and other cellular materials in the artery that in turn leads to atheroma [1,2] Apart from the arterial blood flow, the geometry of the arteries also has a significant role that affects the flow pattern which leads to the development of stenosis [3]. According to the study performed by [4], it was reported that a significant relation exists between the regions of the disturbed flow and the progression of deposition of fatty and other materials on the inner side of artery. It is known widely that the flow disturbance occurs across the outside of wall in the branches where the artery divides into two branches as well as at the inside surface of bends.
In the past few years, numerous experimental studies in the clinics as well as computational efforts were conducted to know the blood flow characteristics in the curved vessels and bifurcations by many researchers, across the globe. The effect of blockage towards the downstream was investigated in curved artery [5]. The impact of blood having non-Newtonian property on the flow pattern in a 90° curved tube was noted by numerically and experimentally [6]. Yao studied blood flow in 3 dimensional models of arteries having curvature with elliptical stenosis [7]. They showed that secondary flow pattern in curved artery brings about the rise in shear stress on vessel wall. The effect of symmetric and asymmetric stenosis on the blood flow in a straight tube was numerical studied by [8], to investigate blood flow phenomena in post stenosis area. The CFD (computational fluid dynamic) as a tool was used to investigate the flow characteristics of blood in the coronary curved artery with various degree of stenosis by [9–11]. These researchers studied Non-Newtonian as well as Newtonian models for a healthy person having right coronary arteries with no sign of stenosis in steady and transient condition. Previous studies have demonstrated the effect of curve nature of artery on the velocity profiles [12]. The effect of arterial wall curvature and angle of bifurcation on the coronary diagnostic parameters was studied [13,14].
The aim of the current study is to investigate the effect of curvature on the hemodynamics in coronary artery. The various angles of curvatures were simulated at coronary artery in order to identify the effect of curvature on hemodynamics in the coronary artery. To the best of author’s knowledge, the influence of curvature angle and size of stenosis before the beginning of curvature is not yet reported in literature.
Methodology
The current research is based on the four solid models representing 30°, 60°, 90° and 120° curvature angle (θ) of coronary artery. L1 and L3 represent the length prior to the stenosis and immediate after the curvature which is 30 mm and 40 mm respectively. The curvature length L2 for all the four models under investigation is kept at constant value of 10 mm. The proximal and throat diameters of the artery is represented by D and d respectively, and the dimensions of stenosis consist of converging (lc), throat (lm) and diverging (lr) lengths are as given in Table 1. Figure 1 shows the geometric representation of 30° curved artery model. The various size of stenosis was introduced prior to the beginning of curvature in the coronary artery models. The percentage area stenosis was calculated by using Equation (1), where D and d is proximal and throat diameters of the coronary artery respectively. The length and other dimension of stenosis as given by [15,16] are shown in Table 1. All the four solid models were meshed with the hexahedral element in the range of 350000 and 500000. Figure 2 shows the grid structure generated for the 30 degree curved artery for 70%AS. The flow simulation was performed by with the help of ANSYS-CFX 14.5 [17,18]
Dimensions of different degree of stenosis in the models (all the dimension are in mm) [15]
Dimensions of different degree of stenosis in the models (all the dimension are in mm) [15]

Geometric representation of curved artery for 30 degree.

Mesh for the curved artery of 30 degree. (a) Longitudinal section. (b) Cross section at mid of the stenosis as indicated by line in (a).
The blood flow in human beings is widely accepted to follow the non-Newtonian behavior. It is also known fact that the blood is incompressible fluid that can be described by the generalized Navier–Stokes equations as given below.
The velocity gradients popularly expressed as continuity equation can be given as:
In Equation (2), the term v stands for 3D velocity vector, t stands for time, the density of human blood is indicated by ρ, P is the pressure in the artery and τ is the stress tensor.
The Carreau model is used for non-Newtonian characteristics of blood:
The present work is an attempt to reflect the realistic physiological behavior by making use of a three-dimensional geometry and subjecting it to numerical simulation with a time dependent parabolic velocity
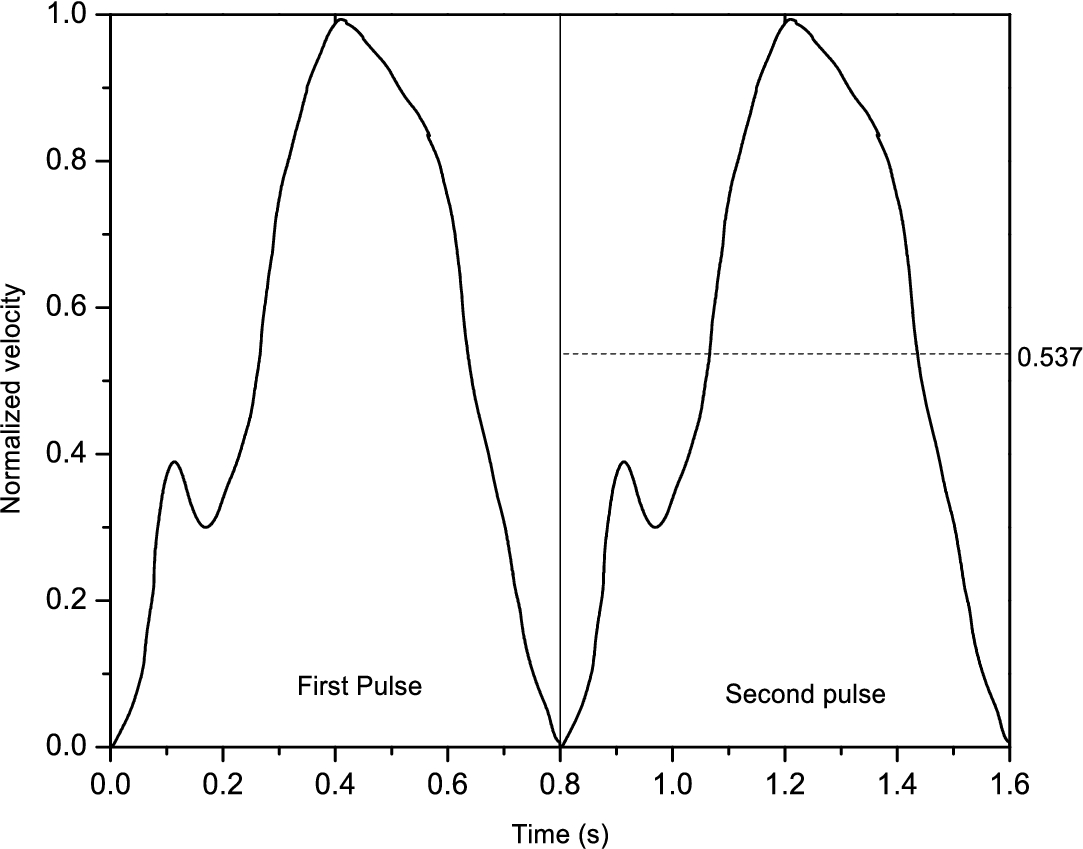
Coronary flow wave form
The mean Reynolds numbers at the proximal for 70%, 80%, and 90% area stenosis were 354, 333, and 232, respectively. The average Reynolds numbers was calculated by the equation as (
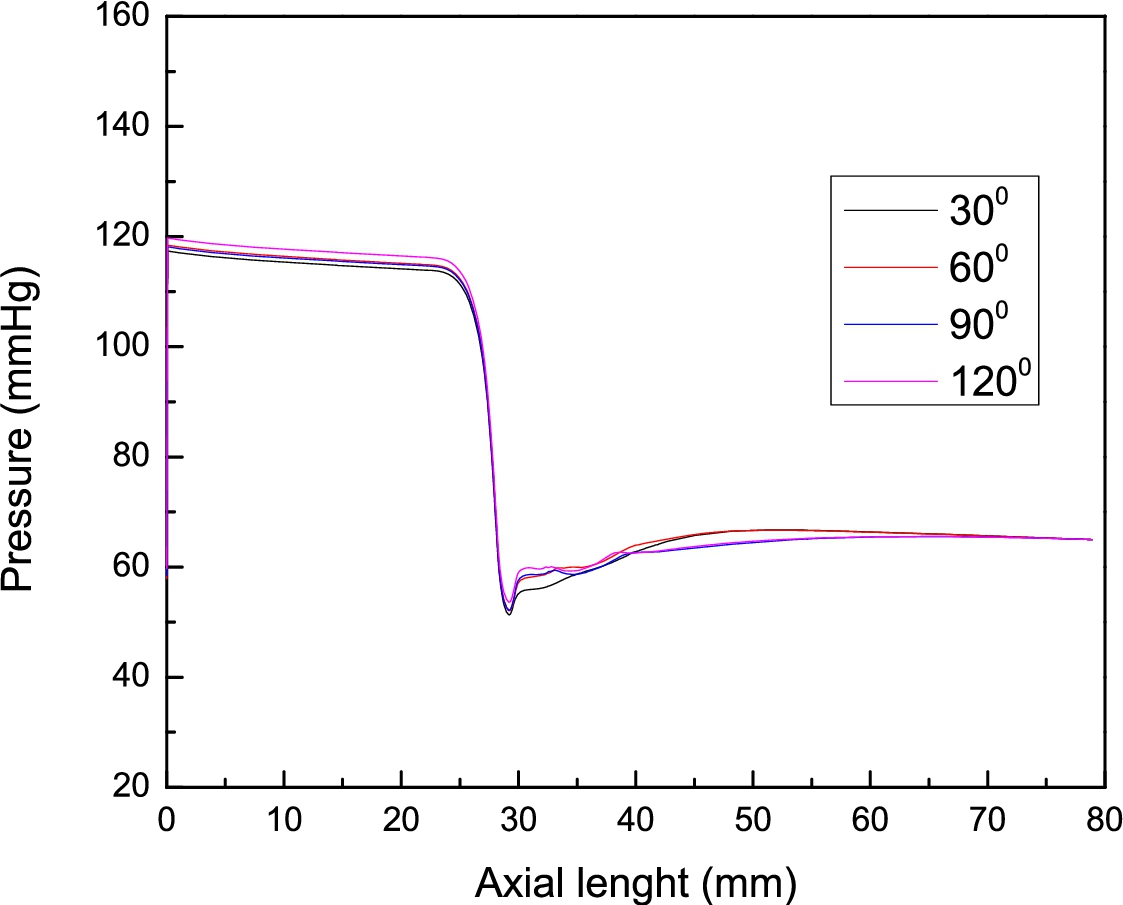
The results for pressure drop, velocity variations across stenosis, and wall shear stress are presented at selected time instances. As mentioned before, the period of the physiological cycle equals 0.8 s. Figures 4, 5 and 6, show the profile of drop in pressure along the axial length of all the four models of artery for 70%, 80% and 90% area stenosis respectively. It is inferred from these figures that the maximum pressure drop was observed across the throat area and the recovery of pressure at the downstream is slower as the angle of curvature increased. The drop-in pressure was increased as the area of stenosis increased. The pressure drop recovery in case of straight artery [15], is better as compared the present case. This is an effect of the artery curvature that augments the flow resistance caused by hindrance created by narrowed region of artery. The effect of angle of curvature could not be neglected which further enhances the pressure drop apart from presence of stenosis. Therefor the angle of curvature and stenosis both plays a significant role thus both of them should be considered in the diagnosis of coronary angiogram.

Pressure variations along the axial length for various curvatures of artery for 70%AS.
Pressure variations along the axial length for various curvatures of artery for 80%AS.
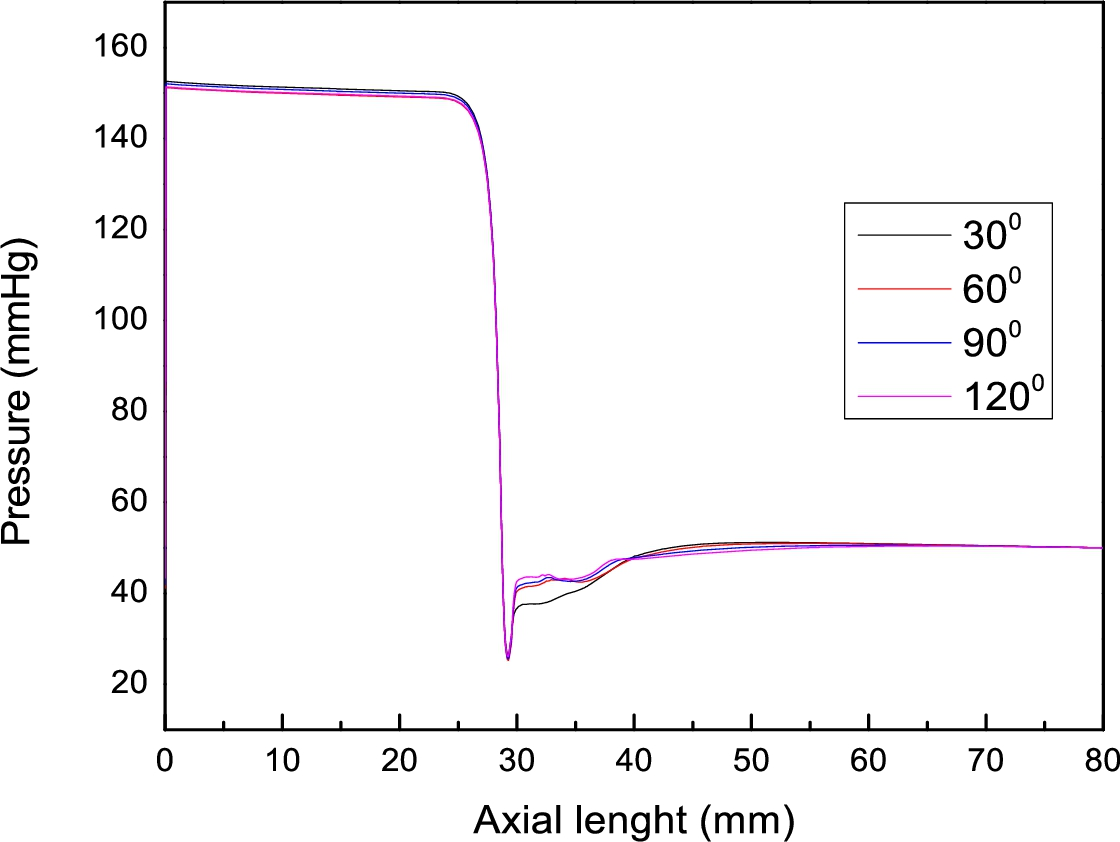
Pressure variations along the axial length for various curvatures of artery for 90%AS.
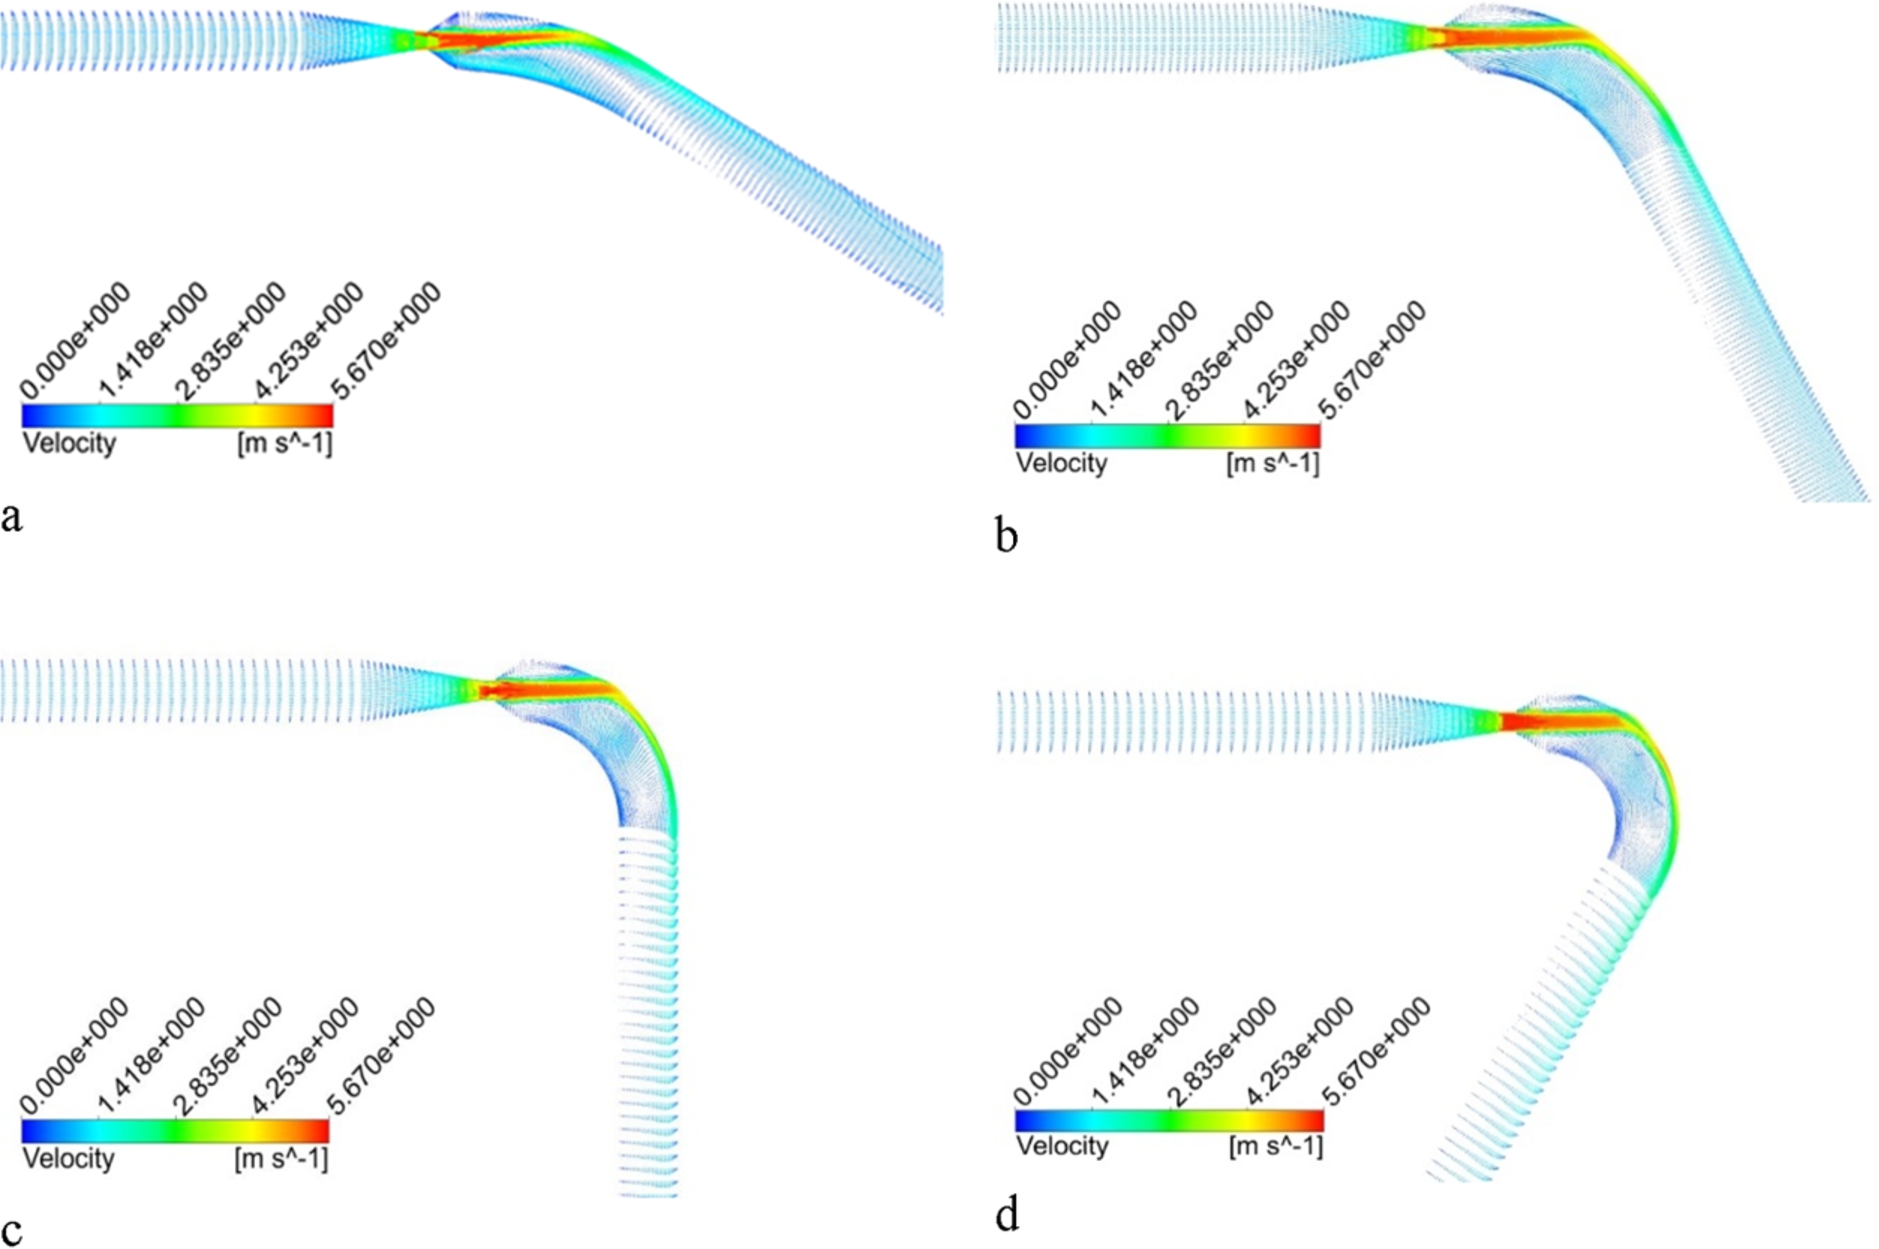
Figures 7, 8 and 9 reflect the vector for velocity distribution in the curved region for various angle of curvature in different size of stenosis for selected time instances. It can be clearly observed that the blood flow characteristics was strongly influenced by the curvature of artery wall. The velocity in the curved region skewed towards the outer side of the curvature and also shows that this skewing becomes more noticeable as the angle of curvature increases. This could pose the danger of another stenosis formation at inside wall of curvature if the blood contains stenotic material since there is lesser flow at inner wall of curvature, creating an opportunity for stenotic material deposition. On the other hand, the upper wall of artery is subjected to severe pressure due to high blood flow rate. It is clear from Figs 7, 8 and 9 that the increase in stenosis area increases the velocity of blood after the throat region as expected, but at the same time it also creates a low flow region on the lower wall of artery when stenosis size increases from 70% to 90%. The results also show that the direction of the flow is from the inner wall towards the outer wall and comes back to the inner wall again when moving towards the downstream as angle of curvature increased. In addition the velocity across the throat increases as the area of stenosis increases. Among 4 angles of curvature, the 30° curvature has least recovery of velocity when the blood passes through stenosis as shown in Figs 10 and 11. It is also observed that the lower curvature angle produced lowest minimum velocity in the curve region of artery and the point of occurrence of minimum velocity moved further away from stenosis with decrease in angle of curvature.
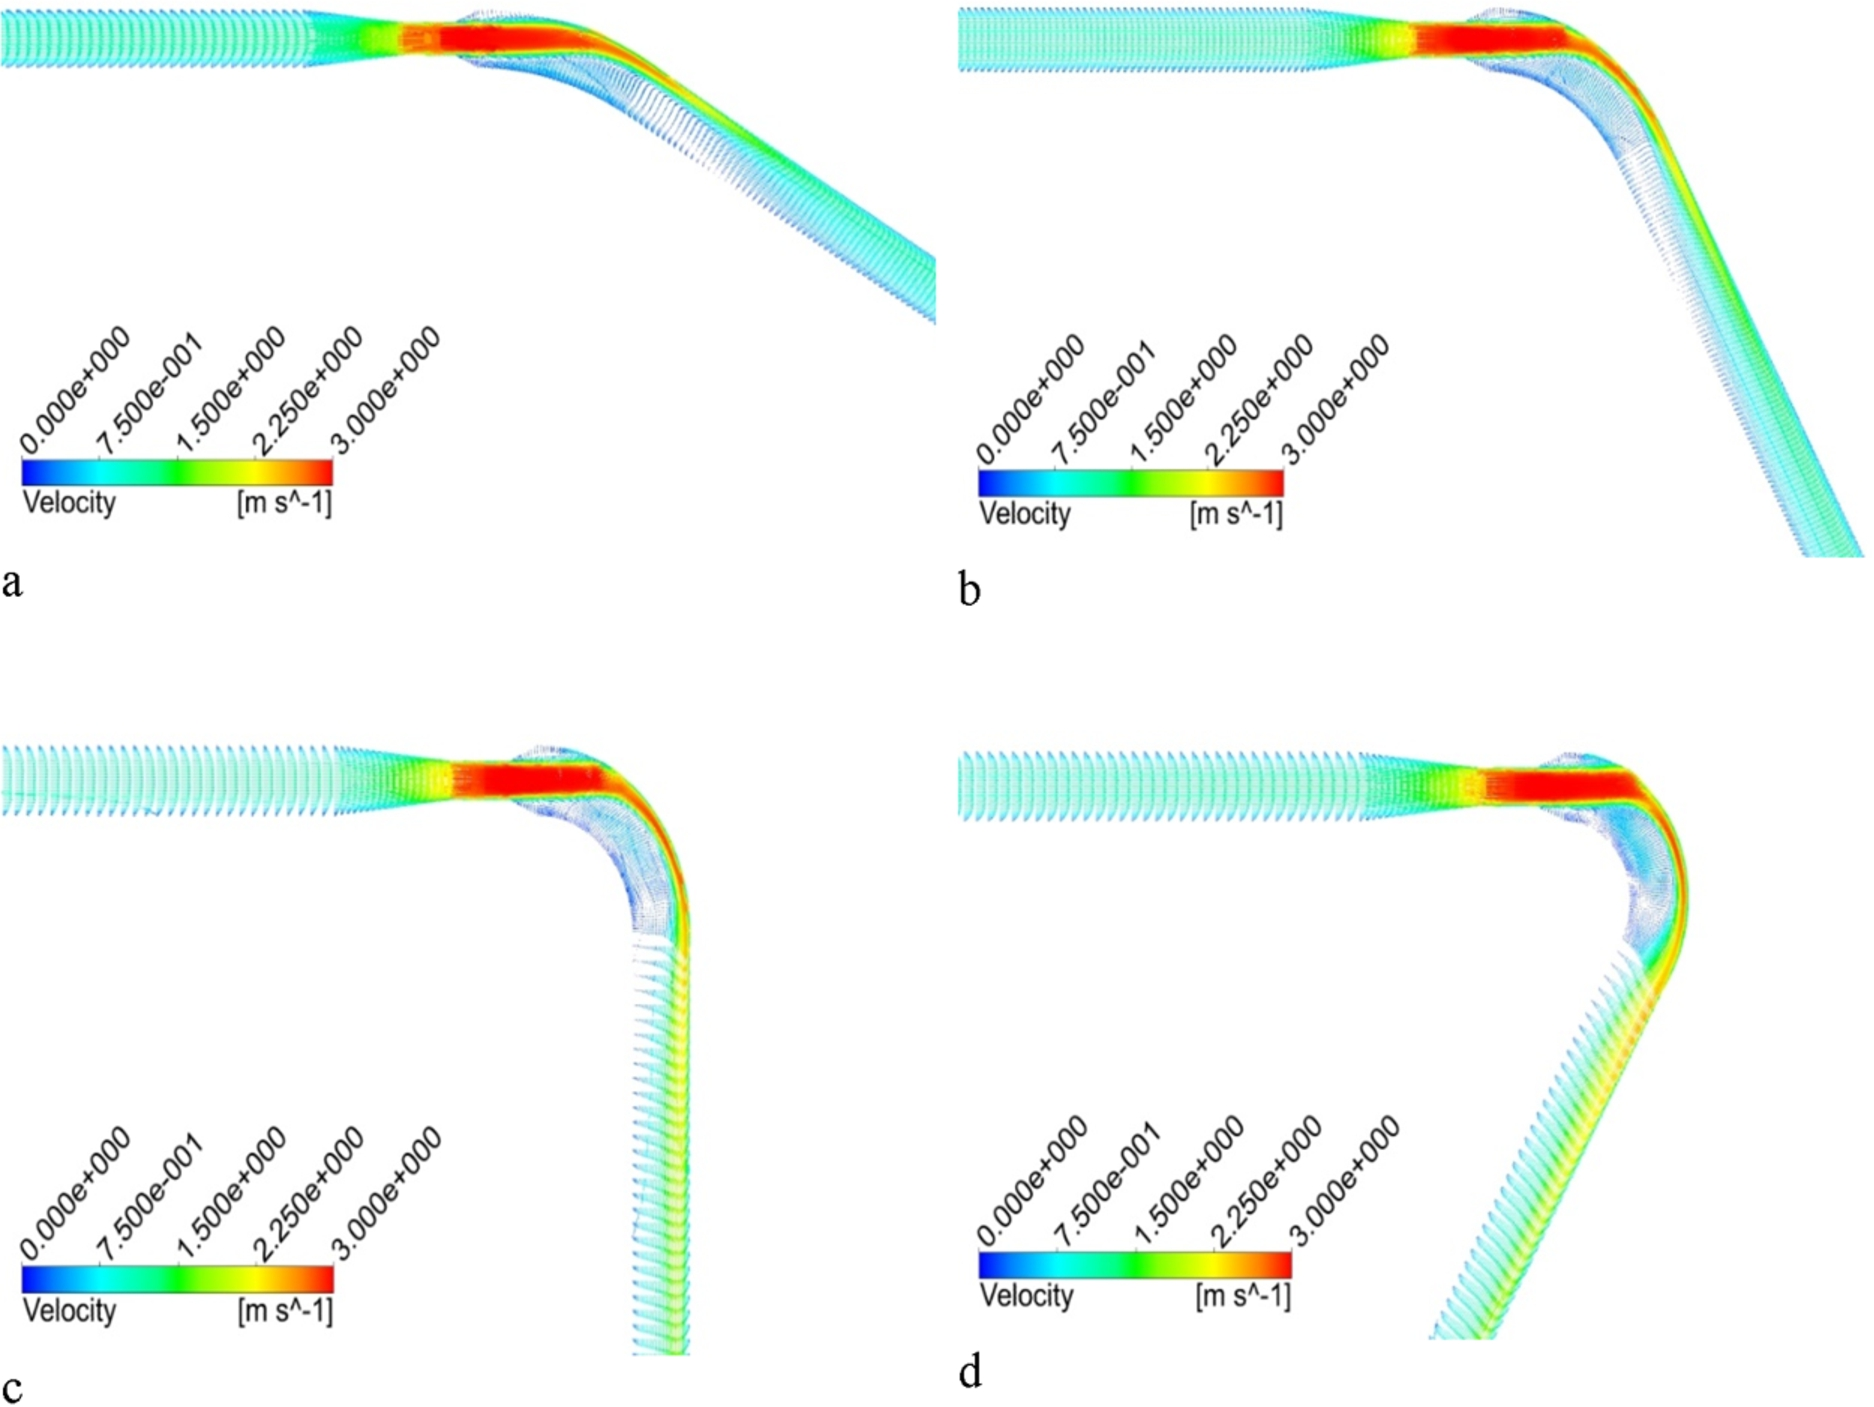
Velocity distributions for various curvature of artery with 70% stenosis during the cardiac cycle at 1.2 s. (a) 30°. (b) 60°. (c) 90°. (d) 120°.

Velocity distribution for various curvature of artery with 80% stenosis during the cardiac cycle at 1.2 s. (a) 30°. (b) 60°. (c) 90°. (d) 120°.
Velocity distribution for various curvature of artery with 90% stenosis during the cardiac cycle at 1.2 s. (a) 30°. (b) 60°. (c) 90°. (d) 120°.
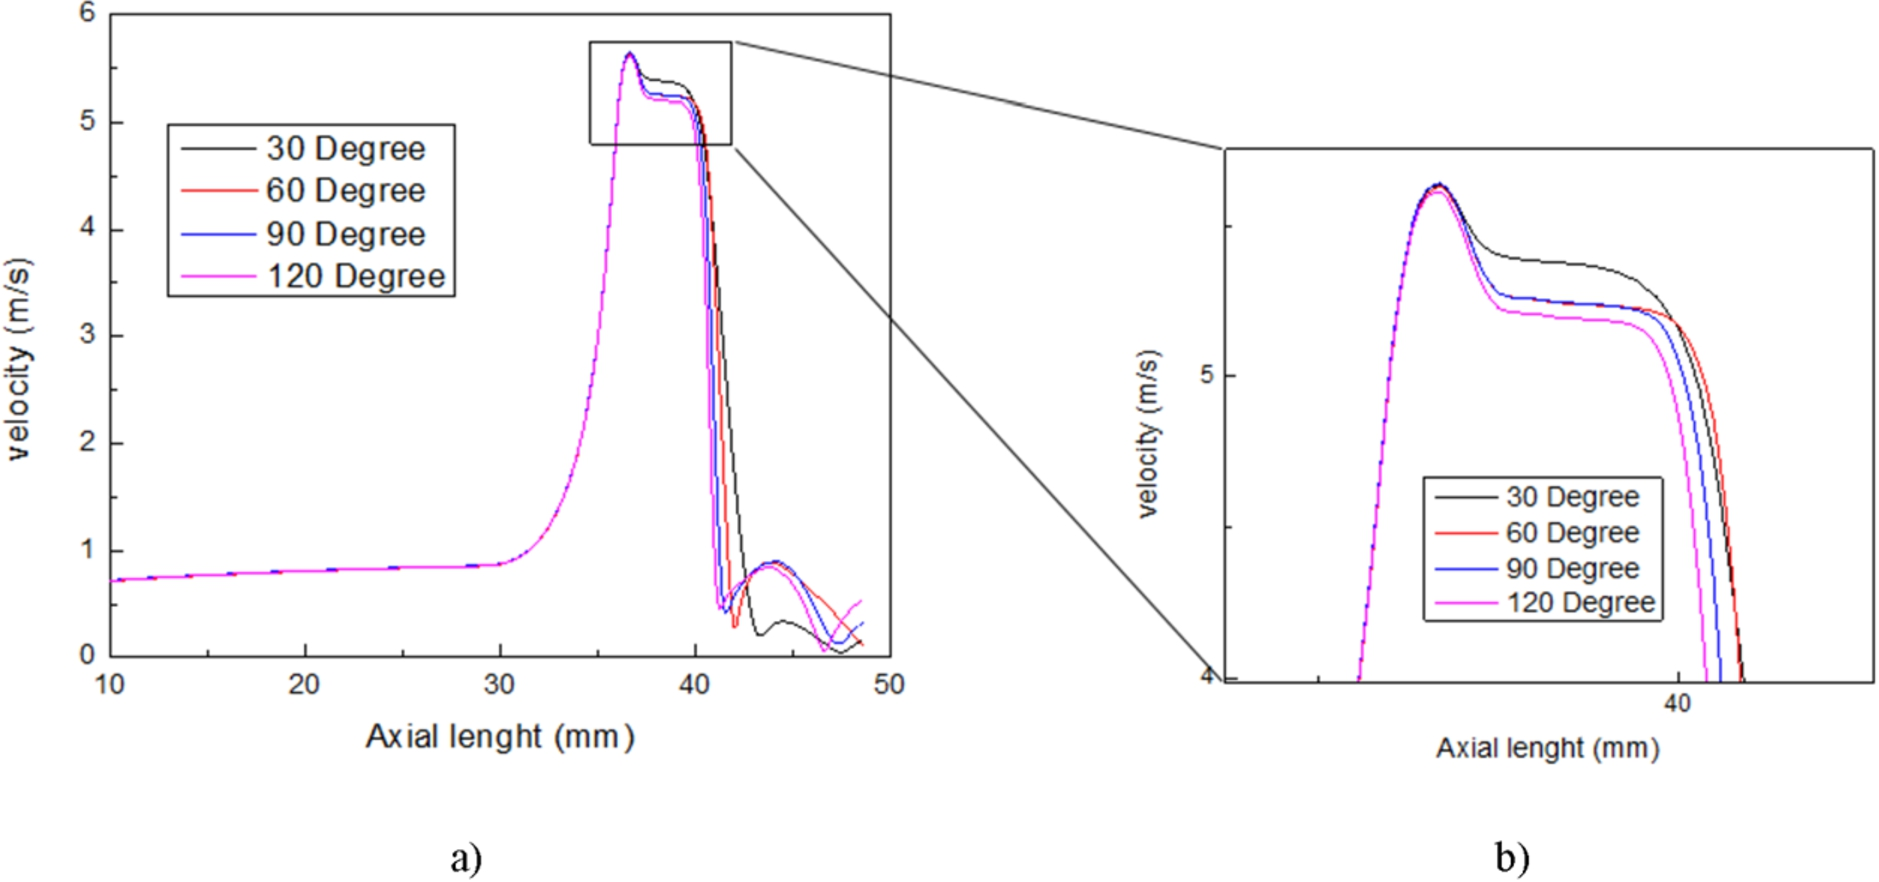
Axial velocity profile for 80%AS. (a) Velocity along the length of artery. (b) Zoomed peak velocity.
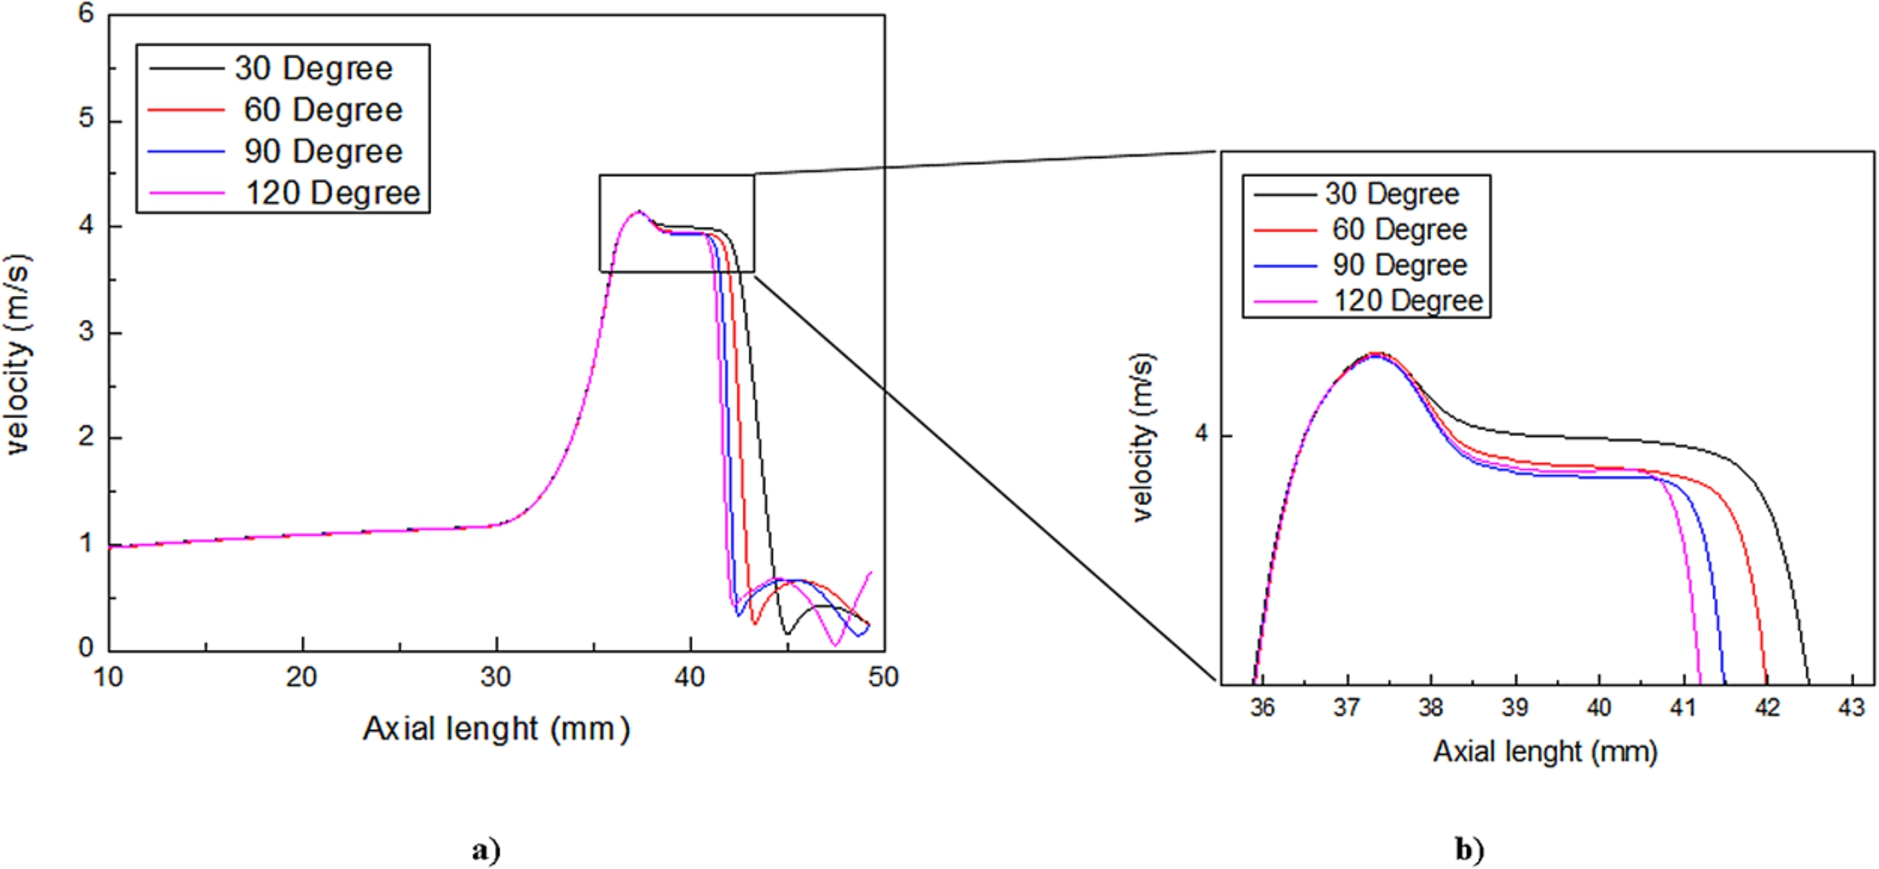
Axial velocity profile for 90%AS. (a) Velocity along the length of artery. (b) Zoomed peak velocity.
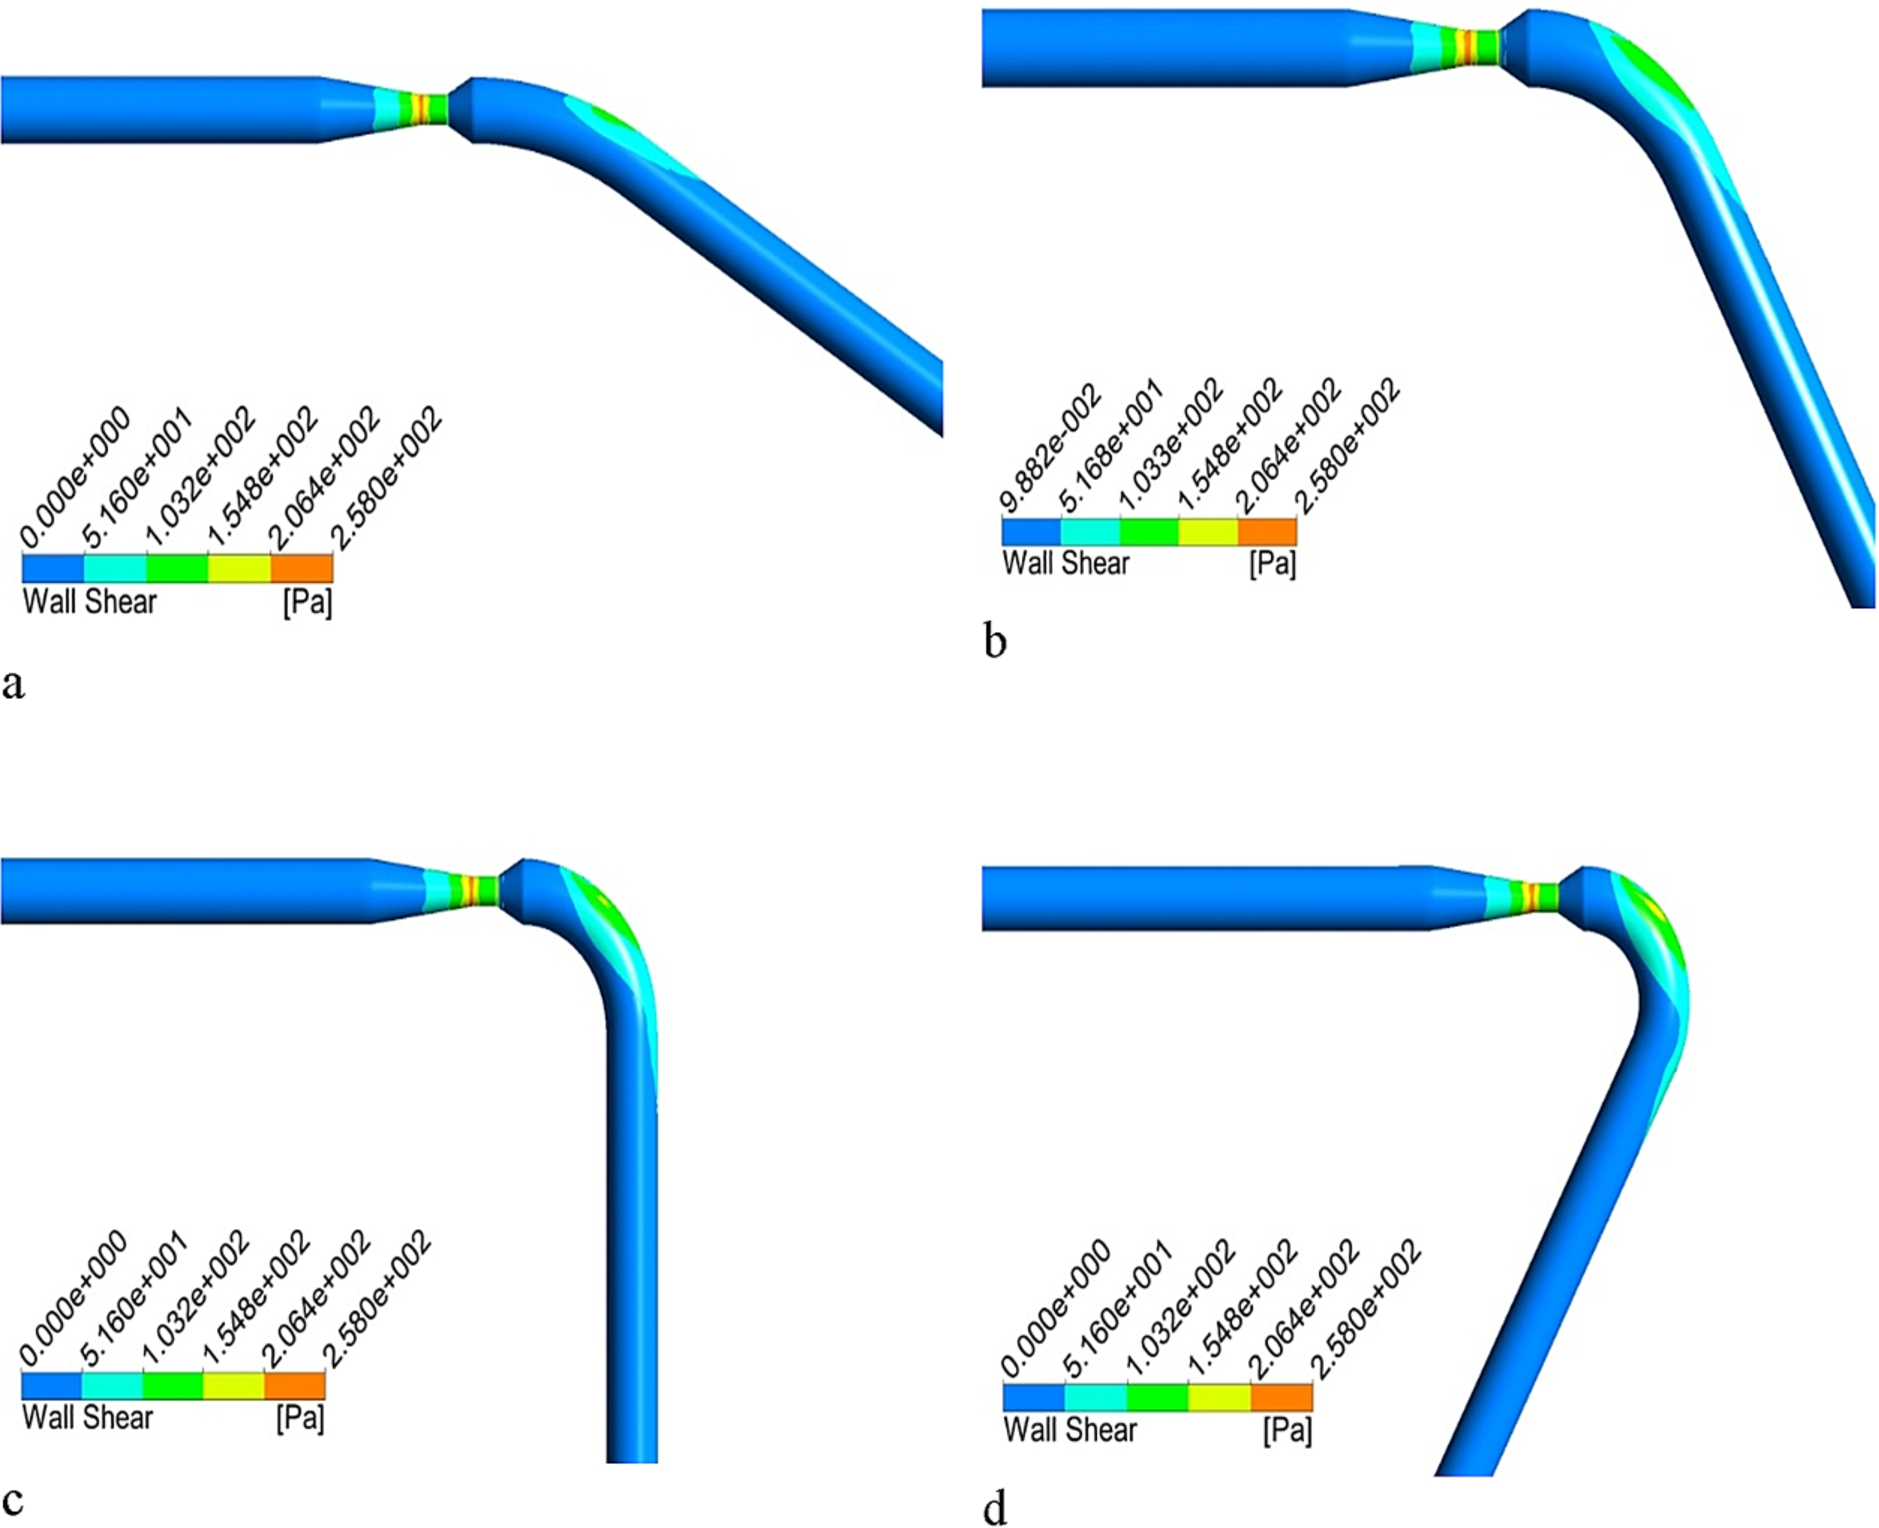
Figures 12, 13 and 14 highlight the variations in wall shear stress contours for different degrees of curvature models in different sizes of stenosis at selected time instances. It is found that the shear stress is maximum at the beginning of the throat and it increase as the size of stenosis increased. It is also observed that the wall shear is higher at the outside of arterial wall as compared to the inside of the wall in all the models being studied.
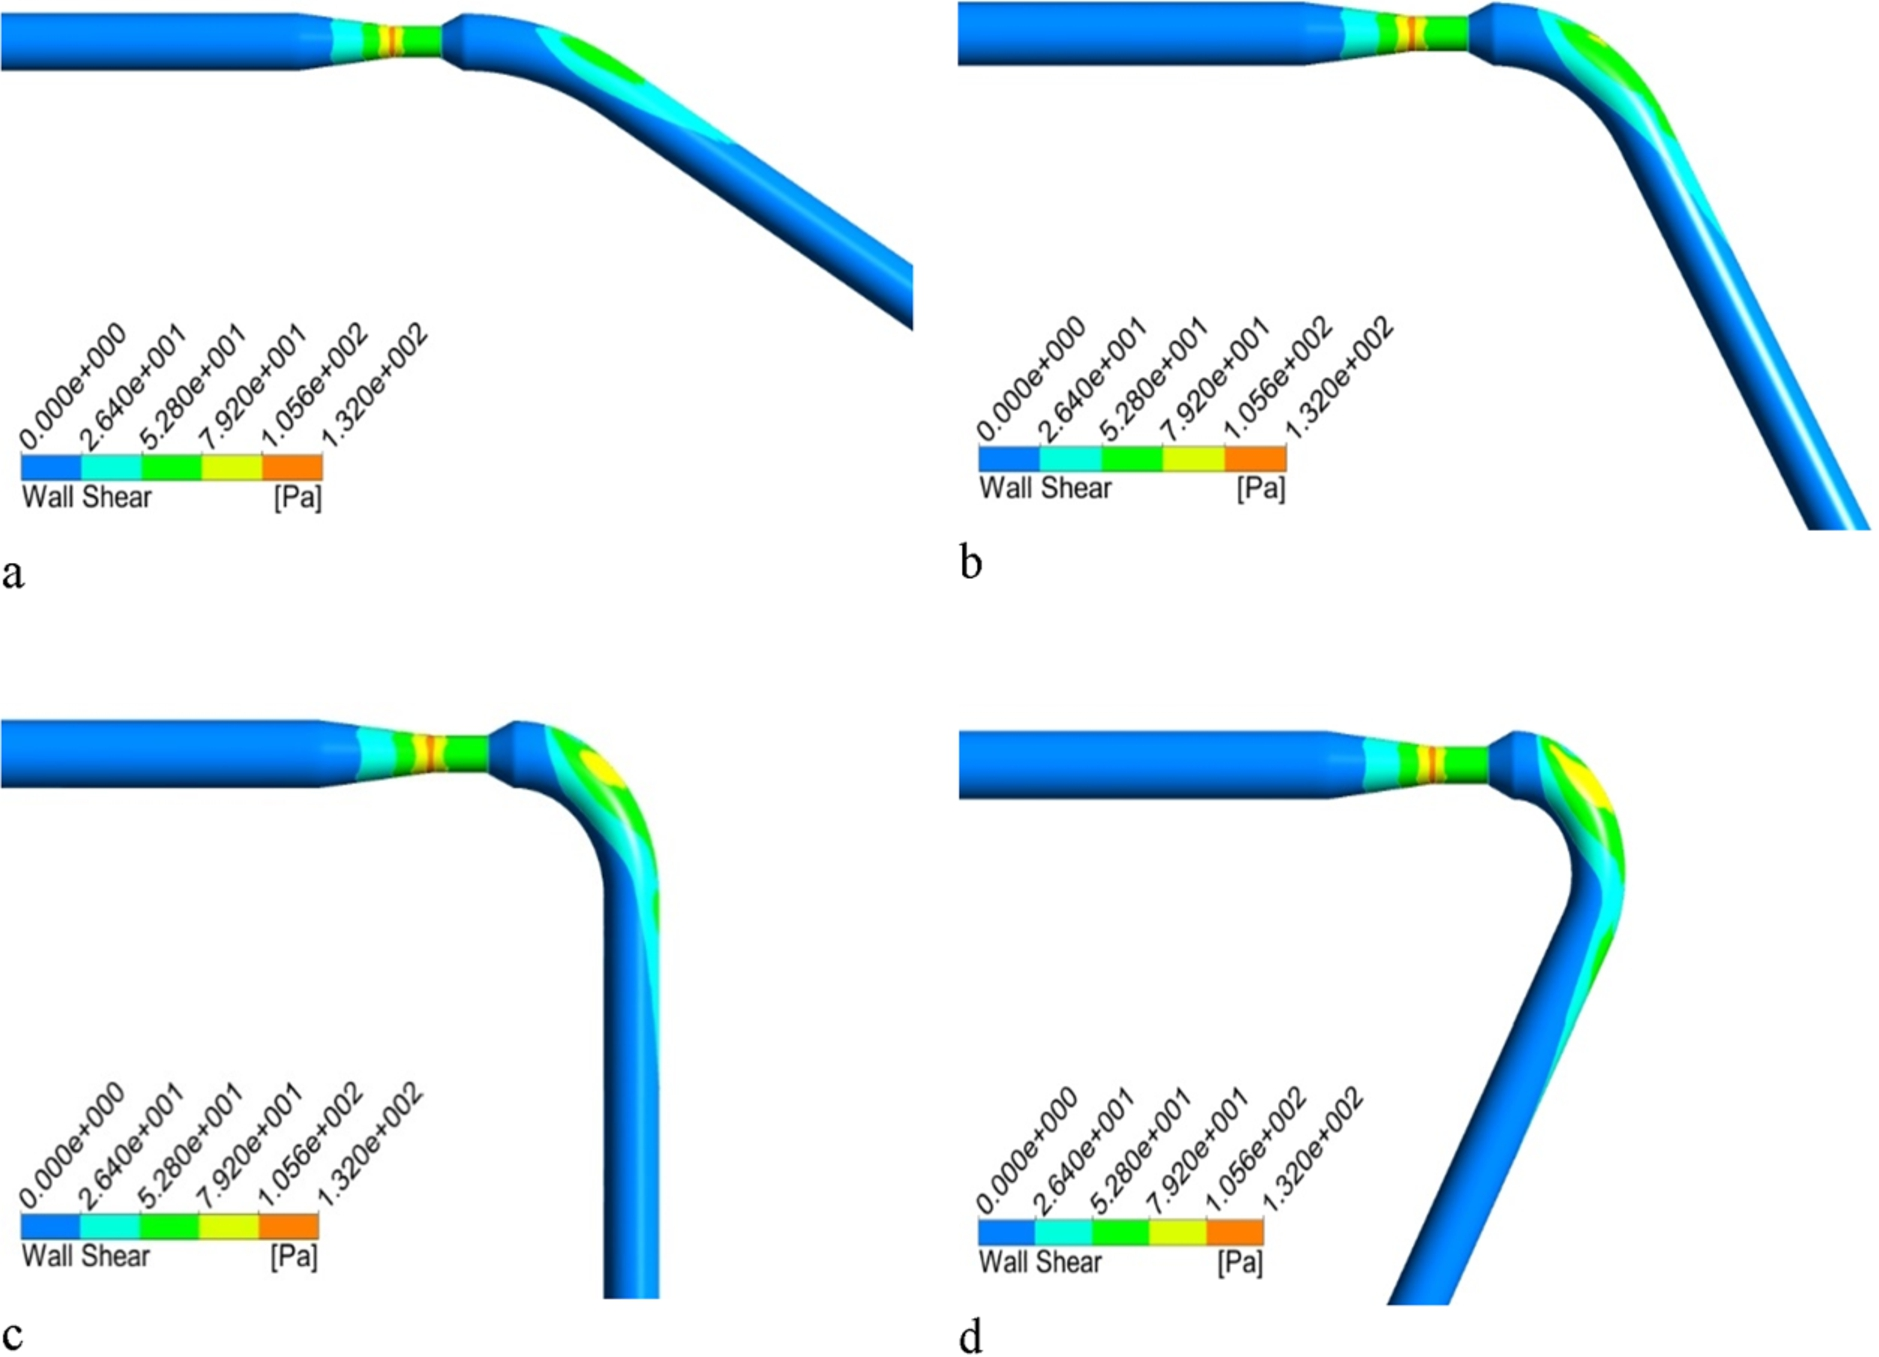
Computed wall shear stress for 70% stenosis. (a) 30°. (b) 60°. (c) 90°. (d) 120°.
Computed wall shear stress for 80% stenosis. (a) 30°. (b) 60°. (c) 90°. (d) 120°.
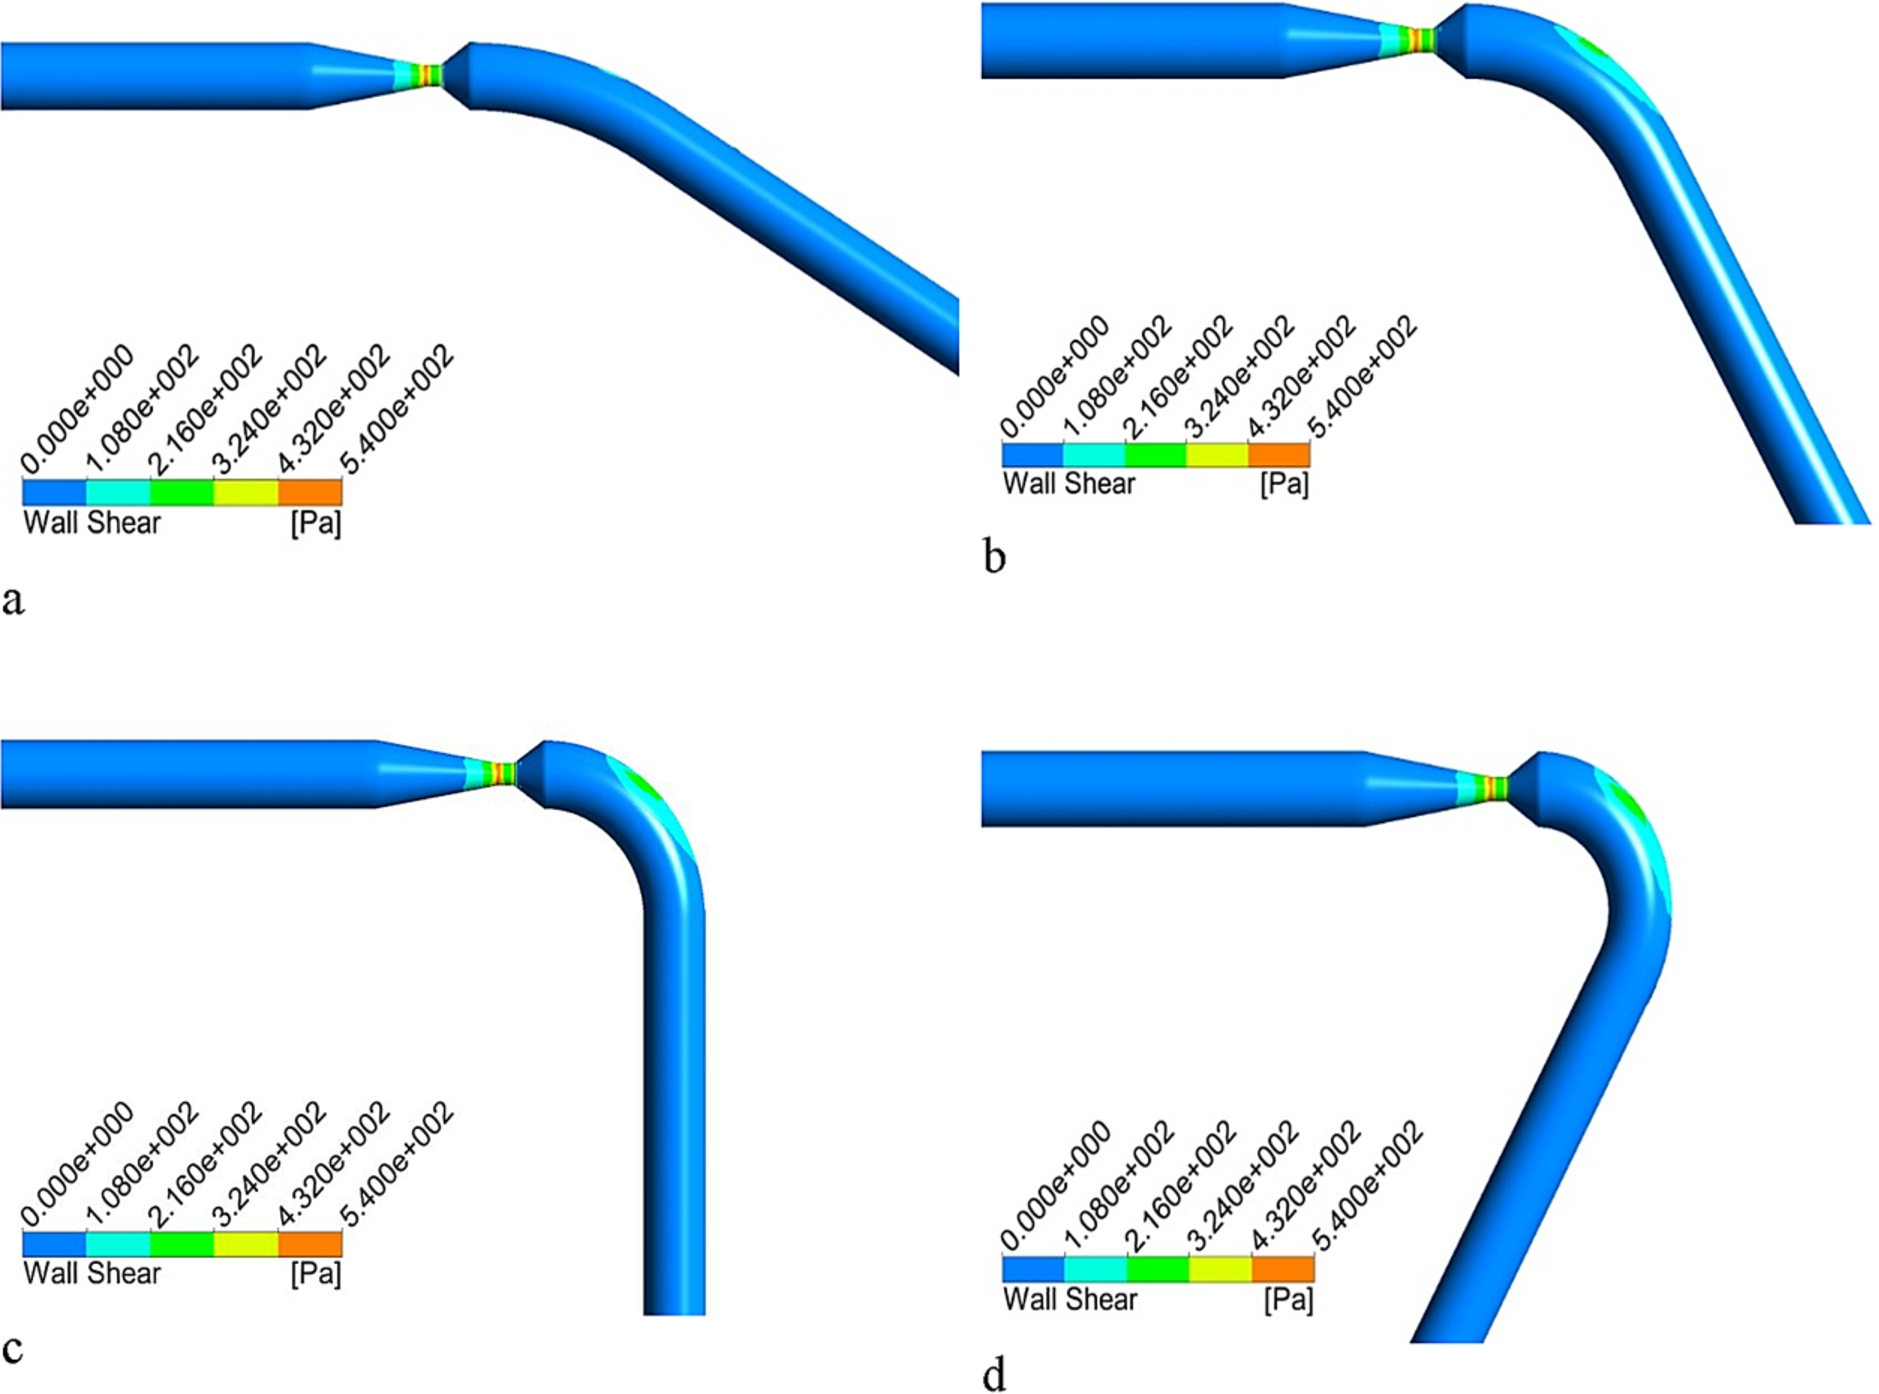
Computed wall shear stress for 90% stenosis (a) 30°. (b) 60°. (c) 90°. (d) 120°.
The primary objective of the current manuscript was to numerically investigate the effect of the angle of curvature on the hemodynamic parameters such as pressure, velocity and wall shear stress. The present finding provides additional information about the influence of curvature on the hemodynamic, hence it improves our understanding of progression of atherosclerosis across the curvatures. In the current clinical methodologies, such as Computed Tomography angiograms or invasive coronary angiography can only provide the anatomical details of the coronary artery, and are limited to predict the flow behavior. The present study reveals that the highest-pressure drop was found across stenosis (Figs 4, 5, and 6), and the recovery of pressure was slower as the angle of curvature increases from 30 to 120 degree. As the percentage area stenosis increased, the increase in the pressure drop was found. The highest-pressure drop was noted across the 90% area stenosis (Fig. 6), that in turn may cause the instantaneous increase in wall shear stress at the stenosis. Figure 14 depicts the maximum shear stress at the stenosis was due to the increase in the velocity that may lead to the aggravation of platelets activation, thinning of fibrous cap and the rupture of artery [24–26]. Furthermore, a recirculation area at the inner wall of the curvature was seen which leads to low wall shear stress. This recirculation area is created due to low pressure zone thus having very low velocity blood flow pertinent to that particular area. From the findings of this analysis clearly shows that low velocity region at curvature could lead to the formation of new stenosis.Therefor the angle of curvature and stenosis both plays a significant role thus both of them should be considered in the diagnosis of coronary angiogram.
Conclusion
The current study concentrates on investigating the effect of curvature angle on the blood flow behavior inside the human artery suffering from stenotic blockage. The study is carried out for three different sizes of stenosis area and 4 angles of curvature. The current results clearly demonstrate that a low flow region is created across the lower wall of the artery because of curvature effect which could potentially lead to the deposition of undesirable material such as fat or calcification that in turn would form another stenosis. This study provides the hemodynamics in a curved artery by using the computational fluid dynamics that could be used to predict the blood flow behavior. This study strongly suggests that the effects of artery curvature cannot be neglected when evaluating the stenosis. Furthermore, following conclusions can be drawn from this work.
The blood behavior is substantially affected by the combined effect of stenosis and the curvature of artery.
The blood flow recovery is least for the smaller curvature angle.
The upper wall of artery after stenotic region is subjected to high shear stress due to curvature effect.
Footnotes
Acknowledgement
The authors extend their appreciation to the Deanship of Scientific Research at King Khalid University for funding this work through research groups program under grant number (R.G.P.1/29/38).
Conflict of interest
The authors have no conflict of interest to report.