



Abstract
Background
It is unclear how back squat depth influences muscle activation and should be considered when designing strength training programs. Current evidence suggests this relationship is population-specific and should be examined in different populations to optimize strength training outcomes. This study examined the effect of different squat depths on muscle activation in college football players.
Methods
Sixteen Division II college football players performed back squat at three depths (C1 = 65°, C2 = 90°, and C3 = 115° knee flexion). During the descent and ascent phases, five-trial averages of mean gluteus maximus (GM), semitendinosus (ST), biceps femoris (BF), vastus medialis (VM), and vastus lateralis (VL) activation were calculated. Phase-specific differences were examined by calculating one-way repeated analyses of variance (α=0.05) and Bonferroni-corrected paired t-tests for post-hoc comparisons.
Results
Compared to C1, activation increased during C2 and C3 for the VM, VL, and BF during the descent and ascent phases. Additionally, during ascent, the greatest VM, VL, and BF activation occured during C3. Semitendinosus activation increased during C2 and C3 compared to C1 during the ascent phase, but it was not affected during the descent phase. Similarly, no GM activation changes were observed in either phase.
Conclusions
These findings indicate back squat depth influence on muscle activation is phase- and muscle-specific and should be considered when designing strength training programs for college football players.
Introduction
Participation in collegiate sports can increase one's risk of injury. In particular, Hootman et al. reported that among 15 different collegiate sports, American football players had the highest injury rate (35 injuries/1000 exposures). 1 Furthermore, the National Collegiate Athletic Association reported lower limb injuries account for a large proportion of all injuries among college-aged American football players. 2 Not surprisingly, 80% of collegiate strength and conditioning coaches indicated injury prevention was their strength training program's primary goal and benefit. 3 As a result, strength and conditioning professionals, coaches, and clinicians are tasked with designing and implementing training and rehabilitation programs targeting this population's lower extremities.
The back squat is a resistance exercise to improve lower extremity strength, power, and athletic performance. Moreover, it has been rated by strength and conditioning coaches as one of the most important exercises for competition in American football. 4 The back squat is performed by flexing (descent phase), then extending (ascent phase) the hips, knees, and ankles simultaneously, which is similar to many movement patterns that occur during American football. 5 Furthermore, survey results indicate at least 63% of collegiate strength and conditioning coaches include the back squat in their strength training programs. 3
Multiple back squat variants exist, which can influence lower limb muscle activation. A common variant studied previously involves varying the back squat depth. That said, the influence of back squat depth on lower limb muscle activation is unclear, as previous findings are conflicting. For example, da Silva et al. reported that in young, resistance-trained males, a deeper back squat caused an increase in gluteus maximus (GM) and biceps femoris (BF) activation but did not influence vastus medialis (VM), vastus lateralis (VL) or semitendinosus (ST) muscle activation. 6 In contrast, Gorsuch et al. reported increased back squat depth led to increased rectus femoris activation but did not affect BF activation in collegiate cross-country runners. 7 In another study, it was concluded the GM (versus the VM, VL, or BF) became more active during deeper versus more shallow back squat conditions. 8 Interestingly, Contreras et al. reported back squat depth did not affect GM, BF, or VL activation in young, healthy females. 9 Finally, Cabral et al. found activation changes in some lower limb muscles vary depending on the phase (ascent or descent). 10 These observed inconsistencies may be due, at least in part, to methodological differences between studies, such as variations in the magnitude of applied resistance during testing or specific squat depths examined. However, another important factor that should be considered is that changes in lower limb muscle activation (or lack thereof) with varying back squat depths may be population-specific. These conflicting findings support the previous suggestion that additional research is needed to elucidate further the effects of varying back squat depth on lower limb muscle activation in different populations. 11 This information is important as it will aid coaches, strength and conditioning professionals, and clinicians in prescribing the most appropriate variant of back squat for college-aged American football players.
Therefore, the current study aimed to examine the effects of varying back squat depth on lower limb muscle activation in collegiate American football players. It was hypothesized the mean activation of select lower limb muscles would increase with the depth of the back squat during the ascent and descent phases of the activity.
Materials and methods
Study design
A cross-sectional, repeated measures design examined the effects of squat depth on muscle activation. The dependent variable was the mean activation of selected lower limb muscles during the descent and ascent phases of the back squat. The independent variable was squat depth and consisted of three levels: C1 = 65° knee flexion, C2 = 90° knee flexion, and C3 = 115° knee flexion.
Subjects
A cross-sectional sample of convenience, comprised of 16 healthy male Division II collegiate American football players (age: 18.9 ± 2.4 years, height: 1.8 ± 0.1 m, mass: 85.9 ± 10.2 kg, and body mass index (BMI): 25.3 ± 2.2 kg/m2) were recruited to participate in this study. All subjects were members of the affiliated university's football team and had previous experience performing back squats. With a desired power of 0.80, α = 0.05, and an effect size associated with the change in lower limb muscle activation at varying squat depths (Cohen d = 0.87), 12 it was determined a sample of 11 subjects was adequate. The sample size estimate was calculated using G*Power v3.1.0.7 (Dusseldorf, Germany). Volunteers were excluded if they reported any pre-existing conditions, as indicated on the American College of Sports Medicine Medical Clearance Form, that could make exercise unsafe. Additionally, volunteers who could not perform a back squat at the desired depths or those with a BMI greater than 30 kg/m2 were excluded. The Institutional Review Board at Angelo State University approved the study, and all subjects gave written informed consent before participation.
Subject preparation and instrumentation
The right lower limb of each subject was prepared for measurements to record EMG activation data of the selected muscles and sagittal plane knee kinematics. Muscle activation was recorded with a five-channel telemetered EMG system (Biometrics Ltd, Newport, UK). The sampling frequency for EMG and kinematic data was 1000 Hz. Prior to placement of the EMG electrodes, the skin overlying the relevant muscle bellies was cleaned, shaved, and lightly abraded to minimize skin impedance. Next, double-sided tape was used to secure the EMG electrodes to the skin overlying the muscle bellies and parallel to the fibers of the GM, BF, ST, VL, and VM. A previously established technique was used to place the electrodes.13,14 Electrode placement was verified by visually examining muscle activity while each subject volitionally contracted the muscle or muscles of interest.
Kinematic data were recorded with a twin-axis electrogoniometer (Biometrics Ltd, Newport, UK) (model SG150). Using double-sided tape, the distal endblock of the electrogoniometer was secured to the leg on a line connecting the head of the fibula with the lateral malleolus. The proximal endblock of the electrogoniometer was secured to the thigh on a line connecting the greater trochanter with the lateral femoral epicondyle. 15
The electrogoniometer and the EMG electrodes were synchronized via connection to a telemetered data acquisition unit (DataLOG, Biometrics Ltd, Newport, UK) that interfaced with a laptop computer.
Testing procedures
Initially, the magnitude of the weight used for testing was calculated. The first step in determining the test weight was to estimate each subject's estimated one-repetition maximum (1RM) squat value using the Epley Formula. The Epley Formula provides an estimated 1RM based on the number of repetitions and magnitude of weight used during a multiple-repetition maximum (MRM) squat test (estimated 1RM = (MRM weight×MRM number of repetitions×0.0333) + MRM weight). 16 Prior to testing, each subject provided researchers with their most recent MRM obtained as part of their strength and conditioning program. Finally, 50 percent of each subject's estimated 1RM was secured on the barbell. The reason for using a sub-maximal weight for testing was to minimize the potential confounding effects of fatigue on muscle activation.
Next, test procedures were explained to each subject, and they were allowed several minutes to practice squatting at the desired depths and to become familiar with the testing protocol. To control squat depth during each condition, the telemetered data acquisition unit provided subjects with a real-time auditory cue based on their degrees of knee flexion.
Subjects then performed five successful squat repetitions at three different depths: 65° (C1), 90° (C2), and 115° (C3) of knee flexion for a total of 15 trials (Figure 1). A trial was considered successful if the peak knee flexion angle for a given trial was within +/- three degrees of the target depth. The order of squat conditions was randomized to reduce the risk of an order bias. Additionally, subjects were given approximately one minute of rest between trials to minimize the effects of fatigue.
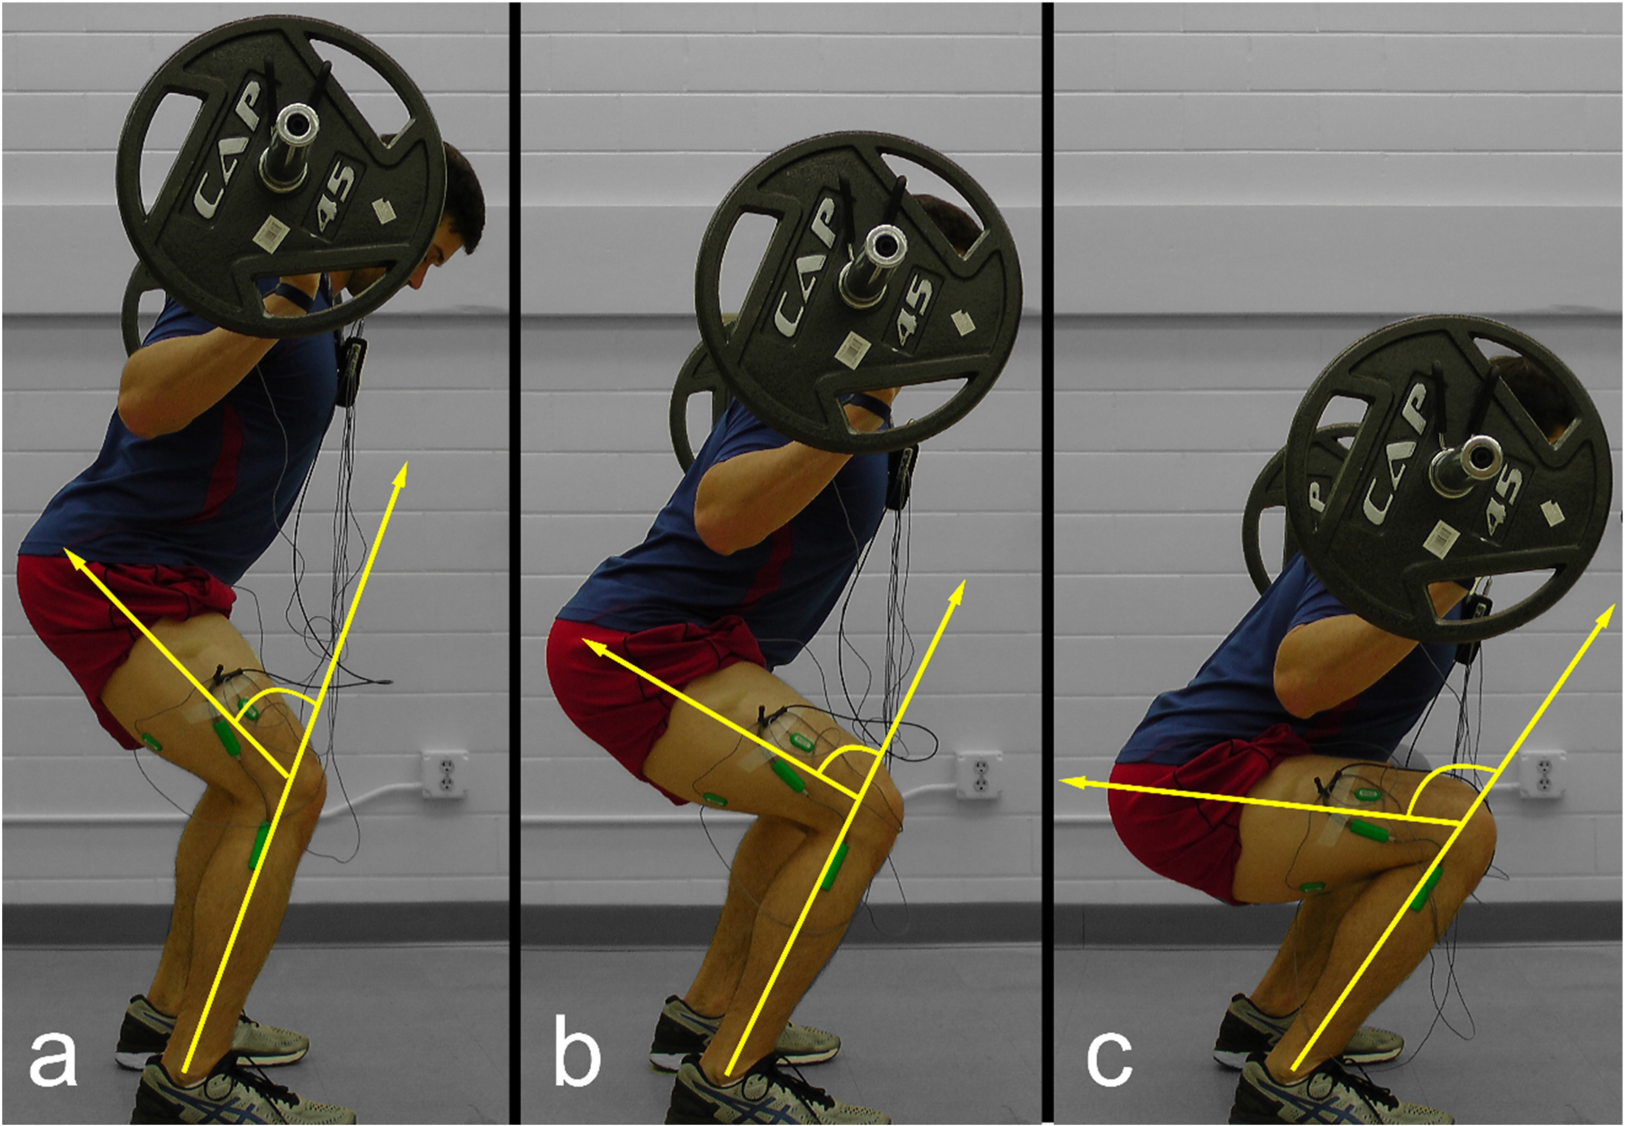
The testing conditions included: a) C1, 65 degrees knee flexion b) C2, 90 degrees knee flexion, and c) C3, 115 degrees knee flexion.
Data reduction
Kinematic and EMG data were processed with custom Matlab (Mathworks, Natick, MA) algorithms. Specifically, raw time-series EMG data were full-wave rectified and filtered using a dual-pass, fourth-order Butterworth low-pass digital filter (6 Hz cutoff). Next, for convenience, the filtered EMG data were normalized to percent activation by dividing the filtered time-series EMG data by the greatest activation value recorded during each test trial per subject and muscle. In other words, the single greatest activation value during testing was considered 100% activation for each muscle, and all trials done by each subject for each muscle were normalized the same way. Normalizing EMG data to percent activation did not affect the within-subjects muscle activation relationships. A dynamic (versus isometric) EMG normalization procedure was utilized in the current study as research indicates this type of normalization provides a more reliable and sensitive measure of lower extremity muscle activation during the back squat compared to a maximal isometric normalization procedure. 17 Raw knee flexion kinematic data from the electrogoniometer was filtered with a dual-pass, fourth-order Butterworth low-pass digital filter (6 Hz cutoff). Next, the beginning and end of each trial's descent and ascent phases of the back squat were identified, and the EMG and kinematic time series data were trimmed accordingly. Operationally, the descent phase was defined as the instant the knee began to flex until the time of peak knee flexion. The ascent phase began at the instant of peak knee flexion and ended when the knee reached full extension.
Statistical analyses
Initially, descriptive data, including mean and standard deviation, were calculated and examined. The distribution normality assumption was confirmed by visually inspecting Q-Q plots and calculating Shapiro-Wilks test values. The sphericity assumption was examined by calculating Mauchly's Test. Next, each dependent variable's main effects were examined by calculating one-way repeated measures analyses of variance (ANOVAs) (α = 0.05). A Greenhouse-Geisser transformation was applied to data that did not meet the sphericity assumption. For significant ANOVAs, pairwise comparisons were made by calculating paired t-tests with a Bonferroni-adjusted alpha for three comparisons (α = 0.05/3 = 0.017), mean differences (MD), 95% confidence intervals (95% CI), and Cohen's d effect sizes for paired samples. 18
Results
Descent phase results
During the descent phase of the squat, mean muscle activation for the VM (p < 0.001; η2 = 0.271), VL (p < 0.001; η2 = 0.173), BF (p < 0.001; η2 = 0.044), and GM (p = 0.032; η2 = 0.029) were different across the three depths examined.
Post-hoc analyses revealed mean activation increased from C1 to C2 during the descent phase of the back squat for the VM (MD = 8.2%; 95% CI = 5.6, 10.9; p < 0.001; d = 1.7), VL (MD = 6.3%; 95% CI = 3.8, 8.9; p < 0.001; d = 1.3), and BF (MD = 2.7%; 95% CI = 1.0, 4.4; p = 0.004; d = 0.8) (Table 1) (Figure 2). Similarly, increased activation was observed from C1 to C3 for VM (MD = 9.6%; 95% CI = 6.2, 13.0; p < 0.001; d = 1.5), VL (MD = 6.6%; 95% CI = 3.5, 9.7; p < 0.001; d = 1.1), BF (MD = 3.9%; 95% CI = 1.6, 6.2; p = 0.003; d = 0.9) (Table 1) (Figure 2). For all muscles, there were no statistically significant activation differences between C2 and C3 (Table 1) (Figure 2). Although there was a significant main effect for the GM, there were no statistically significant post-hoc pairwise comparisons (Table 1) (Figure 2).
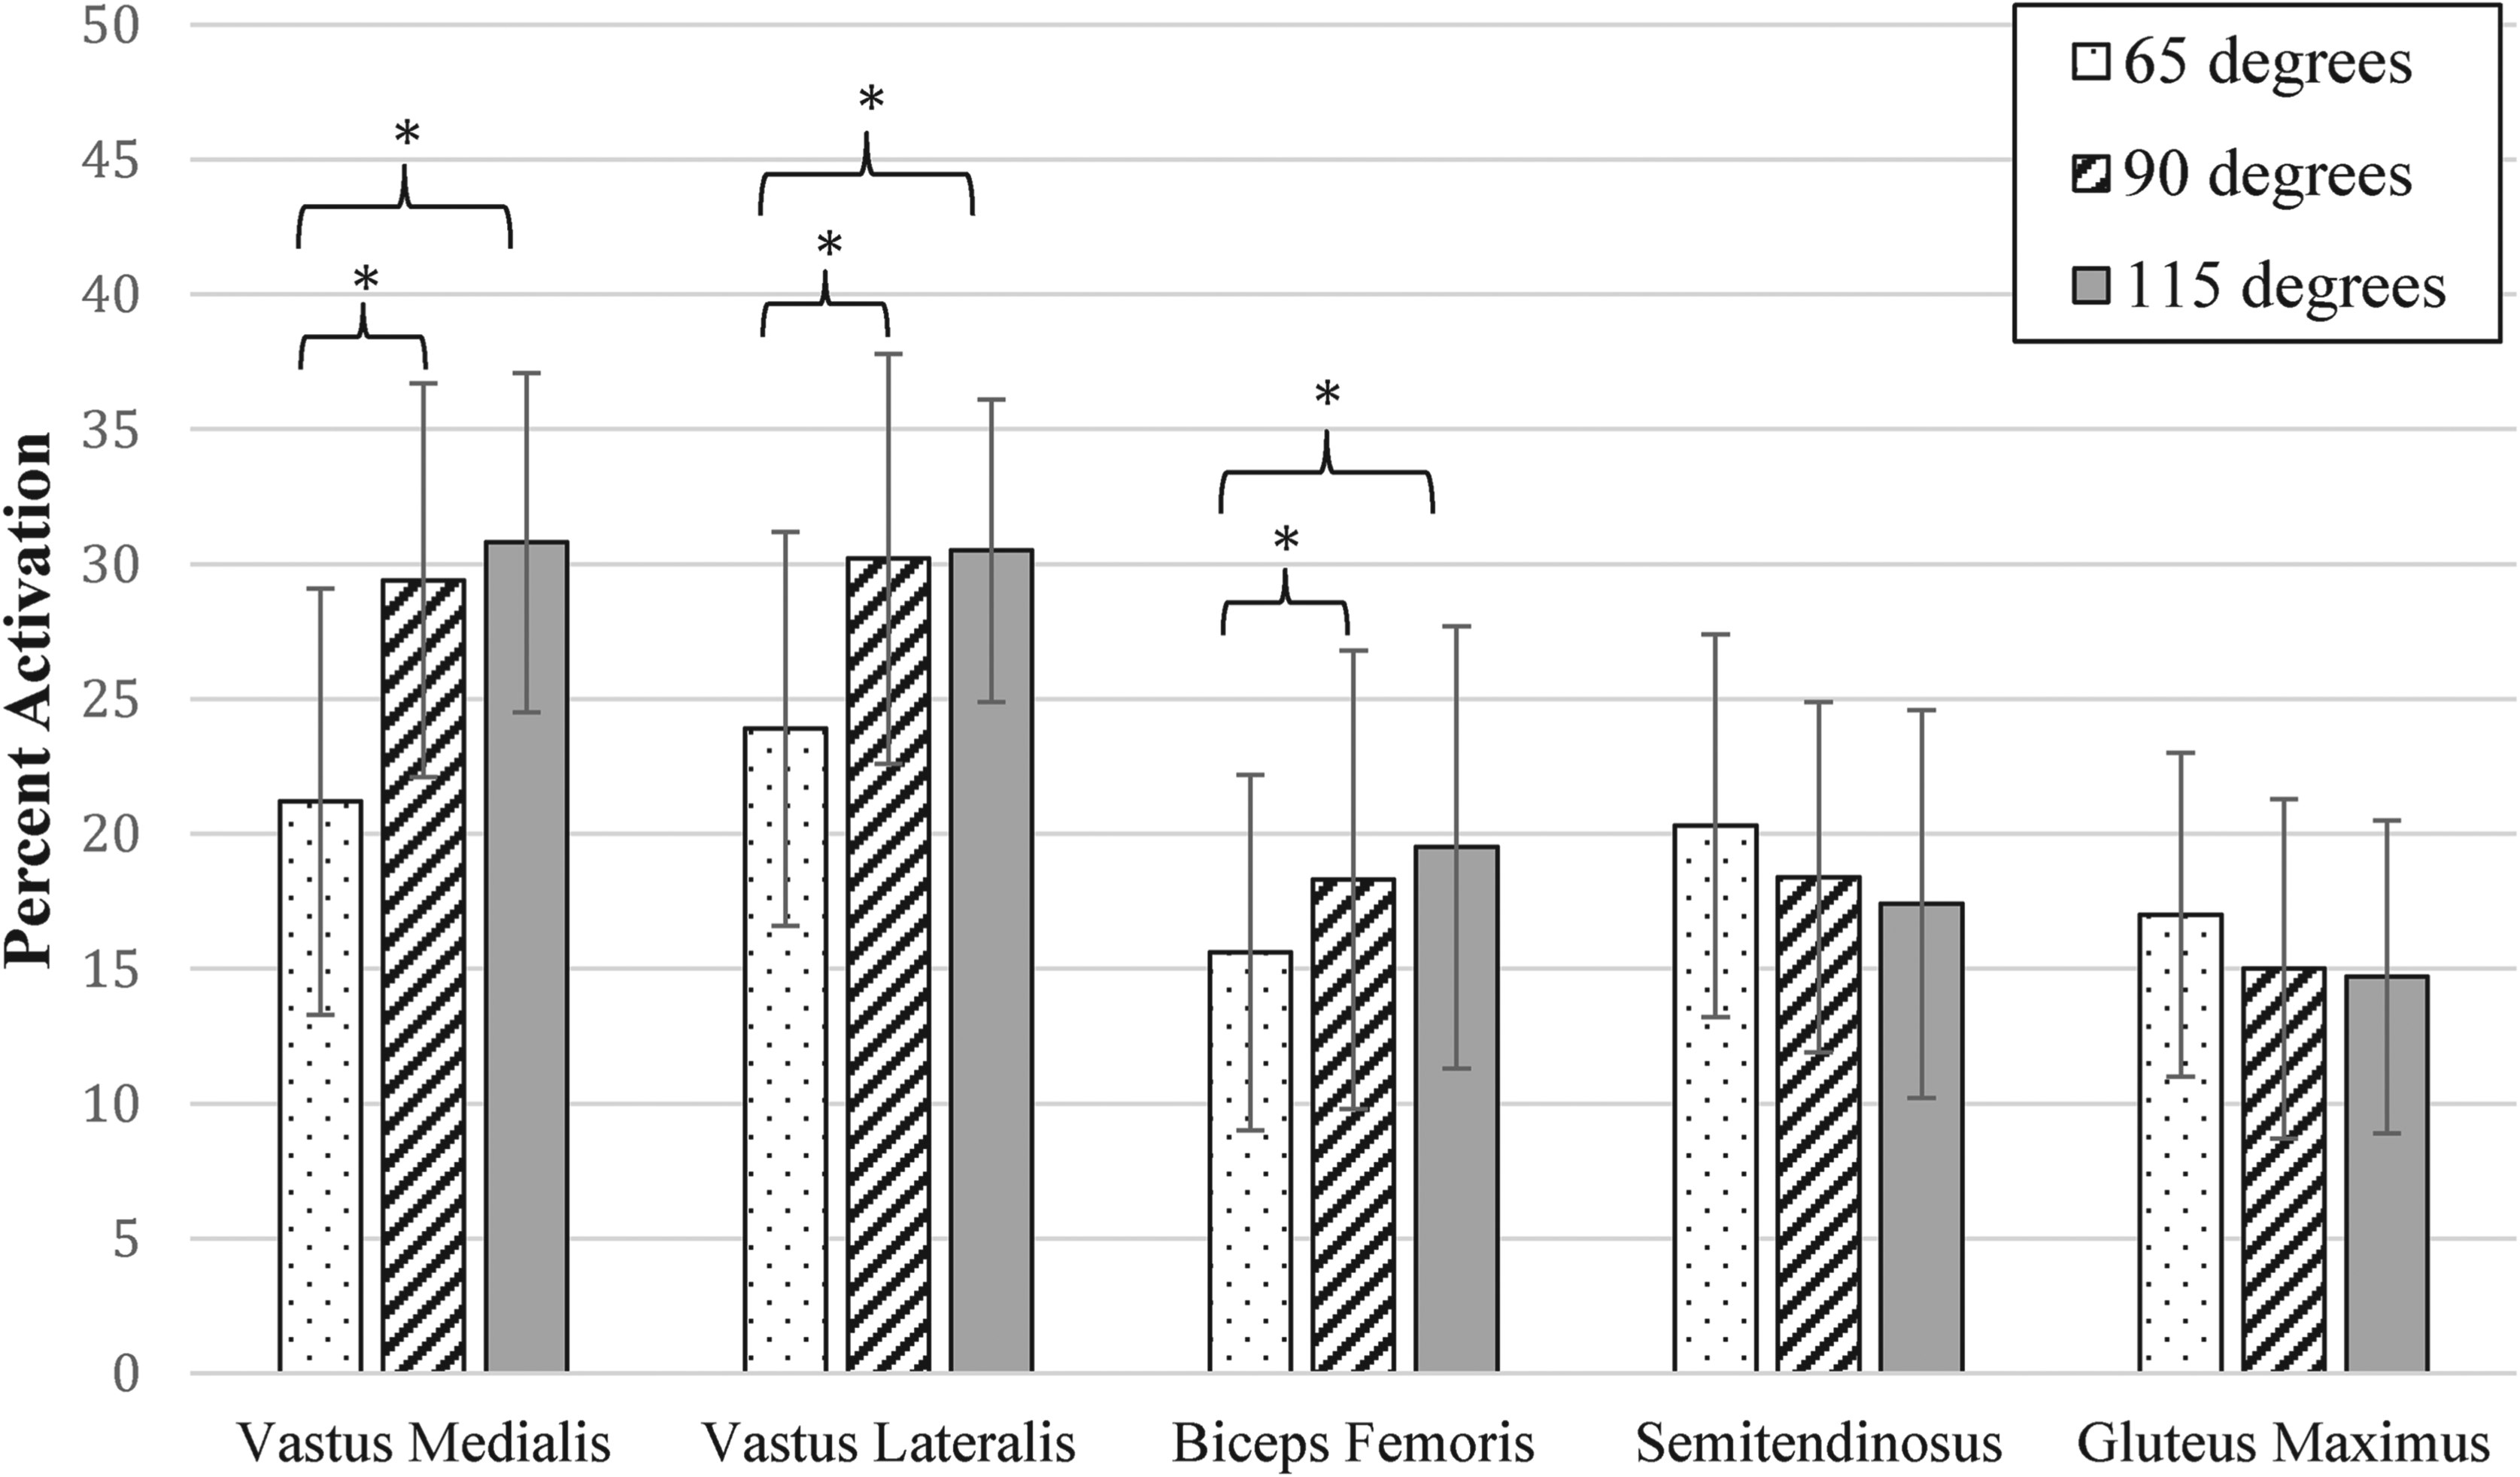
The weighted back squat descent phase mean activation levels at different knee flexion angles. *Indicates a statistically significant difference between conditions. Error bars represent one standard deviation.
Comparison of mean ± SD activation of selected lower limb muscles across varying depths of squat during the descent phase.
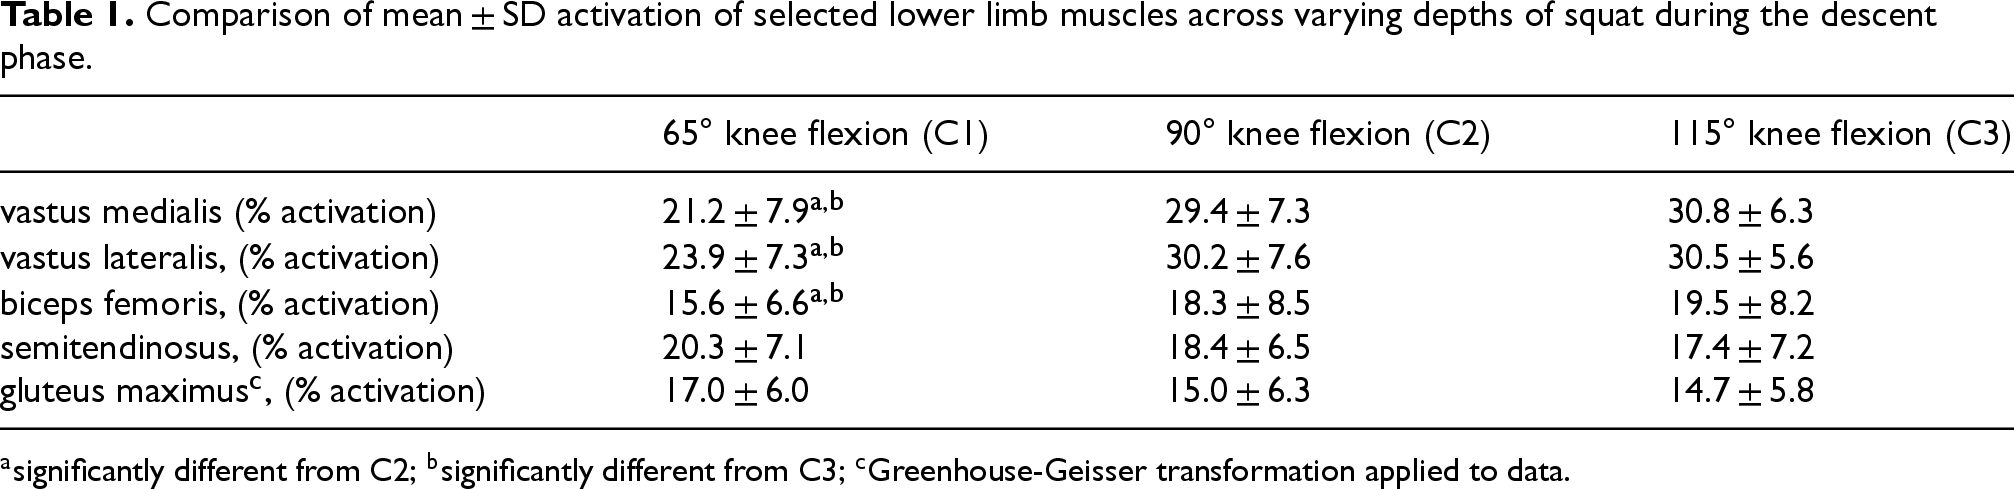
asignificantly different from C2; bsignificantly different from C3; cGreenhouse-Geisser transformation applied to data.
Ascent phase results
During the ascent phase of the squat, mean muscle activation for the VM (p < 0.001; η2 = 0.583), VL (p < 0.001; η2 = 0.455), BF (p < 0.001; η2 = 0.226), and ST (p = 0.005; η2 = 0.164) were different at the three depths examined.
Post-hoc analyses indicated mean activation of the VM increased from C1 to C2 (MD = 12.4%; 95% CI = 9.3, 15.4; p < 0.001; d = 2.2), C1 to C3 (MD = 20.6%; 95% CI = 18.0, 23.1; p < 0.001; d = 4.3), and C2 to C3 (MD = 8.2%; 95% CI = 5.2, 11.2; p < 0.001; d = 1.5) (Table 2) (Figure 3). Similarly, VL activation increased from C1 to C2 (MD = 10.5%; 95% CI = 8.3, 12.7; p < 0.001; d = 2.6), C1 to C3 (MD = 17.2%; 95% CI = 15.0, 19.3; p < 0.001; d = 4.3), and C2 to C3 (MD = 6.6%; 95% CI = 3.5, 9.8; p < 0.001; d = 1.1) (Table 2) (Figure 3).The BF activation increased from C1 to C2 (MD = 8.2%; 95% CI = 4.0, 12.5; p < 0.001; d = 1.0), C2 to C3 (MD = 4.6; 95% CI = 1.9, 7.4; p = 0.003; d = 0.9), and C1 to C3 (MD = 12.8%; 95% CI = 8.2, 17.5; p < 0.001; d = 1.5) (Table 2) (Figure 3).The ST exhibited increases in activation from C1 to C2 (MD = 6.1%; 95% CI = 1.7, 10.5; p = 0.010; d = 0.7) and C1 to C3 (MD = 8.5%; 2.7, 12.3; p = 0.007; d = 0.8) (Table 2) (Figure 3).The GM activation did not exhibit a statistically significant change between the three depths examined (Table 2) (Figure 3).
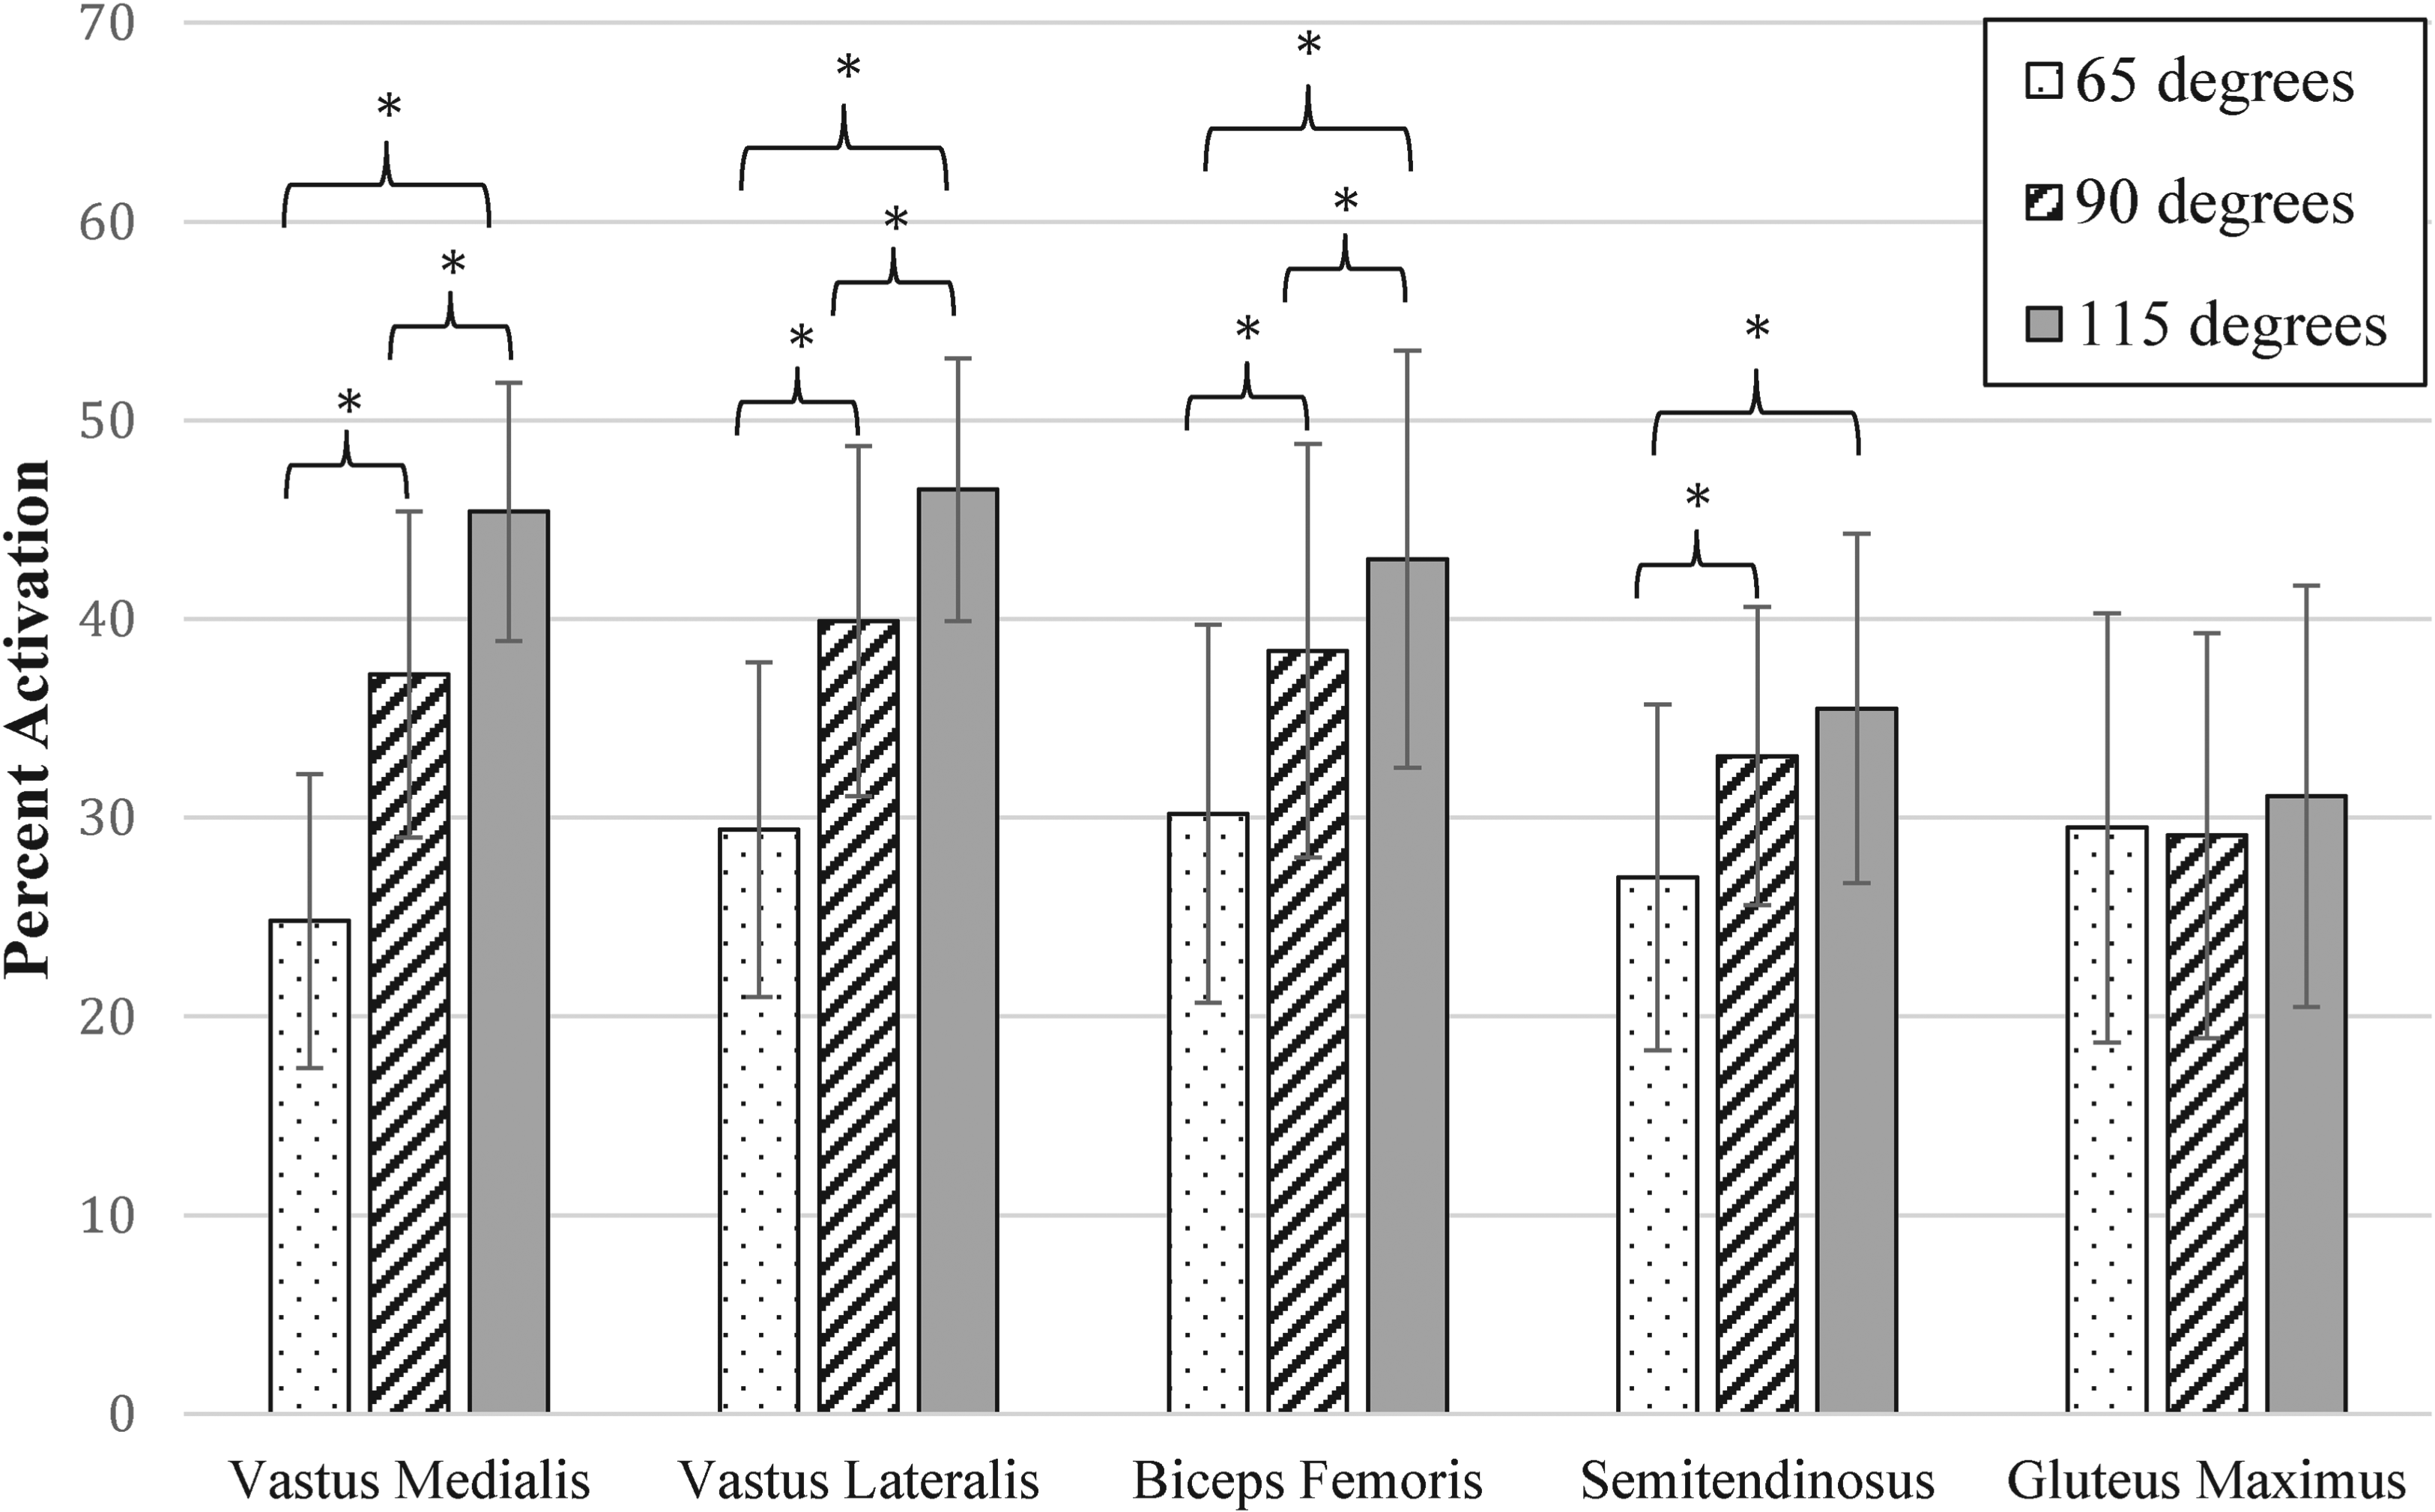
The weighted back squat ascent phase mean activation levels at different knee flexion angles. *Indicates a statistically significant difference between conditions. Error bars represent one standard deviation.
Comparison of mean ± SD activation of selected lower limb muscles across varying depths of squat during the ascent phase.
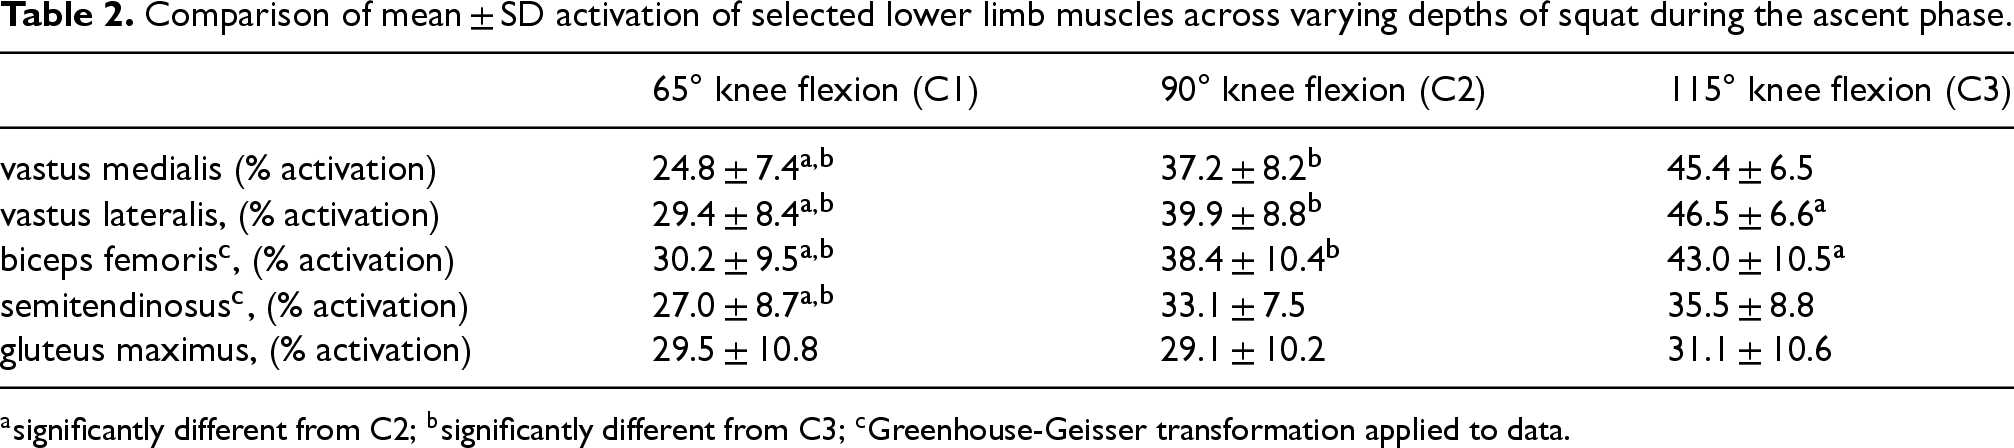
significantly different from C2; bsignificantly different from C3; cGreenhouse-Geisser transformation applied to data.
Discussion
This study examined the influence of varying depth on mean VM, VL, ST, BF, and GM activation during the ascent and descent phases of the back squat in Division II collegiate American football players. The observed activation patterns during each phase for all muscles except for ST exhibited similarities. For example, during the ascent and descent phases of the back squat, VM, VL, and BF activation increased during C2 and C3 (compared to C1). The GM activation did not change across conditions in either phase. In contrast, ST activation was statistically similar across conditions during the descent phase but exhibited increased activation during C2 and C3, compared to C1 during the ascent phase.
The fact activation of ST and GM during the descent phase did not change across conditions fails to support our hypothesis that activation would increase with greater back squat depth. That said, these findings are partly consistent with a previous study that examined the effects of varying knee flexion angles during an isometric back squat on muscle activation. For example, in this earlier study (as in the current study), increasing the knee flexion angle did not influence ST activation. 12 However, unlike the current study, these authors reported GM activation decreased with greater knee flexion. 12 In the current study, GM activation decreased with greater knee flexion during the descent phase, albeit this change was not statistically significant. Nonetheless, these current study observations (no change in ST and GM activation) may have occurred due to different muscle recruitment patterns associated with muscle-specific changes in mechanical advantage at the varying back squat depths. For example, according to Neumann, the adductors’ role as a hip extensor increases with greater hip flexion. 19 Furthermore, the GM and ST moment arm lengths decrease as the hip flexes beyond 35 degrees, while the adductor magnus moment arm (about the hip flexion-extension axis of rotation) increases with hip flexion up to 75 degrees. 20 Thus, these muscle-specific changes in moment arm length may help explain the premise that ST and GM utilization remain the same while adductor muscle recruitment and activation increase with greater back squat depths. Future studies should examine hip adductor muscle recruitment and activation with varying back squat depths.
As in the descent phase, during the ascent phase, the VM, VL, and BF exhibited increased activation during C2 and C3, compared to C1, highlighting the substantial role these muscles play in absorbing and generating energy at deeper back squat depths. Furthermore, these findings are consistent with studies that examined the effects of back squat depth on knee21,22 and hip 21 extensor moments and relative muscular effort. 23
Interestingly, the GM was the only muscle that did not exhibit statistically significant differences between conditions during either phase of the back squat. Although the ANOVA for GM during descent was significant, there were no statistically significant post-hoc pairwise comparisons. Though statistical significance was not achieved, mean activation during the descent phase of C2 and C3 was reduced compared to C1(Table 1; Figure 2). This is similar to findings reported by DaSilva et al., who observed decreased GM activation with a greater back squat depth. 12 As suggested by these authors, the current findings support the premise that with the GM in an elongated position, as in the case of C2 and C3 compared to C1, the muscle's afferent signals may be influenced such that greater activation is inhibited. 12 Alternatively, the increased BF activation during C2 and C3 (versus C1) may have abated the need for greater GM activation during the deeper squat conditions. Another potential factor that could help explain these findings is that changes in sagittal trunk posture at different back squat depths may have influenced the external hip extensor demand and GM activation. 24 Greater forward trunk lean has been associated with increased GM activation during squatting, 25 lunging, 26 and single-limb landing. 27 At the greater back squat depths, posterior pelvic rotation associated with soft tissue approximation between the anterior thigh and pelvis and available hip flexion range of motion may have contributed to reduced forward trunk lean. As a result, this may have led to reduced hip extensor demand and GM activation. Future studies are needed to examine further the relationships between back squat depth, GM length and activation, and sagittal trunk posture.
This study is not without limitations. For example, each subject's 1RM was estimated using Epley's formula, which requires a multiple repetition maximum as an input variable. This formula was shown previously to overestimate the bench press 1RM in the same population examined in the current study. 28 Therefore, it is possible that during testing, subjects in this study lifted more than 50% of their true 1RM. However, from a practical standpoint, it was decided to use an estimated 1RM to minimize the number of test sessions and reduce the disruption to the subjects’ current strength training program. That said, strength training programs for American football players commonly involve back squat percentages greater than 50% of the 1RM. Thus, the observed relationships between squat depth and muscle activation may differ when using a 1RM percentage greater than 50%. However, as mentioned earlier, we selected 50% of the estimated 1RM for this study to minimize the potential confounding influence of fatigue. Future research should examine whether the observed relationships are present using a greater 1RM percentage. Similarly, the absolute barbell load used for testing varied between subjects. Had we used a different procedure for adjusting the barbell load used for testing or controlled for factors like back squat maximum relative to body mass, it is possible the results could have differed from those currently observed. Additionally, subjects in the current study were allowed to assume their self-selected stance when performing the back squat, which could have affected outcomes. Previous research suggests stance width can influence lower limb muscle activation during a squat.29,30 However, these subjects were experienced with back squat, and it is plausible there were no substantial differences in stance during each of the three depths examined. A follow-up study is needed to assess the influence of squat depth on activation using greater 1RM percentages (+50%) and while controlling stance. Finally, researchers, strength and conditioning professionals, and clinicians should be very cautious in extrapolating the current study's findings to other populations, including females, athletes from other sports, or patient populations. Future studies are needed to examine further the relationship between back squat depth and lower limb muscle activation in different populations.
Conclusions
The current study's findings highlight the fact that coaches, strength and conditioning professionals, and clinicians should be aware that varying back squat depth influences some, but not all, lower limb muscles’ activation in NCAA Division II collegiate American football players. Accordingly, back squat depth should be adjusted for these individuals based on specific performance or rehabilitation-related goals. Additionally, the relationship between back squat depth and lower limb muscle activation may be population-specific.
Footnotes
Acknowledgements
The authors want to acknowledge Chad Herring, PhD, for assisting with subject recruitment.

Ethical considerations
This study was approved by the Institutional Review Board at Angelo State University.
Consent to participate
Each subject provided written informed consent prior to participating in this study.
Author contributions
All authors contributed equally to the design and conception of this study. Lee T. Atkins, Teresa Huckaby, Josh Roberson, Taylor Denney, and Jordan Schultz assisted with data collection. Lee T. Atkins, Josh Roberson, Taylor Denney, and Jordan Schultz performed data processing and reduction. Additionally, all authors contributed to drafting and critically revising the manuscript. All authors have read and approved the final version of this manuscript.
Funding
The author(s) received no financial support for the research, authorship, and/or publication of this article.
Declaration of conflicting interests
The authors declared no potential conflicts of interest with respect to the research, authorship, and/or publication of this article.