
Abstract
Glacier length, though an indirect and delayed signal of climate conditions, can be used to determine the relationship between climate and glacier response. This study discusses glacier length change of eight outlet glaciers of Jostedalsbreen and Folgefonna (southern Norway), from the ‘Little Ice Age’ (LIA) until the present. A climate index was calculated from meteorological data from Bergen to determine the specific frontal time lags of the individual glaciers. Short and steep outlet glaciers, such as Briksdalsbreen, react rapidly to changes in climatic conditions, whereas long and gently descending glaciers, such as Nigardsbreen, need longer time to adjust to changes in temperature and/or precipitation. The time lag of Briksdalsbreen was about twice as long during the LIA as today. The correlations between North Atlantic Oscillation (NAO) and climate conditions and glacier fluctuations in Norway and the European western Alps were analysed. As the influence of the NAO on glacier fluctuations is most pronounced during winter, only the winter NAO index was considered. Fluctuations of maritime Norwegian glaciers are highly correlated with the NAO, whereas variations of more continental glaciers in the European western Alps are only partly influenced by the NAO and tend to be anti-correlated. However, the (anti-)correlation with the NAO is not constant during the record, and significantly weaker or even inversed during some periods. A comparison of the LIA glacier fluctuations in southern Norway and the European western Alps suggests that the asynchronous LIA maxima in the two regions may partly be attributed to multidecadal trends in the NAO.
Keywords
Introduction
During the twentieth century the mean global Earth surface temperature has risen by ~0.6°C. Depending on the different CO2 emission scenarios, global warming may cause an increase in temperature of 1.8–4.5°C by the end of the twenty-first century (Intergovernmental Panel on Climate Change (IPCC), 2007). When making scenarios for future development of glaciers and to judge whether glacier variations under the current climate lie within natural variability or not, an understanding of past glacier fluctuations is crucial. Glaciers are good climate indicators, as they are sensitive to climate variability and their mass balance and length fluctuations are mainly controlled by climate. Regional climate determines the amount and phase (rain or snow) of precipitation, as well as the solar radiation and air temperature, which are converted into the energy available for melting. Locally, climatic conditions are influenced by the topography and the glacier aspect and elevation. The local climate determines accumulation (e.g. snow, avalanches, rime formation, freezing of rain) and ablation processes (e.g. melting and run-off, evaporation, wind deflation, calving), which are summed up in the net mass balance of a glacier (e.g. Paterson, 1994).
A glacier responds to different climate conditions in a change of size or front position, detectable as glacier advance or retreat. If the glacier is under balanced conditions (net mass balance = 0), the glacier reflects the current general climate conditions (Paterson, 1994).
Glacier length change is an indirect and delayed signal of a climate perturbation, but much easier to determine than mass balance. Moreover, Oerlemans (2005) showed that data on glacier length from all over the world reflect a distinct global temperature signal. The study confirmed that glacier length can be used as a climate proxy independent of instrumental data and other proxies.
Evidence is becoming stronger of accelerated glacier shrinkage if not even disappearance at a global scale (Haeberli, 2009). According to Haeberli and Beniston (1998), glaciers in the Alps have lost about one-third in glacierized surface area and around 50% in ice volume between 1850 and 1980 (see also Paul, 2006; Zemp et al., 2008). They state that the ongoing volume reduction and frontal retreat is mainly the result of warm summers and low winter precipitation. Maritime glaciers in western Norway, on the other hand, experienced positive mass balance and large frontal advance during the 1990s because of increased winter accumulation (Andreassen et al., 2005; Nesje et al., 1995). The same asynchrony between Alpine and Scandinavian glaciers as in the twentieth century (Six et al., 2001) can be traced back to the LIA. At this point, the role of regional weather modes, such as the North Atlantic Oscillation (NAO), has to be considered, as they play a significant role with respect to decadal and multidecadal climate variability (Wanner et al., 2008).
This paper analyses and compares historical glacier fluctuations at Jostedalsbreen and Folgefonna, southwestern Norway, with the focus on the frontal time lag of length changes to climatic variations. The relationship between climate and glacier response is analysed with a climate index calculated from summer temperature and winter precipitation data in Bergen (first in detail for Briksdalsbreen, then also for the other glaciers). For the comparison with Alpine glacier fluctuations Pré-de-Bard Glacier was chosen, for which a newly established glacier length change curve (Imhof, 2010) is first presented here. The fluctuations of the Pré-de-Bard Glacier, together with the newly calculated climate index of Great St Bernard Pass, are compared to the fluctuations of Briksdalsbreen and the climate index of Bergen. Finally, this paper studies the influence of the NAO on glacier fluctuations in southwestern Norway and the western Alps.
Study area and glaciers
This study comprises eight temperate outlet glaciers from the Jostedalsbreen and Folgefonna ice caps, both situated in southwestern Norway (Figure 1). Jostedalsbreen is, with a surface area of 487 km2, the largest ice cap of mainland Europe (Østrem et al., 1988). Its highest point is Høgste Breakulen at 1957 m a.s.l. The outlet glaciers studied are Briksdalsbreen, Bøyabreen, Store Supphellebreen, Bergsetbreen, Nigardsbreen and Lodalsbreen.

Geographical location of Jostedalsbreen and Folgefonna and the studied outlet glaciers: Briksdalsbreen (1), Bøyabreen (2), Store Supphellebreen (3), Bergsetbreen (4), Nigardsbreen (5), Lodalsbreen (6), Bondhusbreen (7) and Buerbreen (8) (adapted from Nussbaumer et al., 2011)
Folgefonna is the third biggest ice mass on mainland Norway. It is divided into three distinct ice fields, of which the southern (Søndre Folgefonna) is the largest (168 km2) (Østrem et al., 1988). The two outlet glaciers of southern Folgefonna studied here are Bondhusbreen in the west and Buerbreen in the east. The characteristics of the individual glaciers are listed in Table 1.
Overview of the characteristics of the studied glaciers of Jostedalsbreen and Folgefonna (tsl, transient snow line. Data from glacier inventory of southern Norway; Østrem et al., 1988), and the timing of their LIA maximum (after Nussbaumer et al., 2011)
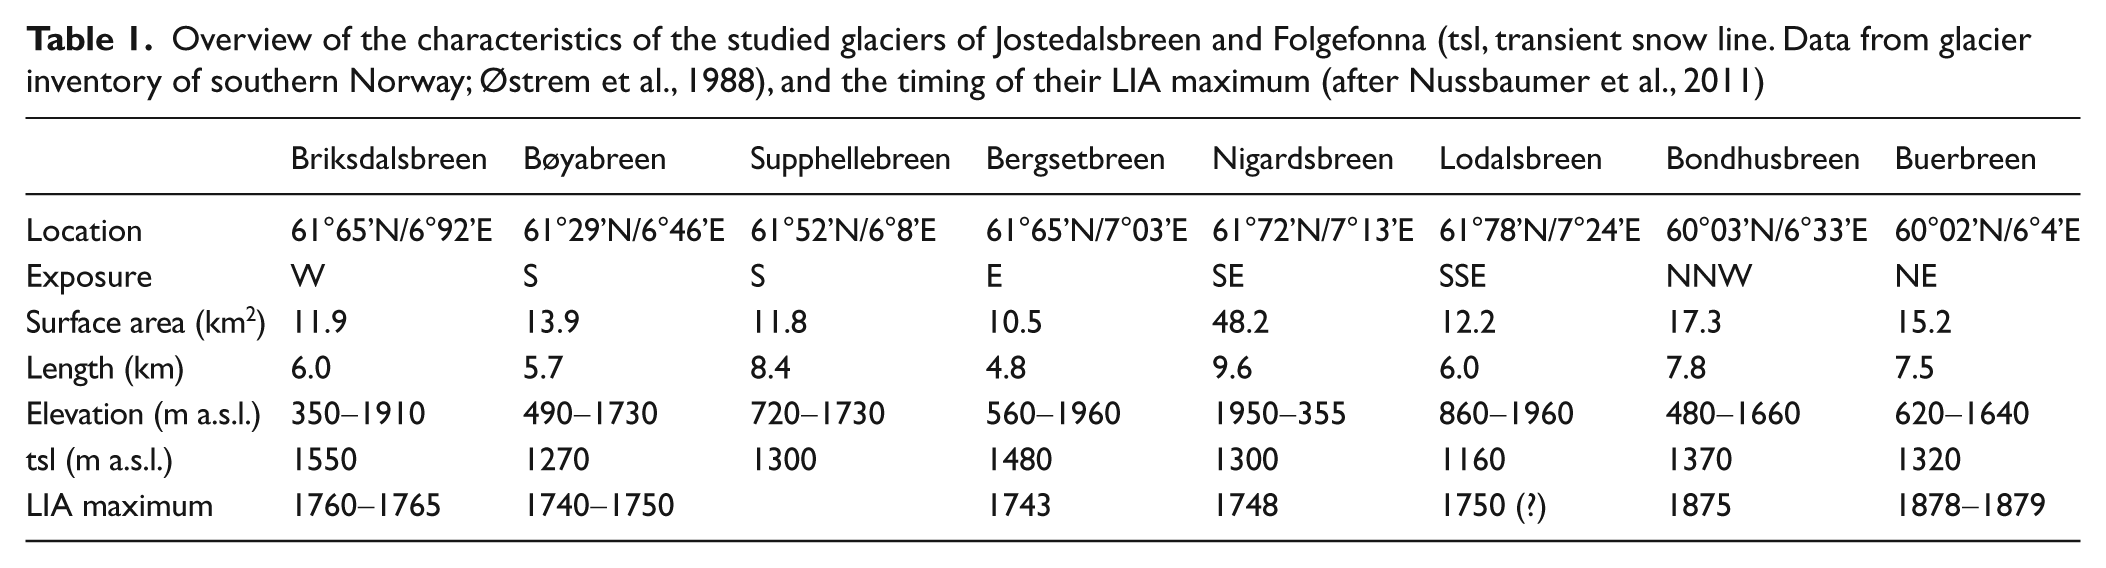
Jostedalsbreen and Folgefonna are maritime glaciers, fed by high rates of snowfall brought by the humid and mild southwesterly winds from the North Atlantic. Owing to their high mass turnover, they react sensitively to changes in the predominant weather and climate conditions. Their net mass balance is mainly controlled by the winter balance (accumulation season) (Andreassen et al., 2005; Nesje et al., 1995). Like most glaciers in southern Scandinavia, the outlet glaciers of Jostedalsbreen attained their LIA maximum position during the mid eighteenth century (e.g. Nesje and Dahl, 2003; Nussbaumer et al., 2011). According to Nussbaumer et al. (2011), the LIA maximum at southern Folgefonna was attained in the late 1870s (with a second peak around 1890).
For the comparison with Alpine glacier fluctuations, the Pré-de-Bard Glacier was chosen. The Pré-de-Bard is a temperate valley glacier located in the Italian Mont Blanc massif, western Alps (45°54′N, 7°03′E). Its elevation ranges from 3750 to 2081 m a.s.l., with a mean average slope of 37%. The glacier is exposed in a southeastern direction and covers an area of 3.1 km2 over a length of 3.4 km (glacier cadastre 2005, adapted from Fondazione Montagna Sicura; Imhof, 2010). The Pré-de-Bard Glacier reached its LIA maximum in 1818/1819 (Imhof, 2010). The location of Pré-de-Bard Glacier and the Great St Bernard weather station (~23 km east of Mont Blanc), used for the calculation of the climate index are indicated in Figure 2.

Top left: Geographical location of the Mont Blanc massif and Pré-de-Bard Glacier, as well as the meteorological station at Great St Bernard pass (adapted from Grove, 2004). Bottom left: Aerial view of the Pré-de-Bard frontal area with approximate glacier outline in 1818/1819, c. 1850, c. 1860, c. 1890, 1920/1922, 1942 and 1989 (Imhof, 2010; Photograph S.U. Nussbaumer, 30 September 2009). Right: Proximal view of glacier snout and ice fall of Pré-de-Bard Glacier (Photograph P. Imhof, 27 June 2009)
Data and methods
Climate index
Glaciers are sensitive indicators of climate variability and respond to both summer temperature (ablation season: Norway, 1 May–30 September; Alps, 1 April–30 September) and winter precipitation (accumulation season; Norway, 1 October–30 April; Alps, 1 October–31 March). To examine the glacier–climate relationship, records of winter precipitation (Pw) and summer temperature (Ts) at the Bergen meteorological station (12 m a.s.l.) back to 1862 were used (meteorological data from Climate Division, Meteorological Institute, Oslo). The meteorological record of Bergen is regarded as representative for the climate trends of southwestern Norway (Nesje, 1989). For the length change of a glacier, relative changes in the meteorological conditions are important rather than the absolute values. Thus, a climate index was generated by adding standardized records of Pw and Ts (inversed). For the standardization, the difference between annual and mean values was divided by the standard deviation (X−Xmean/std). Based on the relative importance of winter balance and summer balance for the net mass balance of Nigardsbreen (Nesje et al., 2000), Pw and Ts were given equal weight. The same procedure was applied to the meteorological data of Great St Bernard Pass (2479 m a.s.l.; data from MeteoSwiss), to calculate a climate index for the southeastern Mont Blanc region back to 1866. Again, Pw and Ts were given equal weight, as temperature is only slightly more important (52%) for glacier fluctuations of the nearby Mer de Glace than precipitation (Nussbaumer et al., 2007). The climate index indicates periods favourable for glacier advances/positive net mass balance (high Pw, low T s) and retreats/negative net mass balance (low Pw, high Ts). The climate indices are named BCI (Bergen Climate Index) and GSBCI (Great St Bernard Climate Index).
The frontal time lag
The frontal response of a glacier to changes in climatic conditions is delayed. After a certain ‘reaction time’ (or time lag), ranging from a few years to several decades, glacier length changes and the glacier finally reaches a new equilibrium after a ‘response time’ from several years to about 100 years (Haeberli, 1995; Hoelzle et al., 2007). Basically, the reaction and response time of a glacier to a climatic forcing is proportional to its size (Hoelzle et al., 2007), but it also depends on relief, exposition, elevation, etc. (Paterson, 1994). The response time depends also on whether the glacier is advancing or retreating; glacier advances are of a more dynamic character than retreats, which are dominated by ablation and thus more dependent on climate parameters (e.g. Nussbaumer et al., 2007; Schmeits and Oerlemans, 1997).
The glacier length change curves of the eight study glaciers in Norway were reconstructed by Nussbaumer et al. (2011). First, the glacier length change record (annual fluctuations) of Briksdalsbreen was compared with the BCI. The time lag was calculated by a Pearson correlation analysis, and additionally analysed by a simple visual comparison of the events dating in the two records. Briksdalsbreen was chosen because of its short and steep valley tongue, which makes this glacier especially sensitive to changing climate conditions. Moreover, Briksdalsbreen is one of the only glaciers with a continuous record of measured annual front variations going back to
The role of the North Atlantic Oscillation (NAO) for glacier length changes
The NAO describes interannual variability in the atmospheric and oceanic circulation over the North Atlantic and northwestern Europe. Its manifestation is indicated by the NAO index, based on the difference of normalised sea level pressures between Ponta Delgada, Azores and Stykkishólmur, Iceland. The index is most pronounced over western Norway during winter (Nesje et al., 2000). A positive NAO index is generally associated with stronger-than-normal westerlies, above-normal precipitation and mild temperatures across the North Atlantic and northwestern Europe (Reichert et al., 2001; Wanner et al., 2001). During pronounced negative phases of the NAO, opposite patterns of temperature and precipitation anomalies are typically observed.
One of the aims of this paper is to test the influence of the NAO during the peak winter season (December–March) on climate conditions and glacier length fluctuations in southwestern Norway and the western Alps, respectively. For the comparison, Briksdalsbreen (Jostedalsbreen, southwestern Norway) and Pré-de-Bard Glacier (Mont Blanc, western Alps) were chosen. To produce a winter NAO index (NAODec–Mar), monthly mean NAO indices back to 1823 were used (URL: http://www.cru.uea.ac.uk/cru/data/nao/nao.dat). For the winter NAO index, the winter season (December–March) instead of accumulation season (October–April) was used, as NAODec–Mar is better correlated to glacier fluctuations than NAOOct–Apr (Nesje et al., 2000). As the NAO and climate indices as well as the glacier fluctuations are highly variable on the annual timescale, the records were smoothed by 5-year running mean to remove the annual variability. The correlations between NAODec–Mar and the climate indices of Bergen (observation period 1862–2010) and Great St Bernard (observation period 1866–2009) were tested by Pearson correlation analyses. To analyse the correlation between NAODec–Mar and the glacier fluctuations, annual fluctuations shifted for the characteristic time lag to a climate signal (Briksdalsbreen, 3 years; Pré-de-Bard Glacier, 5 years) were used. The observation periods of annual glacier fluctuations were
Results
The relationship between climate and glacier response – the example of Briksdalsbreen
Extensive meteorological experiments on glaciers have shown that fluctuations in the mass balance, and thus glacier length, are mainly due to temperature during the summer ablation period (Ts) and precipitation during the winter accumulation period (Pw) (Oerlemans, 2005). Nevertheless, it must be noted that also spring and autumn precipitation and temperature may have significant effects and that various combinations of temperature/precipitation characteristics can lead to advances/retreats of a glacier in historical times (Steiner et al., 2008). Figure 3A shows the individual Pw and Ts records of Bergen as well as the BCI. Note that the temperature record has been inversed, such that positive index values correspond to low summer temperature signals. The correlation of the two meteorological parameters is r=0.42. A high climate index and thus conditions favourable for a glacier advance are achieved by a combination of high Pw and low Ts values. The meteorological record can be classified into five distinct periods. The first period from 1862 until 1883 was characterized by very low winter precipitation (20% below the long-term mean of 1862–2010) and a corresponding low BCI. The following phase (1884–1930) corresponds to the end of the LIA and includes three BCI peaks, which were mainly due to low summer temperatures. In the transition phase from 1931 until 1970, summer temperatures reached a higher level and were complemented by rather low winter precipitation, leading to a low BCI. The following phase corresponds to the rapid glacier advance in the 1990s as a response to a winter precipitation peak around 1991. The most recent period (since 1995) was characterized by a strong summer temperature rise (10% above the long-term mean of 1862–2010) and a winter precipitation peak around 2006/2007.
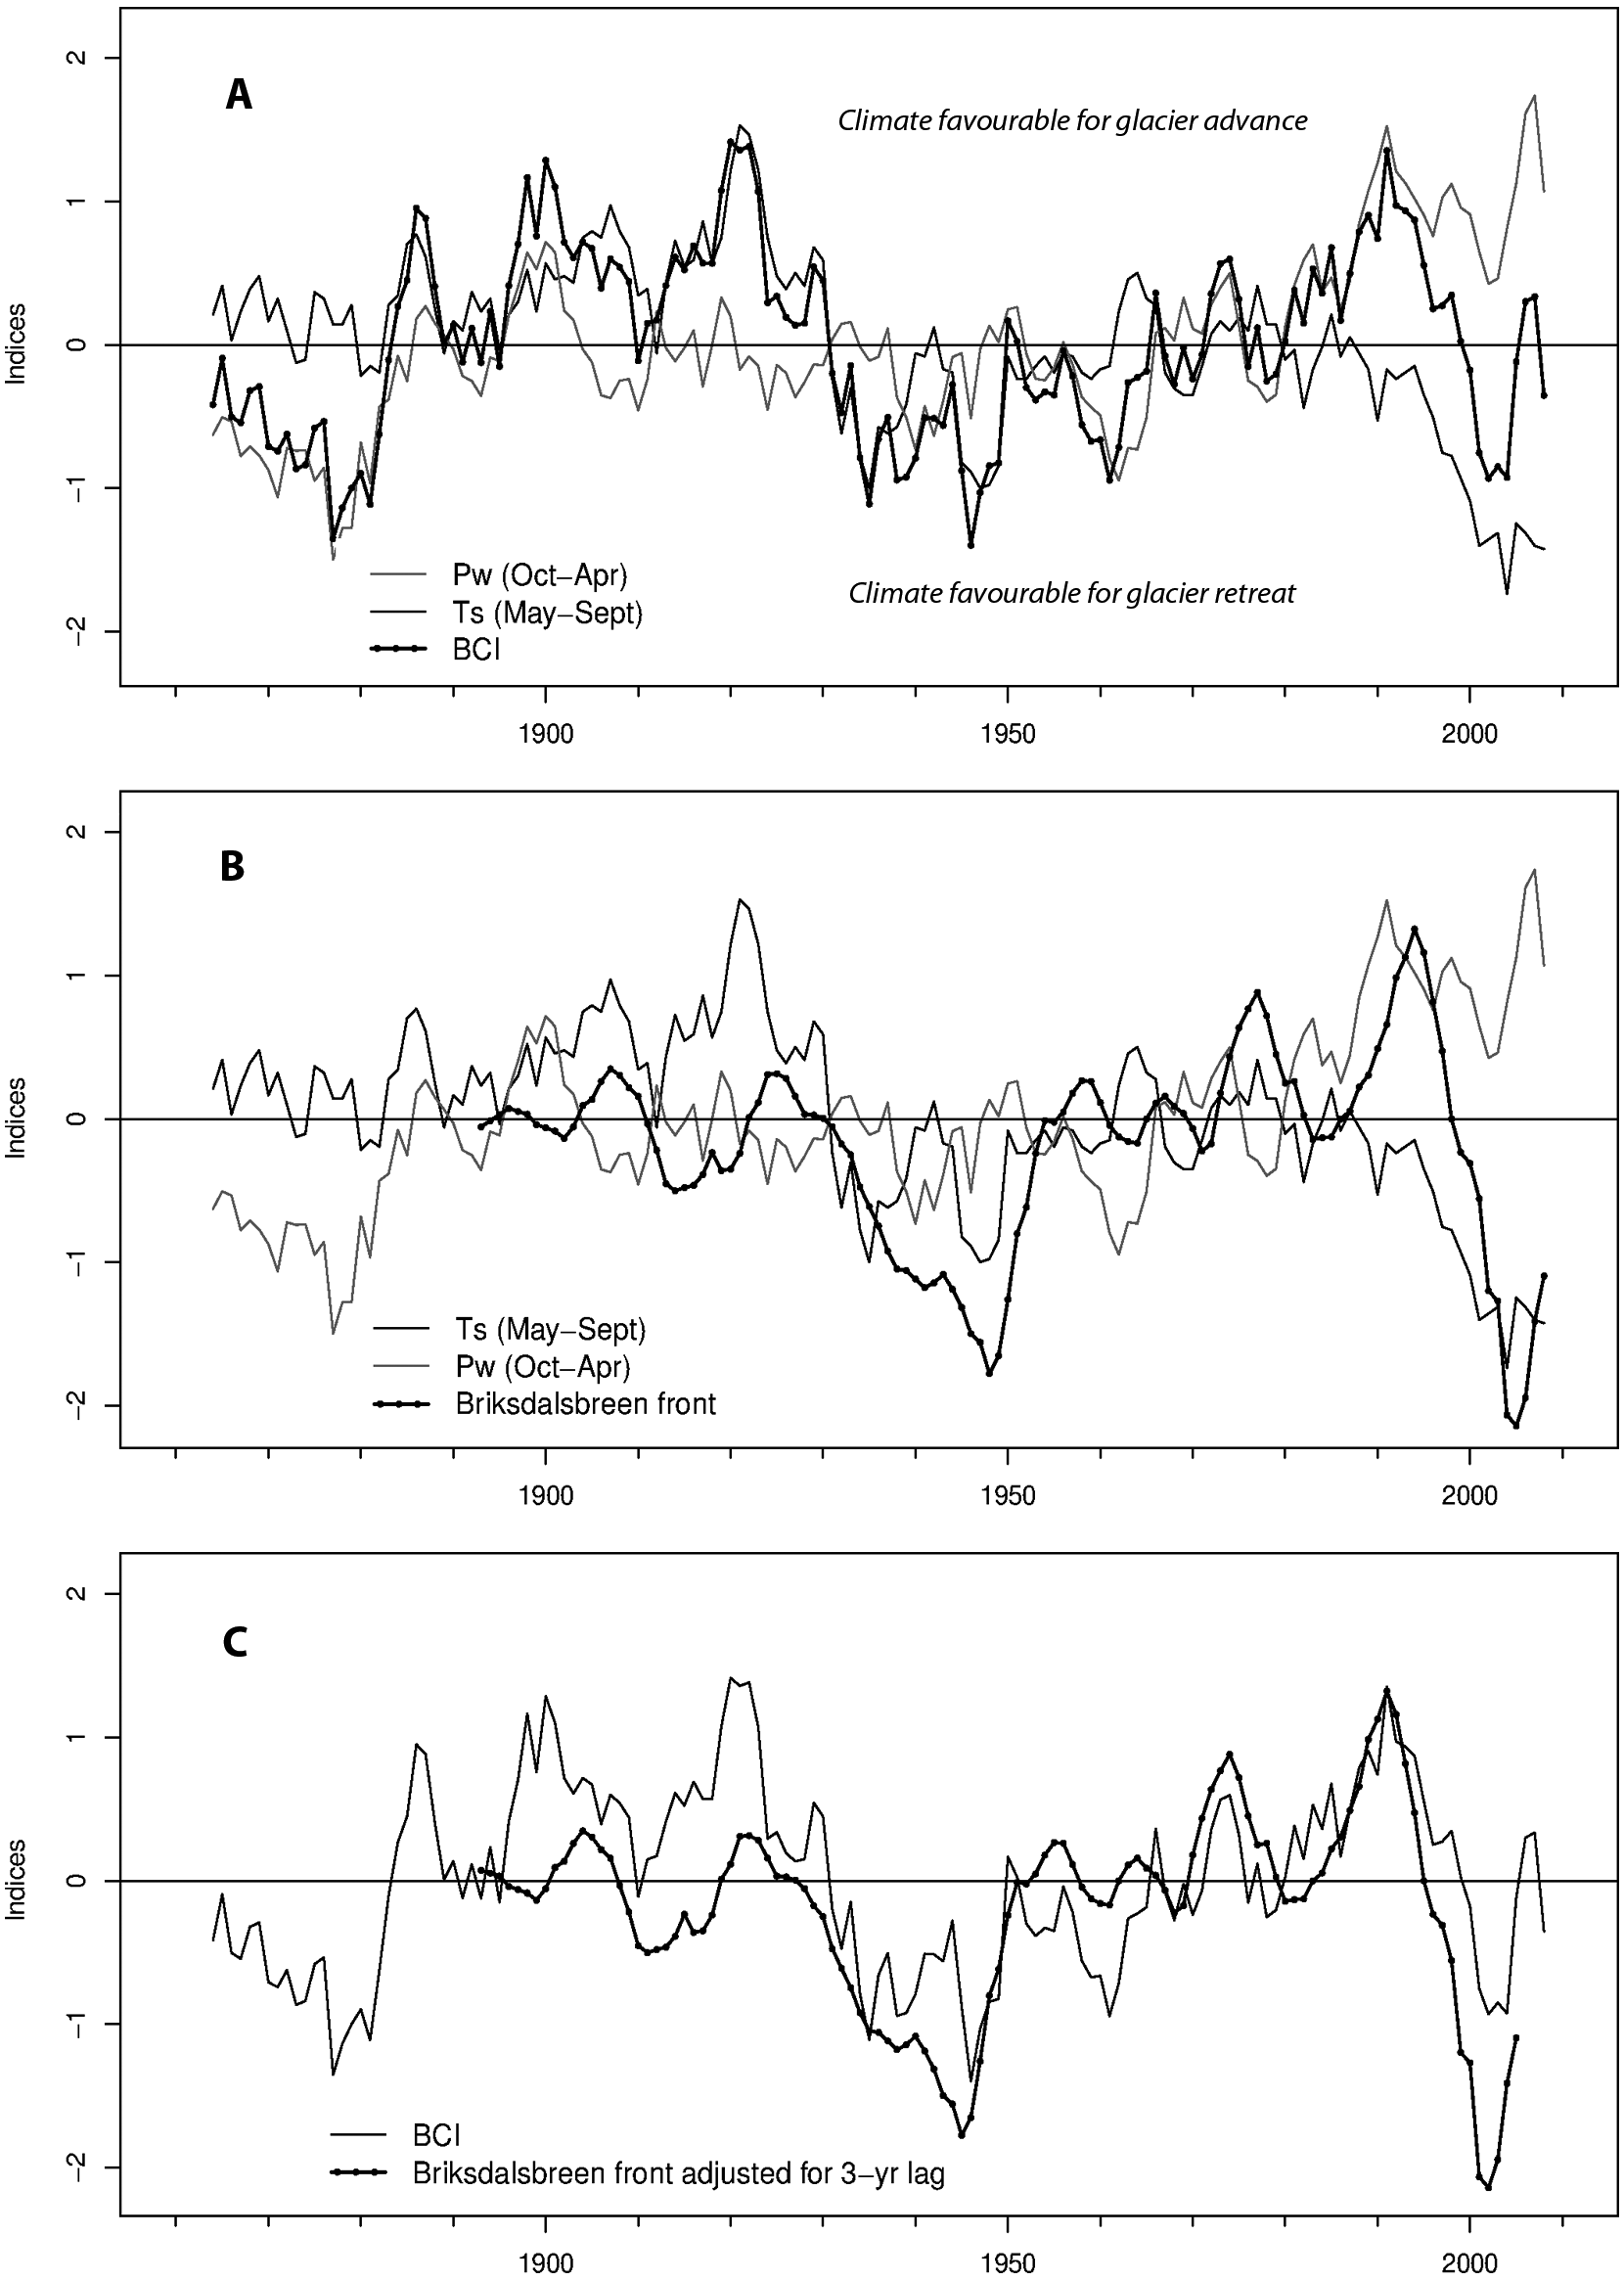
(A) Standardized values for Pw and Ts in Bergen (
In Figure 3B, P w and Ts are plotted together with the annual front variations of Briksdalsbreen. The glacier was moderately advancing in the periods 1904–1910 and 1922–1930, both intervals after a period of lower summer temperatures. The following retreat phase lasted until 1955, and was especially pronounced in the 1940s. This retreat phase was characterized by high summer temperatures, combined with low Pw in the early 1940s. However, according to Steiner et al. (2008), glacier retreat in this period was mainly driven by low spring (March–May) precipitation and high autumn (September–November) temperatures. After this twentieth-century minimum, Briksdalsbreen recovered gradually: a first advance maximum was reached in 1977, followed by a pronounced glacier advance with the maximum annual advance in 1994 (~22 cm/day; Nesje, 2005). Whereas the moderate advances of Briksdalsbreen in the early twentieth century were mainly due to reduced summer temperatures, the rapid advance of the 1990s was primarily attributed to increased winter precipitation (positive NAO index), indicating that winter precipitation may be more important for advances of Norwegian maritime glaciers than summer temperature. The most recent retreat though, has been caused by a significant rise in summer temperatures. The summer of 2002 was even the warmest in western Norway since 1734 (Nordli et al., 2005).
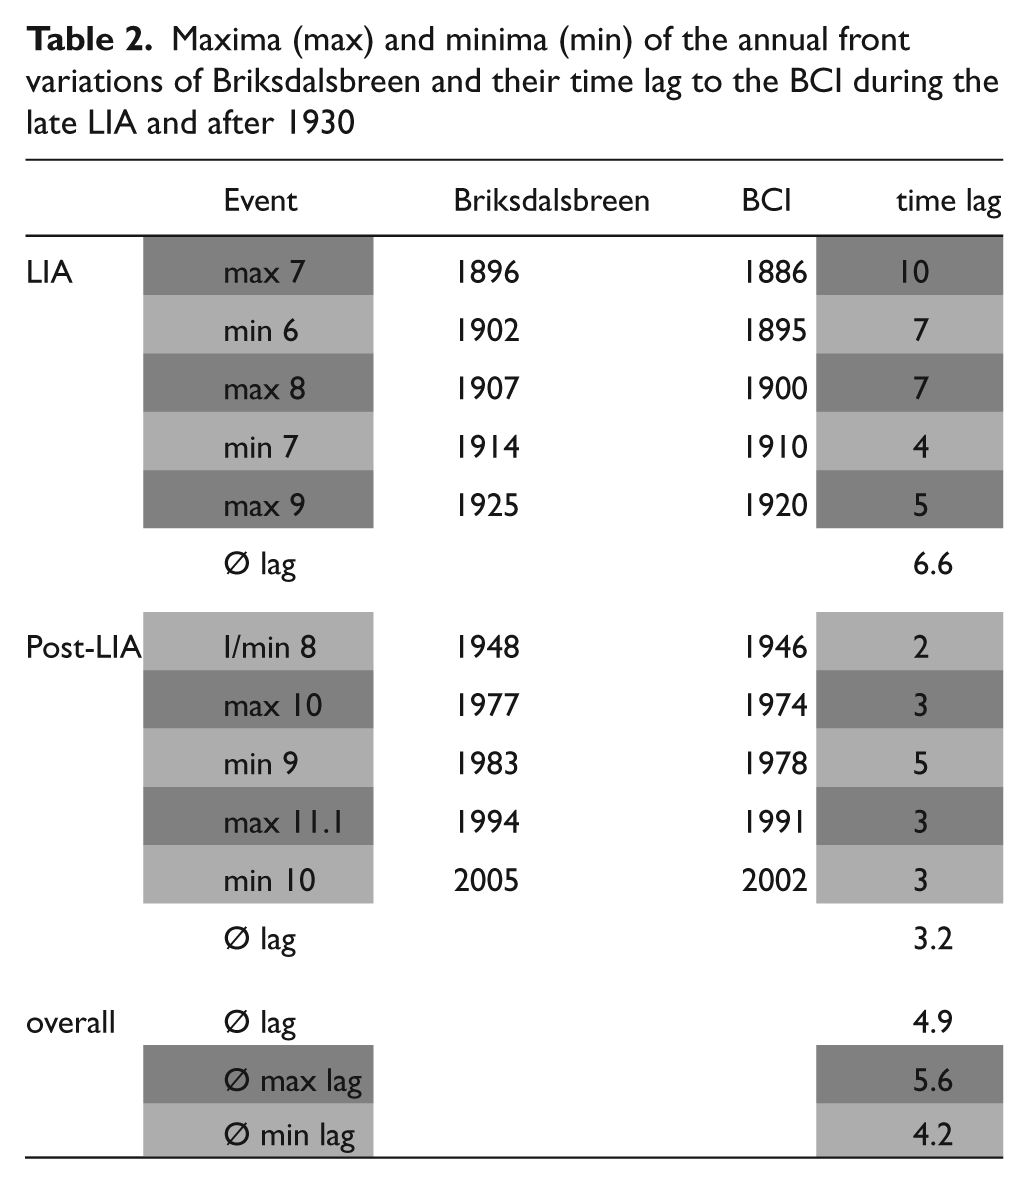
The BCI and standardized annual glacier-front variations of Briksdalsbreen adjusted for a 3-year time lag are shown in Figure 3C. Periods of high BCI are, with a certain delay, followed by glacier advance. Statistical lagged correlation analysis shows that the best fit of the two curves is achieved with a glacier time lag of 3 years. When we compare the dating of the culmination points of the annual length changes and the BCI, the average frontal time lag is about 5 years (cf. Table 2). Thus, the time lag of Briksdalsbreen is c. 3–5 years. Dividing the record into a LIA period (1862–1930) and post-LIA period (1931–2010), characteristic time lags can be distinguished: during the LIA period the time lag was about twice as long as after the termination of the LIA (6.6 years compared with 3.2 years). This can also be observed in Figure 3C, where the fit of the adjusted glacier curve to the BCI is weaker in the period before 1910. The reason is that the reaction time of a glacier to a climatic forcing is proportional to its size; during the rapid retreat after the last major maximum in 1929 Briksdalsbreen shortened considerably, and hence needed less time to adjust to a change in mass balance. Overall, the glacier is more rapidly reacting to a negative BCI (time lag of 4.2 years, compared with 5.6 years for positive BCI). In terms of climate forcing, glacier retreats are thus more immediate than advances.
Maxima (max) and minima (min) of the annual front variations of Briksdalsbreen and their time lag to the BCI during the late LIA and after 1930
Time lags at Jostedalsbreen and Folgefonna
Annual glacier length change measurements at Jostedalsbreen and Folgefonna started around 1900 (Andreassen et al., 2005). The glacier length change curves presented here (Figure 4) cover the last few centuries, and partly reach as far back as the seventeenth century (e.g. Nigardsbreen, 1675; Nesje et al., 2008; Nussbaumer et al., 2011). The historical fluctuations were reconstructed by Nussbaumer et al. (2011) using historical methods (analysis of written documents, drawings, paintings, photographs, topographic maps, etc.) and glaciomorphological evidence (moraines, etc.).
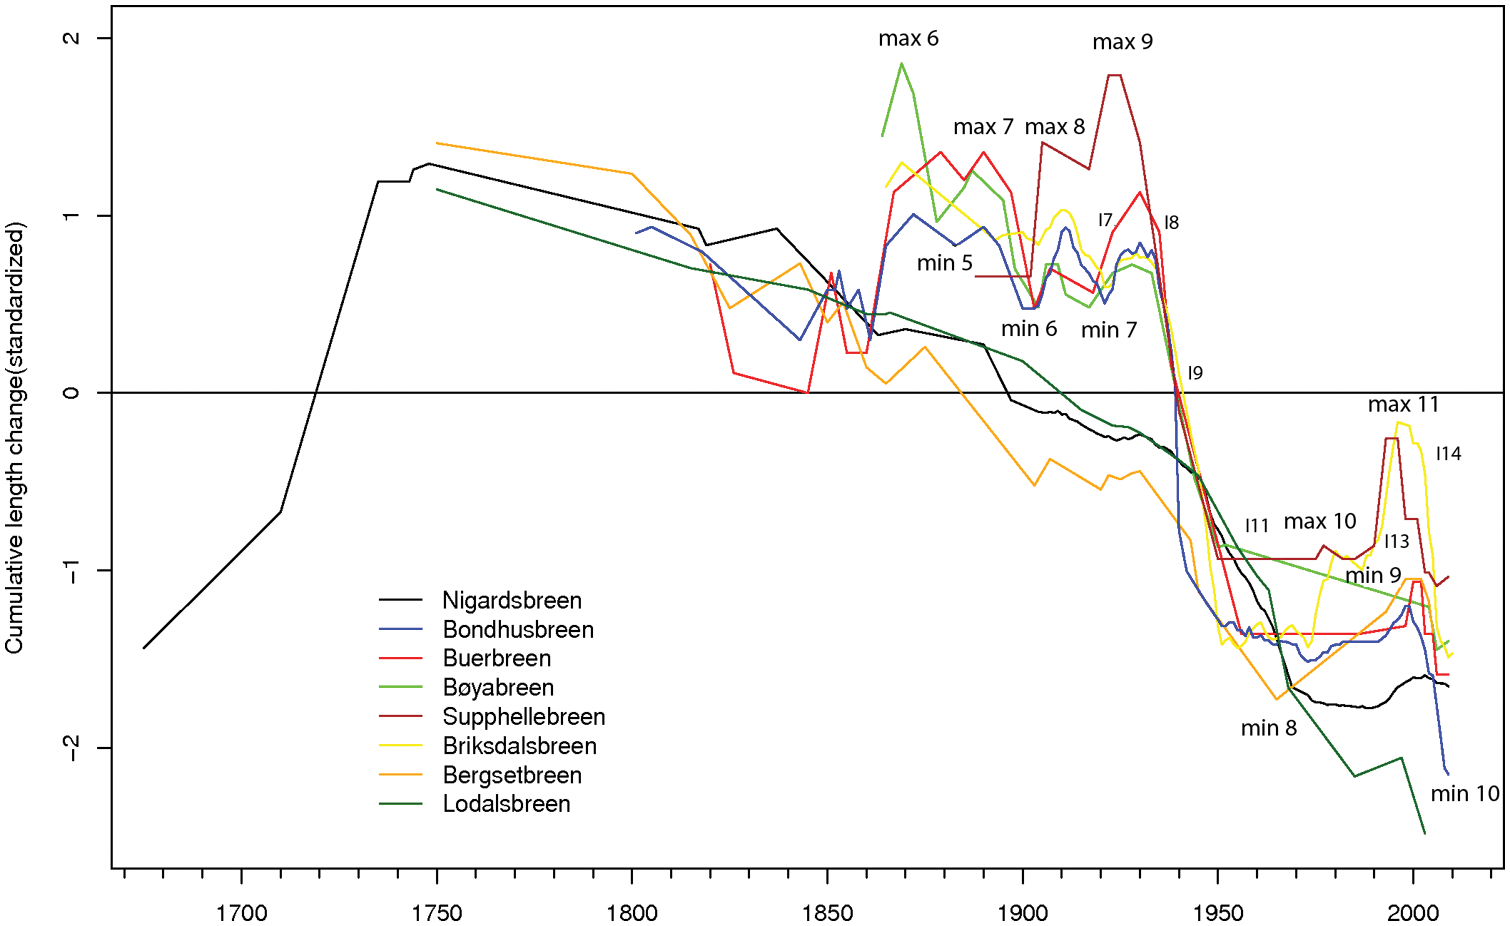
Standardized cumulative length variations of outlet glaciers of Jostedalsbreen and Folgefonna
The maxima (max), minima (min) and characteristic inflexion points (I) of the Briksdalsbreen length change curve (cf. Figure 4), and the dates of the corresponding events at the other outlet glaciers are listed in Table 3. Considering the overall time lag, it appears that Supphellebreen and Bøyabreen do not lag behind Briksdalsbreen, but react in advance (time lag −3.6 and −3.5 years, respectively). Bondhusbreen and Buerbreen are in general well synchronized with the Briksdalsbreen fluctuations (time lag −1.3 and 0.2 years, respectively). The time lag of Buerbreen is not uniform over the whole record: until the end of the LIA (~1930), Buerbreen was 2 years in advance of Briksdalsbreen, whereas afterwards it lagged about 3 years behind Briksdalsbreen. The fluctuations of Bergsetbreen are more smoothed, and compared with the other glaciers it experienced a considerably weaker retreat after the LIA termination. Except the 1950–1970s period, the fluctuations of Bergsetbreen are, with a lag of about 4 years, well synchronized with Briksdalsbreen. The fluctuations of Nigardsbreen are even more smoothed, and the glacier only experienced minor advances, in a record of general retreat (time lag 15 years). Lodalsbreen, finally, has been continuously retreating during the whole record, and did not experience any maxima and minima until the 1980s (time lag ~18 years).
Maxima (max), minima (min) and characteristic inflexion points (I) of cumulative length changes of Briksdalsbreen and the corresponding event dates at the other glaciers. Time lag (in years) is given relative to the Briksdalsbreen dates. The last row indicates the time lag to the BCI, calculated on the basis of the Briksdalsbreen time lag
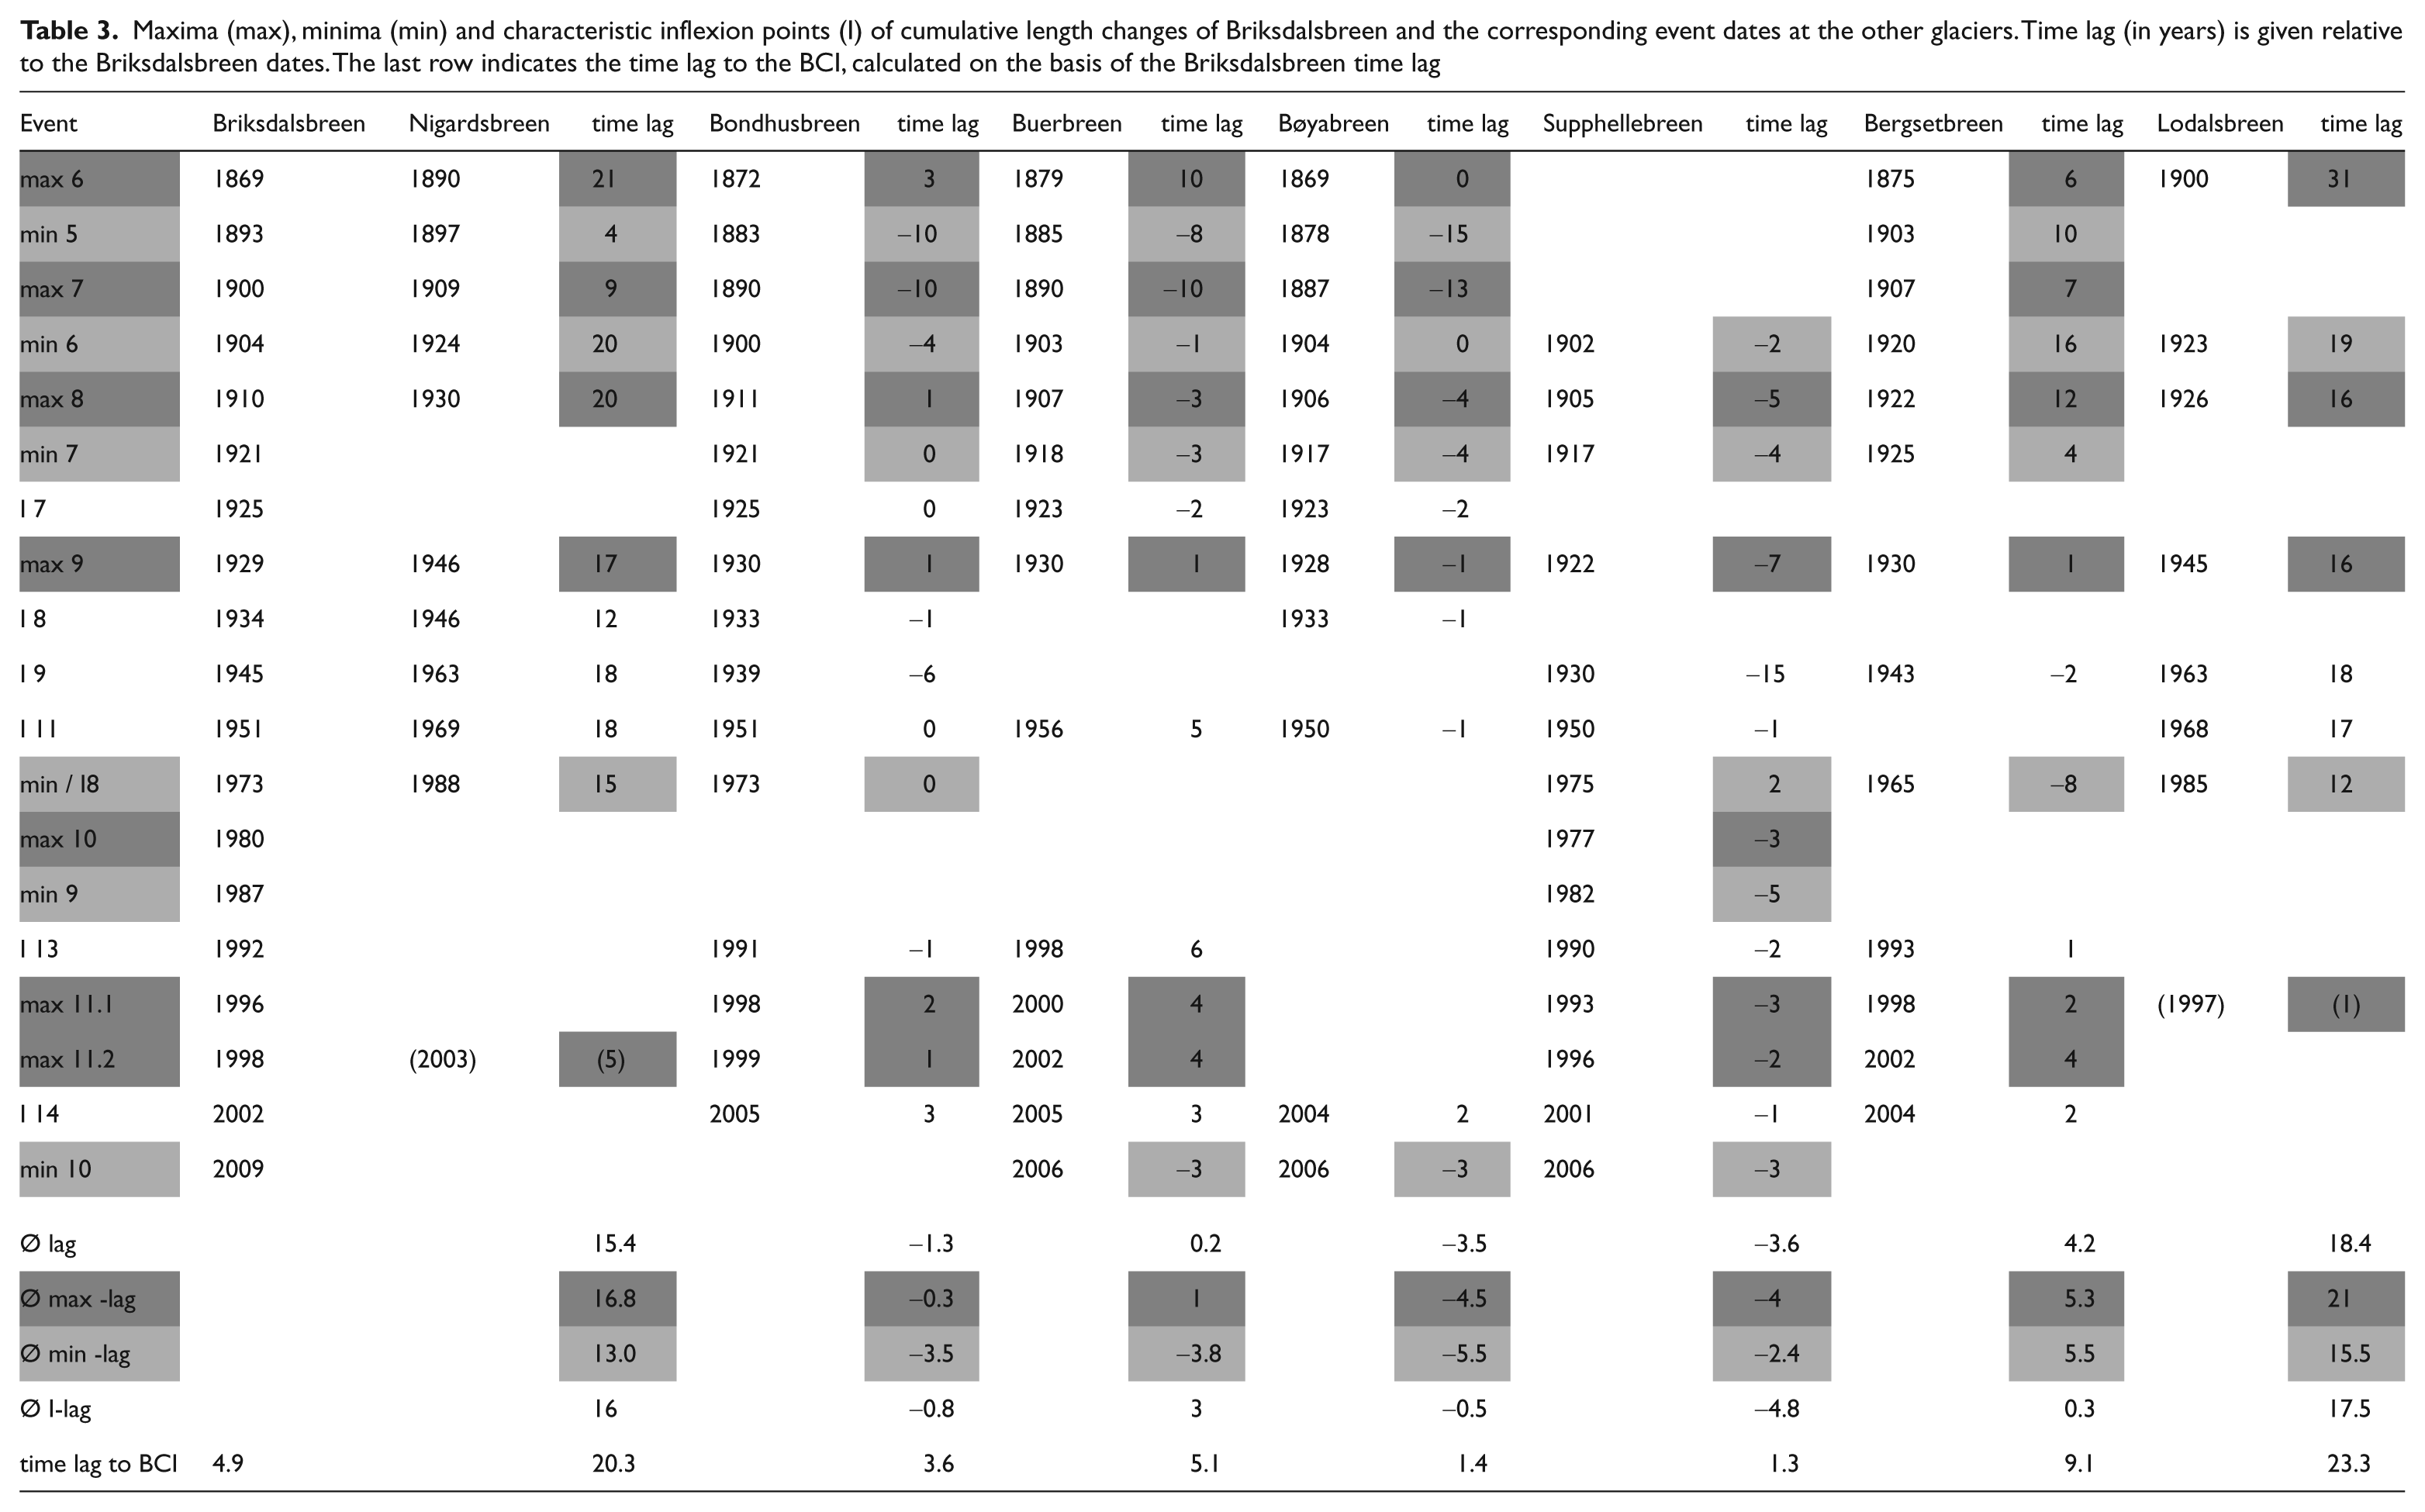
The results show that the front of inert ice bodies (e.g. Nigardsbreen, Lodalsbreen) do not react to short-term climate variations. Steep and short glaciers (e.g. Supphellebreen, Bøyabreen, Briksdalsbreen) though, almost immediately adjust their front position to short-term changes. These differences in time lag are responsible for dissimilar reactions of nearby outlet glaciers of the same ice cap. Comparing reaction time for the culmination of advances and retreats, it seems that the time lag is smaller for minima, and the glaciers need more time to reach a maximum.
During the most recent advance, all the short outlet glaciers reached maxima between 1993 and 2002 (max11). Figure 5 shows photographs of Briksdalsbreen, Supphellebreen and Nigardsbreen at the beginning of the advance and during culmination, as well as a photograph of 2010 (for photographic series of Bergsetbreen and Bøyabreen see Winkler et al., 2009). Figure 6 depicts one of the rare photographs of the hardly accessible Lodalsbreen in 1992. After two centuries of more or less continuous melt-back (since the LIA maximum in the mid eighteenth century; Nussbaumer et al., 2011), also Lodalsbreen and Nigardsbreen experienced a maximum in 1997 and 2003, respectively. It is unclear whether this most recent maximum at Nigardsbreen occurred as a response to the same triggering factors as for the maximum at Briksdalsbreen. The time lag of only 5–7 years for Nigardsbreen and one year for Lodalsbreen are instance to the contrary. Alternatively, these maxima could correspond to event max10, which, however, only occurred at Supphellebreen and Briksdalsbreen, but not at the other short outlet glaciers.

Photograph series of Briksdalsbreen (top), Supphellebreen (middle) and Nigardsbreen (bottom), showing the rapid advance in the 1990s and consequent retreat. Photographs: a,b, Sigbjørn Myklebust; c, Atle Nesje; d–i, Stefan Winkler

The glacier tongue of Lodalsbreen in a photograph from 1992 (photograph Stefan Winkler)
The NAO and glacier fluctuations in Norway and the western Alps
It is generally considered that the LIA was a period of cooling after the relatively warm medieval times and before the twentieth-century warm phase (Pfister, 1999). The climate during the LIA was marked by lower than average temperatures, which led to rapid glacier advances in the fourteenth and early seventeenth centuries (Grove, 2004). However, Nesje et al. (2008) showed that the main cause of the early eighteenth-century glacial advance in western Scandinavia was not lower summer temperatures alone, but also mild and humid winters, associated with increased precipitation and high snowfall on the glaciers, most likely as a result of a prevailing positive NAO weather mode (Luterbacher et al., 2002). The climate conditions were not only varying in space, but also in time (Grove, 2004). Whereas the LIA maximum peaks in the Alps occurred around 1600/1640 and 1820/1850 (Nussbaumer et al., 2007; Zumbühl, 1980; e.g. Pré-de-Bard Glacier 1818/1819, Imhof, 2010), the glaciers in southern Norway culminated in the mid eighteenth century (e.g. Briksdalsbreen 1760–1765; Pedersen, 1976), some even around 1870–1890 (Nussbaumer et al., 2011). In the European central Alps, the LIA termination is commonly attributed to the mid nineteenth century (Holzhauser, 2010; Nussbaumer et al., 2007). In Scandinavia, however, glacier front variations and temperature records indicate that the LIA lasted until ~ad 1920 (Nesje and Dahl, 2003).
For the comparison of glacier fluctuations in southern Norway and the western Alps, Briksdalsbreen and Pré-de-Bard Glacier were chosen as examples. Both glaciers are comparatively small, with a short and steep valley tongue (cf. Figure 2, right). Thus they are comparable in their glacier dynamics and have a similar time lag (Briksdalsbreen, 3–5 years; Pré-de-Bard Glacier, 5 years). Note though, that the time lag of the Pré-de-Bard Glacier was determined by a correlation analysis between ablation season temperature anomalies and the corresponding length change (Imhof, 2010), whereas for Briksdalsbreen the correlation to the climate index was analysed. The newly reconstructed cumulative fluctuations of Pré-de-Bard Glacier (Imhof, 2010) and the Briksdalsbreen record are plotted in Figure 7A. For comparison, also the cumulative fluctuations of Mer de Glace (Nussbaumer et al., 2007), a glacier on the Mont Blanc north side, are plotted. On multidecadal scale the fluctuations of Pré-de-Bard Glacier and Briksdalsbreen are mainly anti-correlated; maxima at Pré-de-Bard Glacier coincide with minima at Briksdalsbreen. The last maximum at Pré-de-Bard Glacier was reached in 1989. At the same time Briksdalsbreen, like the other maritime Norwegian glaciers, only started its rapid advance, which culminated in 1996–1998.
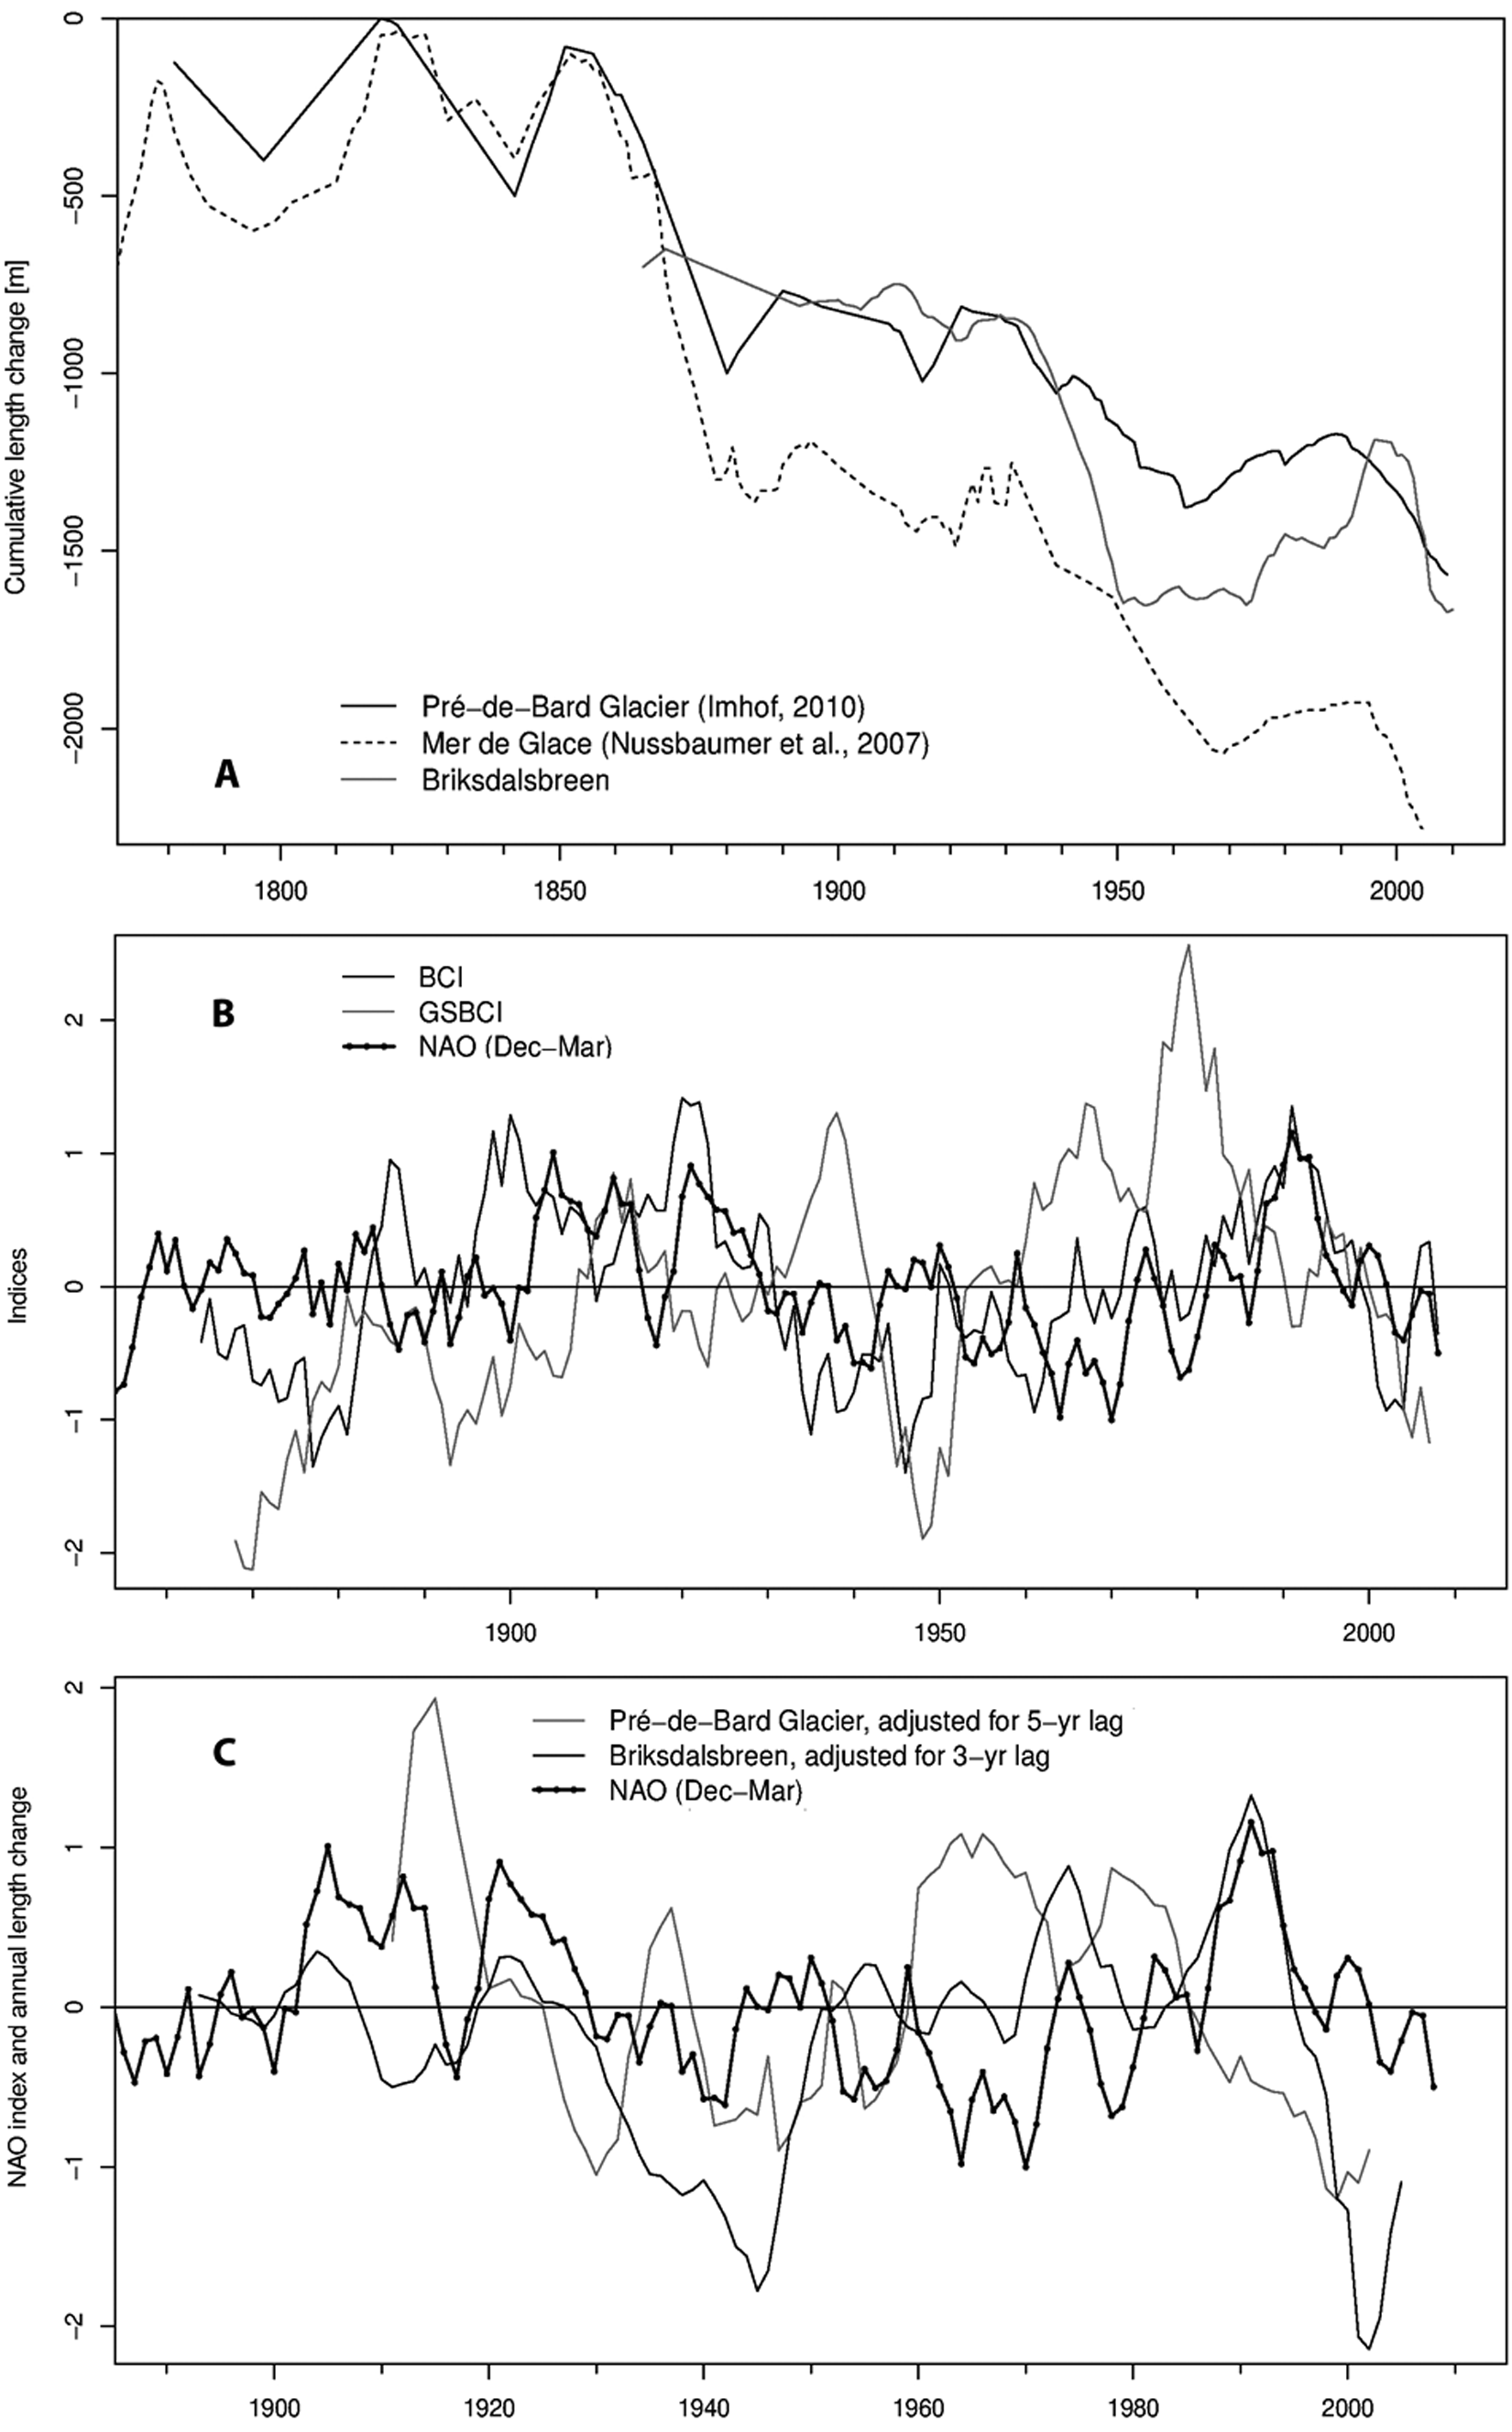
(A) Cumulative length change of Pré-de-Bard Glacier (
These anti-phased glacier fluctuations on multidecadal scale are attributed to the difference in geographical location and climate. The maritime character of the Norwegian glaciers stands for a long melting season, especially on the lower part of the glaciers, with a high sensitivity to changes in temperature from May to October (Reichert et al., 2001). The sensitivity to relative changes in precipitation, on the other hand, is high in winter. The Alpine glaciers (e.g. Rhone Glacier in Reichert et al., 2001) have a high sensitivity to changes in temperature during summer, and nearly constant sensitivity to precipitation throughout the year. Therefore, it has to be assumed that even small changes in summer temperature have a noticeable impact on Pré-de-Bard Glacier, as because of its high elevation a large fraction of summer precipitation falls as snow. Moreover, as a more continental glacier situated in the lee of the Mont Blanc massif, the Pré-de-Bard Glacier receives less precipitation than Briksdalsbreen, which is nourished with frequent winds blowing from the sea onland (mean annual precipitation sum: Great St Bernard, 1858 mm, Schüepp, 1991; Jostedalsbreen, 2500 mm, Østrem et al., 1988). The western Alpine glaciers (Pré-de-Bard) are situated in the transition zone between maritime and continental regimes, which makes summer temperature the dominating factor, whereas Norwegian glaciers (Briksdalsbreen) are more sensitive to precipitation during the accumulation season (Steiner et al., 2008).
The anti-correlation of glacier fluctuations is also reflected in the fluctuations of the Bergen and Great St Bernard Climate Indices (Figure 7B); periods with conditions favourable for glacier advance in Bergen, coincide with periods favourable for glacier retreat at Great St Bernard. The bi-polar pattern leads to the investigation of possible relationships with the NAO. The correlation between the low-pass filtered (5-year running mean) NAODec–Mar index and the BCI is r=0.44, whereas for the GSBCI an anti-correlation of r=−0.23 was found (both significant at 95% confidence level; for observation periods compare data and methods section). High NAO index winters can be related to above-normal precipitation over Scandinavia (important for Briksdalsbreen) and below-normal precipitation over central and southern Europe (important for Pré-de-Bard Glacier) (Hurrel, 1995). The correlation between NAODec–Mar and winter precipitation (PDec–Mar) between
At the same time the climate conditions are rather unfavourable for glacier advance in the western Alps, which is reflected in negative GSBCI values. If we calculate the correlations between NAODec–Mar and the annual glacier fluctuations shifted for the typical time lag, the coefficient for Briksdalsbreen is r=0.26, whereas for Pré-de-Bard Glacier an anti-correlation of r=−0.23 was found (both significant at 95% confidence level). These are rather weak correlations, and the explained variance is only 5%. The glacier and NAODec–Mar records (Figure 7C) indicate that the suggested relationship was particularly pronounced in the 1962–1998 period. In fact, the correlations for this period are significantly higher: the correlation for Briksdalsbreen increases to r=0.63, the anti-correlation of Pré-de-Bard Glacier to r=−0.73. Apparently the strength of the relationship NAO–climate and NAO–glacier is highly variable over the whole record. Statistically, the correlations are only significant during some periods (e.g.
This demonstrates the non-stationarity of the climate system; according to Nussbaumer et al. (2011) the linear (stationary) approach between the NAO index and ‘downstream’ site-specific palaeoproxy reconstructions is limited by the non-stationary behaviour of the NAO system, leading to loss of temporal robustness of such analyses. Recent analyses (Nussbaumer et al., 2011; Ø. Lie, Bjerknes Centre for Climate Research, personal communication, 24 June 2008) indicate that the influence of the NAO index on Norwegian temperature and precipitation was not stationary within the twentieth century. Nevertheless, the analyses in this paper reveal a general correlation between Briksdalsbreen and the NAODec–Mar. The relationship between the NAO and the Pré-de-Bard Glacier on the other hand, is more complex; the NAO explains but one-third of the climate variability, and only during winter (Casty et al., 2005). Temperature and precipitation in the Alps are controlled by variable NAO influences due to the geographical situation of the mountains, and thus influenced by other atmospheric circulation modes too (Casty et al., 2005).
Discussion
Climate response at Jostedalsbreen and Folgefonna
The described glacier fluctuations during the twentieth century are in good accordance with the observed temperature and precipitation trends. Nordli et al. (2005) showed that the 1930s and 1940s, or the so called ‘early warming period’, was characterized by an exceptional ablation maximum, and corresponding particularly high values of the equilibrium line altitude, conditions that led to the pronounced glacier retreat after 1930. According to Nordli et al. (2005) the large winter snow accumulation during the early 1990s, leading to the most recent glacier advance, was unprecedented in the period 1781–2000. In addition, Winkler et al. (2009) state that during the 1990s, the precipitation maximum shifted from autumn into winter. Analyses in this paper showed that the largest glacier advance during the twentieth century was mainly caused by increased winter precipitation. Moreover, the main cause of the early eighteenth-century glacial advance, leading to the LIA maximum at most Scandinavian glaciers, was mild and humid winters associated with increased precipitation and high snowfall on the glaciers, most likely as a result of a prevailing positive NAO weather mode in the previous decades (Nesje et al., 2008). According to Nesje (2005) and Nesje et al. (2000), the net mass balance of maritime glaciers in southern Norway is mainly controlled by the winter balance. However, a strongly positive summer temperature anomaly seems to be the explaining factor for the most recent glacier retreat (Winkler et al., 2009). Based on this event, Winkler et al. (2009) suggest that the previously typical maritime glaciers strongly influenced by precipitation patterns, could become much more sensitive to summer air temperatures and the length of the ablation period. Overall, Norwegian glaciers do not respond uniformly to either summer temperature or winter precipitation, but rather to a complex interplay between different synoptic weather patterns (Nesje et al., 2008).
The rather short time lag of Briksdalsbreen can be explained by the morphology of the glacier basin. The ice masses are accumulated in a wide accumulation basin, and at the ablation zone channelized into a narrow and steep rock escarpment. This topographical channelling effect leads to the amplification of mass balance perturbations. In the narrow, gorge-like section of the icefall microclimatological effects (e.g. long-wave radiation from the valley walls) additionally enhance a meltback signal (Winkler et al., 2009). The longer time lags during the LIA correspond to a more advanced glacier, where the front ended in the plain below the ice fall. Exceeding ice masses had to be transported not only over a longer distance, but also over a sparsely inclined plain. Accordingly, the shortest time lag was achieved around 1950 (min8), when Briksdalsbreen was in a similarly retreated position as today. According to Oerlemans (2007), the large mass turnover (ablation rates on the snout ~ 10 m of ice) is another explanation for the short time lag of Briksdalsbreen.
The study of the frontal time lags showed that Supphellebreen and Bøyabreen have a shorter time lag than Briksdalsbreen. This can be attributed to differences in morphology. Supphellebreen is divided into an active upper part, and a regenerated lower part (cf. Figure 5). From the accumulation basin, exceeding ice mass is rapidly transported to the relatively short active front, where it is transmitted to the regenerated front by ice avalanches instead of flowing down the icefall. Mass balance perturbations are thus directly transported to the valley tongue (Orheim, 1970). Similar mechanisms occur at Bøyabreen, which in the last decades has been separated into two parts (with intermittent reconnection during 1994–2001; Winkler et al., 2009). However, in contrast to Supphellebreen, the active front of Bøyabreen is located half way down the icefall and avalanches fall a much shorter vertical distance.
The results suggest that we have mainly two groups of glaciers. The first group consists of the short and steep outlet glaciers Supphellebreen, Bøyabreen, Briksdalsbreen, Bondhusbreen and Buerbreen. They are characterized by an average time lag of only 1–5 years (observation period 1869–2009), and sensitively react on short-term climatic changes. The long and gently descending Nigardsbreen and Lodalsbreen form another group. Because of their morphology, they have a time lag of about 20 years, and only react on long-term climatic changes. Bergsetbreen, finally, is an intermediate case. With a reaction time of about 9 years, it is not as rapidly fluctuating as the short and steep outlet glaciers, but has nevertheless higher amplitude of fluctuations than the rather strongly smoothed Nigardsbreen and Lodalsbreen. During the most recent retreat, the tongue of Bergsetbreen has been disintegrating and was cut off from the active part in 2006, and is now prone to melt down (Winkler et al., 2009). In the shape of the ongoing climate warming, the disintegration of the tongue is also to be expected at the other steep and short outlet glaciers.
Comparative data concerning time lag is only available for some of the study glaciers. For Briksdalsbreen, Winkler (2009) empirically derived a time lag of 3–4 years. Oerlemans (2007) calculated a response time of 5 years for Briksdalsbreen on the basis of the measured length record. This is very well in accordance with the time lag of 3–5 years determined here. According to model calculations by Laumann and Nesje (2009), the frontal time lag of Briksdalsbreen will also in the future be 4–5 years. For Nigardsbreen, Nesje and Dahl (2003) calculated a frontal time lag of ~ 20 years, which is in good accordance with the time lag of 20.3 years calculated in this study.
It is to be expected that, as the studied outlet glaciers of Jostedalsbreen are part of the same ice plateau and their accumulation areas are adjacent or close to each other, the differences in glacier behaviour represent different time lags to similar climate changes. However, Bøyabreen, the glacier with the second shortest time lag, is located in the southwestern part of Jostedalsbreen and thus lies ahead in the flow direction of the southwesterly maritime winds. This could be an explanation for the early reaction of Bøyabreen compared with Briksdalsbreen. Supphellebreen, the glacier with the shortest time lag, is located next to Bøyabreen. Orheim (1970) showed that its short time lag is caused by the accumulation through avalanches. Comparing the Jostedalsbreen outlet glaciers with Bondhusbreen and Buerbreen reveals parallel deviations, where advances and retreats occurred at all glaciers with no obvious spatial differentiation. This suggests that also the differences in behaviour of Jostedalsbreen and Folgefonna outlet glaciers represent different responses to similar climate changes.
Glacier fluctuations and the NAO
The NAO index is most pronounced during winter, and therefore influences glacier mass balance mainly via winter precipitation. According to Reichert et al. (2001) the individual impact of precipitation on mass balance of Nigardsbreen is about 1.6 times higher than the impact of temperature. In a coupled GCM experiment, Reichert et al. (2001) calculated a well-pronounced correlation between the low-pass filtered NAO index and mass balance of Nigardsbreen (r=0.55; r=0.58 within the period 1962–1998), as well as a significant anti-correlation with Rhone Glacier in the Swiss Alps (r=−0.64). These values are in good agreement with the correlation coefficients with the NAODec–Mar calculated for Briksdalsbreen (r=0.63) and Pré-de-Bard Glacier (r=−0.73) annual length fluctuations over the period 1962–1998. Nesje et al. (2000) showed that the effect of the NAO on the glacier winter/net mass balance in Scandinavia gradually decreases with increasing continentality and increasing latitude (e.g. maritime Ålfotbreen, r=0.69; continental Gråsubreen, r=0.22).
In the European Alps the NAO affects the climate in a complex manner, as the Alps are situated in the transition zone between northern Europe (NAO positive: warm/wet; NAO negative: cold/dry) and southern Europe, where almost the opposite reactions apply (Wanner et al., 2000). The NAO influence in the Alpine region is less pronounced than in Scandinavia (Six et al., 2001) and often ambiguous (Scherrer et al., 2004). Steiner et al. (2008) showed that winter precipitation, which is the main factor linking NAO and glacier fluctuations, is less important for length variations of Alpine glaciers than for Norwegian glaciers. Moreover, Alpine glaciers are more sensitive to summer temperature, which is less influenced by the NAO (Reichert et al., 2001).
A simulation of the anomaly patterns of precipitation associated with the positive winter NAO over Europe by Reichert et al. (2001) showed that Briksdalsbreen is located near the maximum precipitation anomaly of +40 mm/month, whereas Pré-de-Bard Glacier is located in a region of reduced winter precipitation (~ −20 mm/month). Considering that the Briksdalsbreen is most sensitive to winter precipitation anomalies, this demonstrates the strong influence of the NAO on its glacier mass balance and length fluctuations. A winter-precipitation index for the northern Swiss Alpine foreland between
Summary and conclusion
The net mass balance of maritime Norwegian glaciers is mainly controlled by winter precipitation. Whereas the moderate glacier advances in the early twentieth century were mainly due to reduced summer temperatures, the rapid advance of the 1990s was primarily attributed to increased winter precipitation (positive NAO index).
The time lag of a glacier is proportional to its size and thus not constant during the whole record. During the LIA the time lag of Briksdalsbreen for example, was twice as long as in the twentieth century. In general, glaciers react more rapidly to a negative climate signal, and glacier retreats are more immediate than advances.
Varying time lags of adjacent outlet glaciers are mainly due to differences in glacier morphology. Short and steep glaciers (e.g. Bøyabreen) almost immediately adjust their front position to short-term climate changes, whereas the fronts of inert ice bodies (e.g. Lodalsbreen) only react to long-term changes and have smoothed fluctuations.
Supphellebreen and Bøyabreen react in advance of Briksdalsbreen (average time lags of 1.3 and 1.4 years, respectively; observation period 1869–2009), whereas Bondhusbreen and Buerbreen are in general well synchronized with Briksdalsbreen (average time lags of 3.6, 5.1 and 4.9 years, respectively). The fluctuations of Bergsetbreen are more smoothed, and lag about 4 years behind Briksdalsbreen. Long and gently descending Nigardsbreen and Lodalsbreen finally, have average time lags of 20.3 and 23.3 years, respectively.
A strongly positive NAO index leads to enhanced winter precipitation, higher-than-normal positive mass balance and, with a certain time lag, to the advance of Norwegian glaciers. In the Alps, changes in the westerly circulation associated with a positive NAO index can lead to reduced winter precipitation and lower than normal winter mass balance and thus, after a certain delay, to retreating glaciers.
The (anti-)correlation with the NAO was not constant during the record. The classical relationship was particularly pronounced between 1962 and 1998 (Briksdalsbreen, r=0.63; Pré-de-Bard Glacier r=−0.73), but significantly weaker or even inversed during other periods. In the perspective of climate change, especially maritime glaciers in southern Norway will be influenced in a complex way by future fluctuations (frequency and magnitude) of the NAO.
Footnotes
Acknowledgements
The authors would like to thank Mathias Trachsel for help with statistical analyses and Jürg Luterbacher for valuable comments on the manuscript. The paper was improved thanks to the advice of two anonymous reviewers. This is publication A 325 of the Uni Bjerknes Centre, N-5007 Bergen, Norway.
This research received no specific grant from any funding agency in the public, commercial, or not-for-profit sectors.