



Abstract
The impact of short-term climate anomalies and disturbances on past plant communities can be understood using high temporal or contiguous sedimentary pollen analysis. The response of pollen assemblages to decadal- to multidecadal-scale moisture variability was analyzed for the time intervals 3000–2200 and 1400–500 cal. yr BP. The hydroclimate and vegetation history for Minden Bog in southeastern Michigan were reconstructed using analyses of sedimentary testate amoebae and pollen. Results indicated that moisture anomalies accounted for 3% to 24% of the variation in arboreal pollen abundance for Fagus, Pinus, Quercus, and Tsuga. Betula pollen percentages did not appear to be affected by moisture variability. Given the longevity of these taxa, rapid arboreal pollen assemblage responses to moisture variability at decadal to multidecadal timescales were likely due to climate-induced changes in pollen productivity. Our data suggest that pollen–climate relationships may be counterintuitive at these fine temporal scales. For example, Tsuga pollen percentages generally increased during short-term dry events, in contrast to expected decreases in abundance with drying at millennial timescales based on empirical pollen–climate relationships. Results suggest caution should be used when inferring subdecadal to multidecadal climate variation from highly resolved pollen records. Rather, high-resolution pollen data may more accurately represent superimposed plant responses that are the composite of reproductive output nested within long-term plant community compositional changes in response to climatic variation.
Keywords
Introduction
Pollen records represent temporally and spatially nested information on past environmental and ecological processes. For example, pollen data may reflect temporal changes in regional forest composition as well as species-specific changes in reproductive allocation that occur in response to both long- and short-term climate variability (Andersen, 1980; Webb, 1986). On millennial timescales, past vegetation dynamics are assumed in paleoecology to be in approximate equilibrium with climate, so changes in pollen abundance can be interpreted as the individualistic responses of taxa to large-scale climate forcing (Bartlein et al., 1984, 1986; Nelson et al., 2006; Prentice et al., 1991; Shuman et al., 2004; Webb, 1986; Williams et al., 2001). On centennial timescales, pollen records may reflect population and community dynamics associated with high-frequency climate variation and secondary succession (Webb, 1986).
Although less often considered in paleoecology, pollen records with annual to decadal resolution also include processes related to reproductive allocation, perhaps initiated by taxon-specific responses to environmental stress, such as high-amplitude temperature and moisture variations or large-scale disturbance events such as fire that affect pollen loadings into a basin (Figure 1) (Andersen, 1980; Kamenik et al., 2009; Minckley and Shriver, 2011; Sjögren et al., 2006; Sugita et al., 1997; Webb, 1986). Understanding the effect of short-term responses of pollen production to climate variability on pollen records is important for paleoecology, particularly when linking to modern ecological studies, because it is on these fine temporal scales that physiological and demographic processes may overlap (Jackson et al., 2009). The effect of climate variations on pollen production is also conceptually different than what would be expected by disturbances (Minckley and Shriver, 2011). Disturbances can result in multidecadal compositional changes in pollen assemblages. For example, fires may change short-term vegetation composition through direct mortality and the differential recovery times of long- and short-lived taxa (e.g. trees versus forbs) (Minckley and Shriver, 2011). Yet, climate variations differ from disturbance in that mortality is not necessarily a direct outcome, particularly for long-lived organisms such as trees, unless that variation triggers mortality from other vectors such as insect outbreaks (e.g. Raffa et al., 2008).
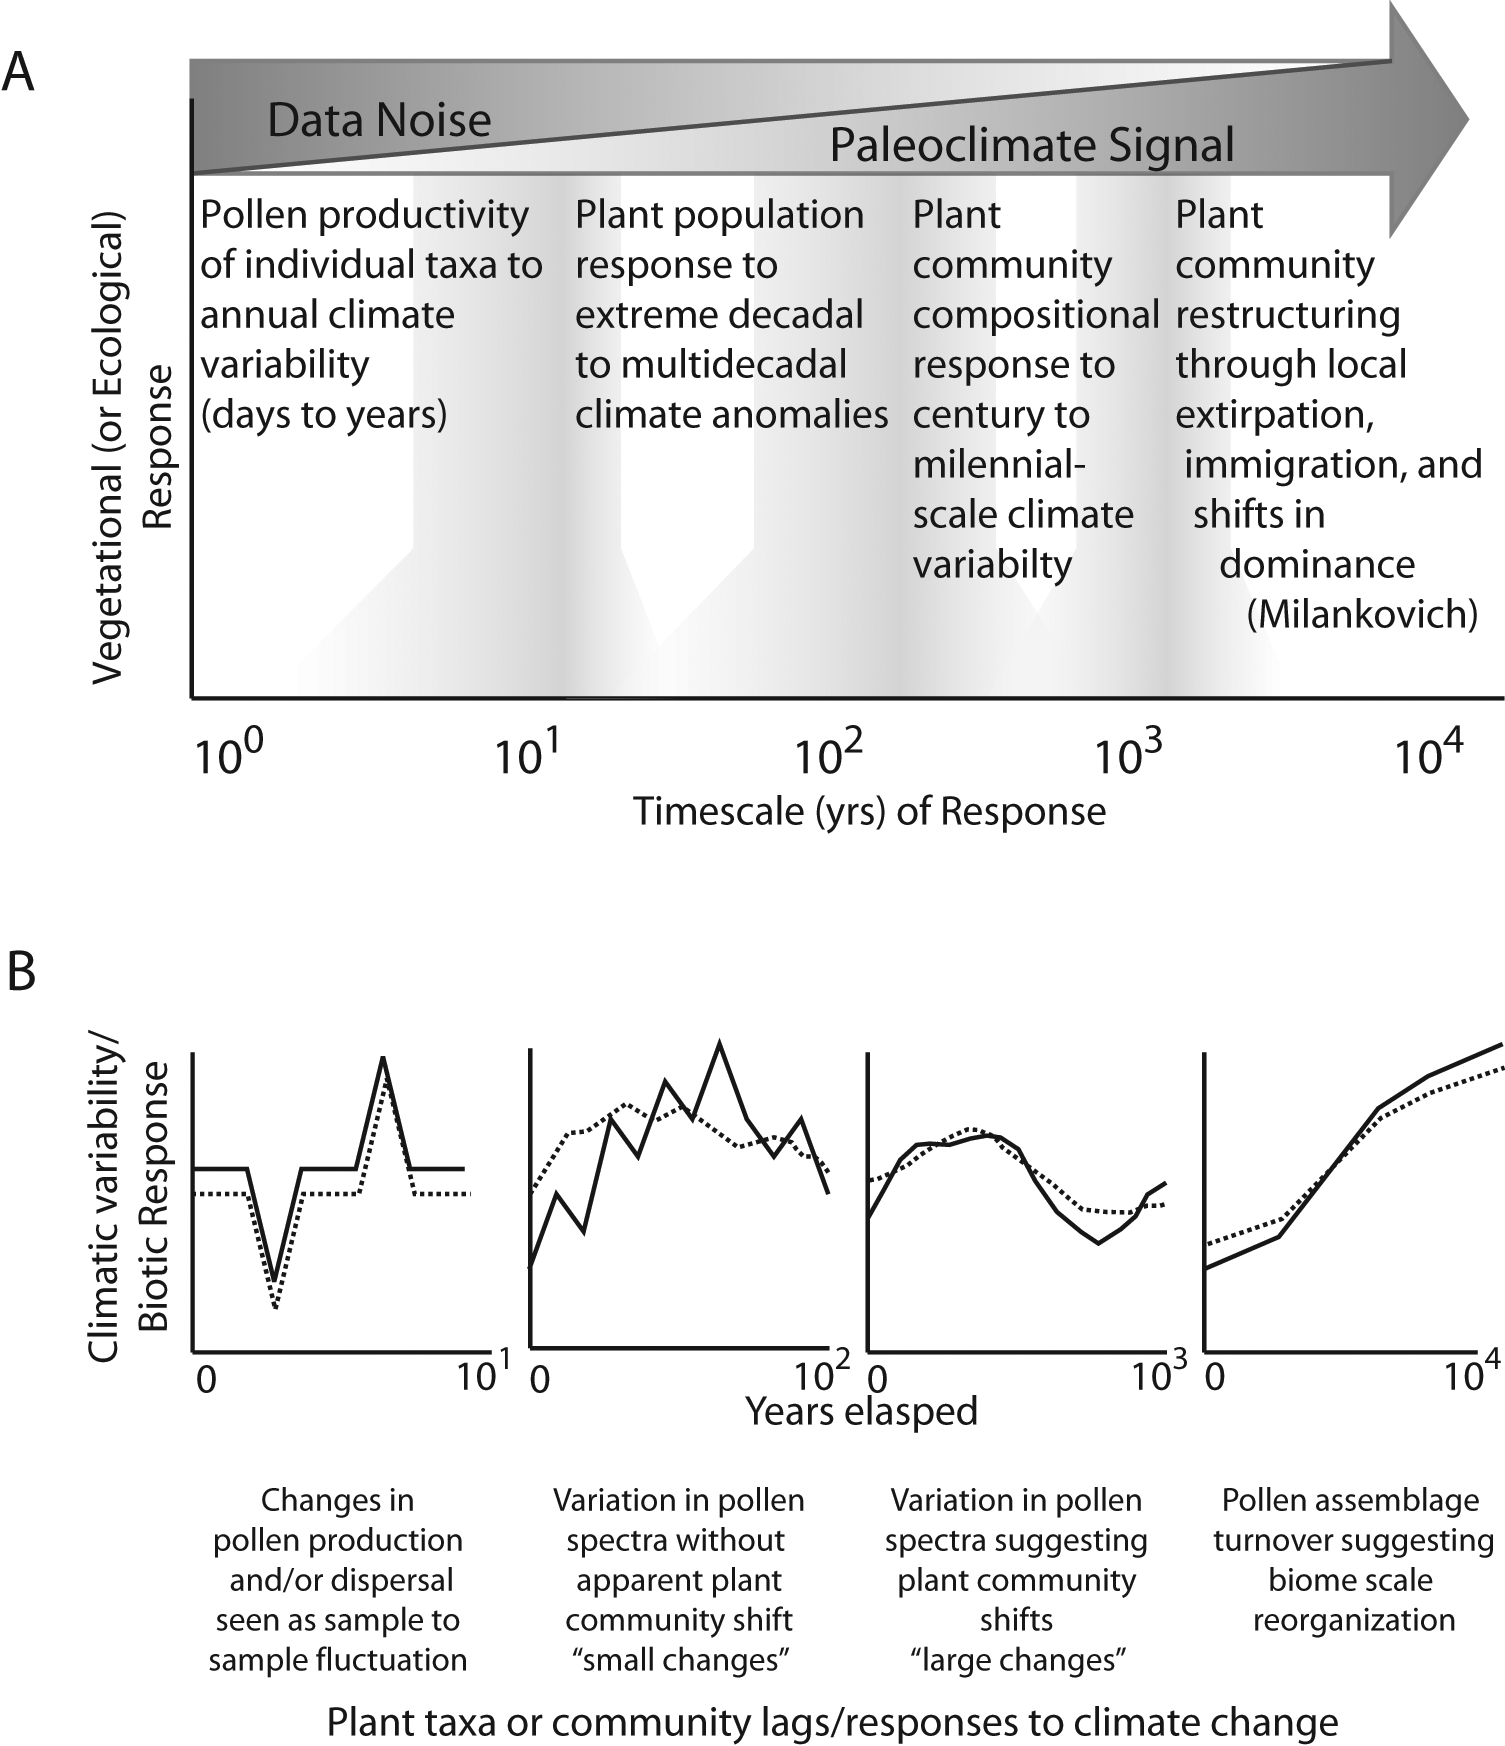
Scales of vegetation responses to climate variability and how those responses might be represented in pollen assemblage data is shown in this conceptual figure. Upper panel (A) illustrates potential ecosystem responses from daily (left) to millennial- (right) scale climate variations and how those responses might overlap. On shorter timescales these responses might be considered ‘noise’ in traditional paleoenvironmental interpretations. At longer timescales, plant population densities and community structures can change. Lower panel (B) illustrates how pollen taxa or assemblages may respond to scales of climate variability. Solid line represents ‘climate forcing’ and dashed line represents how a pollen taxa or assemblage might respond. On the shorter timescales (daily to annual) pollen responses might appear immediate. At decadal scales and above, lags in the pollen taxa responses may be more prominent
The individualistic response of pollen abundance being in equilibrium with climate has been a central tenet for millennial-scale paleoecological interpretations for nearly three decades (Bartlein et al., 1986; Huntley, 1991). However, climate-induced changes in reproductive allocations (i.e. higher or lower pollen output, masting events), though also individualistic, may not necessarily be similar to demographic responses within a taxon (see Andersen, 1980; Cariñanos et al., 2004; Sjögren et al., 2006; Webb, 1986). Thus, for a particular taxon, individuals might increase pollen productivity during a short-term, transient drought, while population density might decrease during a long-term, persistent drought spanning multiple generations. Pollen productivity of individual taxa may change based on specific environmental cues, such as seasonal variations in temperature or moisture availability (Andersen, 1980; Ashton et al., 1988; Cariñanos et al., 2004; Sjögren et al., 2006; Smith et al., 1990).
Pollen-productivity responses to annual and interannual climate variability also differs across species and genera (Andersen, 1980; Cariñanos et al., 2004; Hicks, 2001). For example, in the Swiss Jura Mountains Betula and Fagus pollen percentages show positive correlations to warm temperatures in the winter or fall proceeding the flowering season (Sjögren et al., 2006). Cariñanos et al. (2004) examined pollen influx over six years on the Iberian Peninsula and noted that differential pollen production in tree species was related to temporal variations in the distribution of precipitation, soil moisture content and temperature. For example, Quercus pollen production was lower during the drought years 1995 and 1996, and increased as ‘normal’ precipitation regimes returned between 1997 and 2000. In regions where moisture is not limited, variations in pollen productivity may be associated with previous growing-season temperatures (Andersen, 1980; Hicks, 2001).
Additional considerations for wind-pollinated taxa are that changes in pollen productivity are related to the fecundity of individual species (Jackson, 1994; Mooney et al., 2011; Smith et al., 1990). Pollen masting may be a reproductive strategy that limits selfing while maximizing the probability of out-crossing within plant populations (Houle, 1999; Mooney et al., 2011; Smith et al., 1990). However, pollen masting could be analogous to seed masting, which may be contingent on climatic conditions, and may also be synchronous among multiple wind-pollinated tree taxa (Houle, 1999). What is less known is how pollen production varies in direct response to environmental stress (e.g. Cariñanos et al. 2004; Mooney et al., 2011). Using the example of the Iberian Quercus, pollen production was reduced during dry conditions, yet other taxa responded to the same stress by increasing their reproductive output (Cariñanos et al., 2004; Houle, 1999; Smith et al., 1990; van der Knaap et al., 2010).
This means that pollen productivity within taxa (and individuals) can be different when comparing short-term (i.e. annual to decadal) climate events to long-term (multidecadal to millennial) climate forcings (Figure 1) (van der Knaap et al., 2010). An example of this difference could be a drought-induced, short-term increase in pollen abundance of a mesic species. Such annual to decadal variations in pollen records may be part of the ‘noise’ in the context of centennial to millennial interpretations, which would be more representative of plant-community population dynamics (Heiri et al., 2006; Webb, 1986).
With renewed interest in high temporal resolution, or contiguous analysis of sedimentary records, we need to better understand the response of pollen records to disturbance and short-term drought (Booth and Jackson, 2003; Green, 1983; Minckley and Shriver, 2011; Whitlock and Larsen, 2001). Recent work by Joosten and de Klerk (2007) suggests that the lowest temporal resolution for most sedimentary pollen analysis is likely subdecadal (exclusive of varved materials). Identifications of pollen assemblage responses are dependent on the resolution of the analysis (i.e. sampling frequency), with the finest scale patterns (subdecadal) not identifiable without contiguous sampling because of intrinsic sample to sample variability of pollen assemblages (Joosten and de Klerk, 2007). The issues faced in studying fine temporal-scale vegetation changes based on pollen analysis are twofold. (1) Our interpretive framework is centered on multidecadal to millennial timescales where questions revolve around population mortality and recruitment (e.g. plant population size), how those processes affect the pollen abundance in sediments, and the climate forcings that drive changes in pollen abundance (Bartlein et al., 1986; Heiri et al., 2006; Webb, 1986); and (2) on annual to multidecadal timescales, consideration needs to be given to the responses of individual taxa to biotic and abiotic environmental stressors that potentially change their pollen productivity (Hicks, 2001).
To examine potential climatic controls on pollen assemblage changes at annual to multidecadal timescales, independent proxy data are needed to avoid the circularity of using a vegetation history as both the record of climate change and vegetation response (Green, 1983). Ombrotrophic bogs provide good systems for such a study, containing both pollen for examining vegetation history and proxies such as testate amoebae for understanding moisture availability in the past (Booth, 2008; Booth et al., 2006). In addition, these environments often have fast accumulation rates with minimal bioturbation, providing sensitive records of environmental change down to subdecadal resolution (Joosten and de Klerk, 2007).
The paleoecological and paleohydrological records from Minden Bog, MI, provide an opportunity to compare fine temporal-scale variations of vegetation dynamics with an independent record of climate change (Booth et al., 2006). For this study, we selected two time intervals, 3000 to 2200 and 1400 to 500 cal. yr BP (all ages are expressed in cal. yr BP (1950 base) unless otherwise noted), to assess vegetation responses to short-term (<100 yr) drought using high temporal resolution pollen analysis (Figure 2). These two time periods were selected because earlier studies indicated they contained numerous high magnitude, decadal to centennial hydrologic fluctuations (Figures 2, 3). Our goals were to test the following hypotheses:
there is a rapid and individualistic response by major tree taxa to high-amplitude moisture anomalies at subdecadal to multidecadal timescales that is recorded in sedimentary pollen records; and
the rapid response of pollen production for individual tree taxa to moisture variability is not affected by long-term climate trends (i.e. pollen productivity responses are caused by short-term climate variations).
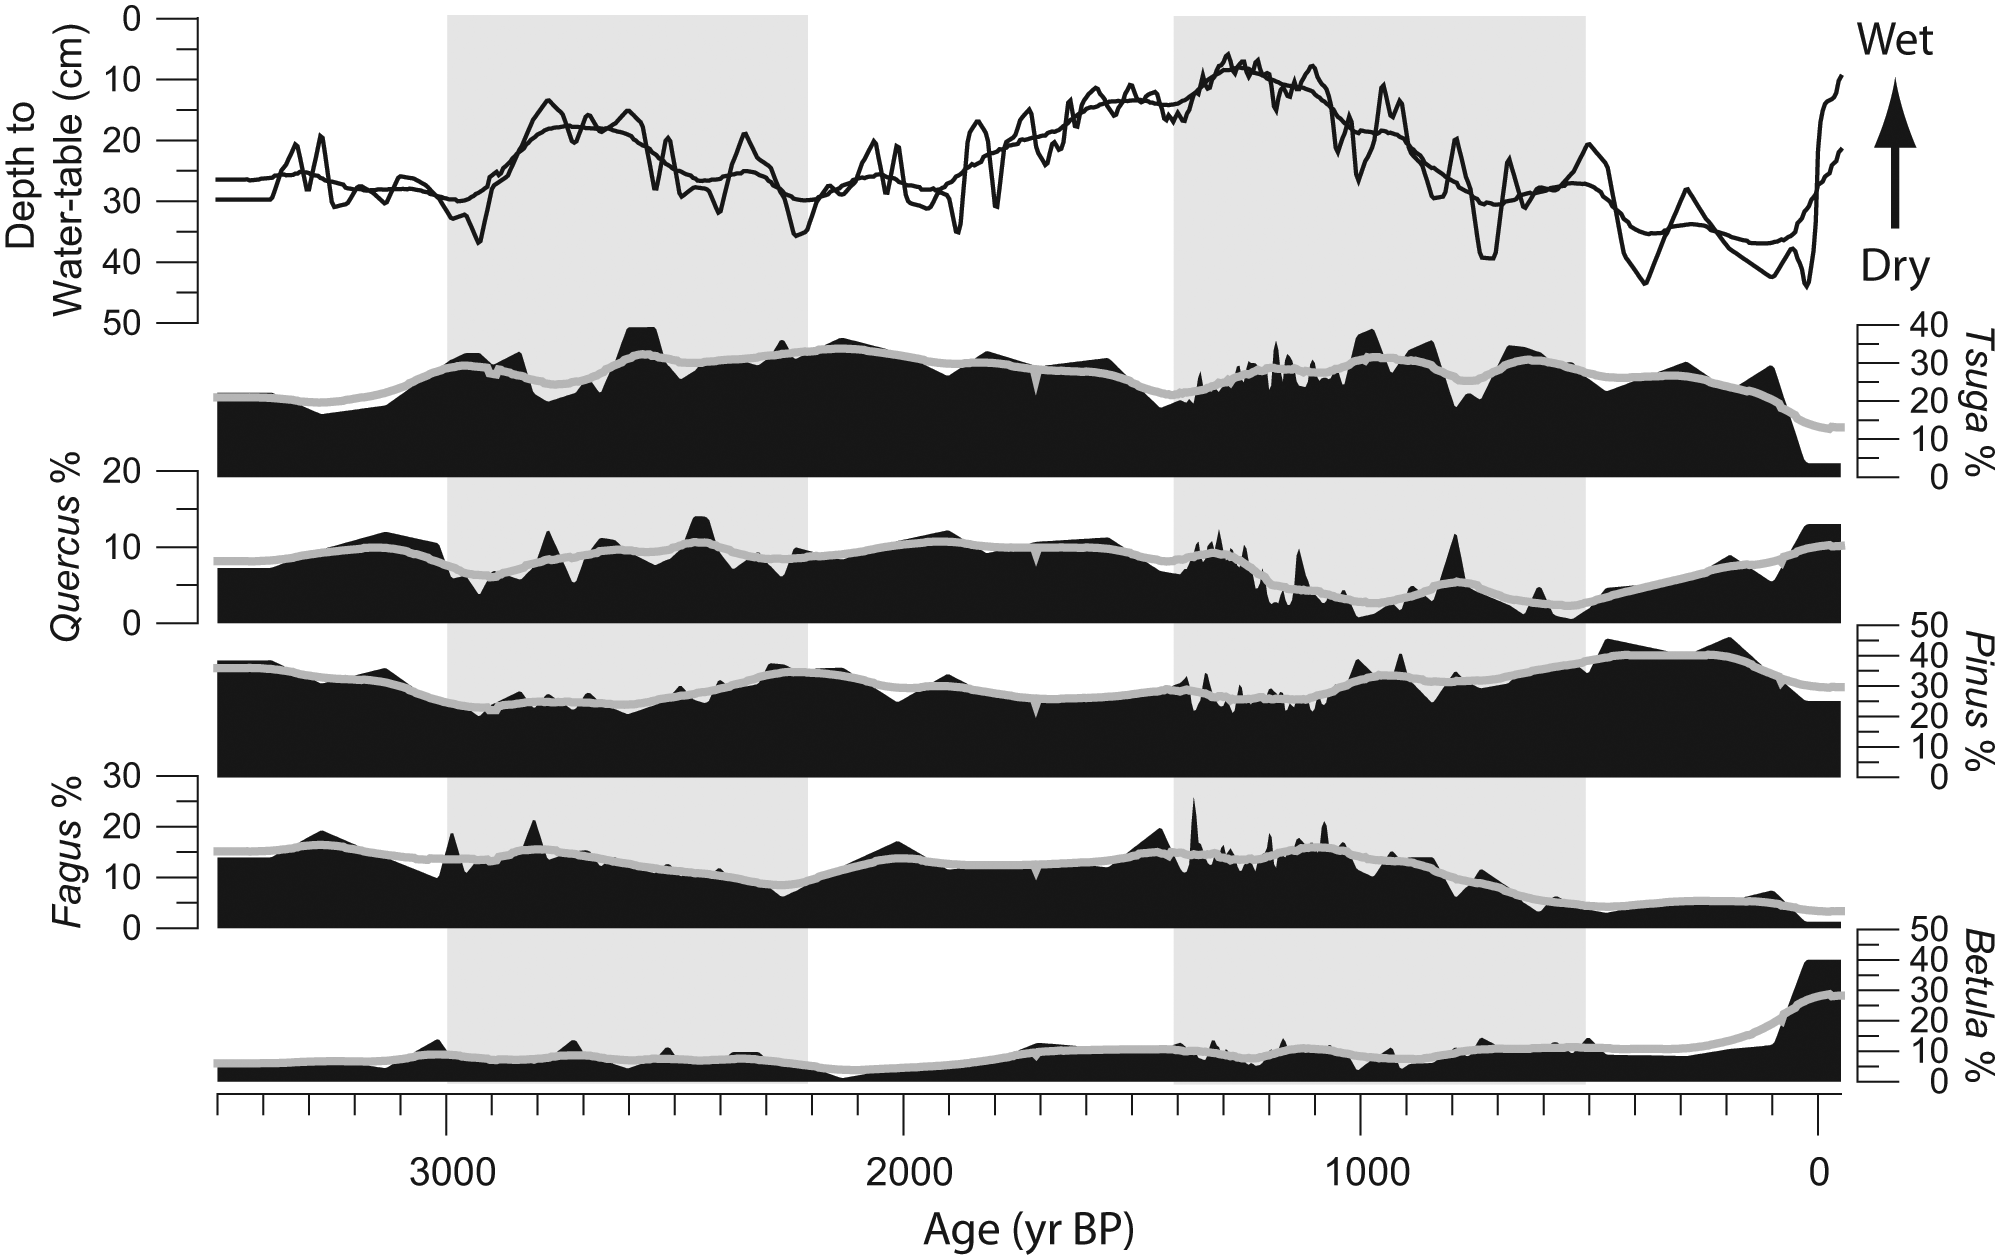
Paleohydrology and vegetation history of Minden Bog for the past 3500 years. Depth to water-table (top) is based on testate amoebae transfer function (modified from Booth and Jackson, 2003). Pollen percentage data for select taxa are also shown (independently scaled). The hydrologic record is dominated by decadal-scale variations overlying centennial-scale trends (smoothed line). Actual and smoothed pollen percentage data illustrate immediate (short-term) and lagged (long-term) trends of plant community composition to hydrologic variability. Grey boxes indicate intervals analyzed in this study

Time series of 3000–2200 and 1400–500 yr BP of hydrologic variations (depth to water-table) compared with pollen percentage changes for selected arboreal taxa. Shown are variations in depth to water-table (top) and pollen percentages plotted over the 100-year interpolated mean. Drought periods (vertical bars) were identified as 0.5 and 1 s.d. from the 100 year mean of depth to water-table, which are overlain on each other. Vertical bar saturation intensity indicates the ranges of the 0.5 and 1 s.d. variations for each drought
We focus on arboreal pollen types because they represent long-lived taxa that comprise the dominant regional vegetation most likely to survive short-term climate extremes.
Site description
Minden Bog (43.6119°N, 82.8361°W) represents one of the last remaining ombrotrophic bogs in Michigan. This raised-bog complex currently covers an estimated 8600 ha and was likely much larger prior to EuroAmerican settlement (Booth and Jackson, 2003). Peat thickness in the middle of the bog is at least 7.5 m, decreasing in thickness towards the edges. Vegetation on the bog includes low-growing shrubs (Chamaedaphne calyculata, Kalmia polifolia), widely scattered trees (Larix laricina, Pinus banksiana, Betula papyrifera), and groundcover dominated by Sphagnum and sedges. Most of the land area surrounding Minden Bog is presently used for agriculture, but prior to EuroAmerican settlement supported a mixed deciduous and conifer forest dominated by birch (B. papyrifera, B. allegheniensis), oak (Quercus rubra), beech (Fagus grandifolia), hemlock (Tsuga canadensis), and pine (Pinus strobus, P. banksiana).
Previous analysis of the vegetation history of Minden Bog indicates a four part environmental history for the past 3450 years (Booth and Jackson, 2003). Betula, Fagus, Pinus subgenus Pinus, Pinus subgenus Strobus, Tsuga, Quercus and Ulmus dominated the regional arboreal pollen prior to European settlement. However, Fagus pollen abundance was lower from 900 to 100 yr BP. Evidence of anthropogenic disturbance after 100 yr BP includes increased pollen from plants characteristic of disturbed habitats (e.g. Ambrosia, Poaceae, Amaranthaceae, Plantago lanceolata). Locally, spruce grew on the bog surface based on abundant Picea pollen, needles, seeds and stomata until 100 yr BP (Booth and Jackson, 2003).
Methods
The surface-moisture history of Minden Bog has been extensively studied using a range of proxies, including testate amoebae, humification, organic biomarkers, and stable isotopes (Booth and Jackson, 2003; Booth et al., 2004, 2006; Nichols et al., 2006, 2010; Taylor, 2008). Although these proxies reveal coherent patterns of subcentennial-scale moisture variability during the late Holocene, we focus on moisture variations inferred from testate amoebae, because testate amoebae provide a quantitative and well-validated reconstruction of depth to water-table associated with regional water balance from this site and others in the region (Booth, 2010; Booth et al., 2006; Tweiten et al., 2009) (Figure 2).
Pollen analysis was performed on the same samples prepared for previous testate amoeba analyses of Minden Bog, with no additional processing (Booth et al., 2006). Contiguous or nearly contiguous 1 cm3 samples were examined spanning the time intervals 3000–2200 and 1400–500 yr BP. This sampling strategy yielded a temporal resolution ranging from 4 to 60 yr between samples, with each sample representing 4 to 38 years of deposition. The varying sedimentation rates also allowed us to examine how potential transient pollen responses to moisture variability may be dampened with greater time-averaging (i.e. slower sedimentation rates).
Pollen samples were counted to a minimum sum of 300 terrestrial grains. However, pollen percentages were calculated using the arboreal sum (median 266, max. 465, min. 94) excluding Picea and Larix, which historically grew directly on the bog surface (Booth and Jackson, 2003). Arboreal pollen dominated most counts, but 8 of 100 samples examined had arboreal pollen counts below 150 total grains. For our analysis we focus on Betula, Fagus, Pinus, Quercus, and Tsuga because previous work showed that these represented major taxa surrounding Minden Bog prior to European settlement (Booth and Jackson, 2003). Pollen influx was also calculated for all pollen taxa identified. 100 yr weighted means were calculated for the selected arboreal pollen taxa to show transient responses in the record and to illustrate centennial-scale trends in the data over the two time intervals of interest (Figure 2).
Our approach for separating the long- and short-term pollen variations is similar to that used to determine background levels in sedimentary charcoal analysis allowing for separation of long-term trends and short-term variations in time series data sets (Higuera et al., 2010; Long et al., 1998). The 100 yr weighted mean was used because this time span represented ~10× the median sedimentation rate (9.4 yr/cm) in the period 1400 to 500 yr BP and would capture potential (>50 yr) lagged responses based on the conceptual and modeled framework for past forest dynamics (Davis and Botkin, 1985; Green, 1983; Lertzman, 1995; Webb, 1986). Deviations from the 100 yr weighted mean were used to determine individualistic responses of selected taxa to drought events as identified from the independent testate amoeba record.
For this study, depth to water-table (DWT) inferred from testate amoebae assemblages was used to define drought intervals. Testate amoebae assemblages were analyzed from contiguous samples from the Minden Bog core (Booth and Jackson, 2003; Booth et al., 2006). Droughts were identified as those intervals that exceeded 1.0 and 0.5 standard deviations (s.d.) of the variance about the 100 yr weighted mean DWT. This approach allowed for drought periods to be differentiated from transient or low-amplitude hydrological fluctuations (i.e. noise within the testate amoebae data) and accommodate uncertainties about the sensitivity of testate amoeba data (Booth, 2008). This approach differs from that used in Booth and Jackson (2003) where hydrologic changes were identified as deviation from the long-term mean of the entire time series. We defined droughts as those time intervals when the DWT exceeded our negative standard deviation criteria. Individual observations were composited to compare differences in pollen abundance from drought and non-drought periods (Figure 4).
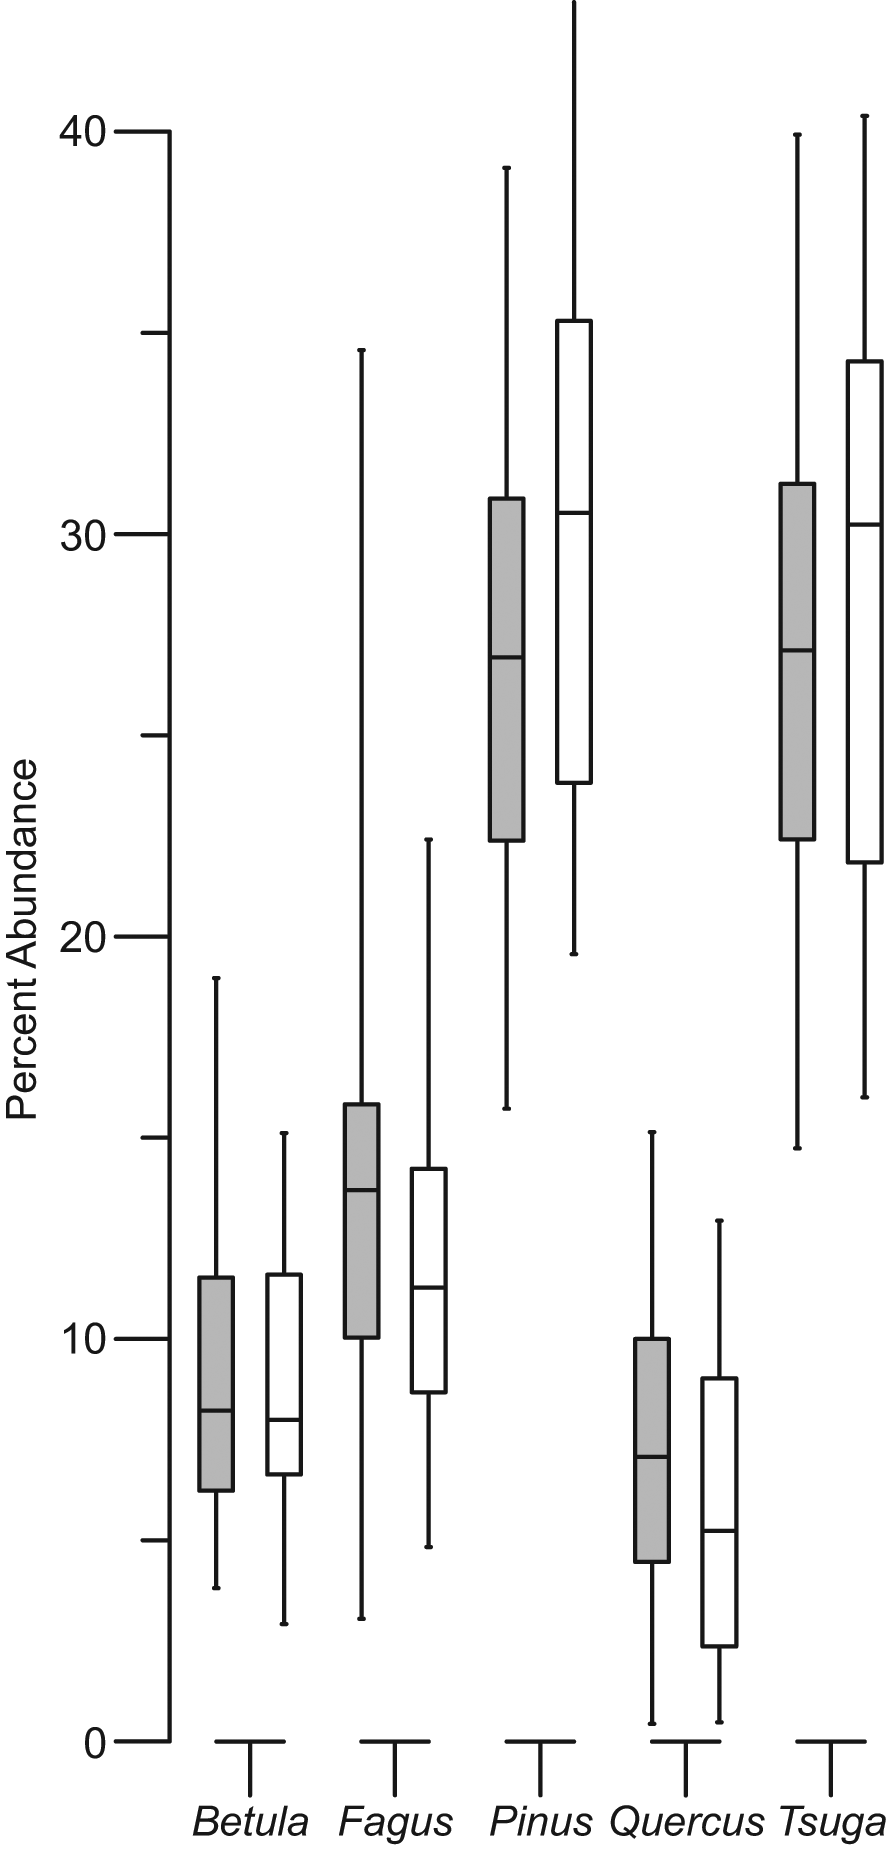
Boxplot comparison of the composite pollen percentages from all non-drought (grey) and drought (white) periods for selected arboreal taxa. Shown are the median, 25th and 75th percentiles within each box and whiskers indicating the range of pollen percentages. The differences between non-drought and drought pollen abundances are not statistically different; however the sign of change is consistent in the median and interquartile changes for Fagus, Pinus, and Quercus. Tsuga pollen percentages have greater variance during drought intervals. Betula percentages show no significant trend
The two time periods examined had different and varying sedimentation rates (~27–30 and 4–38 years/cm, respectively), requiring evaluation of whether the relationships between pollen assemblages and hydroclimate proxies could be compared given differences in temporal resolutions of the data. Linear regression of pollen abundance to DWT was used to assess comparability of the two time intervals; because periods of slower sediment accumulation would have greater time averaging that would dampen transient responses in the pollen assemblages. Linear regressions also help in examining immediate individual responses of pollen taxa to moisture anomalies (Figure 5), and were used to estimate the variance in pollen percentages attributable to moisture availability.

Regression analysis of depth to water-table to pollen percentages for select taxa for the time intervals 3000 to 2200 (△; dashed line) and 1400 to 500 yr BP (0; solid line). These data indicate the relationship between percent pollen abundance and water-table depth are similar between 3000 and 2200, and 1400 and 500 yr BP, based on the 95% confidence interval (shaded region about each regression), despite differences in sedimentation rates. In addition, the pollen abundance of Fagus, Pinus, Quercus, and Tsuga have significant linear relationships with changes in hydrology during both time intervals. Betula pollen abundance does not appear to have any relationship with the hydrologic variables in either time interval
Pollen influx calculations were assessed in a similar manner. There was a strong relationship between shallow DWT and increased pollen accumulation rates (not shown). However, pollen influx data are noisier than percentage data and sensitive to changes in sedimentation rate (van der Knaap et al., 2010). Pollen influx varied by nearly an order of magnitude over the length of the Minden Bog record making the data from each of these time intervals incomparable, so we did not continue analysis with the influx data.
Results
Trends within time intervals
3000–2200 yr BP
The interval 3000 to 2200 yr BP was characterized by a short-term moisture increase from 3000 to 2740 yr BP. From 2740 to 2200 yr BP, DWT decreased, indicating a general drying of Minden Bog (Figures 2, 3). Five short-term drought events were identified between 3000 and 2200 yr BP using the 1.0 s.d. criterion, while the 0.5 s.d. criterion identified six drought events (Figure 3).
Trends in selected arboreal taxa between 3000 and 2200 yr BP show a long-term pattern of increasing Tsuga while DWT was decreasing (Figure 3). Tsuga pollen percentages rose from their 100 yr weighted average low of 24% at ~2750 yr BP, to an average high of 33% toward the end of this period. Similarly, Quercus and Pinus pollen percentages generally increased during this time. Quercus increased from an average low of 6% ~2900 yr BP, to 9% by 2200 yr BP (Figure 3). Pinus increased from its low of 22% to 34%, over the same time interval. While Tsuga, Quercus, and Pinus pollen percentages generally increased with lower moisture availability, Fagus and Betula pollen percentages generally declined. Fagus pollen percentages were on average highest (~16%) ~2800 yr BP, decreasing to 10% by 2200 yr BP, while Betula pollen percentages peaked around 9% 50–100 years later, decreasing to 4% by the end of this period (Figure 3).
1400–500 yr BP
The interval 1400 to 500 yr BP was characterized by a long-term decrease in DWT starting ~1300 yr BP, suggesting a long-term drying trend (Figure 3). However, this long-term trend should be viewed with some caution given that autogenic developmental processes of ombrotrophic bogs may play a greater role at millennial timescales (see Charman et al., 2006). Further, pollen influx was higher (>800 000 grains/cm2 per yr) between 1300 and 1200 yr BP than the rest of the record (generally >200 000 grains/cm2 per yr). Five short-term drought events were identified for the interval 1400 to 500 yr BP using the 1.0 s.d. criterion, while six droughts were identified using the 0.5 s.d. criterion (Figure 3).
Tsuga pollen percentages generally increased between 1400 and 500 yr BP (Figure 3). From 1400 to 950 yr BP, average Tsuga abundances increased from 22% to 32%. Tsuga declined from the peak at 950 yr BP to 25% by 750 yr BP, increasing again to an average 31% by 600 yr BP. At 500 yr BP, Tsuga averaged 27% of the total arboreal assemblage (Figure 3). The long-term trend of Quercus pollen abundance mirrored Tsuga pollen percentages, declining from an average 9% ~1300 yr BP to 3% by 500 yr BP. Pinus pollen percentages were relatively stable (26–29%) until ~1050 yr BP, when they began to increase, reaching an average maximum of 38% by 500 yr BP (Figure 3). Fagus pollen percentages also showed relative stability until ~975 yr BP, after which Fagus pollen percentages began decreasing to 4% by 500 yr BP. Betula pollen percentages, in contrast to the other arboreal taxa, appeared relatively stable for the interval 1400 to 500 yr BP, averaging 10% (max. 11%, min. 7%) (Figure 3).
Pollen response to moisture availability
Examination of responses of arboreal pollen taxa to moisture availability allowed for a sensitivity test of pollen percentage data to moisture anomalies within and between the two different time intervals (Figures 4, 5). Of the five taxa examined, Betula was the only pollen type that showed no change between drought and non-drought samples (Figure 4) with no significant relationship to DWT (Figure 5, Table 1). Boxplot comparisons of pollen percentages from the other four taxa suggest that there is not a statistically significant difference between drought and non-drought pollen percentages (Figure 4). However, there are statistically significant trends in pollen abundance relative to DWT. For example, Fagus and Quercus pollen abundances were higher with low DWT. For the time period 3000 to 2200 yr BP, this relationship was not significant for either taxon. However, between 1400 and 500 yr BP, changes in DWT accounted for 15.8% (p<0.001) and 23.5% (p<0.00001) of the variance in Fagus and Quercus pollen percentages, respectively (Figure 5, Table 1).
Summary statistics of regression analysis of depth to water table to pollen percentages (Figure 5) for the time intervals 3000 to 2200 and 1400 to 500 yr BP
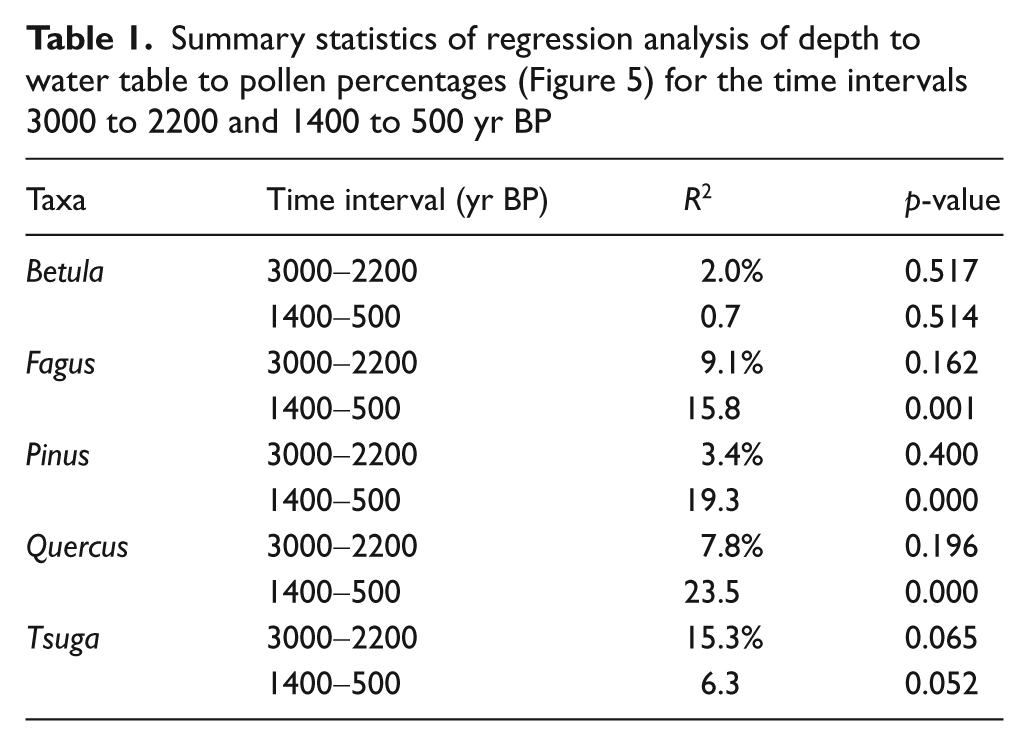
The two most abundant pollen types, Pinus and Tsuga, had mixed results between time intervals (Figure 5). Pinus pollen percentages were not significantly correlated with changes in DWT for the interval 3000 to 2200 yr BP. Between 1400 and 500 yr BP, Pinus pollen percentages were significantly correlated with DWT, accounting for 19.3% (p<0.001) of the variance. With respect to Tsuga, DWT was positively correlated with Tsuga pollen abundance between 3000 and 2200 yr BP, accounting for 15.3% (p<0.065) of the variance. For the interval 1400 to 500 yr BP, DWT was significantly correlated (p<0.052) with Tsuga pollen abundance, representing 6.3% of the variance.
Discussion
Pollen analysis has provided a wealth of information about the response of plant communities and ecosystems to long-term climate forcing at centennial to millennial timescales, but relatively little information on decadal and subcentennial timescales (Figures 1, 2).
Pollen assemblages and moisture availability
Variations in pollen production can arise from numerous biotic and abiotic interactions, including pathogens, predation, disturbance, temperature, and rainfall. In our study, we observed that relative pollen-abundance responses to moisture anomalies are consistent in periods with different antecedent effective moisture conditions (Figures 4, 5). In the case of high-amplitude, annual to multidecadal drought, only Betula pollen percentages appeared to have no significant relationship with moisture anomalies (Figures 4, 5). This might be because the two dominant Betula species contributing to this pollen type (B. papyrifera, B. allegheniensis) may have opposite responses to moisture variability, effectively cancelling out the response. However, for other taxa examined, these changes potentially account for 3% to 24% of pollen-abundance variations of the individual pollen types (Figure 5, Table 1). This is despite two of these pollen types, Pinus and Quercus, having three to seven different species contributing to their total pollen abundances. That major arboreal pollen types respond to moisture availability suggests that annual to multidecadal moisture anomalies can play an important role in pollen records, similar to other physical disturbance regimes (e.g. fire) (Clark, 1990; Minckley and Shriver, 2011; Shuman et al., 2004; Whitlock and Larsen, 2001). However, unlike disturbances that can result in immediate mortality, pollen-assemblage changes in response to transient drought include individualistic differences in relative pollen production in response to environmental stress (i.e. pollen productivity varies while the constituent tree populations remain constant) (Andersen, 1980; Cariñanos et al., 2004; Green, 1983; Hicks, 2001; Houle, 1999; Mooney et al., 2011; Sjögren et al., 2006; van der Knaap et al., 2010).
On annual to decadal timescales, pollen records may reveal aspects of the reproductive allocation of taxa in response to a varying climate (Figure 1). In this case, changes in pollen productivity might result in inaccurate interpretations of climatic conditions, while still representing an individualistic, organismal-level response by species to high-amplitude moisture anomalies. As an example, in eastern North America, the modern climate space for Betula is drier than Tsuga at the genus level (Williams et al., 2006). Yet, the application of the testate amoebae record as an independent measure of local hydrology reveals a potential inverse relationship between the abundance of these taxa and climatic conditions. While the climate space of these taxa do overlap (Williams et al., 2006) our results suggest caution when interpreting contiguous, annual to multidecadal resolved pollen data.
The Minden Bog record illustrates the rapidity with which pollen assemblages can respond to moisture anomalies, which is faster than what would be expected for demographic changes. Most drought events presented in our study are characterized by one or two pollen samples (Figure 3), which are consistently followed by a return to pre-drought abundances. Pollen assemblage changes indicate sample-to-sample variability that cannot be explained by turnover and succession within the forest surrounding Minden Bog. Rather, assemblage changes are consistent with relative differences in short-term pollen output that do not alter the long-term trajectory within this ecosystem (Figures 3, 4). However, because drought events are deviations from the long-term climate trends, changes in a pollen assemblage will be modulated by antecedent climate conditions.
Demographic and community changes
Environmental changes drive compositional changes in plant communities through mortality, migration, and replacement or recruitment of constituent species (Figure 1). Changes in demography can be immediate, but are often reflected as a lagged response to climate at multidecadal to centennial timescales as different age classes have different physiological tolerances to climatic extremes (Figures 2, 3) (Davis and Botkin, 1985; Jackson et al., 2009; Lertzman, 1995; Webb, 1986). Also, direct mortality is not necessarily an outcome of prolonged or severe climate events. As climate-induced changes in pollen productivity are incorporated in the sedimentary record, there is an additional delay in recording environmental changes because of the differential survivorship of individuals that produce pollen and the incorporation of that pollen into sediments.
When incorporated in the sedimentary record, annual pollen influx is averaged by a number of depositional processes, including the time-averaging within an individual sample (Figure 3, panel B). A reasonable expectation might be that short-term climate fluctuations (e.g. multidecadal drought) would result in changes in pollen assemblages based on our conceptual model (Figure 1). This change would occur regardless of sedimentation rates given sufficiently strong pollen-production response to the moisture stress (Figures 4, 5). During periods of slower sedimentation rates any such signal would certainly be dampened because of time averaging and subsequent reproductive recovery as conditions return to the long-term mean climatic state. Paleoecological interpretations of single sample pollen abundance changes are typically not made, particularly in millennial-scale studies. This is because on long temporal scales, sample-to-sample variations are intuitively the intrinsic error generated in the development of a fossil pollen time series (Figure 1) (Webb, 1986).
Sample-to-sample variability, however, becomes important in understanding short-term dynamics, because it represents changes in the reproductive allocation of individual plants within the community in response to discrete events, rather than long-term climate (Figures 1, 4, 5). In the case of the Minden Bog record, changes in the arboreal pollen assemblage are initiated, in part, by short-term drought events (Figure 5). Comparing trends of pollen percentages between the time intervals 3000–2000 and 1400–500 yr BP to the hydrologic variations reveals inconsistencies between the pollen responses to these anomalies, which suggests that other factors contribute to the background noise of these time intervals (e.g. factors contributing to lower sedimentation rates) (Figure 5). For example, in comparison to the later time interval, the period between 3000 and 2200 yr BP has less hydrological variability as recorded by DWT but lower sedimentation rates as well (Figure 3). The slower sedimentation rates during this period may result in a dampening in the expression of the immediate pollen production response of the surrounding forest to environmental stressors as discussed above (Figure 1).
Sedimentary records and the proxies contained therein are by their nature integrators of the environments they represent. Data are subject to time-averaging caused by low sedimentation rates and bioturbation, limiting our ability to assess such things as seasonal signals of temperature and precipitation that may be most important to individual taxa (Joosten and de Klerk, 2007). Some estimates based on pollen abundances related to environmental factors, such as annual temperature, minimum and maximum temperatures, growing season length, and precipitation have been useful for climatic reconstructions (Minckley et al., 2008; Whitmore et al., 2005; Williams et al., 2006). In this study, we have shown that short-term hydrologic fluctuations may explain up to 20% of the variance of individual taxa observed in a pollen series (Figure 5, Table 1). The remaining 80% must incorporate long-term trends that change the composition of pollen data (Figure 3), temporal changes in pollen source area, and various sources of error.
In summary, identified droughts and long-term hydroclimate history have cumulative effects and affect forest composition on decadal to centennial timescales (Figures 2, 3). Our analysis suggests that there is also an immediate response in pollen assemblages to short-term, high-amplitude drought events (Figures 1, 4, 5). Recovery or a return to pre-drought pollen abundances can be equally rapid (Figure 3). However, these rapid events are superimposed on long-term changes in community composition that represent the cumulative effects of environmental change or stress, as seen in the progressive decline of Fagus during the prolonged drying between 3000 and 2200, and 1400 and 500 yr BP (Figures 2, 3). These long-term changes in community composition are likely conditioned by the droughts identified here, but would represent senescence and establishment processes that are happening at different temporal scales than those discussed in our study (Figure 1) (Booth and Jackson, 2003). Long-term compositional changes observed in the pollen assemblage at Minden Bog likely represent changes in forest demography lagging hydrological variations on the scale of 50 to 100 years (Figures 1, 3), consistent with Webb’s (1986) ‘immediate’ vegetation response to climate forcing (Booth and Jackson, 2003).
Conclusions
Comparison of a pollen sequence with an independent proxy of moisture availability (depth to water-table), has allowed an examination of the response of Upper Midwest forests to high-amplitude moisture anomalies. The response of individual taxa pollen abundance to climate variability operates on multiple temporal scales. On short timescales (years to decades), the individualistic response may consist of changes in reproductive allocation caused by environmental stress, expressed as increases or decreases in pollen production, without changes in vegetation community composition. This is in contrast to pollen assemblage changes observed at millennial timescales where climate and vegetation may approach equilibrium. Short-term pollen assemblage changes may also be effected by antecedent conditions based on centennial-scale climatic trends. In other words, drought anomalies during prolonged wet periods may not result in the same pollen assemblage changes as drought anomalies during prolonged dry periods. The difference in response based on antecedent conditions is likely related to the immediate response in pollen productivity of individual taxa to an environmental stressor such as drought.
Footnotes
Acknowledgements
We thank S. Brewer, B. Shuman, J. Shinker and M. Lesser and two anonymous reviewers for their comments and suggestions on the manuscript.
This research was supported by the National Science Foundation (DEB-0345012, ESH-0402660, and EPS-0447681).