
Abstract
The Arctic has undergone significant changes in the last 20–30 years. The understanding of these changes is limited by the time span or resolution of existing climate records. The main gateway of heat to the Arctic Ocean is the Fram Strait, between Greenland and Svalbard. We have reconstructed past air and sea surface temperatures and relative variations in freshwater extent in a marine core from eastern Fram Strait which spans the last 2000 years. The results show a progressive increase in air temperature and a decrease in the upper mixed water layer temperature, together with an increase in freshwater content during the last 1000 years. Considering the oceanographic features of the eastern Fram Strait, these results suggest that there might have been a progressive increase in the inflow of Atlantic water during the last 1000 years, accompanied by an increase in atmospheric heat transport, causing progressive sea-ice melting and subsequent cooling and freshening of the upper mixed water layer in this area. We suggest that our data show long-scale average changes in the modes of positive and negative Arctic multidecadal variability over the last 2000 years.
Keywords
Introduction
Average air temperatures have increased faster in the Arctic than in the rest of the world during the last 100 years (Chylek et al., 2009), which makes the region one of the world’s most sensitive areas to climate change. This has been partly attributed to the ice/snow albedo-temperature feedback (Intergovernmental Panel on Climate Change (IPCC), 2007). The Arctic sea-ice cover and extent has been thinning and retreating pronouncedly in the last three decades, coinciding with the average warming (Polyak et al., 2010). Most of the heat and mass exchange between the North Atlantic and the Arctic Ocean occur through the Fram Strait (Aagaard and Greisman, 1975). Warm, salty Atlantic water enters the strait heading north carried by the West Spitsbergen Current, while a large part of Arctic low-salinity upper ocean water and sea ice drains southwards with the East Greenland Current (Figure 1). This export of freshwater is important because it influences the stratification of the water column in sensitive deep water formation regions and the strength of the Atlantic meridional overturning circulation (Holland et al., 2001). From direct observations and modelling it has become apparent that the mean balance of freshwater in the polar and sub-polar oceans and the inflow of Atlantic water to the Arctic are highly variable in seasonal, decadal and interdecadal scales (Dukhovskoy et al., 2004; Polyakov et al., 2004). This variability may be partly attributed to large amplitude multidecadal fluctuations as the variable impacts of the North Atlantic Oscillation (NAO; Hurrell, 1995), the Arctic Oscillation (AO; Thompson and Wallace, 1998) or the Arctic Ocean Oscillation (AOO; Proshutinsky and Johnson, 1997). An increase in freshwater export from the Arctic (Blindheim et al., 2000; Jahn et al., 2010) and decreases in salinity and sea-ice extent in the sub-polar North Atlantic and the Arctic (Curry et al., 2003) have been observed over the past decades. Those trends seem to be related to the NAO amplification since the 1960s. Enhanced trade winds, higher net precipitation and continental ice melting, for example, result in enhanced export of ice and freshwater from the Arctic (Curry et al., 2003). This freshwater export can spread eastwards over the Norwegian Sea causing a freshening and cooling of the upper water layer (Björk et al., 2001). In order to improve our understanding of the ice–ocean–atmosphere interactions in the eastern Fram Strait, we show how atmospheric and upper ocean temperature changes have been coupled over the last 2000 years and relate it to previously published data over the same time span and region.

Locations of core MSM05/05-712-1 (black dot; 78°54.94′ N, 6°46.04′ E, 1490m depth) and principal ocean surface currents. Red arrows indicate warm surface currents whereas blue arrows depict cold currents. The modern average position of the Arctic front and the Polar front are represented with dashed lines. WSC: West Spitsbergen Current; ESC: East Spitsbergen Current; NAC: North Atlantic Current; EGC: East Greenland Current. Map drawn with Ocean Data View (Schlitzer, 2010) (colour figure available online).
Study area
The Fram Strait has contrasting spatial and seasonal oceanographic conditions. The study region is located in the eastern Fram Strait (Figure 1), and it is influenced by the West Spitsbergen Current. This becomes colder and fresher towards high latitudes (Hansen and Østerhus, 2000; Walczowski et al., 2005), and injects relatively warm and saline Atlantic water below the ice-covered, cold and fresh Polar water cap of the Arctic Ocean (Aagaard et al., 1985). Parts of the West Spitsbergen Current separate from the main current in the central Fram Strait and flow south as the sub-surface return Atlantic Current (Gascard et al., 1988). The East Spitsbergen Current joins the West Spitsbergen Current and supplies cold water and sea ice from the northwestern Barents Sea to the eastern Fram Strait as it moves northward as a coastal current (Johannessen, 1986). In the western Fram Strait the cold and low salinity waters from the Arctic flow southward along the Greenland margin and form the East Greenland Current (Figure 1). This circulation pattern results in a variable sea-ice cover in the Fram Strait with permanent ice-covered areas in the west, permanent ice-free areas in the southeast, and seasonally variable sea-ice conditions in the central and eastern parts of the Fram Strait (Vinje and Finnekåsa, 1986).
In the eastern Fram Strait, the warm and saline Atlantic water flows in the sub surface, between 50 and 600 m water depth. It cools and freshens as it flows north into the Arctic Ocean, releasing heat into the atmosphere and developing a colder and less saline superficial mixed water layer (0–50 m water depth) as it melts the Arctic sea ice (Rudels et al., 2005). This surface mixed layer is characterized by seasonally variable temperatures and salinities.
At the coring site, the water temperatures at the sea surface (2 m depth) varied between 4°C (October) and 8°C (August; Spielhagen et al., 2011) in October 2006 and August 2007. At the limit between the buoyant mixed layer and the Atlantic water (50 m), and also at the bottom of the Atlantic water layer (600 m), the difference between both seasons was just 1°C at both depths (for more details in modern sea water conditions, see Spielhagen et al., 2011). The coring site location is close to the Arctic front (Figure 1), which separates the Atlantic and fresh Arctic waters of the Greenland gyre (Aken et al., 1995), and corresponds to the maximum limit of sea ice in winter. The sea ice seasonal coverage at the coring site has a large inter-annual variability, ranging between 0 and 6 months/yr (Bonnet et al., 2010).
Methodology
Samples
Both air and sea surface temperature records were obtained from the same marine sediment core, MSM05/05-712-1, retrieved from the slope of the Svalbard western continental margin (78°54.94′ N, 6°46.04′ E, 1490 m depth; Figure 1) and sub sampled at 1 cm intervals. The record spans approximately the last 2000 years. The age model is based on five accelerator mass spectrometry 14C age measurements on planktonic foraminifera (Spielhagen et al., 2011). The sampling resolution is on average c. 45 years per data point.
In July 2009 during ARK-XXIV/1 expedition, water samples from the western Spitsbergen continental margin were collected at different water depths close to the coring site (78°50.30′N, 6°42.22′E). An inline filtration system was used to collect 8l of water from 6 m depth, and a CTD-rosette device was used to retrieve 28l at 30 m, 53.5l at 250 m and 57.5l at 1604 m. All samples were filtered on board through GF/F filters (0.7 µm pore size) and stored frozen.
Proxies
To estimate sea surface temperature (SST) we used the UK37 index (Brassell et al., 1986) calculated from the relative concentration in sediments of the di-, tri- and tetraunsaturated C37 alkenones through the equation UK37 = (C37:2 − C37:4)/(C37:2 + C37:3 + C37:4). The UK37 was then converted to temperature using the regression SST (°C) = (UK37 – 0.162)/0.029 from a core-top calibration (using annual means for SST) in the northeastern Atlantic (Rosell-Melé et al., 1995). The error of the regression is 0.5°C (calculated from the deviations for the intercept and slope at 95% significance level given in Rosell-Melé et al., 1995). The percentage of the C37:4 alkenone to the total abundance of C37 alkenones (%C37:4 = [C37:4/(C37:2 + C37:3 + C37:4)]·100) in the record is used as an additional tracer to infer variations in the meridional extent of polar and sub polar conditions through time (Bendle et al., 2005). The alkenone pattern in samples from core MSM05/05-712-1 (Figure 2) indicates influence of Atlantic water mass (Bendle and Rosell-Melé, 2004). This indicates that, even though the site is located at high latitude in a polar marginal environment, alkenones can be used for estimating past SST in this core.
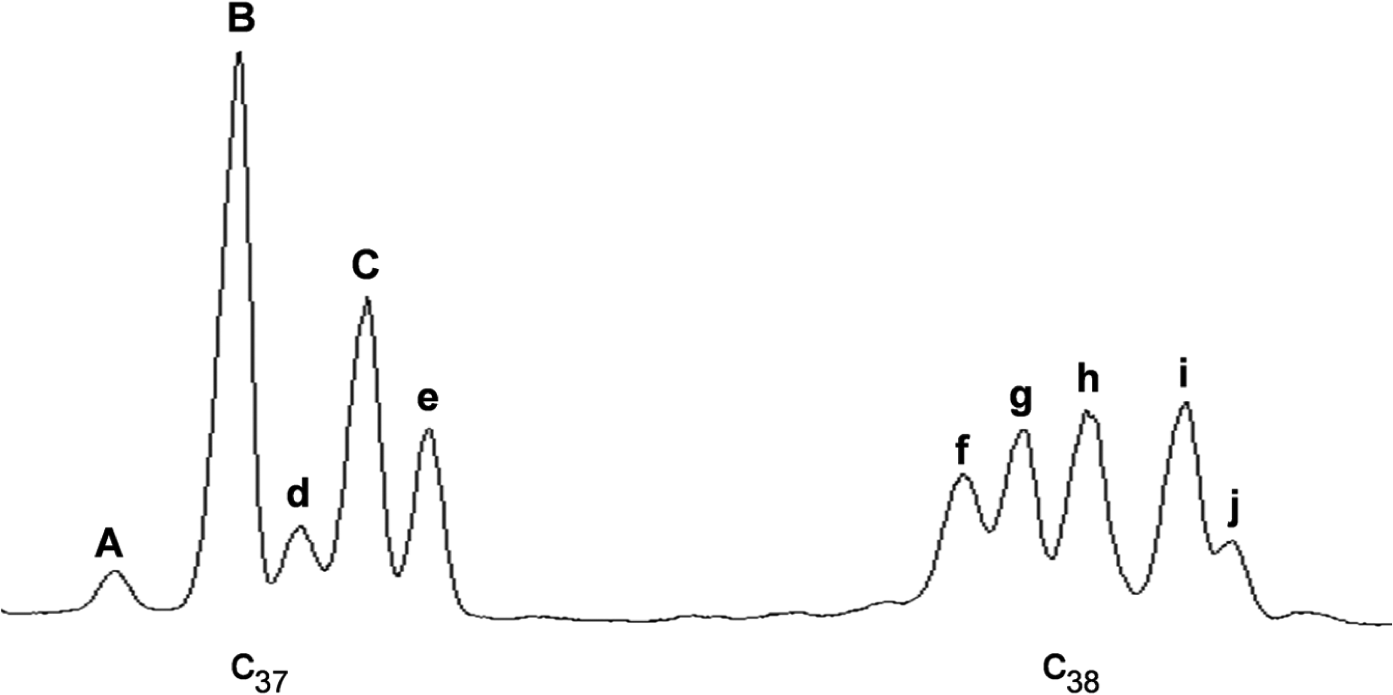
Representative gas chromatography with flame ionization detector (GC-FID) trace of alkenone patterns in core MSM05/05-712-1. Alkenones used in this study are: (A) C37:4 Me; (B) C37:3 Me; (C) C37:2 Me. The other compounds were identified to determine the alkenone water mass fingerprint as described by Bendle and Rosell-Melé (2004): (d) C36:3OMe, (e) C36:2OMe, (f) C38:4Me, (g) C38:3Et, (h) C38:3Me, (i) C38:2Et, (j) C38:2Me
To estimate air temperature we used a novel biomarker proxy derived from bacteria in soils, the so-called methylation of branched tetraether/cyclization of branched tetraether (MBT’/CBT) index (Peterse et al., 2012; modified after the original MBT/CBT index from Weijers et al., 2007a). The MBT’/CBT index is obtained from quantifying relative abundances of branched glycerol dialkyl glycerol tetraethers (GDGTs) using the equations CBT = -log([1020 + 1034] / [1022 + 1036]) and MBT’ = [1022 + 1020 + 1018] / [1022 + 1020 + 1018 + 1036 + 1034 + 1032 + 1050] where the numbers refer to the protonated masses of branched GDGTs. The resulting values of the CBT and MBT’ indices were converted to mean air temperature (MAT) using the equation MAT = 0.81 − 5.67×CBT + 31.0×MBT’ (Peterse et al., 2012). The MBT’/CBT calibration to MAT has an error of 5°C. For this reason, in the present paper we focus on the qualitative interpretation of relative variations of temperature estimated throughout the core. This proxy has been used to successfully describe past changes in air temperature at different temporal scales and in a wide range of geographical settings, such as the Congo deep sea fan (Weijers et al., 2007b), North America (Fawcett et al., 2011), East Greenland (Schouten et al., 2008), and the Arctic (Weijers et al., 2007c).
Analytical procedure
Freeze-dried sediment (c. 2g) was extracted with dichloromethane (DCM):methanol (MeOH) (3:1, v/v) using microwave-assisted extraction (Kornilova and Rosell-Melé, 2003). Prior to extraction, a synthetic tetraether with one cyclopentane ring (GR) and nonadecanone were added as internal standards. Extracts were fractionated through a Thermo Surveyor HPLC system (for details see Fietz et al., 2011). The water-filtered samples were extracted using the same approach but were instead fractionated with flash chromatography using 5% deactivated silica as stationary phase and 3ml of hexane, DCM (alkenones) and MeOH (GDGTs) subsequently as mobile phases.
For alkenone analysis, the second fraction was dried and re-dissolved in isooctane and an aliquot analysed using a Thermo Trace gas chromatograph (GC; for details see Martínez-Garcia et al., 2009). The analytical error (reproducibility) was equivalent to 0.5°C (1σ, n = 5). For GDGT analysis, the third fraction was dried and redissolved in hexane:n-propanol (98.5:1.5, v/v) and filtered through a 0.5 μm PTFE filter (Advantec) prior to injection in a Dionex P680 HPLC coupled to a Thermo Finnigan TSQ Quantum Discovery Max quadrupole mass spectrometer with an atmospheric pressure chemical ionization (APCI) interface set in positive mode (for details see Escala et al., 2009). A marine sediment sample from the Fram Strait was extracted, purified and injected in the HPLC-MS five times and the analytical error (1σ) was 0.6°C.
Results and discussion
Origin of the branched GDGT signal
A key issue in the application of the air temperature proxy from soil GDGTs in a marine record is to establish their origin. Initially the synthesis of branched GDGTs was postulated to occur exclusively in continental environments (Weijers et al., 2007a). Soils were shown to be a major source of branched GDGTs (Weijers et al., 2009), and their biosynthesis was ascribed to anoxic bacteria (Weijers et al., 2007a), although the only source organisms proven to produce branched GDGTs so far are terrestrial acidobacteria (Sinninghe Damste et al., 2011). At the moment there is no reported evidence that branched GDGTs are biosynthesized in the open ocean and deep sea sediments, such as the coring site studied here. Branched GDGTs were found to decrease seawards from the continent (Hopmans et al., 2004; Kim et al., 2006), and fluvial transport of branched GDGTs from peats and soils to the oceans could be inferred from the detection of substantial amounts of branched GDGTs in river water, and a high branched GDGT concentration in the water of a Swiss peat bog (Herfort et al., 2006). To explain the discrepancy in MAT estimates between soils and fjord sediments from Svalbard, Peterse et al. (2009) hypothesized that part of the branched GDGTs found in the fjords may be produced in situ. However, we note that the distributions of branched GDGTs in those soil and fjord samples from northwest Svalbard (Peterse et al., 2009) are not comparable with the average distributions of branched GDGTs found in our core MSM05/05-712-1 for the last 2000 years (Figure 3). We consider thus that the branched GDGTs in our core might have a wider source, as the eastern Fram Strait is exposed to the arrival of terrigeneous detritus transported to the site with drifting sea ice, which can be melted by the inflowing warm Atlantic water.

Average distribution and standard deviation of branched GDGTs measured in core MSM05/05-712-1 (78°54.94′N, 6°46.04′E; green line; n = 43), in a previous study (Peterse et al., 2009) from soils in three locations in northwest Svalbard (brown line; n = 9), surface sediments from a northwest Svalbard fjord system (orange line; n = 29) and at 6 m, 30 m, 250 m, 1604 m water column depth (blue lines; 78°50.30′N, 6°42.22′E) (colour figure available online).
The source of high amounts of ice-rafted debris (IRD) released during the summer melting of the ice margin over our study region has been attributed to the Svalbard archipelago and the northern Barents Sea (Hebbeln, 2000; Hebbeln and Wefer, 1991). Hebbeln (2000) reported high particle flux events in winter due to the input of IRD derived from the Svalbard archipelago even in situations when the Svalbard ice margin did only reach the vicinity of the site. The material from the Barents Sea may reach the coring site transported with the East Spitsbergen Current. Drifting ice transport of branched GDGTs was indeed suggested by Yamamoto et al. (2008) in the central Arctic. In addition, Kim et al. (2011) studied the origin of the organic matter in a wide set of samples from Svalbard and found a significant IRD input in front of glaciers that, due to the slow melting of icebergs, could influence the whole fjord system and beyond. Furthermore, the analysis of water column samples obtained in July 2009 close to the coring site shows that 85% of the relative abundance of detected branched GDGTs are found near the water surface, at 6 m water depth, whereas only 7% were found at 30 m and 4% at 250 m and 1604 m (Figure 3). This would suggest that the branched GDGTs entered the marine system at the sea surface and are not produced at depth, or at least that the input at the sea surface via IRD would be higher than a hypothetical in situ production deeper down in the water column. Incidentally, the MAT estimates from the MBT’/CBT indices for these samples in the surface waters are 10°C (at 6 m water depth) and 8.5°C in the surface sediment. Interestingly, even considering the MAT calibration error of 5°C, these values are closer to July average (5.3 to 6.4°C) air temperatures rather than to annual mean air temperatures (from −8.5 to −1.6°C) in western Spitsbergen (Norwegian Meteorological Institute, 2010). In summary, we argue that branched GDGTs in our study site are likely associated to IRD originating from a wide area that includes the Svalbard archipelago and the northern Barents Sea, while a contribution from Svalbard continental run off also seems feasible.
Air and sea surface temperatures variability
During the last 2,000 years the reconstructed climatic parameters show several short-time fluctuations as well as centennial-scale trends (Figure 4). The SST from the upper mixed layer estimated from UK37, and the MAT attributed to the region of the Svalbard archipelago, estimated from MBT’/CBT both indicate the past occurrence of various cooling–warming episodes (Figure 4a). Specifically, in the period between ~ad 72 and ad 330, SST increased by 2°C and MAT decreased by c. 1°C, followed by a SST cooling of ~2.5°C from ~ad 330 to ad 685 SST and a MAT warming of ~1.5°C from ~ad 330 to ad 840. From ad 685 to 1000 SST increased ~2°C while MAT decreased ~1.5°C from ad 840 to 1000. After these successive warming and cooling periods, since ad 1000 there has been a time interval with a sustained increase of ~2.5°C in MAT, and a decrease in SST of about ~3.5°C until present. These trends were more accentuated during the last 500 years. There is a continuous increase in %C37:4 (Figure 4b) since ad 1000, which suggests increasingly colder and fresher surface waters at the coring site.

Paleoclimatic reconstruction in core MSM05/05-712-1 for the last 2000 years. (a) UK 37 SST (°C) (red) depicting surface mixed water layer temperature, Atlantic water temperature at 50 m depth (purple) taken from Spielhagen et al. (2011) and MBT’/CBT regional air temperature (°C) estimates (green). (b) Percentage of C37:4 to C37 alkenones as indicator of polar/freshwater extent (blue). A three-point running average is shown with a thick line for all the data sets. Black squares in the age axis indicate dating points resulting from 14C AMS measurements (Spielhagen et al., 2011). Floating error bars at the right of the figure show the analytical error (reproducibility) (colour figure available online).
In Figure 4a we also plot the results of the SIMMAX modern analogue technique applied on planktic foraminifer species, which reflect mid-summer conditions in the uppermost part of the Atlantic water layer averaged over a few decades in the same marine sedimentary core (Spielhagen et al., 2011). The Atlantic water temperature shows similar trends as the MAT, especially during the last 500 years when both increase.
Previous studies determined an increase in the inflow of Atlantic water in the north of Svalbard during the last 1000 years (Slubowska et al., 2005), coinciding with colder and more unstable conditions, than in preceding time intervals and with increased ice rafting in western Svalbard (Slubowska-Woldengen et al., 2007). Quantitative SST reconstructions based on dinocyst assemblages from a sediment core located close to our site (JM-06-WP-04-MCB; 78°54.9′N, 6°46.0′E) registered a cooling of 4°C for the last 300 years (Bonnet et al., 2010). For the same time period, our results are coherent with the cooling registered by the dinocysts, showing a SST decrease of c. 2°C. In contrast, during the last 1000 years regional MAT increased ~1°C until ad 1860, and by 1.5°C in the last 150 years, reaching a value of 8.5°C, which is the highest value for the whole record. This coincides with a strengthened sub surface Atlantic water inflow to the eastern Fram Strait after ~1860 described by Werner et al. (2011), based on the amount of sub-polar planktic foraminifera Turborotalia quinqueloba in the same marine sedimentary core.
Considering the oceanographic characteristics of the coring site, we suggest that, during the last 1000 years, there was an increase in the northward flow of warm Atlantic water (as also suggested by Slubowska et al., 2005, for the last 1000 years and by Spielhagen et al., 2011, for the last 160 years). We postulate that this took place together with an enhancement of the atmospheric circulation that brought northwards warmer air to the Svalbard area, as interpreted from the air temperature estimates. These phenomena could have enhanced the melting of the sea ice, releasing colder and less saline upper layer water in the eastern Fram Strait (Figure 5). Warmer air temperatures leading to increased river runoff (Peterson et al., 2002) and negative mass balance of circum-Arctic glaciers (Dowdeswell et al., 1997), especially those from Svalbard, could be additional sources of fresh water to the area.

Water column structure in western Svalbard and air–ocean interactions during a positive phase of Arctic multidecadal variability (MDV). The northward transport of warm air and Atlantic water (AW) via the West Spitsbergen Current (WSC) are enhanced (MAT MBT’/CBT and AW T SIMMAX increase). Sea ice melts releasing colder and fresher water (FW) to the surface mixed layer (SST UK37 decreases and %C37:4 increases). During negative phase of MDV these interactions are weakened.
Mechanism of long-term climate variability
The Arctic responds to low frequency intrusions of Atlantic warm/cold air mass anomalies with alternating regimes of weakened/strengthened anticyclonic Beaufort gyre circulation, and intensified/suppressed cyclonic circulation in the eastern Arctic (Polyakov and Johnson, 2000). At decadal timescales, the atmospheric and oceanic variability in the Arctic is driven by changes in the AO (Thompson and Wallace, 1998) and the NAO (Hurrell, 1995); high AO/NAO is associated with a cyclonic circulation regime and low AO/NAO is related to an anticyclonic circulation regime (Dukhovskoy et al., 2004; Proshutinsky and Johnson, 1997). From modern observations and statistical analysis, ~50–80 year low frequency oscillations have been identified in Northern Hemisphere surface air temperatures for the North Atlantic Ocean (Schlesinger and Ramankutty, 1994). Depending on the atmospheric pressure system at sea level and the cyclonic circulation over the Arctic, two phases of such multidecadal variability (MDV) can prevail at these longer timescales. During the positive phase of Arctic MDV there is an enhancement in the warm air and Atlantic water inflow from the North Atlantic to the Arctic, and an excess of sea ice and freshwater transport from the Arctic through the Fram Strait, whereas in the negative phase these interactions are weakened (Figure 5; Polyakov et al., 2004, 2010). Our data suggest that, during the last ~1000 years, a relative dominance of the positive phase of Arctic MDV prevailed. This trend started ~1000 years ago and prevailed until ~ad 1860, when there was an intensification in the increase of Svalbard air temperatures: in the past 150 years air temperature increase doubled on average between ~ad 1000 and 1860, accompanied by an enhancement of Atlantic water inflow to the Fram Strait as described by Spielhagen et al. (2011). Given that for the same time period the rate of change in air temperature is not mirrored by a change in the rate of SST decrease, we suggest that the rise in Svalbard air temperatures since ad 1860 could be driven by the impact of human activity on climate superimposed on the longer-term natural warming and the mean relative dominance in the positive phase of MDV that began around ad 1000.
Recently, through an empirical orthogonal function analysis of deep-ocean and near-surface instrumental observations of the North Atlantic, it was demonstrated that the recent warming over the North Atlantic is linked to both long-term climate change (including anthropogenic and natural) and MDV over the last 80 years of the 20th century (Polyakov et al., 2010). Considering that the mechanisms of MDV observed in instrumental records can be projected onto longer timescales, our results indicate long-term changes in the phases of Arctic MDV during the last 2000 years.
Conclusions
We have reconstructed past air and sea surface temperatures and variations in freshwater extent in the eastern Fram Strait for the last 2000 years. During the last 1000 years, air temperature increased continuously while the upper mixed water layer temperature decreased, and the amount of polar freshwater present in the area increased. Considering the oceanographic conditions of the area, there might have been an increase in the inflow of Atlantic water during the last 1000 years together with an increase in atmospheric heat transport which caused a progressive sea-ice melting and cooling of the upper mixed surface layer in the eastern Fram Strait. Assuming that the mechanisms of MDV derived from relatively short instrumental records can be projected onto longer timescales, our results may indicate the occurrence of a mean relative dominance in the positive phase of the Arctic MDV for the last 1000 years. We suggest therefore that the data presented here show long-scale average changes in the mean modes of positive and negative Arctic MDV over the last 2000 years.
Footnotes
Acknowledgements
The authors thank R Spielhagen and K Werner for providing samples from core MSM05/05-712-1 as well as scientists and crew onboard RV Maria S Merian expedition MSM5/5 for retrieving the core. We thank Gereon Budeus and crew onboard RV Polarstern expedition ARK-XXIV/1 for retrieving water samples. B Hambach, N Moraleda, and A Martinez-Garcia are thanked for assistance in the laboratory. C Huguet is thanked for comments on the original manuscript. The Norwegian Meteorological Institute is thanked for providing access to meteorological data from Svalbard stations. We would like to thank the anonymous reviewers for their constructive comments.
Funding
The Spanish Research Ministry (MEC/MICINN) is thanked for FPU PhD studentship (AP2008-00801) to GR, a Juan de la Cierva fellowship (JCI-2008-2738) to SF and financial support for the project ICECARB (POL2006-02999/CGL).