



Abstract
Three washover sand beds, ranging from 15 to 34 cm in thickness, were recorded in a lagoonal mud sequence on the Shizuoka coast of central Japan, which faces the Suruga Trough. The sand beds were composed of well-sorted and well-rounded beach sand derived by a marine inundation. The basal erosion surface, mud clasts, and presence of both inverse and normal grading suggest that the sand beds formed as a result of high-energy deposition. The sand beds are multilayered, with fine alternations of sand sheets and mud drapes, which are consistent with deposition from a long-period wave train. Radiocarbon dates obtained from the three washover deposits are around ad 1000, 3565–3486 cal. yr BP, and 4000 cal. yr BP. Vertical changes in the diatom assemblages suggest a gradually increasing inflow of seawater up to the second sand bed, followed by a rapid change to freshwater conditions just above the bed. The gradual increase of seawater inflow begins again just above the second sand bed. We conclude that this series of sequential environmental changes indicates interseismic subsidence and coseismic uplift. The study area experienced around 1 m of uplift during the ad 1854 Ansei Tokai earthquake (Mw 8.4). In contrast, the area has subsided gradually (c. 6 mm/yr) during the present interseismic period. The youngest sand bed may be correlated with the ad 1096 Eicho earthquake, which caused severe damage along the Shizuoka coast.
Introduction
This paper aims to determine whether mega-earthquakes and their associated tsunamis, such as the 2011 Tohoku-oki event (Mw 9), have occurred in the past (and so may occur again in the future) along the Nankai and Suruga troughs, close to central and west Japan (Figure 1a and b). Since the 2011 Tohoku-oki earthquake and tsunami, developing a reliable estimate of the maximum earthquake and tsunami risk has become an important element of Japanese disaster control planning, and the Cabinet Office of the Japanese Government has developed a set of calculations of the likely tsunami height, inundation area, and damage caused by the maximum possible earthquake along the Nankai and Suruga troughs (http://www.bousai.go.jp/jishin/nankai/taisaku_wg/pdf/20130528_honbun.pdf).
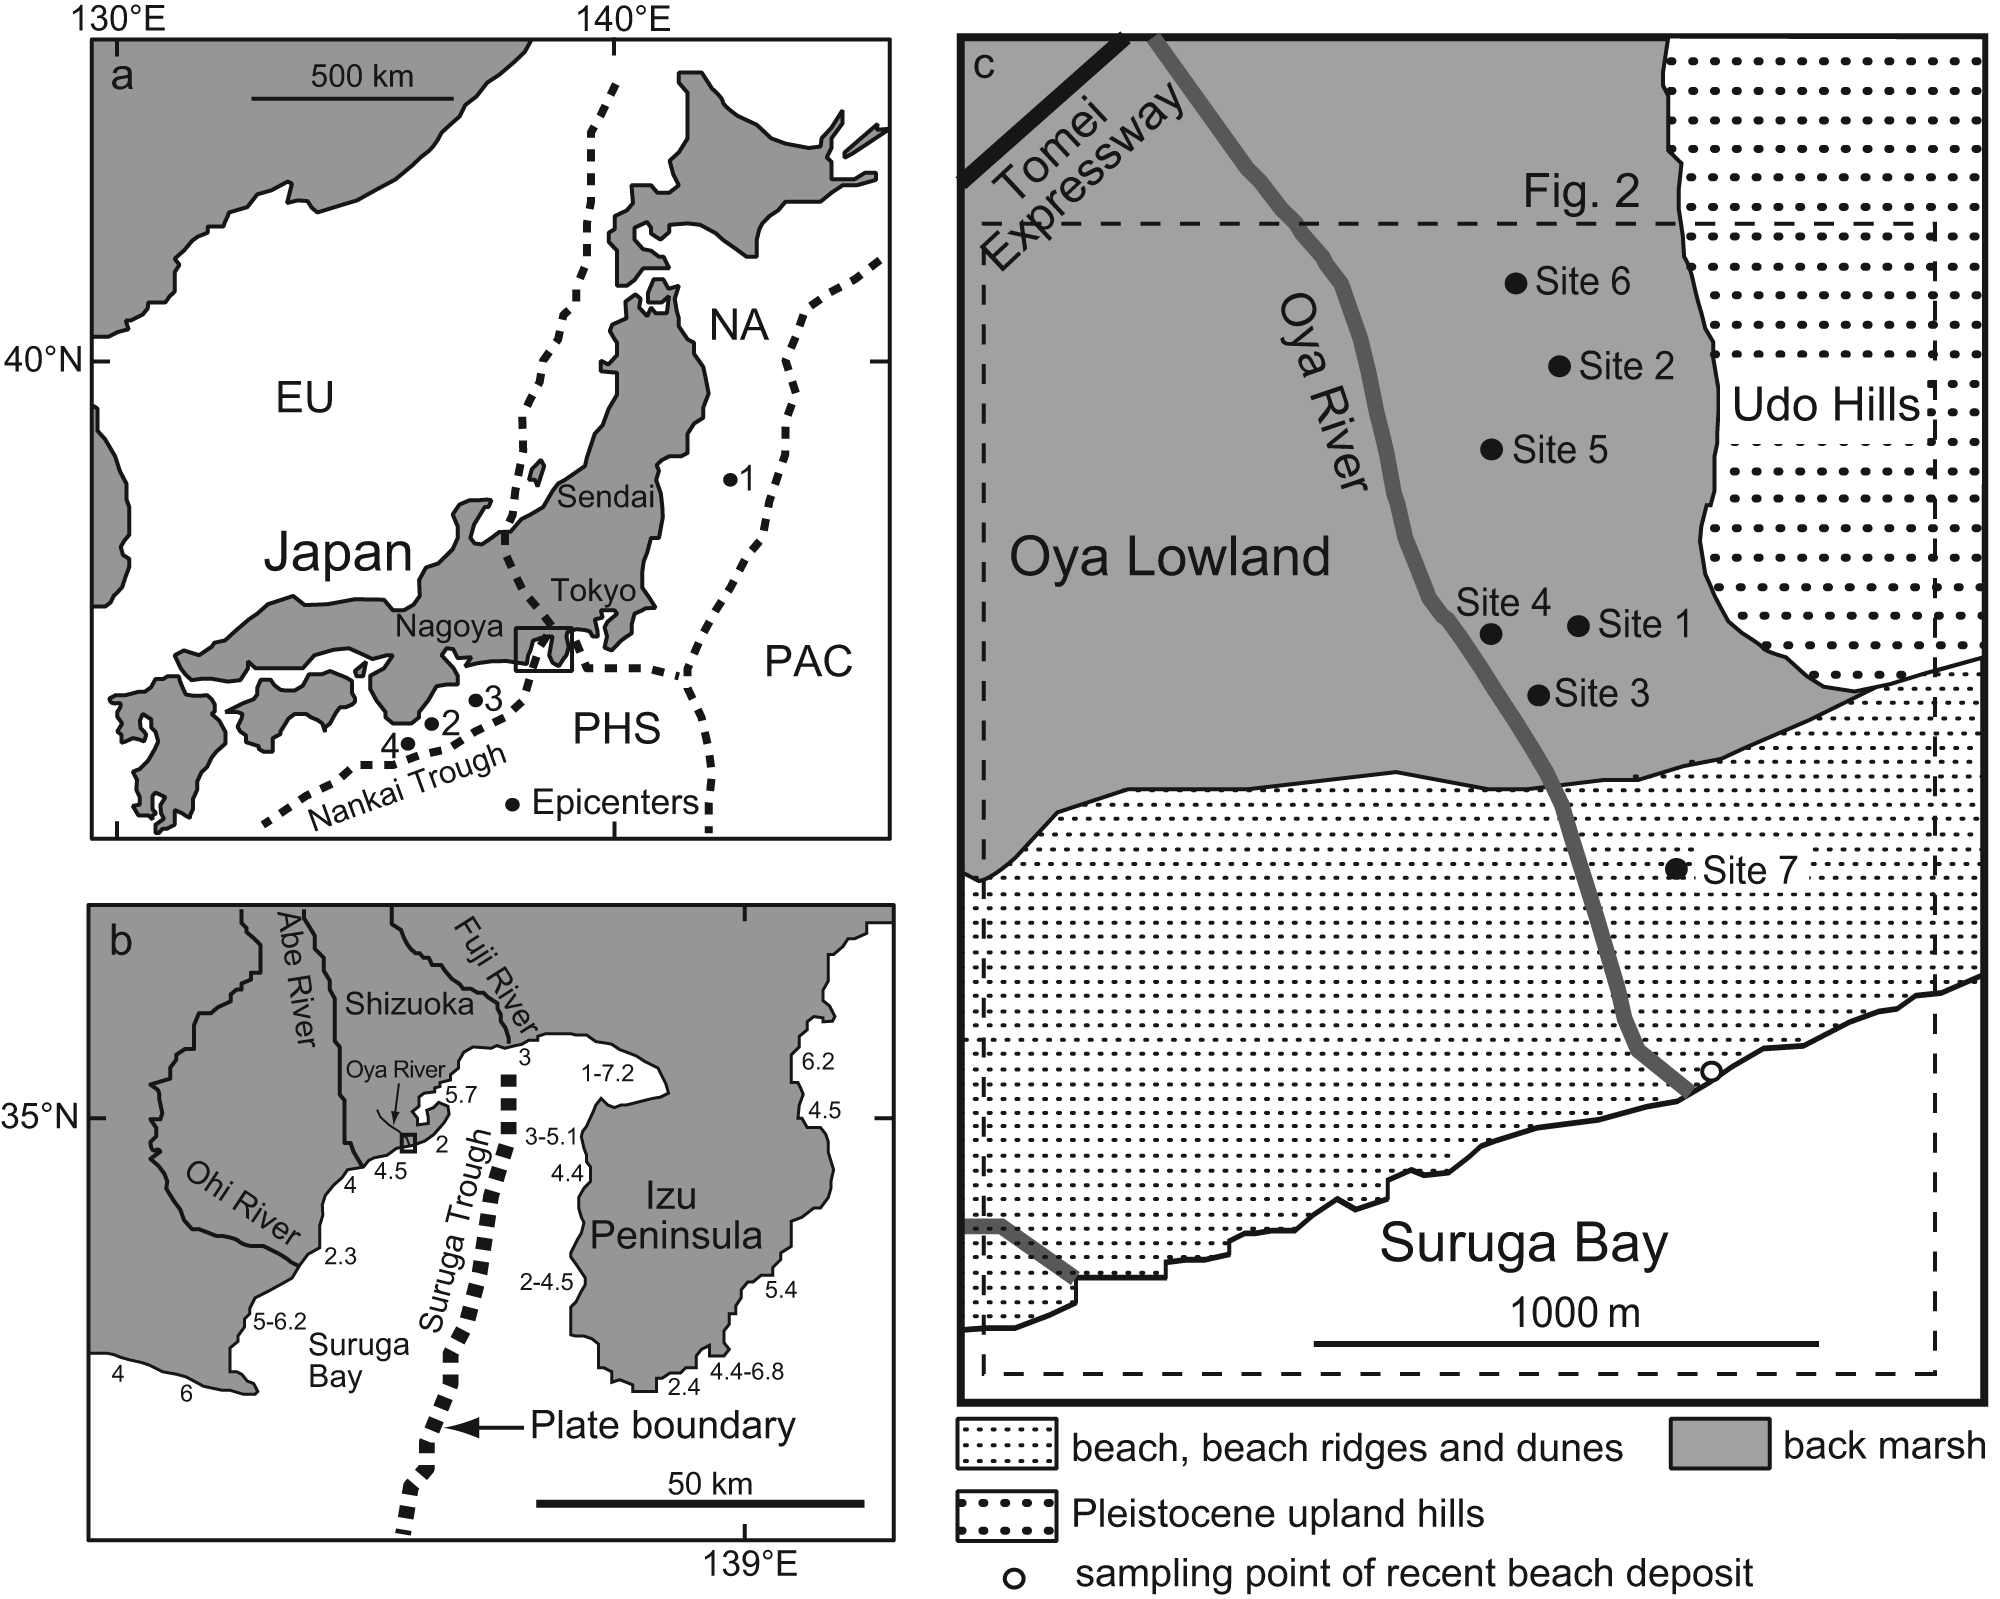
Location maps. (a) Map of Japan showing plate boundaries and the location of the Shizuoka area. 1: epicenter of the 2011 Tohoku-oki earthquake (Mw 9.0), 2: epicenter of the ad 1944 Tonankai earthquake (Mw 8.2), 3: epicenter of the ad 1854 Ansei Tokai earthquake (Mw 8.4), 4: epicenter of the ad 1707 Hoei earthquake (Mw 8.4). (b) Map of the Shizuoka area showing the distribution of tsunami wave heights (m) caused by the Ansei Tokai earthquake (after Watanabe, 1998), and indicating the location of the Oya lowland to the east of the Abe River. (c) Map of the study area in the Oya lowland, showing core sites and geomorphology (after Matsuda, 2006).
Japanese historical documents covering a period of more than 1300 years provide a record of tsunami genesis related to great earthquakes along the Nankai and Suruga troughs that stretches back to ad 684 Hakuho earthquake (e.g. Ando, 1975; Ishibashi, 1981; Usami, 2003). However, even this data set is not long enough to conclusively determine the likely maximum size of an earthquake, and its associated tsunami, that can be expected in this region. Paleotsunami research based on coastal geology has revealed traces of mega-tsunamis from the period prior to that covered by these historical documents, for example, at Hokkaido, north Japan (Hirakawa et al., 2000; Nanayama et al., 2003); at Sendai, northeast Japan (Minoura et al., 2001; Minoura and Nakaya, 1991; Sawai et al., 2012); and in Chile (Cisternas et al., 2005). According to this research, the earthquakes that cause mega-tsunamis are estimated to have much longer recurrence intervals than that of ‘lower intensity’ subduction zone earthquakes (c. Mw 8).
To estimate the size (inundation distance) of a paleotsunami, we must trace the tsunami deposits through the coastal lowlands from the former shoreline to its inundation limit (e.g. Nanayama et al., 2007). A serious problem facing paleotsunami researchers is artificial disturbance of the tsunami deposits, especially by agricultural activity. The coastal lowlands along the Nankai and Suruga troughs have been highly cultivated and urbanized for more than 2000 years. The Oya lowland on the southeast Shizuoka Plain is one of the few areas suitable for the field study of paleotsunami events in these regions (Figure 1). The lowland is a former lagoon and has not been heavily cultivated.
Kitamura et al. (2011) recorded the Holocene sequence preserved in the Oya lowland based on sediment cores recovered from two sites (Sites 1 and 2; Figures 1c, 2 and 3). These cores are 8 m long and consist mainly of clay that was deposited in a lagoon–delta system over the past 7300 years. Sand beds within the cores suggest the occurrence of high-energy currents, and these beds have a sharp base and are normally graded. Kitamura et al. (2011) classified these beds into Type A and Type B according to their lithological features. Type B beds are common throughout the lagoonal sequence and are characterized by a high mud content (>20%) and poorly rounded, very fine-grained sands. The Type A beds are rare (only two were recorded in the lagoonal sequence) and are characterized by a low mud content (5–15%) and well-rounded medium-grained sands.
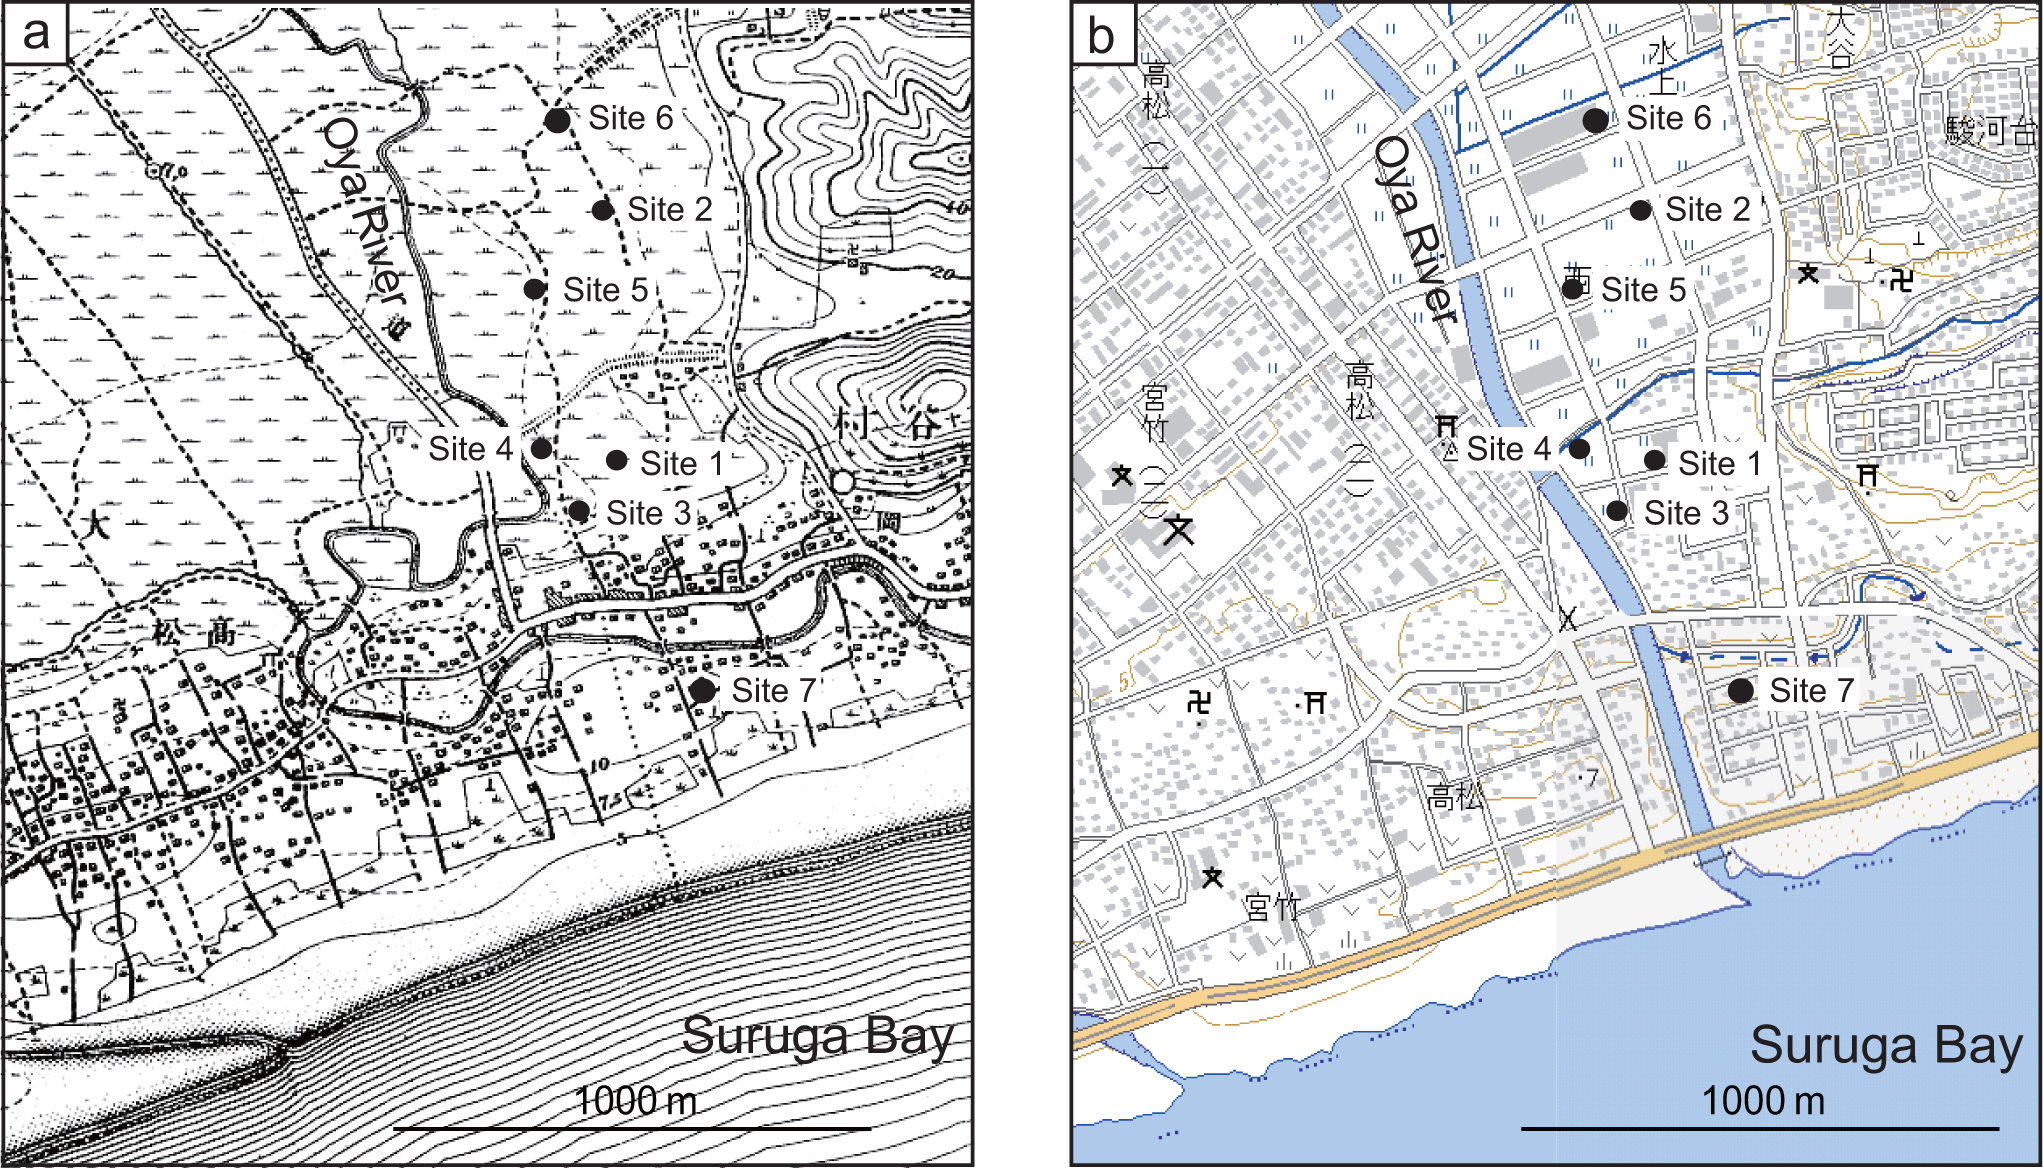
Locations of sample cores. (a) A 1887 1:25,000 scale topographic map (Kunosan district) showing the former course of the Oya River and (b) a 1:25,000 scale topographic map of the Shizuoka Tobu district (published by the Geospatial Information Authority of Japan).
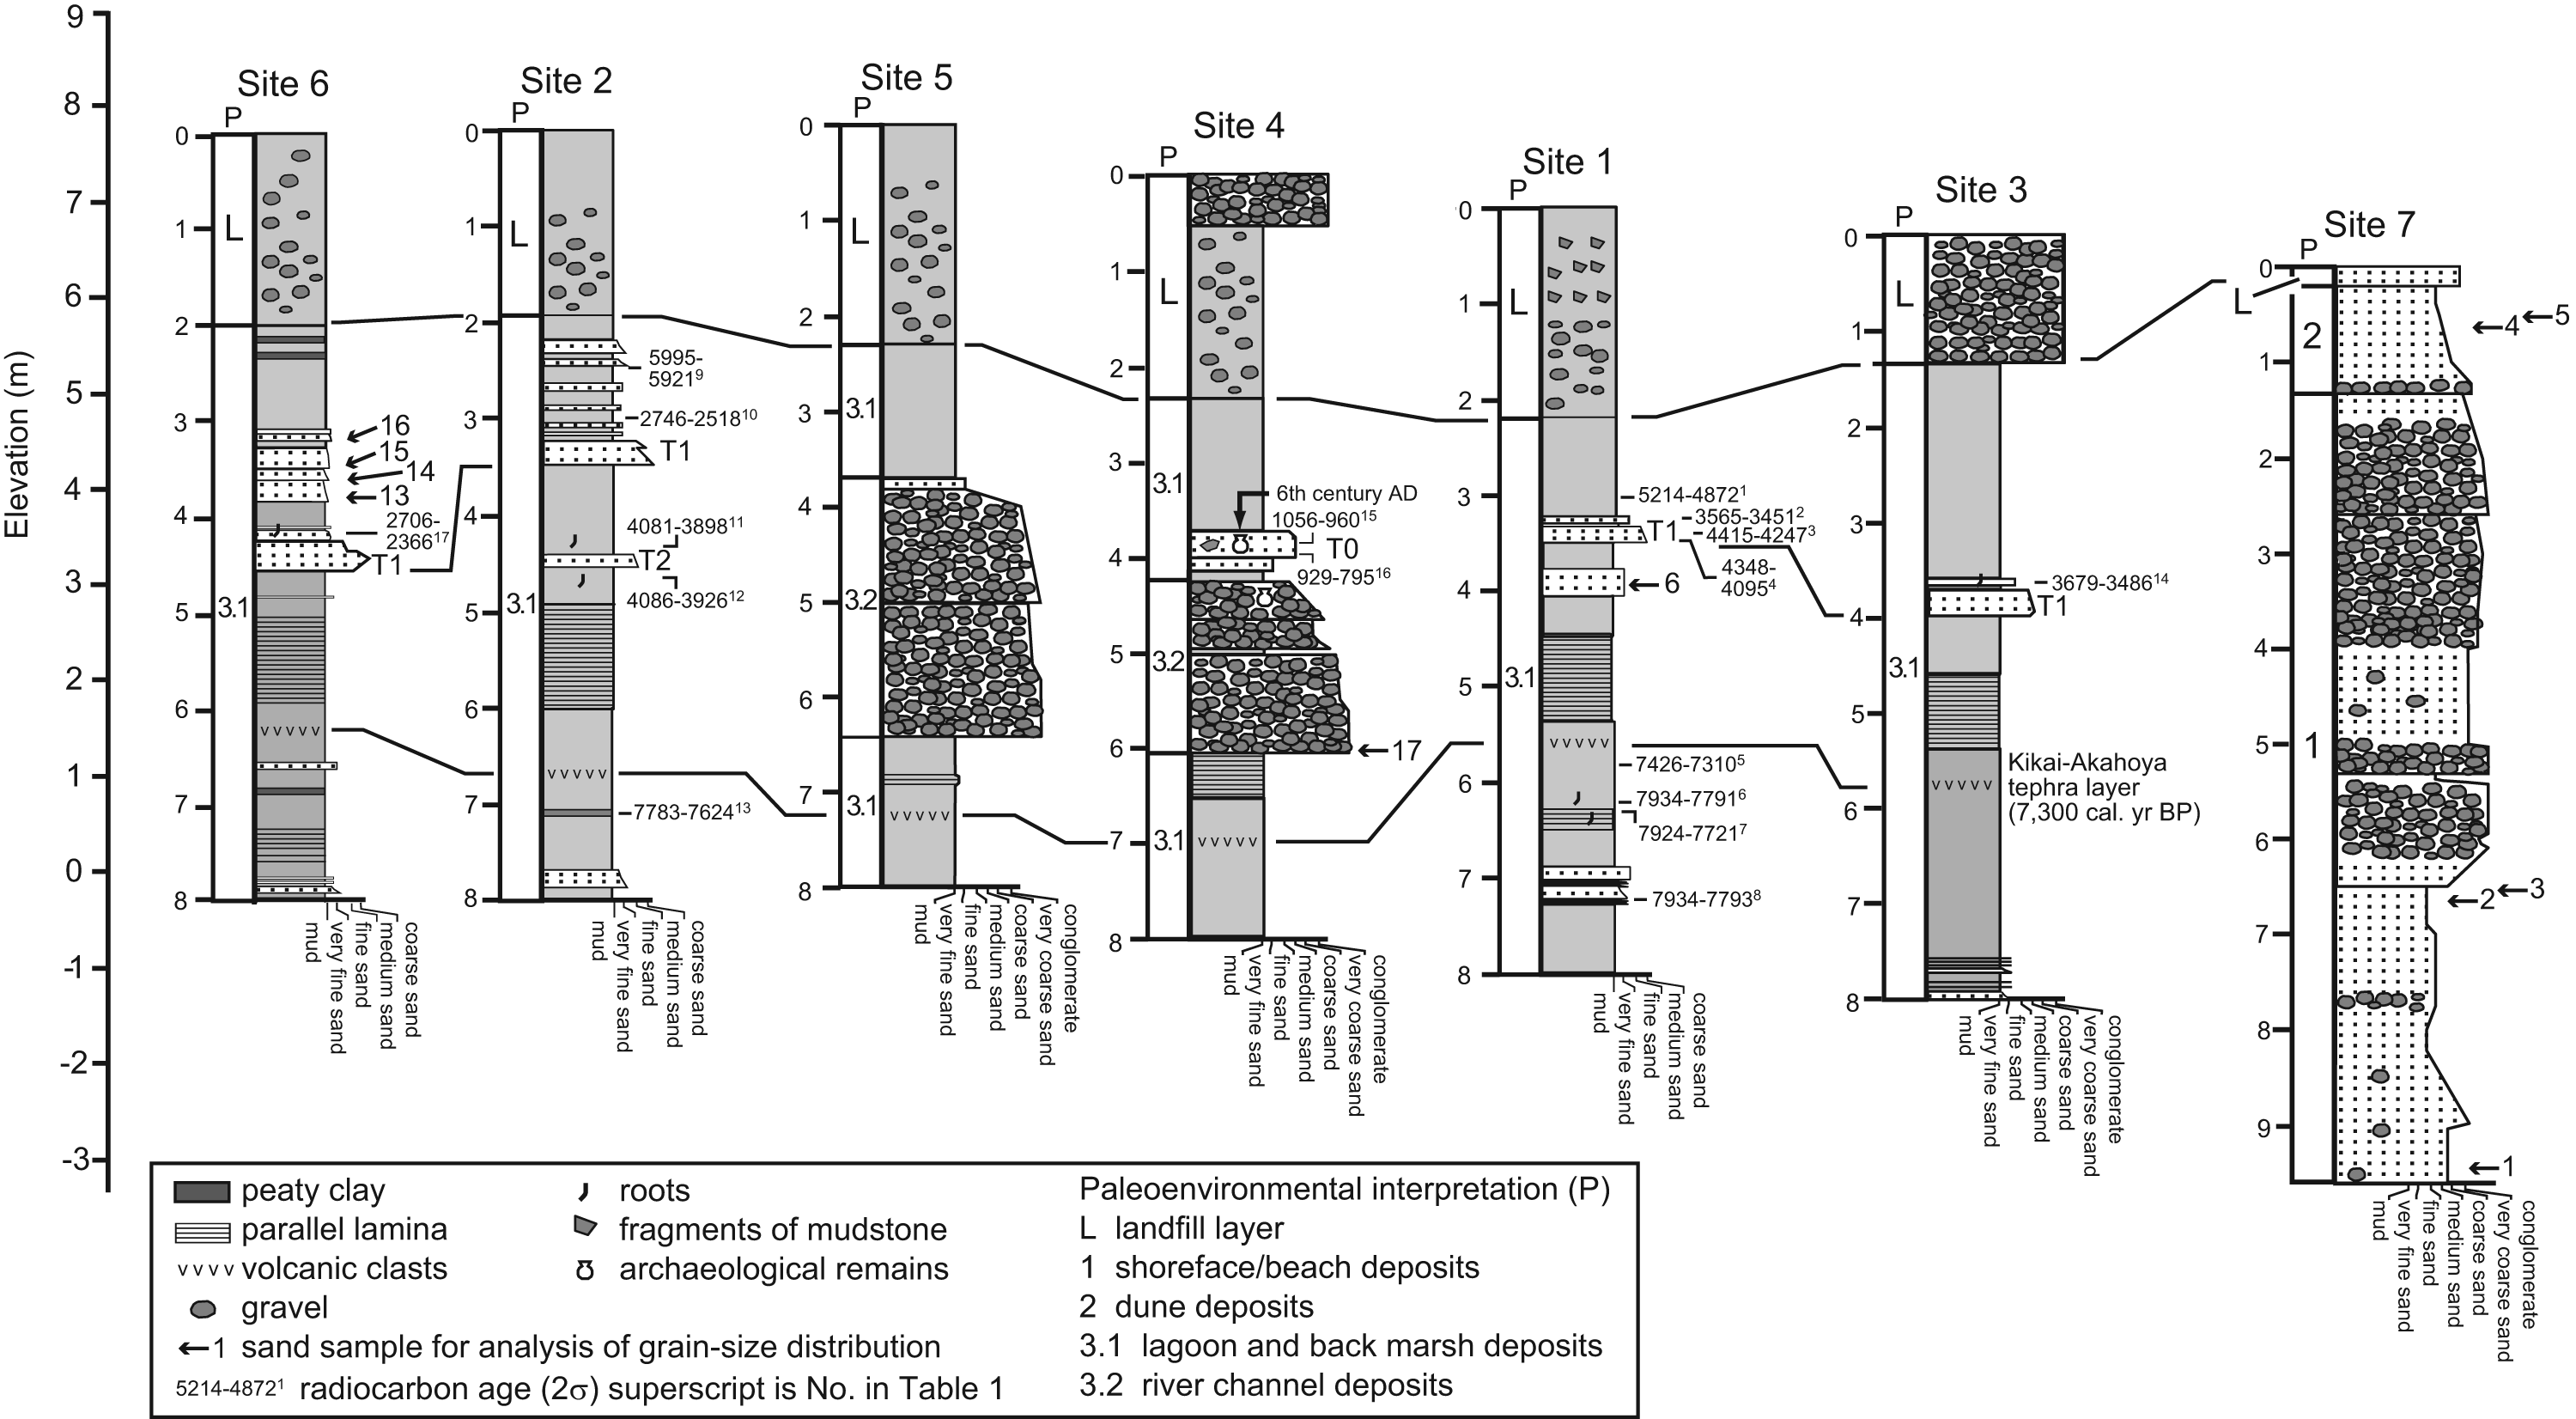
Stratigraphic columns reconstructed from the cores at the seven sites. See Table 1 for radiocarbon dates.
The grain shape (angular) of the Type B sands is similar to that of sands deposited in the river mouth bar of the Abe River (Figure 1b), implying that this deposit was derived from fluvial flooding. In contrast, the grain shape (subangular) of the Type A beds is similar to the foreshore and backshore sands of the Oya coast, suggesting that this deposit was most probably derived from marine flooding. Consequently, Kitamura et al. (2011) suggested a tsunami origin for the two Type A sand beds preserved within the lagoonal sequence; however, they did not obtain any definitive evidence to support this interpretation.
This paper considers the origins of the Type A and B sand beds based on five additional cores (Figures 1c, 2 and 3), and uses an interdisciplinary approach to interpret the sedimentological, geomorphological, and petrological data. Our results will help to assess the likelihood of further mega-tsunamis on the Shizuoka Plain and surrounding areas in the future.
Study area
Tectonic setting
The Shizuoka Plain is located on the Pacific coast of central Japan and faces the Suruga Trough, which marks the boundary of convergence between the Eurasian Plate and Philippine Sea Plate, together with the Nankai Trough (Figure 1a and b). This subduction zone is believed to be responsible for the region’s main earthquakes and tsunamis. Most earthquakes are initiated along one or other of two well-defined segments on the eastern and western sections of the subduction zone. Earthquakes rupturing the eastern segment are known as Tokai or Tonankai earthquakes, while those rupturing the western segment are known as Nankai earthquakes (e.g. Ando, 1975; Ishibashi, 1981). Analyses of historical documents and archaeological evidence (e.g. traces of liquefaction in ruins) suggest that great earthquakes (c. Mw 8) in this region have occurred with a recurrence interval of 90–200 years (e.g. Sangawa, 2001; Watanabe, 1998). The latest great earthquakes along the eastern Nankai Trough near the Shizuoka Plain occurred in 1854 (Ansei Tokai earthquake, Mw 8.4; Ando, 1975) and 1944 (Tonankai earthquake, Mw 8.2; Tanioka and Satake, 2001).
Geomorphological changes along the Shizuoka coast during the 1854 Tokai earthquake have been reconstructed based on a local government survey conducted 38 years after the earthquake. According to the report, an estimated 1–2 m of uplift occurred around the Shizuoka Plain (Hatori, 1976; Ishibashi, 1984). However, the absence of any emerged coastal landforms suggests the accumulation of uplift through the Holocene in this area. This discrepancy between the historical and geomorphic data is probably related to interseismic subsidence. Tidal gauge data for the past 55 years show that the Shizuoka Plain is subsiding at a rate of around 6 mm/yr (Geospatial Information Authority of Japan, 2011) during the current interseismic interval.
Geomorphological setting
The Shizuoka Plain forms a Gilbert-type delta at the mouth of the Abe River (Figure 1b), which is mainly composed of Holocene sands and gravels (Tsuchi and Takahashi, 1972). The Oya lowland, to the southeast of the Shizuoka Plain, is bounded by the Udo Hills to the east and by the Abe River fan to the west (Figure 1b and c). Beach ridges and dunes up to 10 m high protect the lowland from Suruga Bay (Figures 1c and 2). Previous research revealed that the main part of the beach ridges formed during the Holocene transgression and held an embayment or lagoon, the forerunner of the lowland (Tsuchi and Takahashi, 1972). The landward margin of the Oya lowland broadly corresponds to the shoreline at 6–7 ka. At present, a large area of the Oya lowland has an artificially raised ground level (by c. 2 m), and has a height of 7–8 m above mean sea level (a.m.s.l.). According to Kitamura et al. (2011), the near-surface geology (up to c. 8 m deep) consists of alternating beds of clay and sand, mainly deposited in a lagoonal environment. This sequence also contains the Kikai-Akahoya (K-Ah) tephra layer, erupted at around 7300 cal. yr. BP (Kitagawa et al., 1995), in its lower section (Figure 3).
The coastline in the study area is wave dominated and microtidal, with a maximum tidal range of 160 cm on spring tides (gauged at Shimizu, which is 10 km northeast of the study area). The foreshore deposits are mainly well-sorted coarse sand with some pebbles. The backshore deposits consist mainly of well-sorted coarse sand. These coastal deposits do not contain molluscan shells or microfossils (Kitamura et al., 2011), due to the high-energy regime and unstable substrates that prevent benthic taxa from inhabiting these environments. The shoreface slope is relatively steep, reaching water depths of 20 m within 3 km of the coast (Shiba et al., 1990). According to Nemoto et al. (1988), sea floor deposits are mainly composed of gravel (<5 m deep) and well-sorted sand (5–30 m deep).
Historical background of the study area
Historical evidence of tsunamis in Shizuoka Prefecture shows that the area has been affected by six major tsunami events between the ad 1096 Eicho earthquake and the 1944 Tonankai earthquake. The estimated wave height around the coast of Suruga Bay was up to 6 m for the 1854 Ansei Tokai (Figure 1b) and 1707 Hoei earthquakes, but less than 2 m for the 1944 Tonankai earthquake (Watanabe, 1998); the 1944 earthquake did not rupture the plate boundary along the Suruga Trough. However, there are no historical documents suggesting the occurrence of tsunamis on the Oya lowland (Hatori, 1977).
In addition to the tsunamis originating from the Nankai and Suruga troughs, the Shizuoka area has been affected by tsunamis that have traveled considerable distances (teletsunamis). Teletsunamis that originated near Chile in 1960 and 2010 had wave heights of 1.3 and 0.5 m, respectively (Japan Meteorological Agency, 2012; Watanabe, 1998). According to Satake et al. (1996), the estimated height of the tsunami caused by the ad 1700 earthquake in Cascadia, off the Pacific coast of North America, was 2 m along the Shizuoka coast. The tsunami height associated with the 2011 Tohoku-oki earthquake was 1.0 m in this area (Japan Meteorological Agency, 2011).
Severe storm surges have also been recorded in the study area, and according to Arakawa et al. (1961), the three storm events of ad 1611, ad 1662, and ad 1953 are the largest to have occurred here. However, these events did not cause severe damage in the Oya lowland. We expect that the Oya lowland has not experienced any marine flooding related to storm events over the past 400 years.
Methods
A total of seven conventionally drilled cores were recovered for this study (Figure 1c). All cores were continuous, and were 8 m long with a diameter of 6 cm. One extra core was drilled at Site 1 to compensate for the lack of stratigraphic data from this site in the study of Kitamura et al. (2011). Coring sites were arranged along the longitudinal axis of the Oya lowland with a horizontal interval of 50–300 m (Figure 1c). The elevation of the coring sites was determined using an automatic level. The lithology, sedimentary structures, and macrofossil content of the cores were described, and a preliminary facies identification made. Further interpretation of the depositional environments was carried out by integrating the lithological and paleoecological (microfossil) data. The cores were divided into 1-cm-thick subsamples (c. 4.5 g), and the following analytical techniques were applied to the sediments.
Criteria for identifying tsunami deposits
Deposits from river flooding and storm surges (washover) may have similar sedimentary characteristics to tsunami deposits. We first separated the marine inundation deposits from the river flood deposits using lithological features such as grain roundness and sedimentary structures.
The structure of sediment deposited by tsunamis, which have much longer wavelengths than storm waves, may also provide criteria to differentiate the tsunami deposits from storm deposits (e.g. Fujiwara and Kamataki, 2007; Naruse et al., 2010; Switzer and Jones, 2008). Tsunami deposits often consist of multilayered sand beds composed of alternating graded sand sheets and mud drapes (e.g. Fujiwara, 2008; Fujiwara et al., 2012; Naruse et al., 2010). The multilayered structure records the repeated upflow and return flow (graded sand sheets), intercalated with slack-water periods during the transition between the two flows (mud drapes). We aimed to characterize the multilayered sand beds using grain-size distribution data.
Additionally, we aimed to discriminate between tsunami deposits and storm deposits using a fossil proxy. One useful indicator in this regard is the changing sedimentary environment caused by the coastal uplift and subsidence related to the seismic cycle. As mentioned above, gradual subsidence during the interseismic period, and rapid coseismic uplift, are typical of the study area. If such an abrupt environmental change coincides with marine inundation deposits, the deposits are most likely to be tsunami deposits associated with a great subduction zone earthquake (e.g. Atwater, 1987; Nelson et al., 1996b, 2008).
Grain-size and roundness analysis
Beach deposits are continuously winnowed by wave and coastal currents, and generally consist of relatively well-sorted and well-rounded grains when compared with river sediments. Dune sand is mainly derived from the beach, and so has similar features to beach sands. Consequently, the sorting and roundness of sand grains could be used as an indicator to discriminate between riverbed and washover deposits in the Oya lowland (Kitamura et al., 2011).
The grain-size of both the core sediments and recent shoreface/beach and dune sediments from around the study area was analyzed (Figure 1c). For the core samples, we focused on the Type A sand beds reported by Kitamura et al. (2011) and the coarsest portions of the Type B sand beds. Analysis was conducted using the wet-sieving method at intervals of 1.0 phi between −3 phi (8 mm) and 4 phi (63 µm).
Grain roundness was measured in 23 samples (one sample from each sand bed) from the cores, and two samples of recent beach deposits. For each sand bed, we analyzed grain roundness in the sample with the coarsest mean grain-size. Each sample was cemented and arranged on a slide for examination under the microscope. In this paper, we focus on the mudstone fragments, because they are the major components of the samples. Roundness was calculated according to the scheme of Krumbein (1941) using more than 100 fine-sand-sized grains.
Diatom analysis
Diatom assemblages are reliable indicators of modern and ancient coastal environments, and are widely used as proxy indicators of depositional conditions, such as salinity and water depth, to support the lithological data (e.g. Kosugi, 1988). Changes in diatom assemblages in coastal sequences have been used to reconstruct the relative sea-level changes associated with crustal movements during the earthquake cycle (e.g. Atwater and Hemphill-Haley, 1997; Dawson et al., 1996; Mamo et al., 2009; Nelson et al., 1996a, 2008; Sawai et al., 2004, 2012; Shennan and Hamilton, 2006).
We analyzed a total of 32 subsamples from the clay beds at Sites 1 and 2 that were selected following a consideration of the lithofacies preserved in the cores. Preparation for microscopy followed Kosugi (1993), and diatom valves were analyzed under an oil immersion microscope. Identification of diatom species and floras was based on Kosugi (1988) and Ando (1990).
Radiocarbon dating
Radiocarbon dates (Table 1) were obtained from organic material using the accelerator mass spectrometry by Beta Analytic Inc., and they provided a chronological framework for this study. Ages were calibrated using the OxCal4.1 program (Bronk Ramsey, 2009) and the IntCal09 data set (Reimer et al., 2009).
14C dates from the study area obtained using the accelerator mass spectrometry technique (dating by Beta Analytic Inc.).
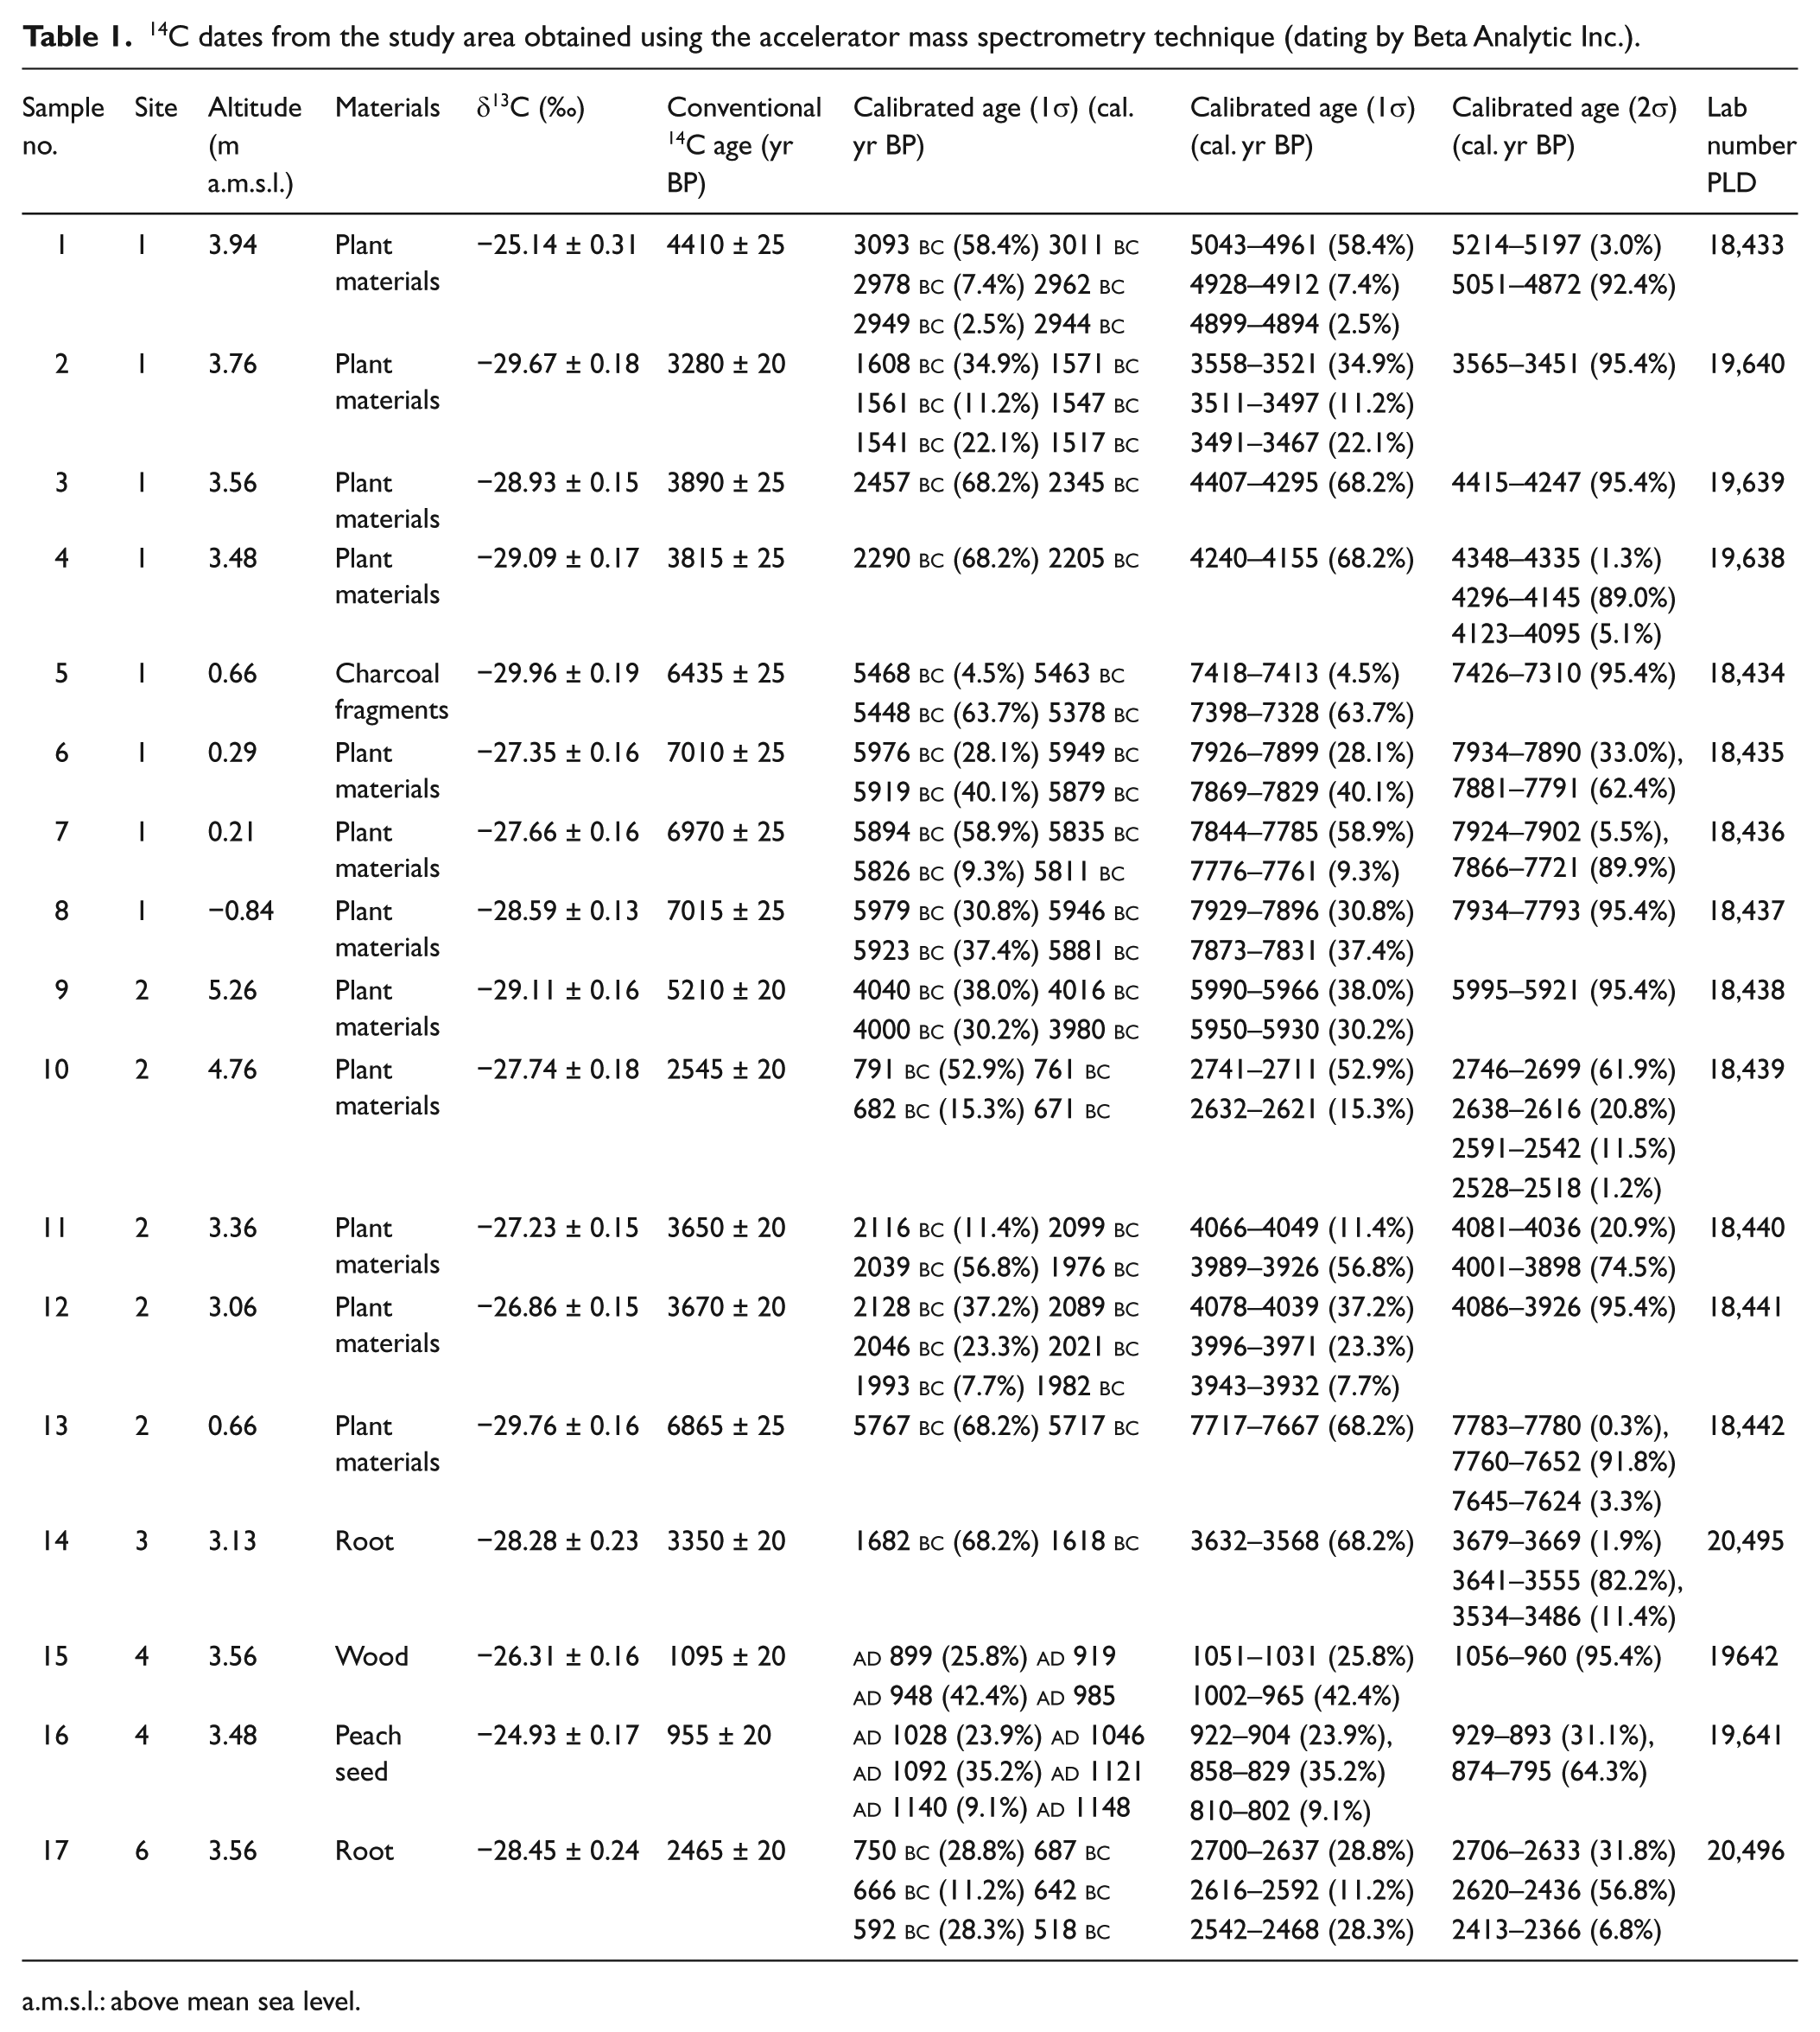
a.m.s.l.: above mean sea level.
Results
The lagoon–delta system identified in the sample cores was classified into three sedimentary facies based on a combination of the lithology, sedimentary structures, grain-size, and fossil content of the deposits (Figures 3–5): Facies 1 (shoreface/beach), Facies 2 (dune), and Facies 3 (lagoon/floodplain). Facies 3 is composed of silt and clay beds, and is intercalated with the sand and gravel beds.
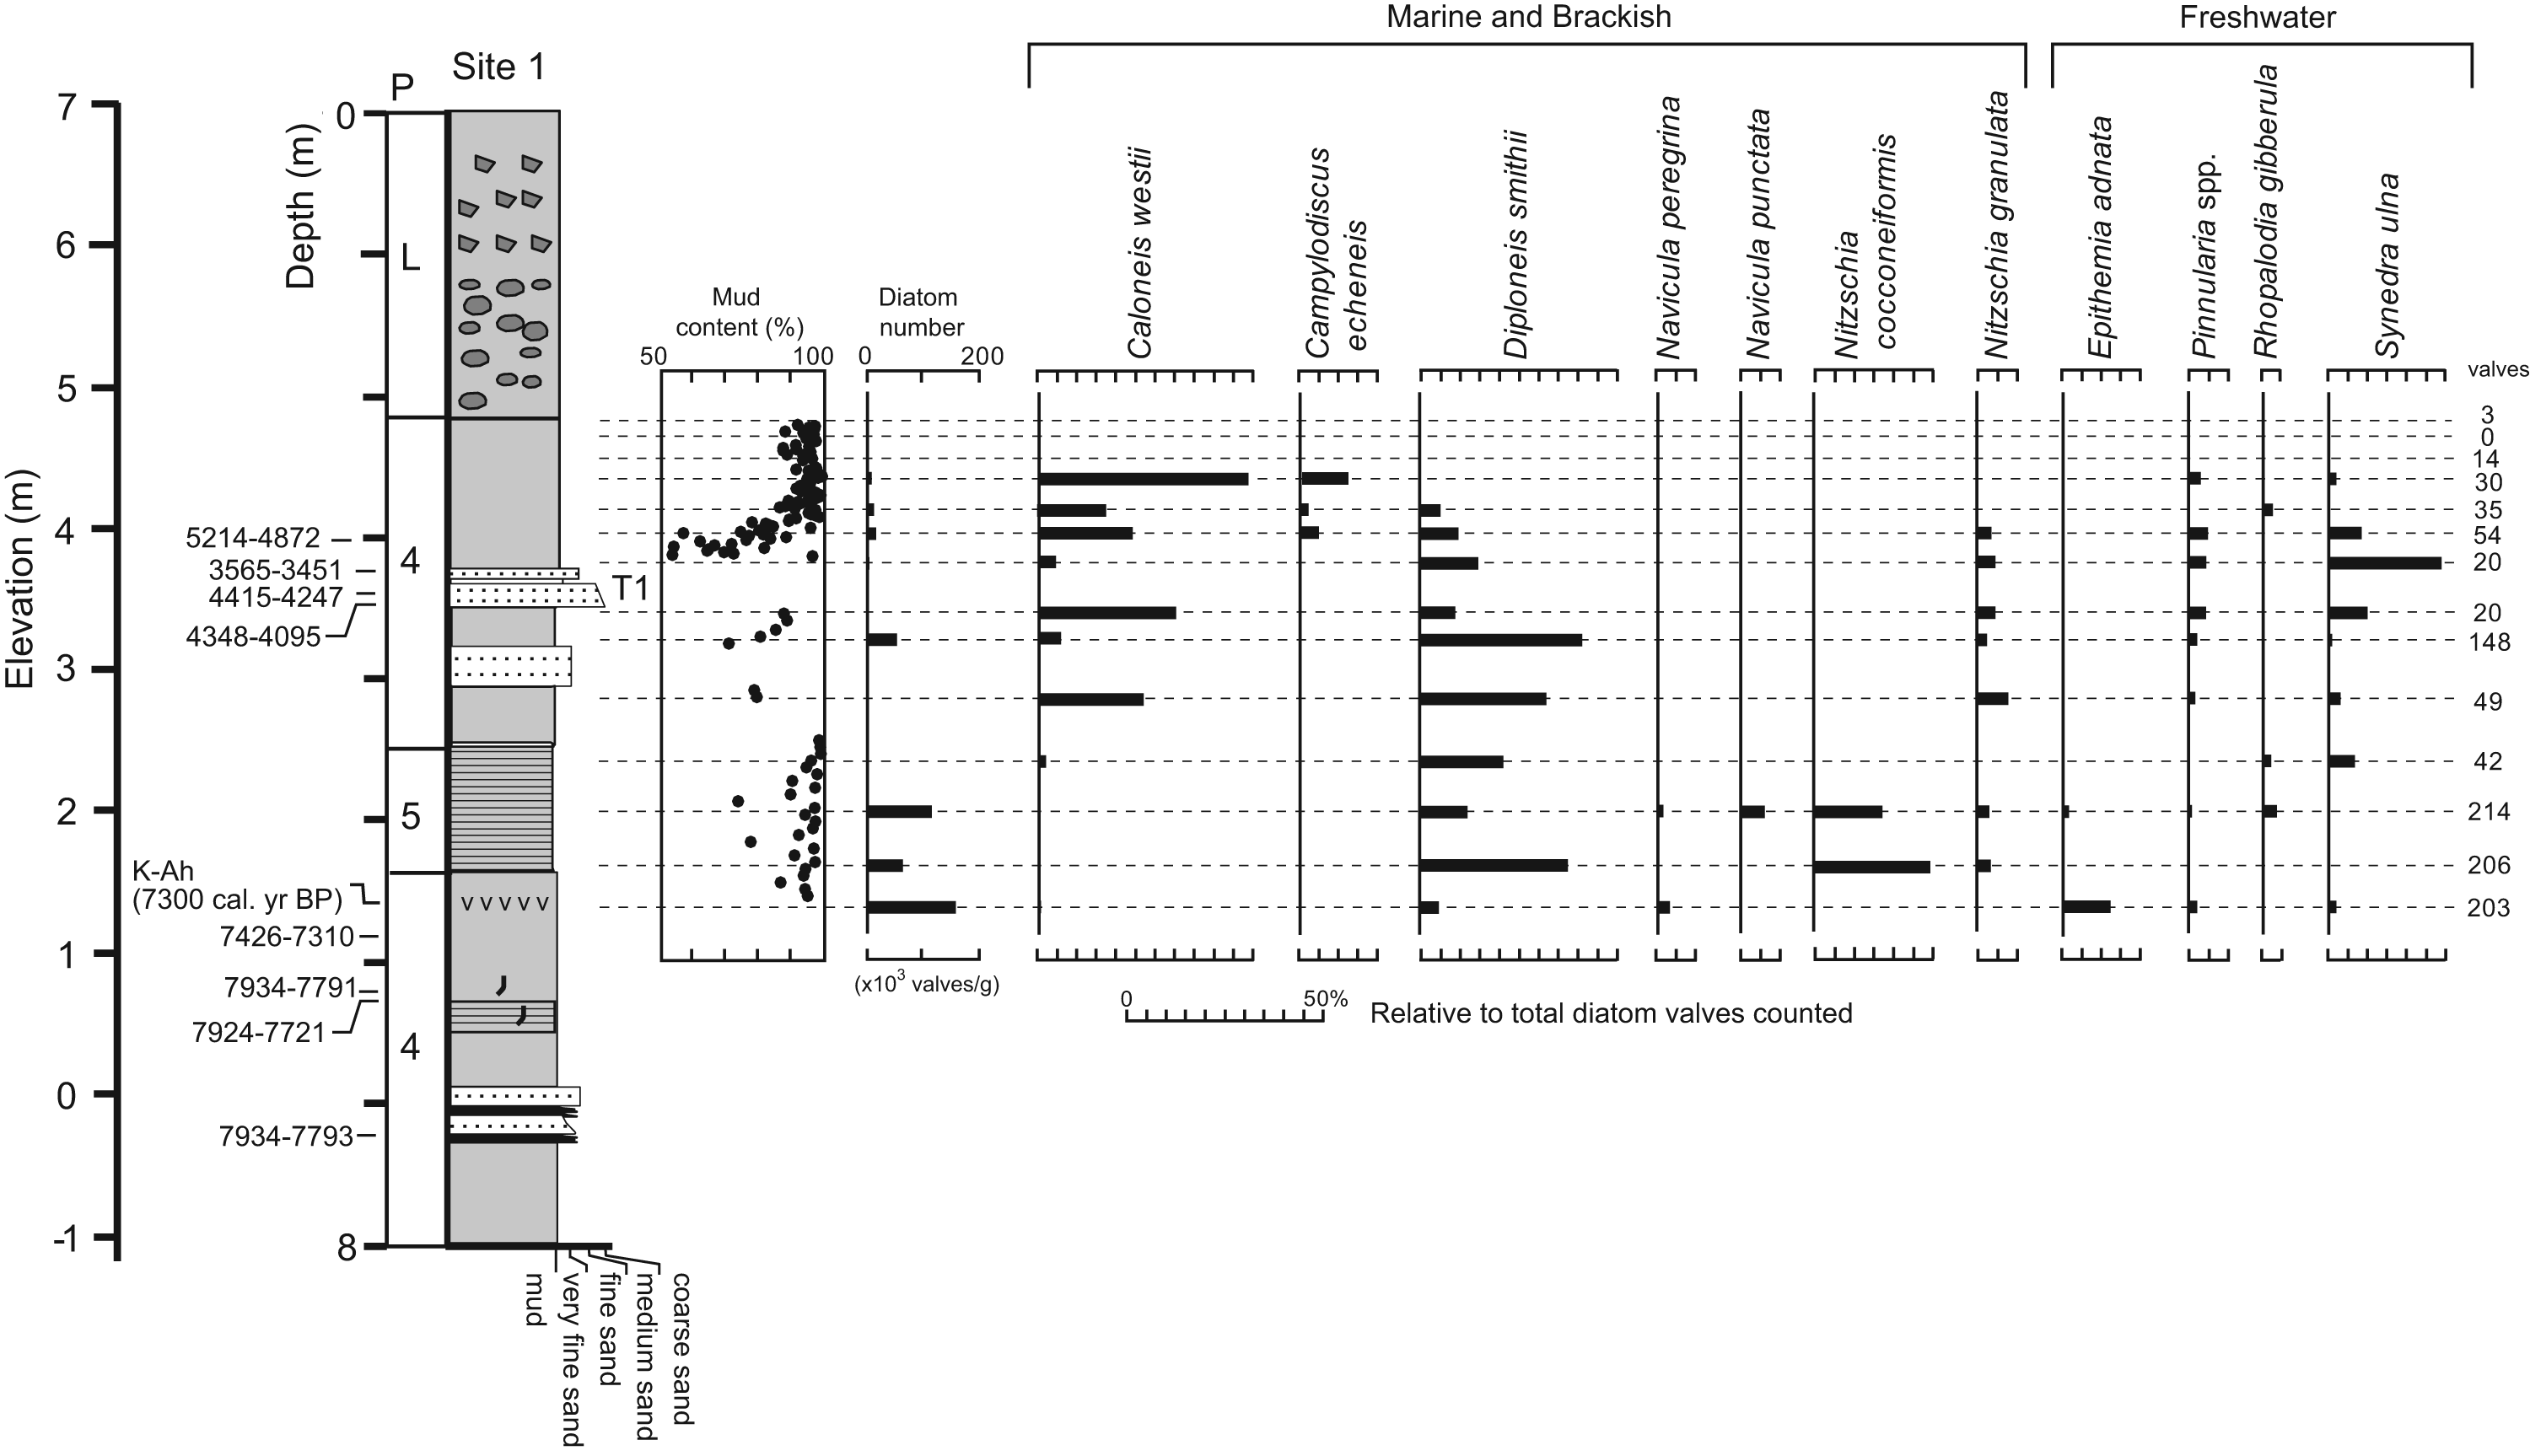
Fossil diatom assemblages and mud content at Site 1.
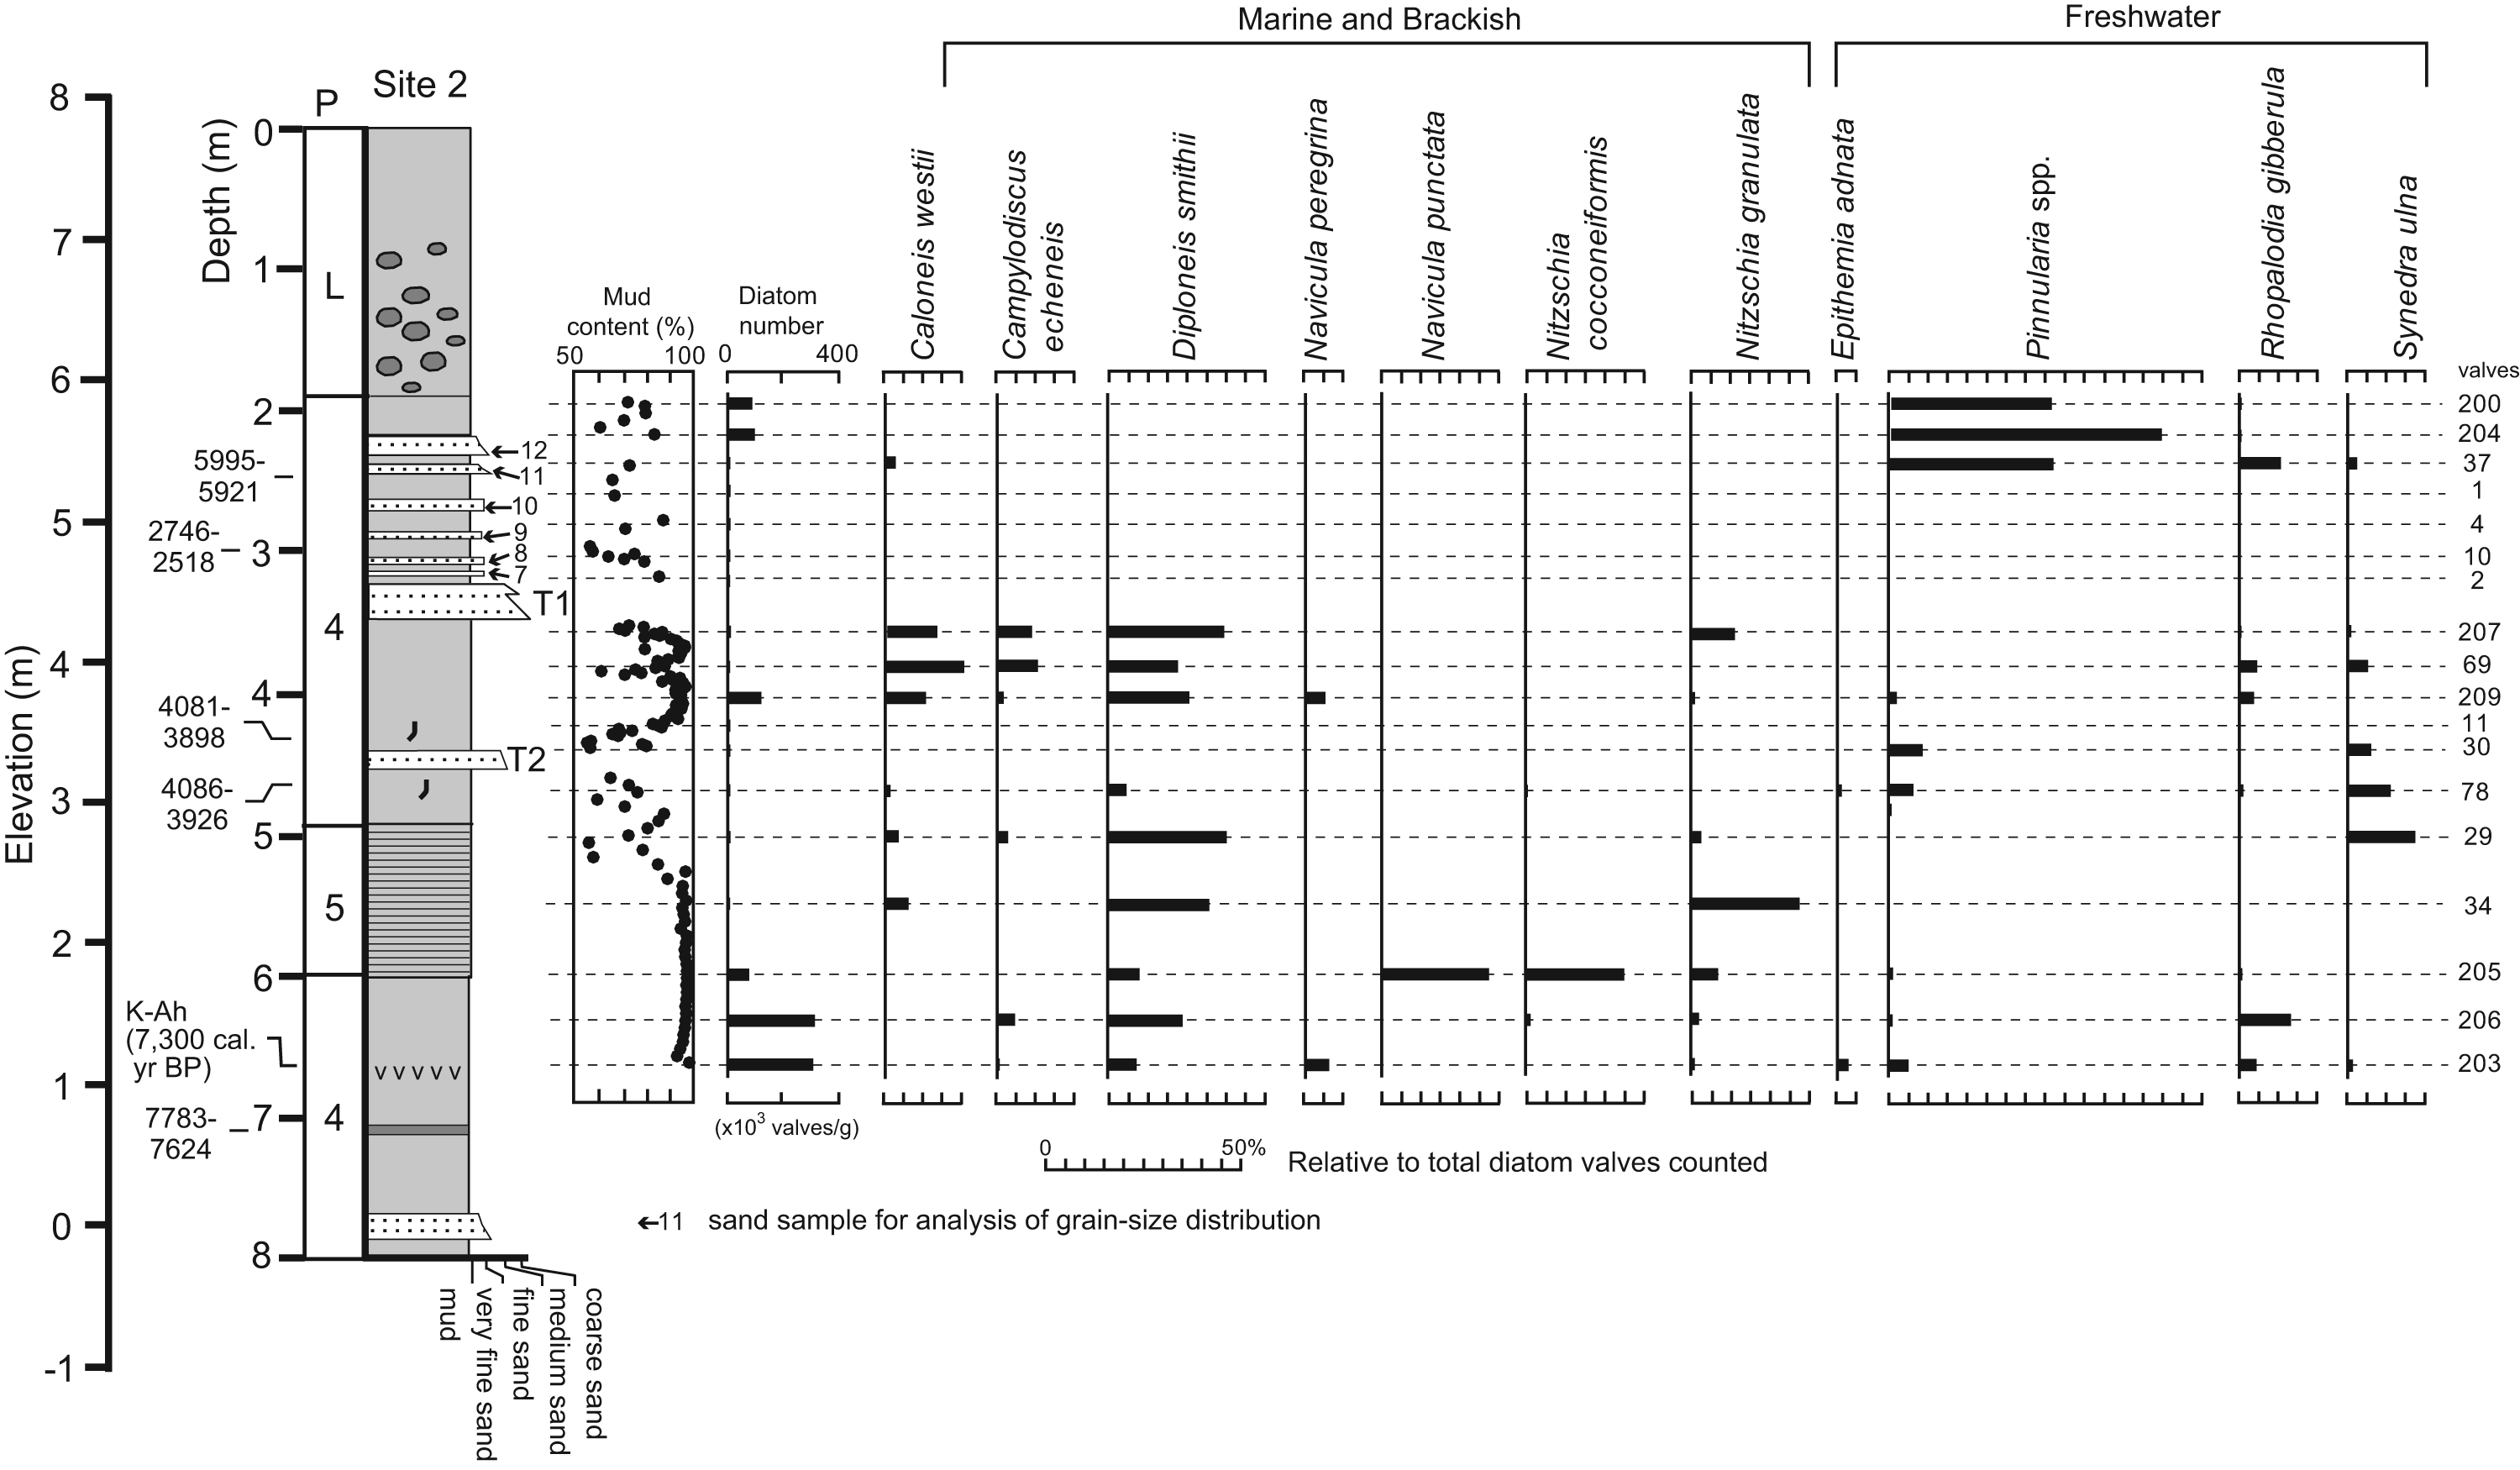
Fossil diatom assemblages and mud content at Site 2.
Depositional facies
Facies 1 (shoreface/beach deposits)
This facies was found at Site 7 (−3.0 to +5.1 m a.m.s.l.), which was located on the beach ridge (Figure 1c). It is characterized by well-sorted medium sand beds with some gravels (<4 cm in diameter) in its lower part, and alternating beds of well-sorted sand and rounded pebble-size gravels in its upper part (Figure 3). The sand and gravel beds are 0.4–1.2 m thick, and generally show normal or inverse grading. The size and morphology of the gravels is similar to the gravels on the present-day beach in the study area. Facies 1 shows a general coarsening-upward trend and is overlain by Facies 2 (dune deposits). Mean values of grain roundness for the shoreface deposits (0.38–0.44) are slightly higher than those of the recent beach deposits (0.34–0.35; Figure 6). This is similar to studies elsewhere (e.g. Costa et al., 2012).

Grain shape histograms for fine-sand-sized mudstone fragments from sandy sediments. Total sample size (n) and mean value (
The well-sorted coarse sediments and stratified beds with no muddy matrix suggest that this facies was deposited under the influence of strong waves or currents, or both. The absence of marine fossils also supports this interpretation. The upward-coarsening trend within this facies indicates that the deposit represents a regressive phase. The stratigraphic position and vertical facies succession suggest that this facies represents shoreface and overlying gravelly beach deposits.
Facies 2 (dune deposits)
Facies 2, which was present only in the upper part of the Site 7 sequence (5.1–6.2 m a.m.s.l.; Figure 1c), consists of well-sorted medium sand beds showing a fining-upward trend (Figure 3). Mean values of grain roundness range between 0.45 and 0.46, and are similar to those of the shoreface deposits (Figure 6).
The sedimentary features and nature of the sampling sites, which is located at the beach ridge, clearly show that these sand beds are eolian dune deposits covering the beach deposits. The fining-upward trend in the sand beds suggests either a regressive process (i.e. an increase in the transport distance by wind) or storm deposits. The pebbles in this facies are interpreted as a washover deposit associated with storm.
Facies 3 (lagoon/floodplain deposits)
Facies 3 was found in all cores except Site 7 (Figures 3–5 and 7). Foraminifera or volcanic clasts, except the K-Ah tephra layer, were not found in any of the sediment samples. Based on its lithological characteristics and occurrence, Facies 3 was subdivided into Subfacies 3.1, which mainly consists of clay beds, and Subfacies 3.2, which consists of gravel beds and occurs at Sites 4 and 5.
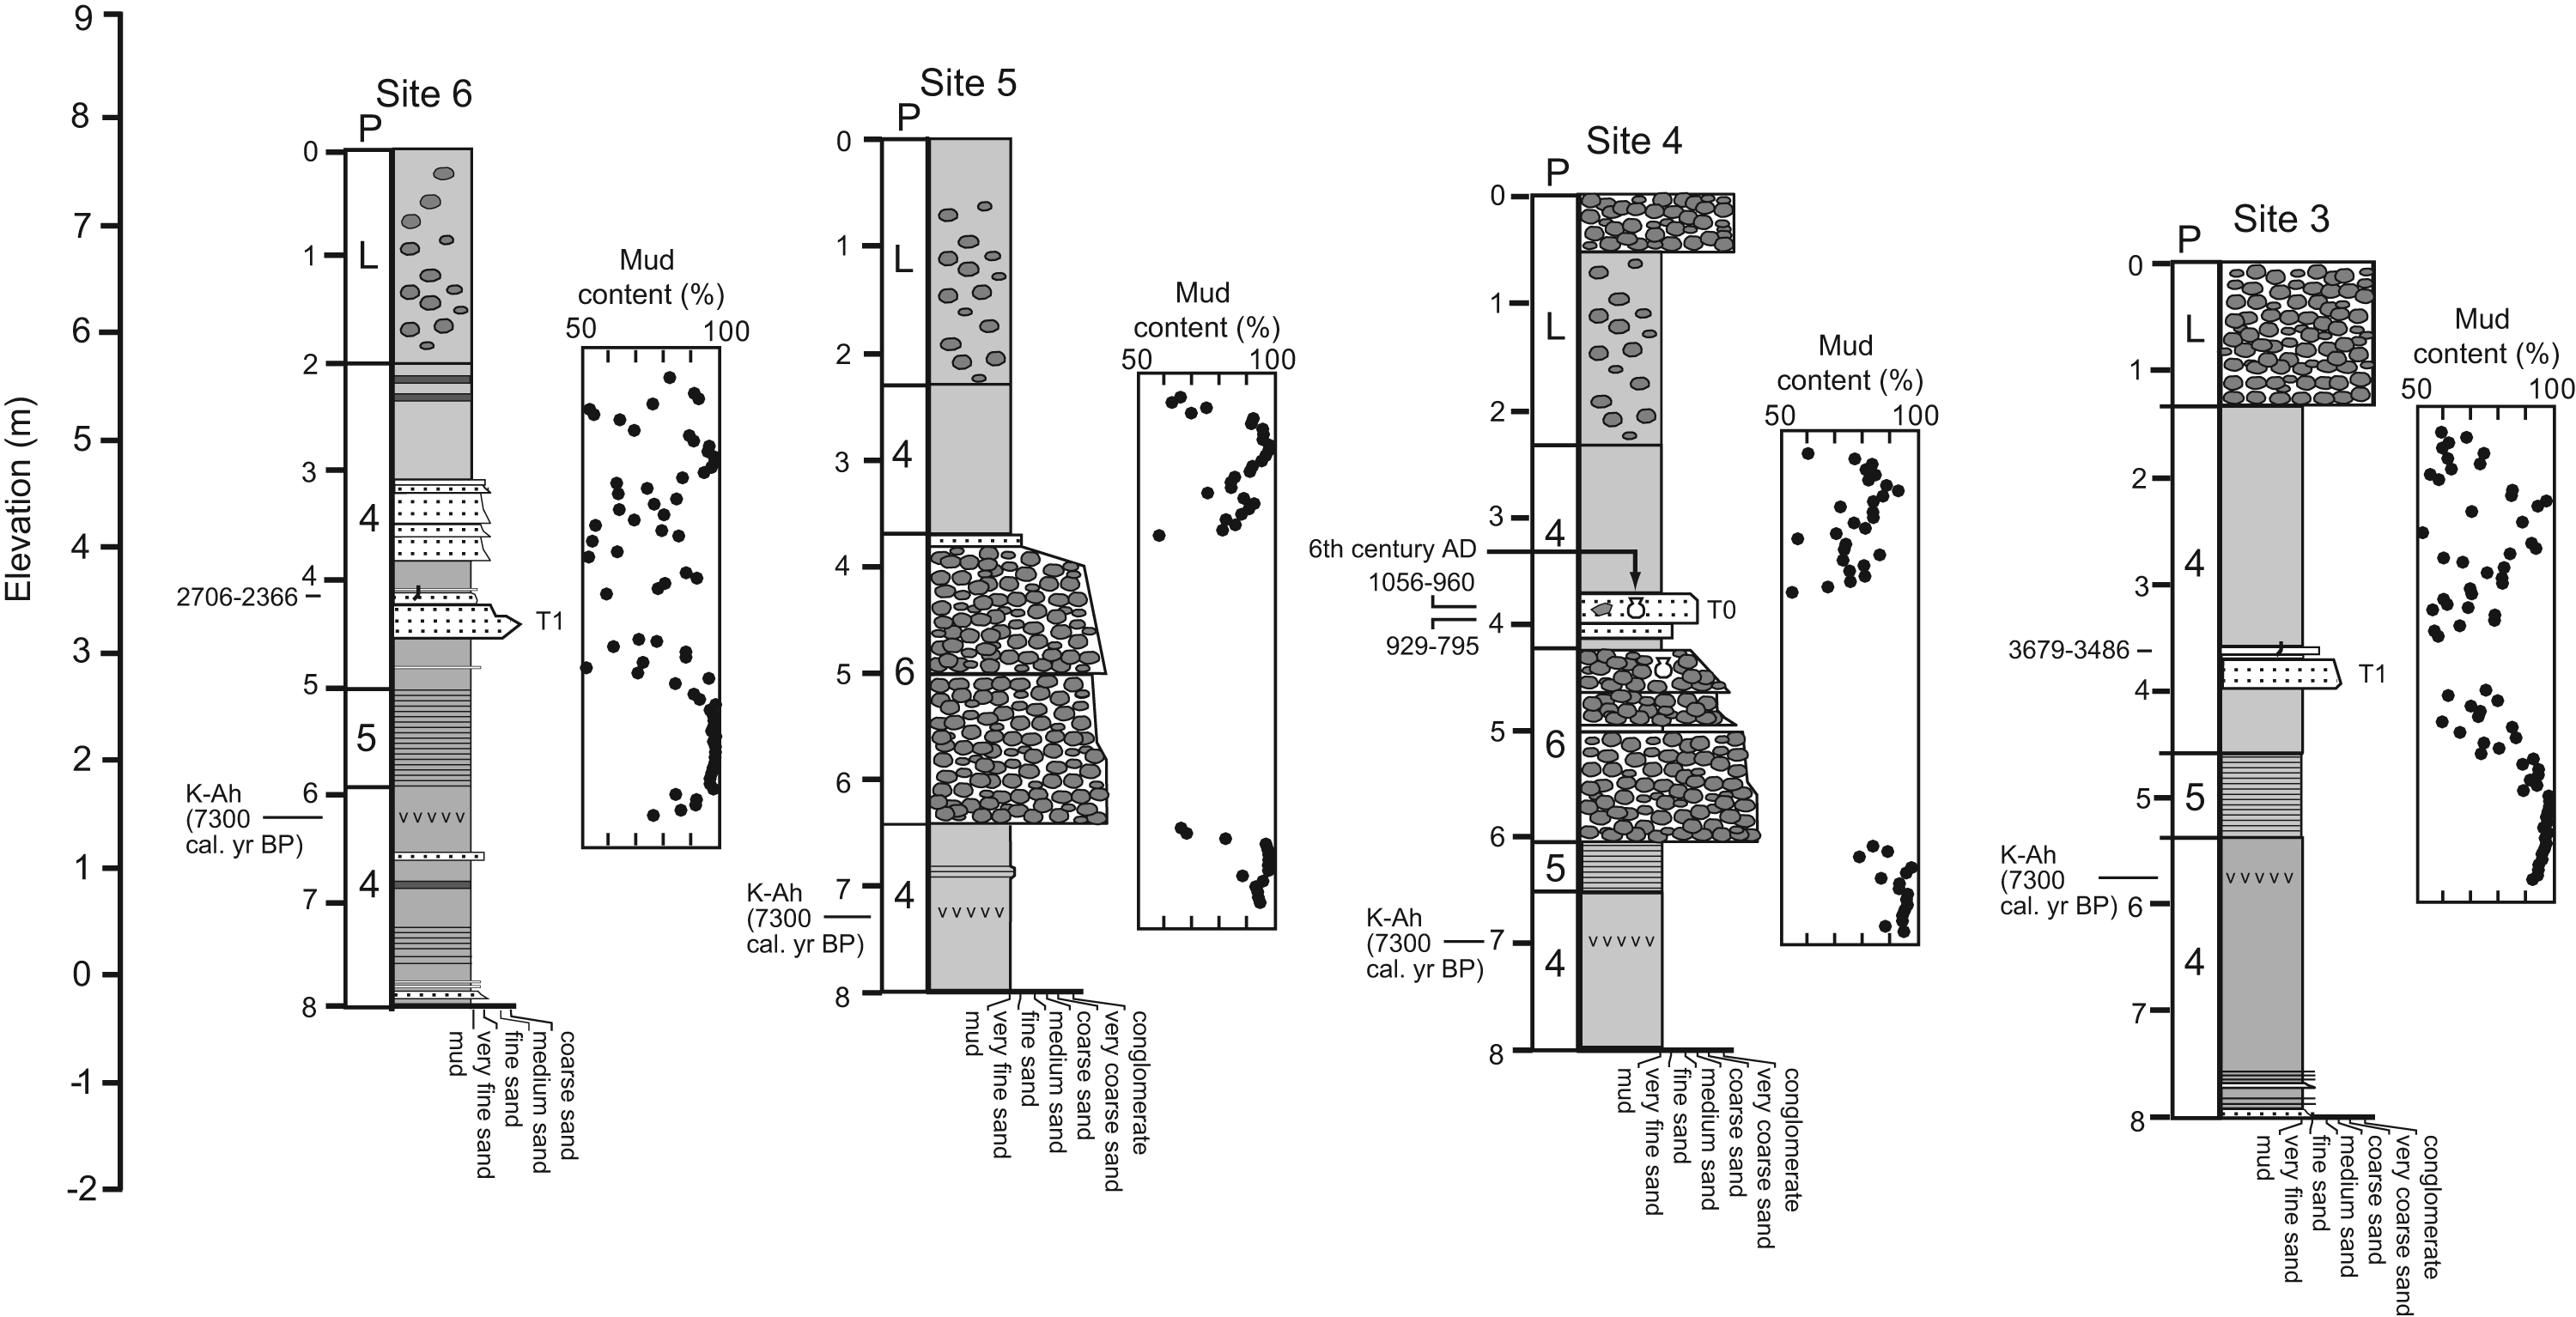
Mud content at Sites 3–6.
Subfacies 3.1 is a sequence of alternating silty clay and clay beds with intercalations of sand beds up to 34 cm thick. The silty clay beds are generally massive and dark-bluish black in color, while the clay beds show fine (millimeter-scale) parallel-laminations and mark the lower to middle part of the facies (Figure 3). Diatom assemblages in Subfacies 3.1 show a clear contrast between the massive silty clay beds and the laminated clay beds (Figures 4 and 5). The massive silty clay beds are marked by the mixed occurrence of the marine species Caloneis westii and Diplonesis smithii, and freshwater taxa such as Pinnularia spp. and Synedra ulna. The laminated clay beds are dominated by the marine and brackish benthic species D. smithii (e.g. Sawai et al., 2008), and especially by the high-salinity species Nitzschia cocconeiformis (e.g. Kashima, 2008) in its lower part. The laminated clay beds contain limited occurrences of freshwater species.
Subfacies 3.2 consists of alternating pebble-size conglomerate beds with a clast-supported framework and is enclosed within Subfacies 3.1 (Figure 3). It ranges from 2.35 to 2.73 m in thickness. Each conglomerate bed is up to 1.4 m thick and shows normal grading. Subfacies 3.2 shows a fining-upward sequence as a whole. The distribution of grain roundness in the fine-grained sand of this subfacies is leptokurtic, with a mean grain roundness of 0.42 (Figure 6). At Site 4, fragments of pottery were incorporated within the gravel beds, one of which was dated to the 6th century based on its archaeological design.
Facies 3 is interpreted as a lagoon/floodplain system comprising muddy lagoonal and back-marsh deposits (Subfacies 3.1) as well as gravelly river-channel deposits (Subfacies 3.2). It forms the upper part of the Holocene sedimentary sequence. Our cores were too widely spaced to reconstruct the complete geometry of Subfacies 3.2, or the detailed lithological variations of the floodplain sediments. It is often difficult to distinguish between crevasse-splay, channel, and residual channel deposits; therefore, a distinction is made between muddy lagoon/back-marsh deposits and gravelly channel-fill deposits.
The lower-middle part of Subfacies 3.1 is marked by laminated clay beds with marine/brackish diatom assemblages. The laminated clay is surrounded by massive silty clay with a mixed assemblage of marine and freshwater diatoms. This turnover of diatom assemblages suggests a temporal change in seawater influx into the lagoon/floodplain system. Subfacies 3.2 consists of coarse and graded sediments that were deposited under the influence of strong currents, and its restricted distribution across the lagoon/floodplain system suggests that it is a channel-fill deposit.
The K-Ah tephra layer (c. 7300 cal. yr BP) was identified beneath the laminated clay beds in all cores, except at Site 7 (Figure 3). A total of 17 radiocarbon dates were obtained from Subfacies 3.1 (Figure 3; Table 1). Five samples below the K-Ah tephra layer (Samples 5–8 and 13) show conformable ages with the tephra, indicating that the lower part of Subfacies 3.1 formed during the period 8000–7300 cal. yr BP. Two radiocarbon dates (Samples 11 and 12) suggest that the laminated clay was deposited before 4000 cal. yr BP. Most of the samples from the upper part of Subfacies 3.1 (2, 4, 10 and 14–17) suggest ages younger than about 3500 cal. yr BP. Samples 1 and 3 from Site 1 and Sample 9 from Site 2 yield older ages (5214–4872, 4415–4247, and 5995–5921 cal. yr BP, respectively). These older ages were rejected because they represent reworked older deposits associated with either erosion or bioturbation.
An increased seawater influx into the study area, marked by the base of the laminated clay beds just above the K-Ah tephra layer, corresponds to the peak of the Holocene transgression around Japan (Nakada et al., 1991). From this, we can infer that Subfacies 3.1 represents a single transgression–regression cycle, and we interpret the sequence of depositional environments as estuarine during the transgressive stage (lower massive clay beds), a salty lagoon at the peak of the transgression (laminated clay beds), and lagoonal to back-marsh during the high sea-level stand and regressive stage (upper massive clay beds).
Identification of marine incursion sand beds
Roundness and grain-size data for the sand beds sampled from the cores and the modern deposits are shown in Figures 6 and 8, respectively. The sand beds can be separated into two groups based on mean grain-size and mud content. One group contains the shoreface and dune deposits of Site 7, as well as the present-day beach sand (Figure 8), and this group corresponds to Type A of Kitamura et al. (2011). The other group plots in the region of finer mean grain-size and higher mud content (Figure 8), and corresponds to the Type B sand beds of Kitamura et al. (2011). The sand bed at 3.20–3.35 m a.m.s.l. (core depth: 4.56–4.41 m) at Site 2, which was identified as possible Tsunami Deposit 2 by Kitamura et al. (2011), shows intermediate characteristics between Types A (well rounded) and B (finer mean grain-size and higher mud content). Two Type A sand beds were identified in the cores. On the basis of stratigraphic correlation, we labeled them as Sand Beds T2 and T1 in ascending order (Figure 3). Sand Bed T1 is widely preserved along a 0.8-km transect in the study area, but Sand Bed T2 was found only at Site 2. An additional Type A sand bed (Sand Bed T0), recorded at Site 4, is 30 cm thick and composed of medium sand (Figure 8).
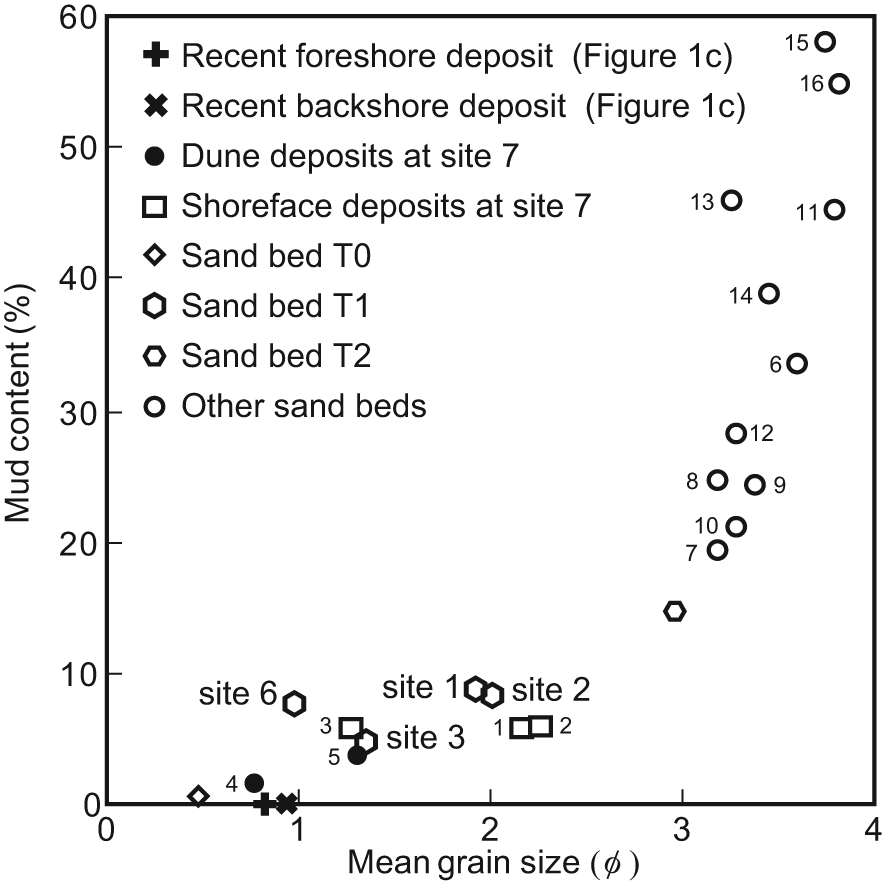
Mean grain-size plotted against mud content for Sand Beds T0, T1, and T2; other sand beds in the studied cores; and present-day beach deposits. Sample 17 is not plotted in the figure because the mean grain-size was greater than −1 phi.
The grain-size distribution and roundness of the Type A sand beds are similar to those of the ancient shoreface and recent beach deposits (Figures 6 and 8), indicating that they are probably washover deposits. The lower contact with the lagoonal deposits is mainly sharp and erosive, and the sand beds are characterized by cross-laminations in some cores (Kitamura et al., 2011). These sedimentary features suggest deposition from a high-energy flow. The upper contact with the lagoonal deposits is also relatively sharp.
The presence of multiple graded structures in the Type A sand beds is clearly shown in the results of the grain-size analysis. For example, Sand Bed T1 at Site 1 was classified into a lower and an upper sand layer, separated by a mud drape (Figures 9 and 10). The upper sand layer is generally thinner and finer than the lower layer. Sand Bed T1 at Site 6 was also separated into lower and upper sublayers by a mud drape. Inverse-normal grading is clearly observed in the lower layer of Sand Bed T1 at Site 6 (Figure 9). Based on the presence of the mud drapes (suggested by the high mud content of samples from the sand bed), we distinguished inverse and normally graded sublayers (Figure 9), and the number of distinguishable sublayers was three for Sand Bed T2 at Site 2, five for Sand Bed T1 at Site 2, and five for Sand Bed T1 at Site 3 (Figure 9).
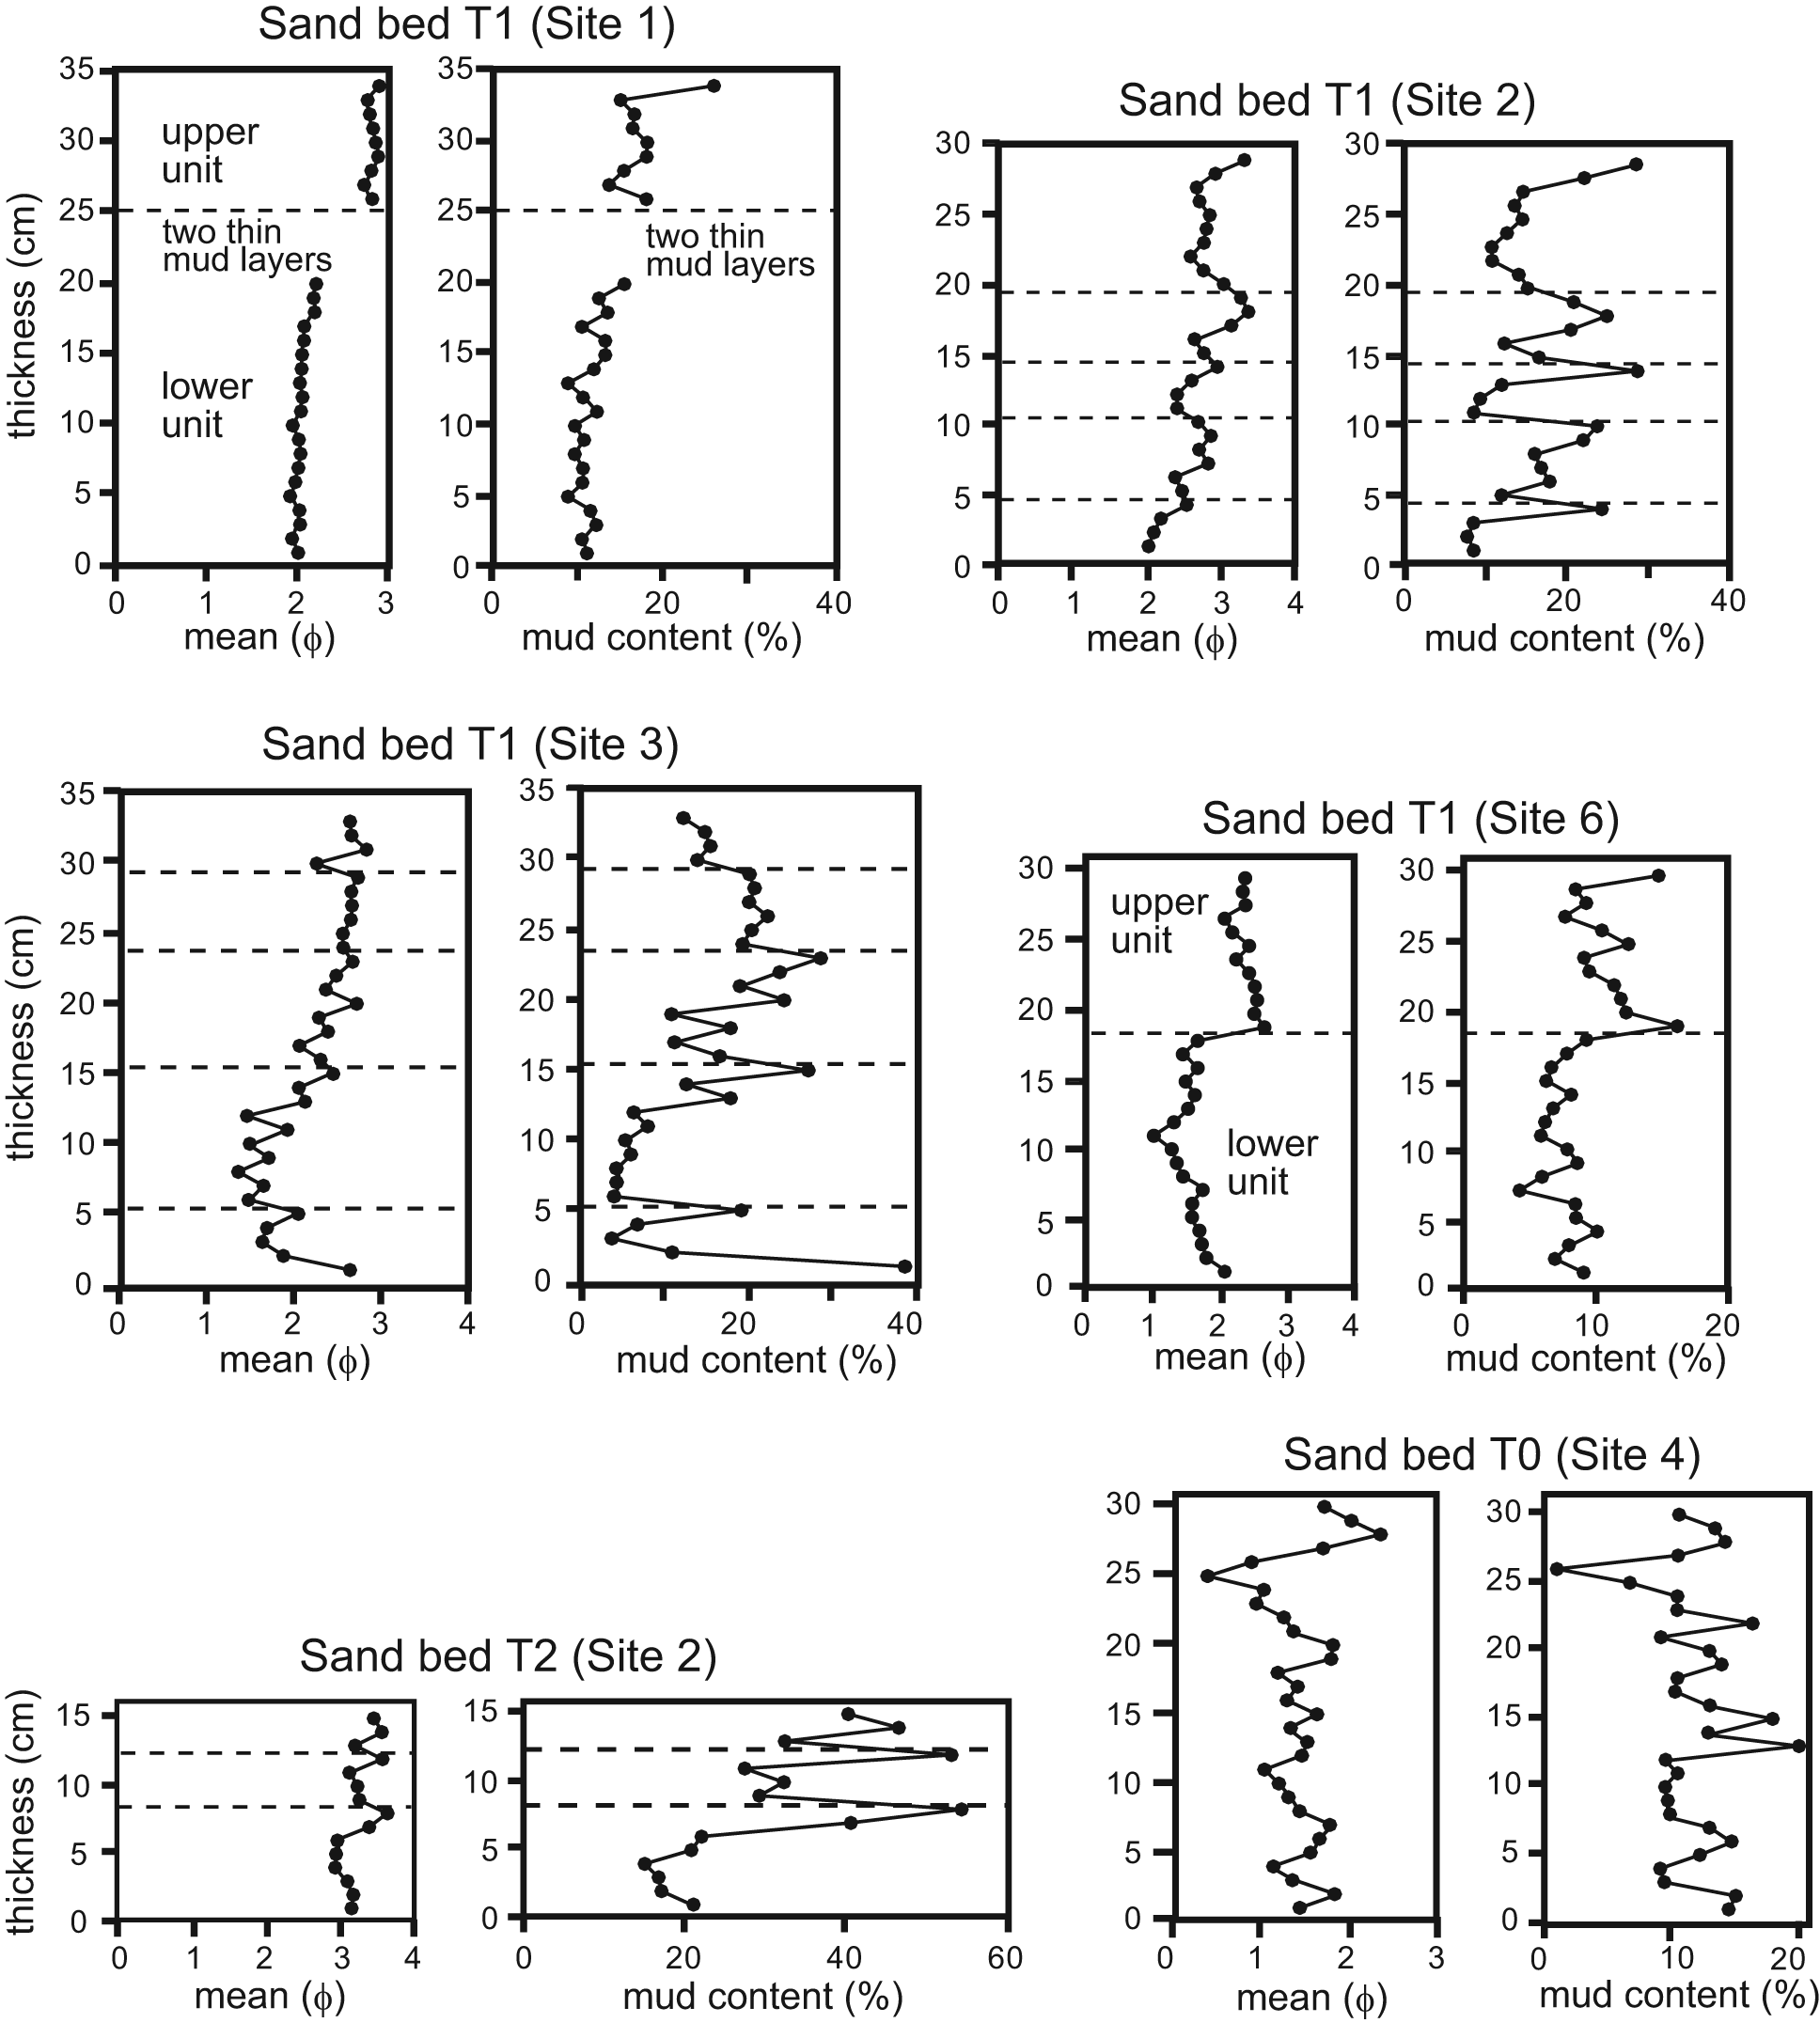
Vertical profiles of grain-size and mud content in Sand Beds T0, T1, and T2.
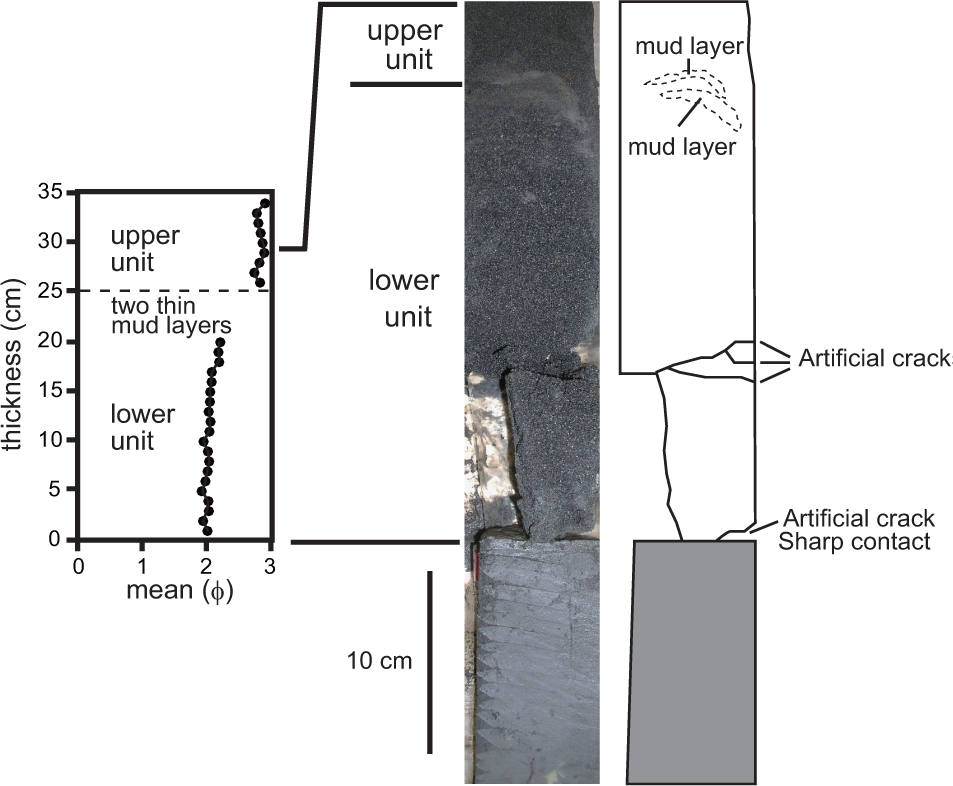
Sedimentary structures in Sand Bed T1 at Site 1.
Radiocarbon dating
The two radiocarbon dates from just below and above Sand Bed T2 (Samples 11 and 12, respectively) indicate that the sand bed was deposited around 4000 cal. yr BP. However, as the youngest 14C age of the wood samples from Sand Bed T1 is 3565–3451 cal. yr BP (Sample 2), the actual depositional age of the bed appears to be younger than 4000 cal. yr BP. On the other hand, the oldest age obtained from roots recovered from the bed is 3679–3486 cal. yr BP (Sample 14), providing a maximum depositional age. Thus, the depositional age of Sand Bed T1 is estimated to be 3565–3486 cal. yr BP.
Two fragments of plant material were also recovered and dated from Sand Bed T0 at Site 4. Their ages are in the ranges 1056–960 cal. yr BP (Sample 15) and 929–795 cal. yr BP (Sample 16). Consequently, the depositional age of Sand Bed T0 is constrained to the period around 900–1000 cal. yr BP, if we assume that the pottery fragment, which was dated to the 6th century, was either reworked from underlying deposits or transported from an older archaeological site.
Diatom analysis
The preservation of diatoms is generally poor in sandy sediments, although silt and clay usually yield sufficient diatoms valves for paleoenvironmental reconstruction. Marine and brackish diatoms such as D. smithii and C. westii dominate the diatom assemblages in the silt and clay beds beneath Sand Bed T1. Small numbers of freshwater species were also found in the sediments beneath Sand Bed T1.
At Site 1, marine and brackish diatom species show an increase-upward trend toward Sand Bed T1, but decrease temporarily just above Sand Bed T1, before again increasing upward in the clay beds (Figure 4). The freshwater diatom S. ulna shows the opposite trend to the marine and brackish species; that is, it shows temporary increases just above the Sand Bed T1 before decreasing upward again through the silt beds.
At Site 2, the vertical changes in diatom species beneath Sand Bed T1 are similar to those at Site 1. Marine and brackish diatoms such as D. smithii and C. westii show an upward increase in abundance toward Sand Bed T1, while the freshwater diatom S. ulna shows a gradual upward decrease (Figure 5). A small number of diatom valves were found in the clay beds just above Sand Bed T1. Freshwater diatoms such as Pinnularia spp. dominate over the marine and brackish species in the upper horizon at Site 2.
Discussion
Identification of tsunami deposits
Lithological features (especially grain roundness) suggest that the Type A Sand Beds T0, T1, and T2 are washover deposits. The sedimentary features of these sand beds, the erosional basal surface, and presence of mud clasts suggest the influence of erosive currents on the muddy substrate. The inverse-normal grading in the sand beds also suggests deposition from a high-energy flow (e.g. Le Roux and Vargas, 2005; Lowe, 1982; Moore et al., 2011; Sohn, 2000). However, such sedimentary features are commonly observed in both tsunami and storm surge deposits. Here, we discuss the origins of Sand Beds T0, T1, and T2 based on their sedimentary structures and diatom assemblages.
Causes of multilayered sand beds
At some sites, Sand Beds T0, T1, and T2 had a multilayered structure; that is, fine alternations of graded sand sheets and mud drapes. These sand beds further show a fining-upward trend, with thinner and finer-grained sand sheets occurring in the upper section of the sand beds. Each couplet of graded sand sheet and mud drape represents a single waning sediment flow. The mud drapes were deposited from suspension under low-energy conditions, and the alternation of graded sand sheets and mud drapes suggests the repeated occurrence of sediment flows, each of which was separated by a sufficient slack-water period to allow the deposition of mud drapes. Multilayered structure is common in washover deposits but are not characteristic of tsunami deposits. When multiple washover deposits are amalgamated, they show a fine alternation of graded sand sheets and mud drapes similar to Sand Beds T0, T1, and T2. However, the general thinning- and fining-upward sequences of sand sheets in Sand Beds T0, T1, and T2 cannot be explained by multiple storm events because multilayered sand beds caused by multiple storm events would consist of sand sheets with random thickness and grain-size profiles, which reflect the difference in intensity and sediment source of each storm event.
The combination of (1) multilayered sand beds, (2) mud drapes separating each sand sheet, and (3) a general thinning- and fining-upward sequence can be a useful tool to the identification of tsunami deposits (Fujiwara, 2008; Fujiwara et al., 2012; Naruse et al., 2010). Tsunami wave trains have long wavelengths, of over tens of minutes, and each tsunami wave generates a strong sediment flow mainly at the coast, but slack-water stages sufficient to allow the formation of mud drapes also occur between each tsunami run-up and backwash depending on coastal configuration. After the biggest wave, smaller waves arrive at the coast in the later stages of the tsunami, which leads to the development of the general thinning- and fining-upward sequence seen in tsunami deposits. One typical waveform of tsunamis includes biggest wave in its middle stage (e.g. Watanabe, 1998).
Abrupt environmental change suggesting coseismic uplift
As described above, the sedimentary features suggest that Sand Beds T0, T1, and T2 were formed when a tsunami inundated the lagoon. Associated with the deposition of Sand Bed T1, a rapid environmental change was recorded in the sediments of the lagoon.
Diatom assemblages suggest an abrupt shift from a marine-brackish environment to a freshwater environment after the deposition of Sand Bed T1 at Site 1 (Figure 4). At Site 2, marine-brackish diatoms disappear abruptly after the deposition of Sand Bed T1 (Figure 5). At Sites 1 and 2, the diatom assemblages suggest that the influence of seawater gradually increased in the lagoon before the deposition of Sand Bed T1. Although local differences were observed in the change of depositional environment, the abundance of marine-brackish diatoms increased again above the Sand Bed T1 (Figure 4).
According to Carver and McCalpin (1996), coseismic land-level changes are reflected by abrupt replacement of indicative assemblages, while gradual changes expected from longer term interseismic motions involve a transition in species composition over centimeters or decimeters of stratigraphic section. We therefore conclude that the abrupt change in sedimentary environment, indicated by the changes in diatom assemblages in this lagoon on the western coast of the Suruga Bay, were not caused by build-up of dune or a regional (eustatic) sea-level change or storms, but instead by crustal movements associated with the earthquake cycle of the subduction zone fault. Both build-up of dune and a regional sea-level rise caused a transition in species composition over centimeters or decimeters of stratigraphic section. Sea level around Japan was essentially stable during the depositional period of Sand Bed T1 (e.g. Ota et al., 1990). If the environmental changes had been caused by storm events, environmental conditions would have recovered to their prestorm state fairly quickly.
As stated above, the 1854 Ansei Tokai earthquake caused uplift of the western coast of Suruga Bay by about 1.0 m. After the deposition of Sand Bed T1, the depositional environment changed abruptly from marine-brackish to freshwater (Figure 4). This shows that the study area rose after the deposition of Sand Bed T1, so reducing the marine influence. We suggest that this abrupt change in sedimentary environment was caused by coseismic uplift.
Interseismic subsidence
Interseismic subsidence is indicated between the deposition of Sand Beds T2 and T1 (Figure 5), and also following the deposition of Sand Bed T1 (Figure 4), by the gradual changes in diatom assemblages. A gradual increase in marine-brackish diatoms, and a gradual decrease in freshwater diatoms, suggests the increasing influence of the sea. This may be related to subsidence of the coast around the study area. As noted above, the Shizuoka area has been subsiding at a rate of around 6 mm/yr during the interseismic period following the 1854 Ansei Tokai earthquake.
Correlation of tsunami deposits along the Shizuoka coast
We conclude that Sand Bed T1 is a tsunami deposit related to the paleo-Tokai/Tonankai earthquake. Sand Beds T0 and T2 have similar sedimentary features to Sand Bed T1, although they lack the diatom data indicating coseismic uplift. These two Type A sand beds may have been deposited by tsunamis. We estimated the distribution of these tsunami deposits along the Shizuoka coast by comparing the depositional ages with previously identified tsunami deposits and historical documents.
The depositional ages of the Sand Beds T0, T1, and T2 were estimated to be around ad 1000, 3565–3486 cal. yr BP, and 4000 cal. yr BP, respectively, from 14C dating (Figure 3). The age of Sand Bed T0 corresponds well to the ad 1096 Eicho Tokai earthquake, which coincided with a destructive tsunami along the Shizuoka coast. Sand Bed T1 may be correlated to the tsunami deposit reported by Fujiwara et al. (2013) from a drowned valley in western Shizuoka Prefecture about 80 km west of the present study area, which was deposited around 3400 cal. yr BP. At present, there is no historical or geological evidence to indicate the origin of Sand Bed T2. However, the lack of evidence of the vertical crustal movement implies that Sand Bed T2 is not a tsunami deposit related to the paleo-Tokai/Tonankai earthquake.
Conclusion
We identified three possible tsunami deposits, that is, Sand Beds T0 (around ad 1000), T1 (3565–3486 cal. yr BP), and T2 (around 4000 cal. yr BP), from the Oya lowland, which lies southeast of the Shizuoka Plain and faces the Suruga Trough. These possible tsunami deposits are composed of well-sorted beach sand and intercalated silt beds that accumulated in a lagoonal environment. We used grain roundness, grain-size, sedimentary structures, diatom assemblages, and 14C dating to determine the origin and age of the tsunamis, and the vertical crustal movement related to past Tokai earthquakes.
Sand Beds T0, T1, and T2 have erosional bases and contain mud clasts, and range in thickness from 15 to 34 cm. They exhibit inverse-normal grading, which suggests deposition from a high-energy sediment flow. These sand beds are characterized by a multilayered structure composed of fine alternations of sand sheets and mud drapes, which suggests deposition from a long-period wave train.
Based on changes in diatom assemblages, we suggest that Sand Bed T1 can be linked to historical Tokai earthquakes associated with an abrupt uplift of the Oya lowland. The diatom assemblages may further suggest gradual subsidence during the interseismic period. The youngest sand bed, T0, may be correlated with the ad 1096 Eicho earthquake.
As the preexisting geomorphological context remains unclear, it is difficult to estimate the size of the tsunami waves that deposited these sand beds. Further geomorphological and geological research is needed to reconstruct the specific characteristics of paleotsunamis in this region.
Footnotes
Acknowledgements

Funding
This study was funded by Shizuoka University, Paleo Labo Co., Ltd, Fujiwara Natural History Foundation, and Strategic Funds for the Promotion of Science and Technology.