
Abstract
The stratigraphy within coastal river valleys in south-central Chile clarifies and extends the region’s history of large, earthquakes and accompanying tsunamis. Our site at Quidico (38.1°S, 73.3°W) is located in an overlap zone between ruptures of magnitude 8–9 earthquakes in 1960 and 2010, and, therefore, records tsunamis originating from subduction-zone ruptures north and south of the city of Concepción. Hand-dug pits and cores in a 3-m-thick sequence of freshwater peat in an abandoned meander (a little-examined depositional environment for tsunami deposits) and exposures along the Quidico River show five sand beds that extend as much as 1.2 km inland. Evidence for deposition of the beds by tsunamis includes tabular sand beds that are laterally extensive (>100 m), well sorted, fine upward, have sharp lower contacts, and contain diatom assemblages dominated by brackish and marine taxa. Using eyewitness accounts of tsunami inundation, 137Cs analyses, and 14C dating, we matched the upper four sand beds with historical tsunamis in 2010, 1960, 1835, and 1751. The oldest prehistoric bed dates to 1445–1490 CE and correlates with lacustrine and coastal records of similar-aged earthquakes and tsunamis in south-central Chile.
Introduction
Earthquakes in 1960 (MW 9.5), 2010 (MW 8.8), 2014 (MW 8.2), and 2015 (MW 8.3) demonstrate the potential for frequent, great (magnitude 8–9) subduction-zone earthquakes and tsunamis in Chile (Bilek, 2010; Fritz et al., 2011; Plafker and Savage, 1970; U.S. Geological Survey (USGS), 2015; Yagi et al., 2014). The two greatest events, in 1960 and 2010, originated in south-central Chile and severely damaged the densely populated metropolitan area surrounding the city of Concepción (Elnashai et al., 2012; Fritz et al., 2011; Plafker and Savage, 1970). This region of Chile shows a 500-year historical pattern of destructive tsunamis generated by subduction-zone earthquakes originating north and south of Concepción (Figure 1; Lomnitz, 2004). Because our study area at Quidico (38.1°S, 73.3°W) is located in a zone where the ruptures from the 1960 and 2010 subduction-zone earthquakes overlap, tsunamis accompanying both these earthquakes inundated the lowland areas along the Quidico River (Figure 1).
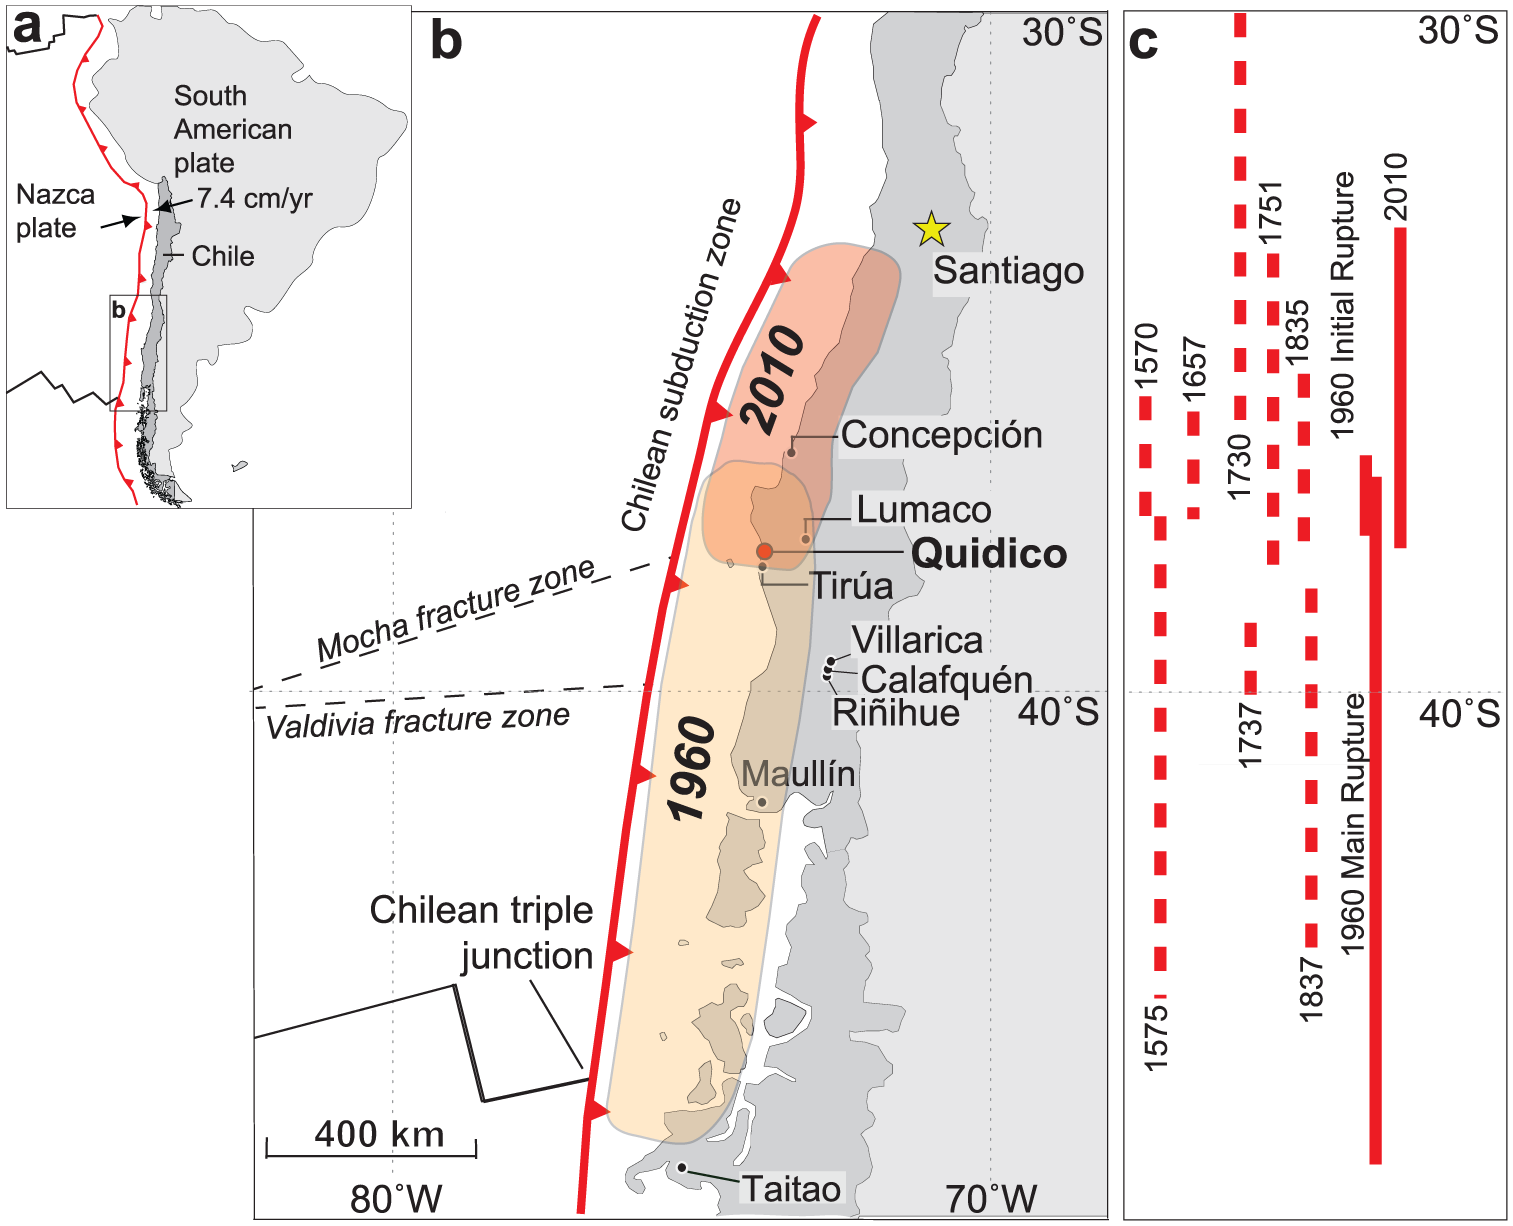
(a) Location map of Chile in relation to convergence of the Nazca plate and the South American plate along the Chilean subduction zone (red barbed line). (b) Location of Quidico along the south-central Chilean coast. Referenced locations, fracture zones, and other tectonic features are shown. Colored areas show rupture areas for the 1960 and 2010 earthquakes, which overlap near Quidico. (c) Along-strike rupture extents for megathrust earthquakes of the past 500 years in south-central Chile. Solid lines indicate instrumentally recorded earthquakes and dashed lines indicate rupture extents estimated from historical accounts (modified from Ely et al., 2014; compiled from Lomnitz, 2004; Melnick et al., 2009; Moernaut et al., 2014).
Following many studies seeking to learn more about the height, inundation extent, earthquake sources, and recurrence intervals of damaging historical and prehistoric tsunamis (Bourgeois, 2009; Dawson et al., 1988; Satake and Atwater, 2007; Szczuiński et al., 2012), we investigated riverbank exposures and an abandoned meander of the lower Quidico River for stratigraphic evidence of deposits from historical and prehistoric tsunamis. The low-energy depositional environment of the meander was particularly effective in preserving anomalous, widespread sand beds deposited by tsunamis. Using stratigraphic, sedimentologic, microfossil (diatom), and dating (137Cs and 14C) analyses, we identified five sand beds that we interpret as having been deposited by tsunamis inundating the Quidico River lowland in the last 600 years. Our new tsunami chronology extends the history of great earthquakes and tsunamis in south-central Chile (e.g. Atwater et al., 2013; Cisternas et al., 2005; Ely et al., 2014; Moernaut et al., 2014; Wright and Mella, 1963) by providing more information about four historical tsunamis and documenting a previously unknown prehistoric tsunami.
Setting
Historical written records document that at least nine earthquakes have produced tsunamis in south-central Chile (35–40°S) in the last 500 years (Figure 1; Cisternas et al., 2005; Lomnitz, 2004). The main shock of the 1960 Mw 9.5 earthquake was preceded by a Mw 8.1 foreshock (Cifuentes, 1989; Plafker and Savage, 1970). Combined, the two 1960 earthquakes created a greater than 1000-km-long rupture that began near Lumaco (38°S, 74°W) in the north and ended near the Taitao Peninsula (46°S) at the Chilean triple junction (Figure 1; Plafker and Savage, 1970). The main rupture caused tsunami run-up heights of 10–20 m along the Chilean coast (Plafker and Savage, 1970; Sievers et al., 1963; Wright and Mella, 1963). The 2010 Mw 8.8 Maule earthquake ruptured a 500-km-long segment of the megathrust from 34°S to 38.5°S, causing a tsunami with run-up heights from 3 to 29 m along the coast (Fritz et al., 2011; Fuji and Satake, 2013; Moreno et al., 2012).
Quidico is located landward from the Mocha block of the Nazca plate, which is bounded by the Mocha (38°S) and Valdivia (39.5°S) fracture zones, where the Nazca plate subducts beneath the South American plate at ~7.4 cm per year (Figure 1; Contreras-Reyes et al., 2013; DeMets et al., 2010; Moreno et al., 2012; Nelson and Manley, 1992). Bathymetric and seismic studies suggest subduction of a sea floor ridge along the Mocha fracture zone, as opposed to a smoother subducting sea floor, may inhibit the lateral propagation of earthquake ruptures (Contreras-Reyes et al., 2010; Plafker and Savage, 1970). The complexity of the subduction zone in this region could explain why both the 1960 and 2010 earthquakes terminated in this area (Contreras-Reyes et al., 2010).
We investigated floodplain stratigraphy in the lower Quidico River valley about 0.5 km southwest of the town of Quidico (Figure 2) where the river valley widens into a coastal plain of grassy pastureland with wetland vascular plants in low-lying areas close to the river (e.g. Juncus balticus, Juncus microcephalus, Scirpus americanus, Scirpus californicus, and Spartina sp.). Construction that started shortly before the 2010 earthquake added concrete walls that extend approximately 0.5 km upstream from the mouth of the river to a road bridge at the town of Quidico (Figure 2). The river flows northwest into a northward-facing embayment that is separated from the Pacific Ocean by a narrow bedrock ridge to the west.

(a) Locations of abandoned meander Transects X and Y and Transect Z along riverbank exposures southwest of the town of Quidico. Filled circles show locations of modern samples collected for grain-size and diatom analyses. (b) Locations of pits (stars), cores (circles), and described exposures (triangles) along Transects X Y and Z (Imagery: Google Earth, DigitalGlobe 2014).
Methods
Field mapping and data collection
We described 26 cores, 17 hand-dug pits, and 12 riverbank exposures within the lower 1.5 km of the Quidico River floodplain to determine the character and lateral extent of sand beds in sequences of peaty sediment in an abandoned meander and in muddy fluvial sediment near the river. Most stratigraphic units were described from and correlated along two transects (X–X’ and Y–Y’) in the abandoned meander and one transect (Z–Z’) that followed riverbank exposures upstream (Figure 2). In the field, we described color; grain size; depth; characteristics of upper and lower contacts; sedimentary structures; and the proportions of sand, silt, and organic material for each stratigraphic unit using the nomenclature of Troels-Smith (1955; Nelson, 2015). We collected blocks of sediment from two representative pits (Pits 7 and 13) and one riverbank exposure (Exposure 9), which we sampled for grain-size, thin-section petrographic, diatom, 137Cs, and 14C analyses in the laboratory. To provide modern analog data to help with paleoenvironmental reconstruction, we collected modern sediment samples from the littoral zone, river channel, and a sand dune near the mouth of the river (Figure 2).
We determined the locations and relative elevations of cores, pits, and exposures using a handheld GPS and total station. Elevations were then tied to a tidal datum measured with a temporary tide gauge. We installed the tide gauge on a footbridge 700 m upstream of the mouth of the Quidico River between 31 January and 4 February 2013 (Figure 2). To determine the elevation of the tide gauge relative to local mean sea level (MSL), we matched our tide gauge observations with tidal predictions from the TPXO8-atlas tidal model (Egbert and Erofeeva, 2002; Egbert et al., 1994; Ely et al., 2014).
Grain-size and petrographic analyses
We measured the grain-size distributions of sediment samples from Pit 13, Exposure 9, and of modern samples from the littoral zone, river channel, and sand dune environments. Pit 13 and Exposure 9 were subsampled at depth intervals that ranged from 1 cm near lithologic contacts to 3 cm in the continuous and homogeneous sediment. Using 30% concentration H2O2, we digested and discarded organic material and performed grain-size analysis on the remaining inorganic sediment using a Malvern Mastersizer 3000 laser particle-size analyzer (Donato et al., 2009). Grain-size analysis of samples from Exposure 9 was conducted using a Beckman Coulter LS230 laser diffraction grain-size analyzer. Grain-size statistics included sorting, skewness, and kurtosis following Folk and Ward (1957) and Folk (1966). The grain-size results from Pit 13 and Exposure 9 were gridded using a triangular irregular network (TIN) algorithm (Sambridge et al., 1995) and plotted on a color surface with Geosoft Oasis TM software (Donato et al., 2009). To further characterize and compare Quidico sediments, we report the mean grain size and d10 (diameter whereby 10% of the sampled grains are smaller) value for samples from Pit 13.
We conducted thin-section petrographic analysis to identify similarities and differences in grain morphology and mineralogical composition for the six sand beds (Sands 1–6) from Pit 13, three sand beds from Pit 7 (Sands 2, 3, and 4), two modern samples from the littoral zone, one from the river channel, and one from a dune (Figure 2).
Diatom analysis
We used fossil and modern diatom analyses to determine sediment provenance (e.g. Dawson, 2007; Hemphill-Haley, 1995; Pilarczyk et al., 2014). We subsampled the stratigraphy of Pit 13 and Exposure 9 at intervals ranging from 1 cm near lithologic contacts to 15 cm in homogenous sediment. We also collected 1-cm3 surface samples from the littoral zone, river channel, and floodplain to characterize modern diatom assemblages.
Diatoms were extracted from ~1 g of sediment using the standard preparation methods of Palmer and Abbott (1986). A volume of between 25 and 100 mL (depending on the diatom concentration) of clean diatom solution was distributed evenly across a cover slip with a pipette, dried, and the cover slip was mounted on a glass slide using Naphrax. A total of 60 diatom slides were prepared from Pit 13 and Exposure 9. Diatoms were identified to species level using a light microscope under oil immersion at 1000× magnification with reference to Krammer and Lange-Bertalot (1986, 1988, 1991a, 1991b) and Witkowski et al. (2000). We identified 300 diatoms for each sample with each species expressed as a percentage of total diatom valves counted. We classified diatoms based on their salinity preference as outlined in Chilean (Rebolledo et al., 2005, 2011; Rivera, 2000) and European (Denys, 1991; Hartley et al., 1986; Krammer and Lange-Bertalot, 1986, 1988, 1991a, 1991b; Vos and De Wolf, 1988, 1993) catalogs.
Dating tsunami deposits
We conducted interviews with the residents of Quidico about the inundation area and characteristics of the 1960 and 2010 tsunamis. We also collected sediment samples from above, within, and below the youngest buried sand bed (Sand 2) for the 137Cs analysis to confirm the sand’s deposition by the 1960 tsunami. As 137Cs was introduced into the atmosphere after 1950 CE as a product of above-ground nuclear testing, presence of 137Cs above and within a sand bed, but not below it, constrains the deposition of Sand 2 to post-1950 (Ely et al., 1992; Milan et al., 1995).
We selected plant macrofossils from Pit 13 and Exposure 9 for AMS 14C dating to provide ages for Sands 3 to 5. We selected seeds of Scirpus sp. and Potamogeten sp. for 14C analysis as outlined by Kemp et al. (2013). The seeds were chosen because many of them still retained their delicate casing, implying minimal transport prior to deposition. We dated seeds from the silty-peat units immediately underlying the sand beds to obtain maximum ages for sand deposition, while seeds from the silty-peat units directly above Sand 5 and Sand 6 were dated to further constrain their time of deposition with minimum ages. We sampled from Pit 13 and Exposure 9, 140 m apart, to determine whether radiocarbon ages would support our stratigraphic correlations of the sand beds. Using OxCal (Bronk Ramsey, 2009), we developed an age–depth model for the Quidico stratigraphic sequence to estimate the timing of tsunami deposition.
Results
Stratigraphy, characteristics, and ages of sand beds
The stratigraphy at Quidico consists of silty peat and sandy silt interbedded with clean sand beds and capped with a thin surficial sand bed (Sand 1) at some locations (Figures 3 and 4). A thick (>70 cm) massive sand bed, Sand 6, is the basal unit of most of our 1–2 m cores, pits, and riverbank exposures. Sand beds 1–5 drape over the preexisting topography and are laterally extensive with sharp, erosive lower contacts. Sands 1–5 reach their farthest upstream extent along the modern riverbank and all disappear 1.2 km inland from the coast.
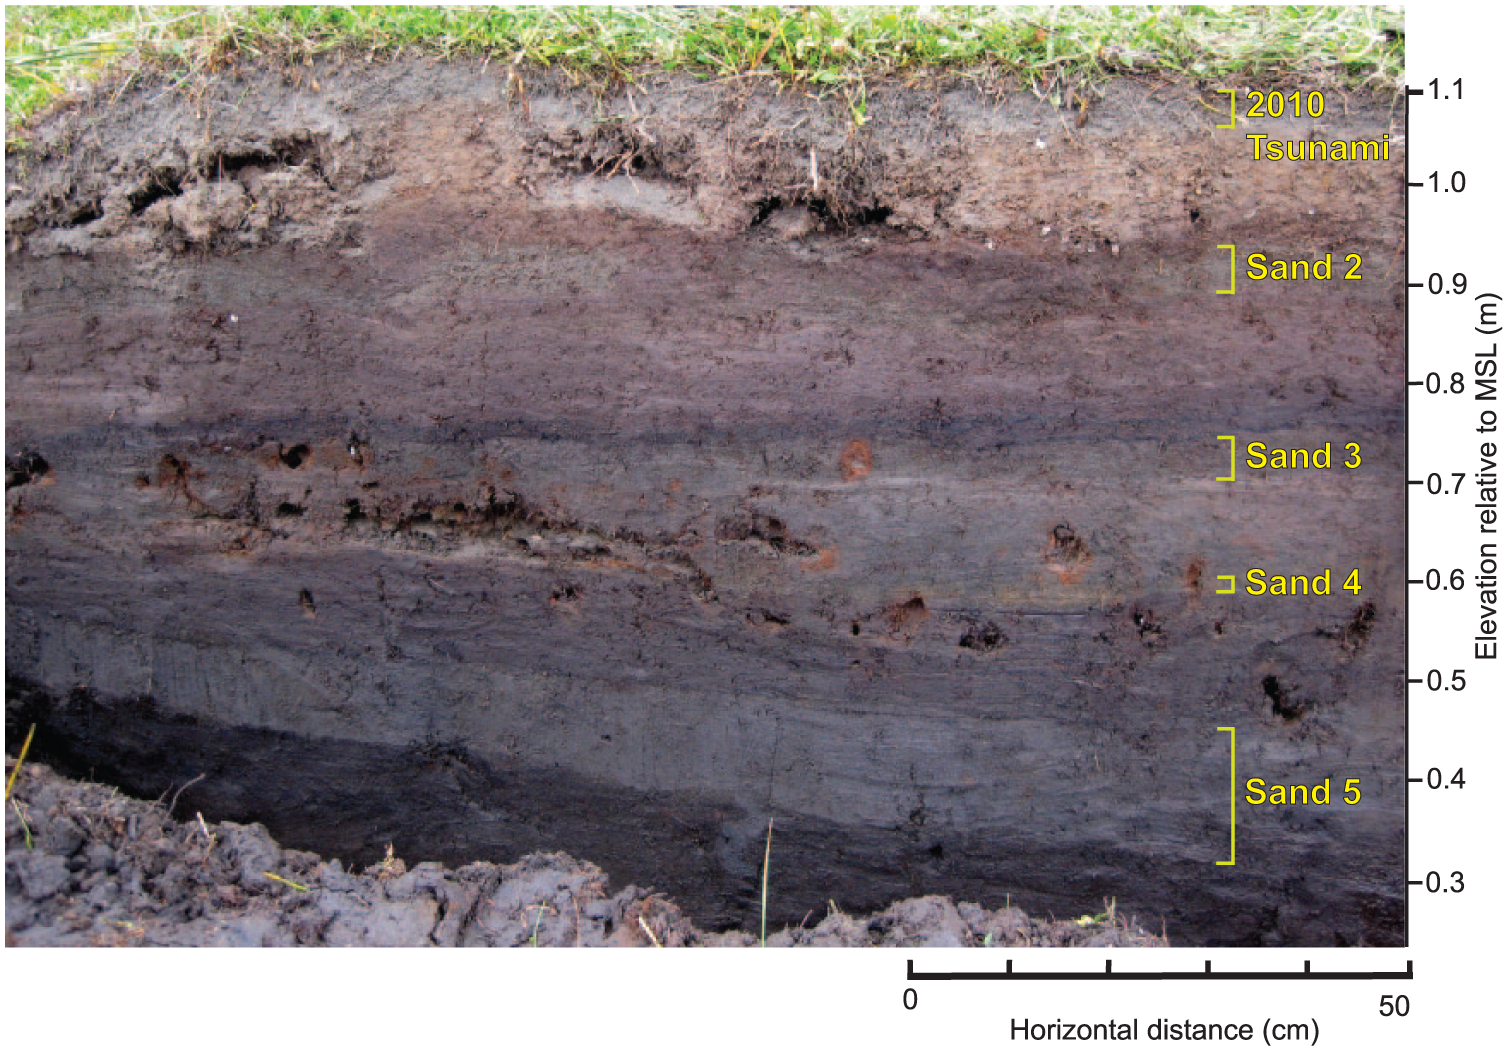
Riverbank Exposure 9 at Quidico showing sequence of fluvial sediment containing Sands 1–5. Note the sharp lower contacts of the sands and their tabular nature.
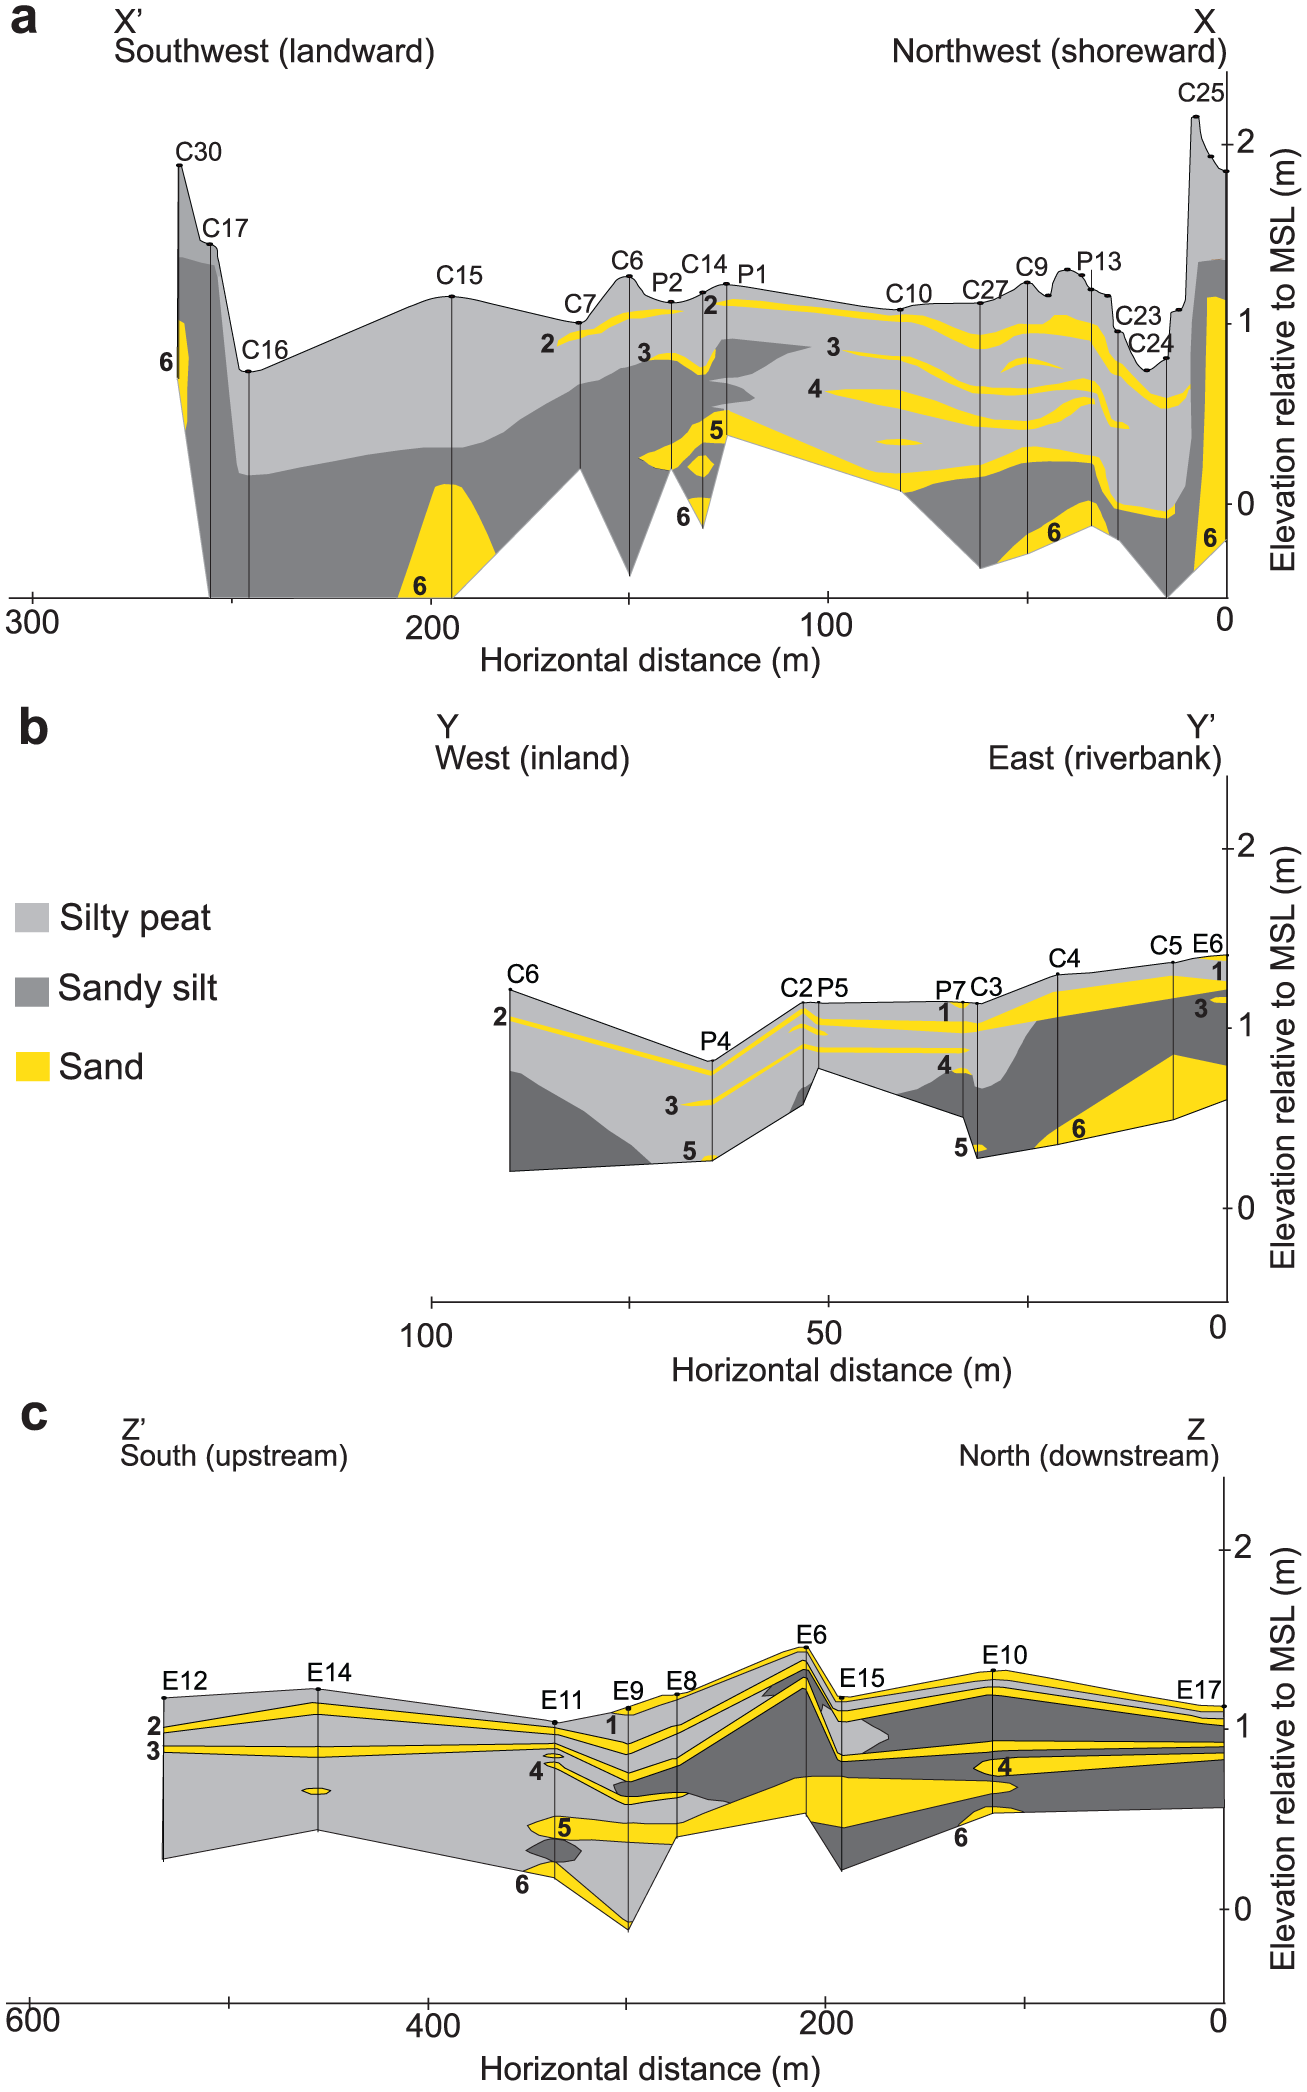
Summary of stratigraphy described in cores (C), pits (P), and exposures (E) along transects. (a) Transect X trends parallel to the valley from seaward to landward and contains Sands 2 to 6. (b) Transect Y trends perpendicular to the valley and contains Sands 1 to 6. (c) Transect Z consists of exposures along the river and contains Sands 1 to 6.
Transect X, which trends parallel to the valley from seaward to landward, contains Sands 2 to 5 (Figures 2 and 4). Transect Y, perpendicular to the valley, contains a record of Sands 1 to 5 (Figure 4). Transect Z, which consists of exposures, contains a well-preserved record of Sands 1 to 5 (Figure 4). Investigation of the riverbank stratigraphy upstream from the mouth of the Quidico River did not identify any possible tsunami sand beds beyond Exposure 12, 1.2 km inland. In addition, no sand beds were observed in cores taken in an upstream abandoned channel meander 1.5 km inland.
High-resolution grain-size analysis of samples from Pit 13 and Exposure 9 support our field observations that the sand beds are anomalous within the sequences of silty peat and sandy silt. The sand beds have a decreased fine fraction (relatively lower d10 value) compared to their host units (Figure 5). The mean d10 value for Sands 1–5 is 3.12 Φ. In contrast, the mean d10 value is 7.71 Φ for the silty-peat units and 5.47 Φ for the sandy-silt units.

Stratigraphic sections showing grain-size data, 14C ages, and diatom data for samples from Pit 13 and Exposure 9. The colored plot (far left) displays grain-size distribution as the volume of grains in grain-size classes (cl (clay), si (silt), and s (sand)) in phi units (Φ). Moving right, depths for 14C (triangles) and 137Cs (squares) dating samples are shown on the stratigraphic sections. D10 plot to the right of the stratigraphic sections shows d10 grain size (Φ) versus depth. The far right columns show the relative abundance (percent of the total count) of diatom species with freshwater, brackish water, and marine salinity preferences (explained in caption of Figure S1, available online).
According to eyewitness accounts, the 2010 tsunami inundated the floodplain of the Quidico River in the vicinity of our study site, but was confined to the river channel farther upstream. Deposits of the 2010 tsunami, with thicknesses of 2–5 cm, are most prominent along the banks of the river, and extends 1 km inland along the riverbank (Figure 4). Within the abandoned meander, 1–2 cm-thick deposits of Sand 1 are patchy and were only found in Pit 7 and Exposure 6. Sand 1 is a fine-grained, well-sorted sand (mean: 2.25 Φ; d10: 3.03 Φ) (Figure 5; Table 1). Diatom analysis from Exposure 9 shows Sand 1 contains a 35% increase in marine estuarine taxa (e.g. Opephora pacifica, Paralia sulcata, Planothidium delicatulum, Thalassiosira angulata) compared to the underlying sediments (Figure S1, available online).
Grain-size statistics (Folk, 1966; Folk and Ward, 1957) for samples from sand beds at Pit 13.
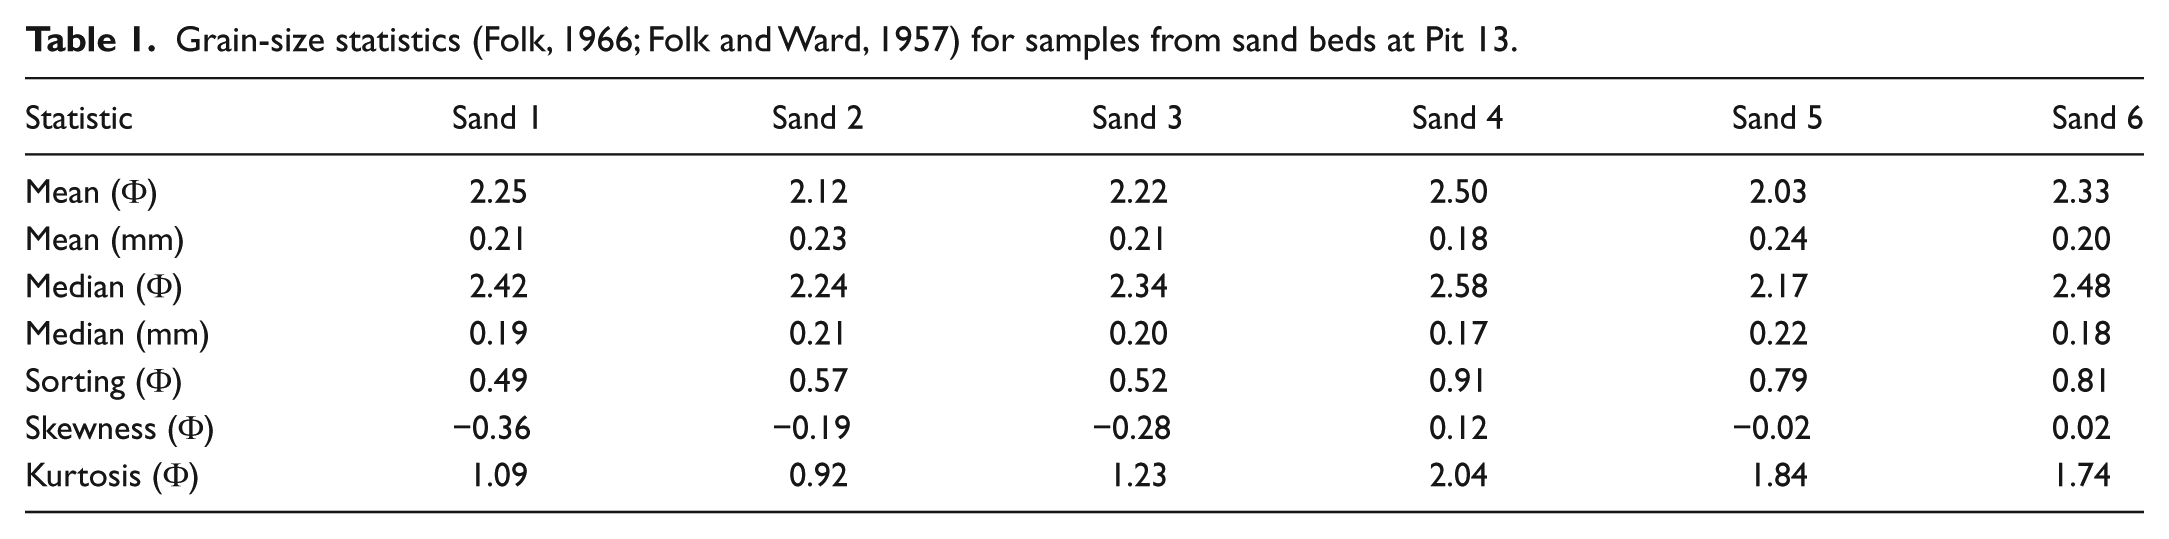
Sand 2 is the most widespread sand bed within the abandoned meander. It is found in every pit and core along Transects Y and Z, as well as in seven of the pits and cores along Transect X (Figure 4), and pinches out 1.1 km inland. It is a medium- to fine-grained, moderately well-sorted sand with an average thickness of 5–7 cm (mean: 2.12 Φ; d10: 2.94 Φ) (Figure 5; Table 1). In Pit 13, Sand 2 contains anomalous marine tychoplanktonic diatoms (Delphineis kippae and D. surirella) not found in underlying or overlying sediment, as well as an increase in marine and brackish estuarine taxa (from 45% below the sand to ~80% above the sand) (Figure S2, available online). Marine and brackish estuarine taxa also increase by ~15% in Exposure 9 (Figure S1, available online). In contrast, the silty-peat unit below Sand 2 is dominated by freshwater (e.g. Nitschia frustulum and Diploneis psuedovalis (Pit 13 and Exposure 9)) and brackish (e.g. Amphora coffeaeformis and Navicula cincta (Exposure 9), and Rhopalodia brebissonii (Pit 13)) taxa.
Two lines of evidence show that Sand 2 was deposited by the 1960 tsunami. Detection of 137Cs in samples taken above and within Sand 2, and the absence of 137Cs from samples directly below Sand 2, suggests that this sand bed was deposited by the 1960 tsunami (Table S1, available online). Resident accounts confirm that the 1960 tsunami inundated the lower river valley but was largely confined to the river channel. The incoming tsunami was powerful enough to detach a wooden footbridge downstream of our study sites and transport it upstream
Sand 3 is found in seven of the pits and cores in Transect X and five in Transect Y. It is best preserved along the riverbank and disappears inland within the abandoned meander 1.1 km inland from the coast (Figure 4). Sand 3 is a medium- to fine-grained, moderately well-sorted sand (mean: 2.22 Φ; d10: 2.97 Φ) with an average thickness of 3–5 cm (Figure 5; Table 1). High-resolution grain-size analysis from Exposure 9 shows upward fining (sand- to silt-sized grains) within Sand 3 (Figure 5). In Pit 13 and Exposure 9, diatom assemblages within Sand 3 are very similar to the mixed freshwater, brackish, and marine assemblages found in the organic sediment underlying the sand bed (Figure 5). However, a low abundance (~3%) of the marine tychoplanktonic diatom D. surirella, not found in underlying or overlying sediment, was found in Pit 13 (Figure S2, available online). Calibrated AMS ages of Scirpus sp. seeds below Sand 3 show that it was deposited after 1670 CE (Table 2). Our OxCal age model places deposition in the interval 1820–1960 CE (Figure 6; Table 3).
Radiocarbon ages for samples from Pit 13 and Exposure 9.
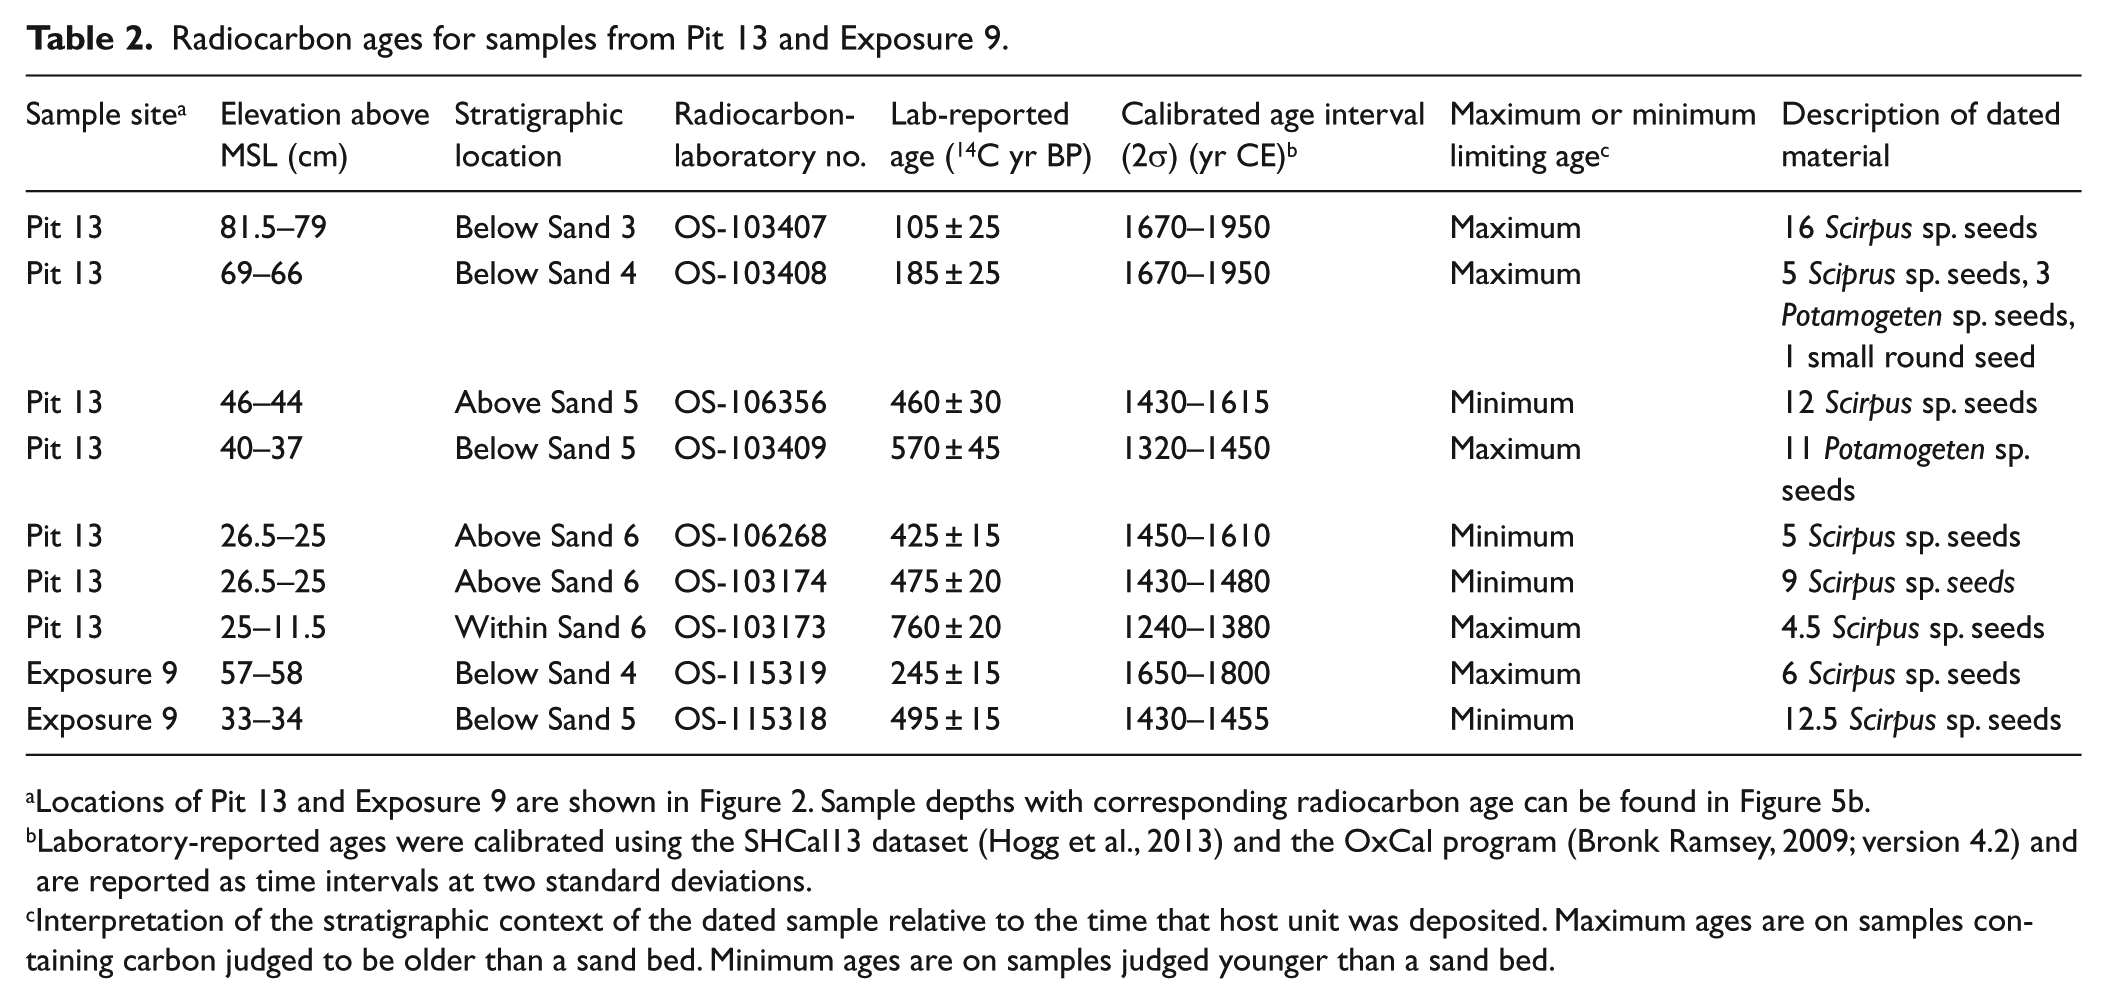
Locations of Pit 13 and Exposure 9 are shown in Figure 2. Sample depths with corresponding radiocarbon age can be found in Figure 5b.
Laboratory-reported ages were calibrated using the SHCal13 dataset (Hogg et al., 2013) and the OxCal program (Bronk Ramsey, 2009; version 4.2) and are reported as time intervals at two standard deviations.
Interpretation of the stratigraphic context of the dated sample relative to the time that host unit was deposited. Maximum ages are on samples containing carbon judged to be older than a sand bed. Minimum ages are on samples judged younger than a sand bed.
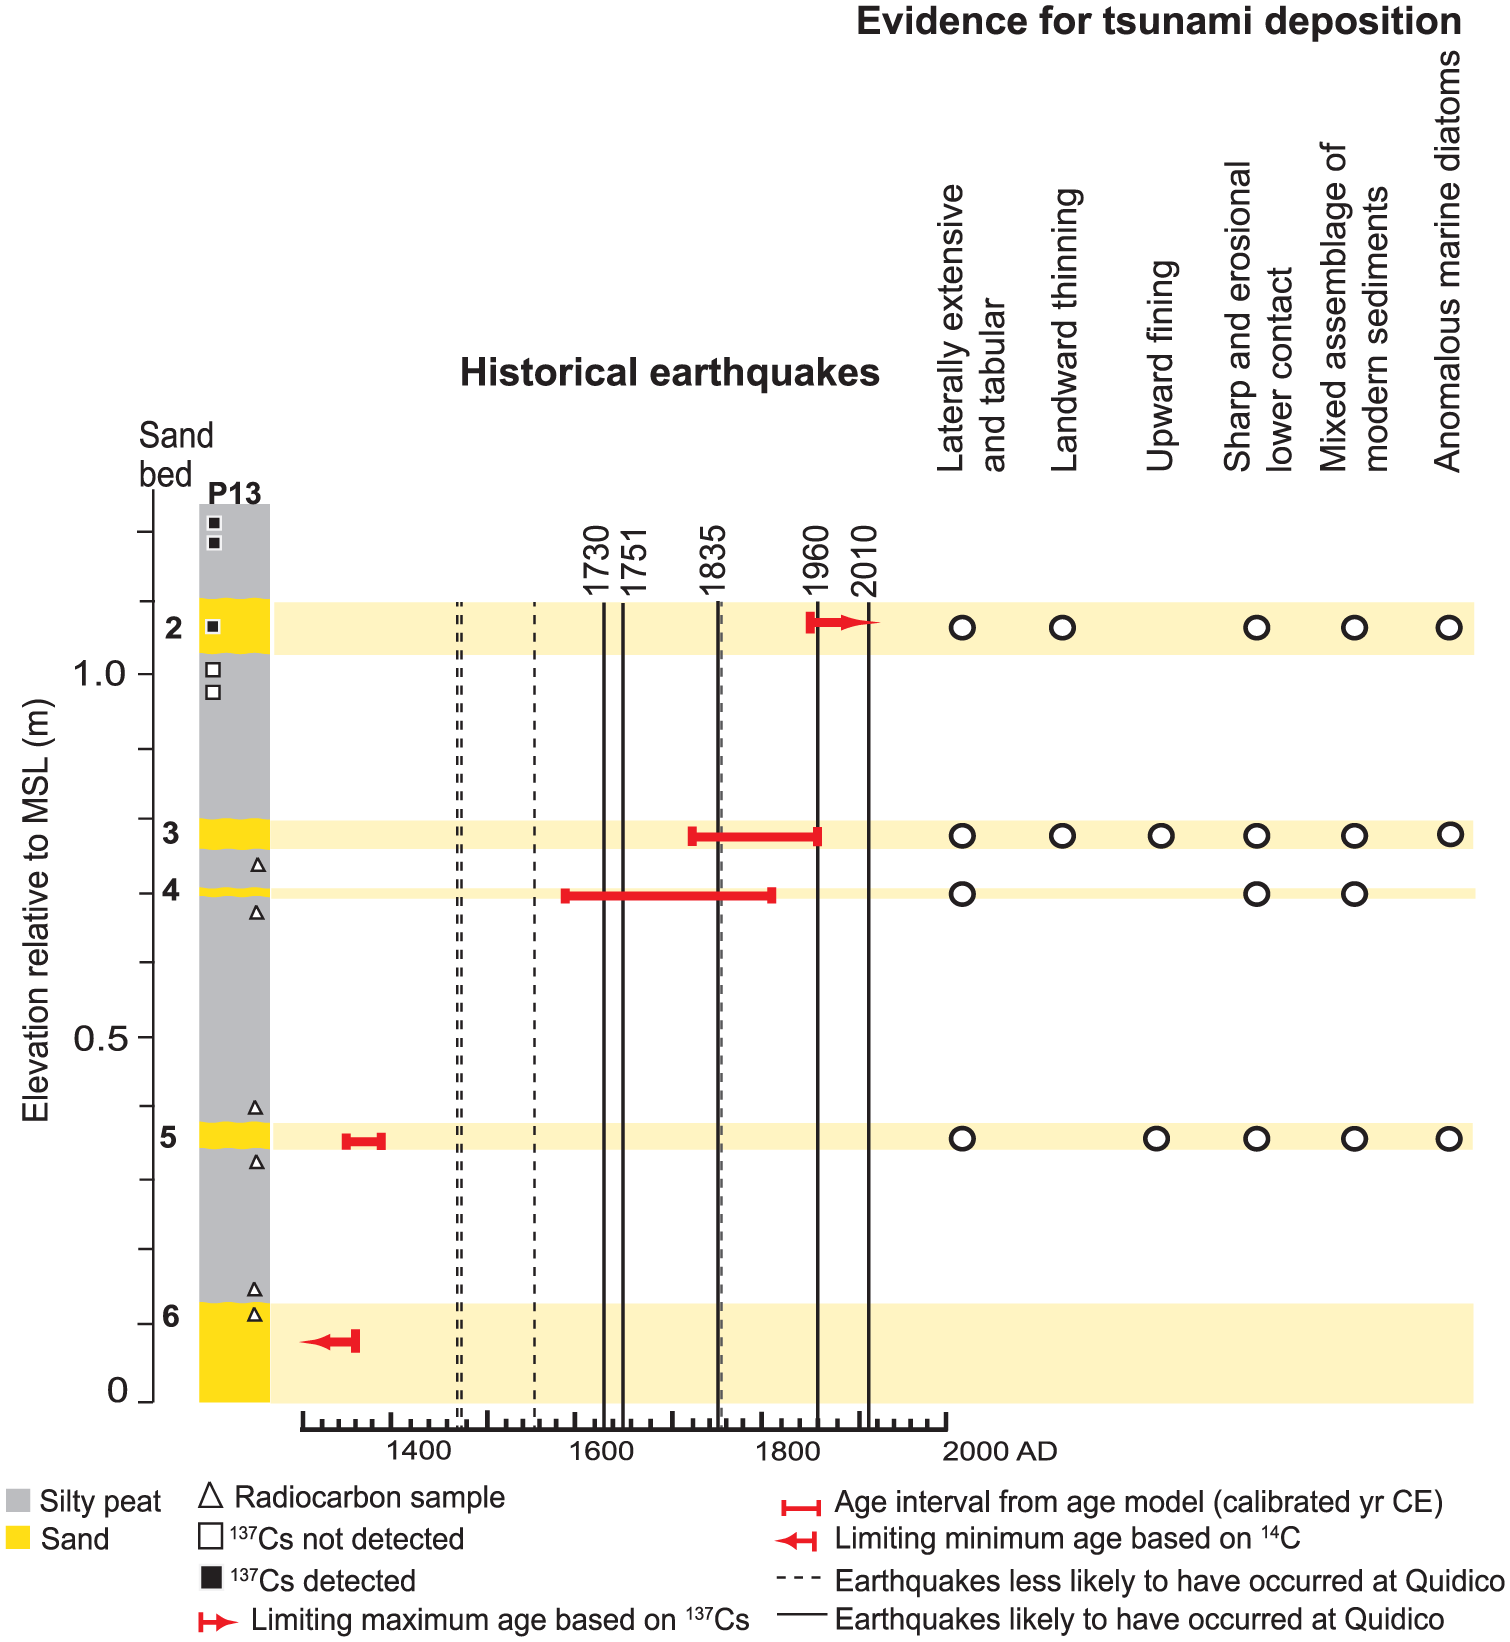
Stratigraphic section for Pit 13 showing age intervals, limiting minimum age based on 14C, and limiting maximum age based on 137Cs (red brackets and arrows; calibrated yr CE) for sand beds based on our OxCal age model: Sand 3 (1820–1960), Sand 4 (1690–1910), Sand 5 (1445–1490), and Sand 6 (pre-1460). Circles to the right of the age model show which beds have different types of evidence for tsunami deposition. Sand 1 was not found at Pit 13. Depths of 14C and 137Cs samples are shown by symbols as in Figure 5.
Age model for times of sand bed deposition.
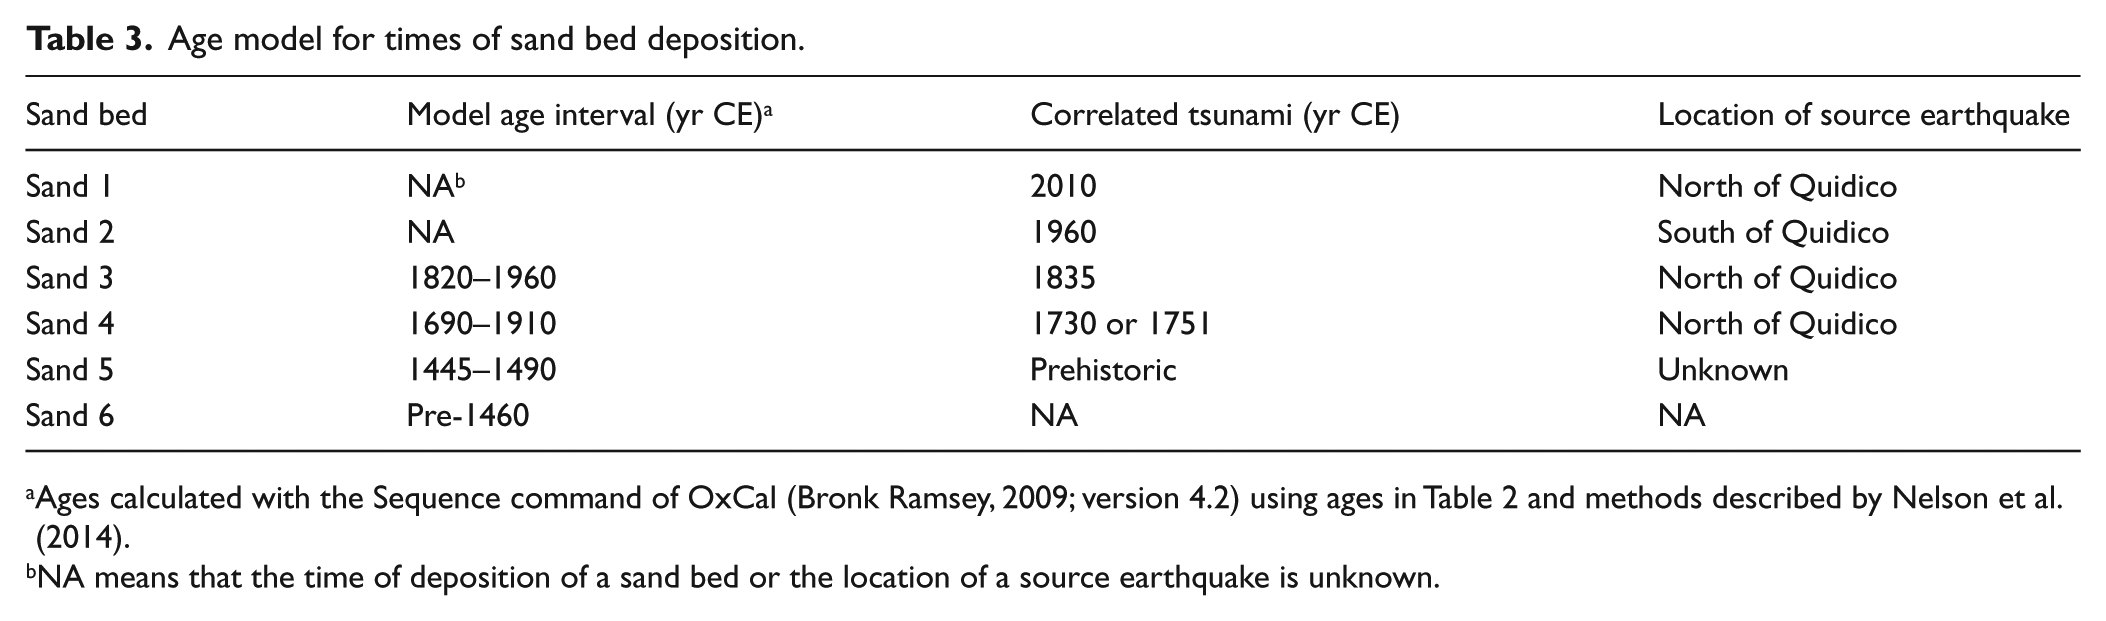
Ages calculated with the Sequence command of OxCal (Bronk Ramsey, 2009; version 4.2) using ages in Table 2 and methods described by Nelson et al. (2014).
NA means that the time of deposition of a sand bed or the location of a source earthquake is unknown.
Sand 4 is most continuous along Transect X and the riverbank, until it disappears 1.1 km inland along the river (Figure 4). Within the abandoned meander, Sand 4 is present in sections close to the coast (Pit 13, Cores 9, 27, and 10) and in Pit 7 near the middle of Transect Y (Figure 4). Sand 4 is a fine- to very fine-grained, moderately sorted sand (mean: 2.50 Φ; d10: 3.68 Φ) with a thickness of 2–7 cm (Figure 5; Table 1). Sand 4 contains a mixed diatom assemblage similar to underlying and overlying sediments (Figure 5). Ages on Scirpus sp. seeds in the silty-peat unit directly below Sand 4 provide maximum ages for its deposition after 1670 CE from Pit 13 and 1650–1800 CE from Exposure 9 (Table 2). Our age model suggests that Sand 4 was deposited between 1690 and 1910 CE (Figure 6; Table 3).
Sand 5 is thickest (10–15 cm) in five of the pits along Transect Z (Figure 4). In Transect X, it appears in nine pits and cores farther downstream and disappears 1 km upstream from the coast in the abandoned meander (Figure 4). Along Transect Y, Sand 5 is found in Pit 4 and Core 3. Sand 5 is a medium- to fine-grained, moderately sorted sand (mean: 2.03 Φ; 2.96 Φ) (Figure 5; Table 1). High-resolution grain-size analysis of samples from Exposure 9 shows upward fining within Sand 5 (Figure 5). In both Pit 13 and Exposure 9, Sand 5 contains a 30% increase in marine and brackish estuarine taxa (Figures S1 and S2, available online). Sand 5 also contains small percentages (<2% abundance) of D. kippae and Delphineis surirella, anomalous marine tychoplanktonic diatoms not found in underlying or overlying sediment (Figure S2, available online). In contrast, the silty-peat unit below Sand 5 contains a greater abundance of freshwater (e.g. Pseudostaurosira brevistriata and Diploneis psuedovalis (Pit 13 and Exposure 9)) taxa. Samples directly below Sand 5 provide maximum ages of 1320–1450 CE from Pit 13 and 1430–1455 CE from Exposure 9 for its deposition (Table 2). Our model places deposition at 1445–1490 CE (Figure 6; Table 3).
Sand 6 is our lowest sand bed (Figure 4). We were unable to dig or core below it because Sand 6 intersects the water table and liquefied in our pits and cores. Sand 6 is a medium to fine-grained, moderately sorted sand (mean: 2.33 Φ; d10: 3.28 Φ) (Figure 5; Table 1). In Exposure 9, Sand 6 contains a mix of freshwater (e.g. Psuedostaurosira brevistriata), brackish (e.g. Fallacia tenera), and marine (T. angulata) diatoms (Figure 5). Samples directly above Sand 6 provide minimum ages of 1450–1610 CE and 1430–1615 CE for Sand 6 (Table 2). Our model suggests deposition before 1460 CE (Figure 6; Table 3).
Diatom composition of modern surface samples
Samples collected from the littoral zone at Quidico contain a low concentration of marine tychoplanktonic diatoms D. kippae and D. surirella. Diatom assemblages in the river channel samples consist of a mix of marine and brackish estuarine taxa (Bacillaria sp., O. pacifica, P. delicatulum, T. angulata). Samples collected from the surface of the floodplain contain abundant freshwater diatoms (D. elegans, D. pusedovalis, N. frustulum, P. brevicostata).
Comparison of the modern sediments to the sand beds
Possible sediment sources for the sand beds include the littoral zone, the river channel, and the dune. Grain-size analysis shows that samples from the littoral zone are composed primarily of medium-grained sand (mean: 1.95 Φ; d10: 2.71 Φ) (Figure S3, available online). The river channel sample is composed primarily of fine-grained sand but has a finer d10 value than the littoral zone or dune samples (mean: 2.78 Φ; d10: 6.35 Φ). In contrast, the dune contains fine-grained sand (mean: 2.37 Φ; d10: 3.05 Φ).
Thin-section analysis shows that Sands 1–6, and modern samples from the littoral zone, river channel, and dune have similar mineralogies but varying grain morphologies (Figure S3, available online). The thin sections of all samples share the same suite and relative percentage of minerals: volcanic rock fragments (~58%), opaques (~25%), quartz (~10%), plagioclase (~5%), clinopyroxene (~2%), and traces of orthopyroxene, muscovite, hornblende, chlorite, biotite, sillimanite, and zircon as an accessory mineral in quartz. Sands 1–6 and the dune sample contain angular to subrounded sediment grains. In contrast, the littoral zone sediments are angular to rounded, while the river channel sediments have subangular to subrounded grains.
Discussion
Evidence for five tsunami deposits at Quidico
We interpret the upper five sand beds we traced along the lower river valley to have been deposited by tsunamis, rather than floods or storms. Using the 2010 tsunami deposit to guide our interpretation of older deposits, our evidence for deposition by tsunamis that inundated the floodplain a minimum of 0–1.5 m above present MSL includes (1) laterally extensive and tabular sand beds, which thin or abruptly terminate landward and, in at least two beds, fine upward; (2) beds that have a sharp, erosional lower contact with a mixed provenance of modern sediments from local sources; and (3) beds that contain anomalous marine diatoms (Figure 6). Although none of the sand beds meet all three criteria, beds that display multiple criteria were probably deposited by tsunamis.
Sands 2–5 extend continuously up to 100 m in the abandoned meander and over 400 m along the riverbank (Figures 4 and 6). In addition, Sands 1–5 are tabular and draped over the preexisting topography. Laterally extensive and tabular tsunami deposits have been described from Alaska (Nelson et al., 2015; Witter et al., 2016), Australia (Dominey-Howes et al., 2006), Cascadia (Atwater and Hemphill-Haley, 1997; Clague et al., 2000; Nelson et al., 2008; Witter et al., 2003), Chile (Cisternas et al., 2005; Dura et al., 2015; Ely et al., 2014), Japan (Goto et al., 2011; Nanayama et al., 2003, 2007; Sawai et al., 2012), Norway (Dawson et al., 1988), and elsewhere. In contrast, overbank flood deposits are characterized by sediments that thin away from the river (Khan et al., 2013; Marriott, 1992; McKee et al., 1967), a stratigraphy not found at Quidico.Although the sand beds were not found in every core, pit, and exposure, tsunami deposits can be discontinuous and patchy due to highly variable tsunami flows, sediment sources, sediment concentrations, and the irregular topography upon which beds are deposited (Peters and Jaffe, 2010). For example, the sand bed deposited by the 2010 tsunami at nearby Tirúa has a patchy distribution (Ely et al., 2014).
We interpret additional sand beds found between Sands 1–5 as fluvial deposits from overbank floods. Most were only present in low, inset benches immediately adjacent to the river. Moving away from the riverbank, these fluvial sand beds pinch out rapidly, within 1–2 m, and could not be consistently traced across the floodplain. In contrast, Sands 1–5 were observed in multiple exposures and pits where the intervening sediments are mainly silt and clay. Our interpretation is that the energy of river floods dissipated rapidly away from the channel, and hence these events were not capable of transporting and depositing uniform blankets of sand across the entire floodplain. The additional observation that Sands 1–5 disappear inland, while the pattern of the fluvial sands along the riverbank with silts in the floodplain continues upstream, further supports our interpretation of the different processes responsible for these two types of deposits. For these reasons, the fluvial sand beds did not fit our criteria for tsunami deposits.
Landward thinning and/or upward fining is found in three of the five sand beds (Figure 6). Deceleration of tsunami flows may lead to thinning landward and fining upward of tsunami deposits (Dawson et al., 1996; Dawson and Shi, 2000; Dominey-Howes et al., 2006; Peters and Jaffe, 2010). Sand 3 is the only sand bed at Quidico that exhibits both landward thinning and upward fining (Figure 6), although Sands 2, 3, and 5 disappear 1.2 km inland from the coast (Figure 4; Transect X). In Exposure 9, where the sand beds were thicker and we were able to subsample the beds, Sands 3 and 5 fine upward (Figure 5). We did not observe sedimentary structures indicative of storm and/or flood deposits (e.g. multiple, thin laminations) within the sand beds (e.g. Kortekaas and Dawson, 2007; Switzer and Jones, 2008).
Sands 1–5 have a sharp (<1–3 mm) lower contact with an underlying silty-peat or sandy-silt unit that is indicative of a change in sediment source (Figure 6). A rapid change in sediment source will produce a sharp contact at the base of a unit, such as sand from a tsunami deposit overlying silty river deposits (Atwater and Hemphill-Haley, 1997; Bourgeois, 2009; Peters and Jaffe, 2010; Szczuiński et al., 2012; Witter et al., 2003). In contrast, storm surges often move at a lower velocity and commonly lack sharp, erosional lower contacts (Kortekaas and Dawson, 2007; Switzer and Jones, 2008). At Quidico, the sudden change from a dominantly silty-peat and sandy-silt environment to sand indicates a rapid shift from low-energy, fluvial deposition of fine-grained sediment to high-energy tsunami deposition of coarse sand.
A comparison of modern samples from Quidico to the sand beds shows that the sand beds are largely composed of a mixture of modern sediment from different environments. Results show that in Sands 1–5, the littoral, river channel, and dune samples contain sediments of similar mineralogy and varying grain morphology (Figure S3, available online). Grain-size analysis suggests that dune sand (mean: 2.37 Φ; d10: 3.05 Φ) may be the dominant source of the tsunami sediment because dune sand is the closest match in d10 and mean values to the sand beds (mean: 2.31 Φ; d10: 3.12 Φ). Grain morphology also suggests that dune samples are the closest match to the sand beds, as the sediment grains contained in the dune and sand beds are angular to subrounded. The range of grain roundness, however, is too wide to be conclusive. Thin section analysis showed the suite and relative percentage of minerals were nearly identical in all modern samples and sand beds (Figure S3, available online).
Diatom assemblages also suggest a mixed sediment source for Sands beds 1–5. These beds contain mixtures of the marine diatoms found in the modern littoral zone (Delphineis kippae and D. surirella) with the marine and brackish estuarine diatoms found in the river channel (Bacillaria sp., O. pacifica, P. delicatulum, T. angulata), and the freshwater diatoms found in the floodplain (D. elegans, D. psuedovalis, N. frustulum, P. brevicostata). The mixed freshwater, brackish, and marine diatom assemblages found in Sands 1–5 are typical of tsunami deposits because tsunamis erode, transport, and deposit marine, brackish, and freshwater sediments as they inundate coastal and inland areas (e.g. Dawson et al., 1996; Dawson and Smith, 2000; Sawai et al., 2008; Szczuiński et al., 2012). Within the mixed assemblages of Sands 1, 2, and 5, we observed a significant (>30%) increase in marine and brackish estuarine taxa (common in modern river channel samples and found in low abundances throughout sections of sediment in Pit 13 and Exposure 9) compared to underlying sediments. The increase in marine and brackish estuarine taxa in Sands 1–5 is consistent with overbank deposition of sand from the river channel, which could be caused by tsunami inundation of the lowland or river flooding (Khan et al., 2013). However, the anomalous marine tychoplanktonic diatoms (Delphineis kippae and D. surirella), only found in marine littoral samples and in Sands 2, 3, and 5, support a tsunami source for the sands rather than a fluvial origin (Dura et al., 2015, 2016; Hemphill-Haley, 1995, 1996; Witter et al., 2003).
Sand 6 lacks good evidence for any of the criteria for tsunami deposits that we outlined above (Figure 6). Because we were unable to excavate below Sand 6, we are not confident in interpreting its origin.
Tsunami history in an abandoned meander
The stratigraphy of an abandoned meander along the lower Quidico River shows that this depositional environment preserves tsunami deposits well, allowing us to develop a more complete chronology of historical and prehistoric tsunami deposits for south-central Chile. Abandoned meanders form when a bend in the river channel is cut off by a new channel, causing aggradation of alluvium in the abandoned meander (Hausmann et al., 2013; Leopold and Bull, 1979). Following the cut off and abandonment of the Quidico meander channel, the gradual aggradation of peaty sediment in standing water created a wetland ideal for the preservation of tsunami sediments derived from dune and littoral sand sources. The organic matter that accumulated in the wetland provides abundant material for radiocarbon dating. Similar stratigraphic studies of abandoned meander sequences have yielded detailed records of meander formation and subsequent sedimentation (Alexander et al., 1994; Brooks and Medioli, 2003; Constantine et al., 2010; Ishii and Hori, 2016).
Along the meander and exposure transects, we found that sandy tsunami deposits in the abandoned meander are readily identified and distinguished from sandy to silty fluvial deposits, as the abandoned meander is infrequently flooded and so the meander sequence lacks distinct overbank deposits. In contrast, the riverbanks are more frequently flooded and so accumulate silty overbank deposits that thin rapidly with distance landward away from the river.
Matching Quidico tsunami deposits with historical and prehistoric tsunamis
An analysis of historical records shows that large tsunamis generated by megathrust earthquakes north and south of Quidico are likely candidates for the sources of the Quidico tsunami deposits (Figure 1; Table 3). Our interpretations rely on matching the stratigraphy at Quidico with historical records. Records in Chile begin with Spanish settlement and the foundation of Santiago in 1541. As the conquistadors pushed southward from Santiago, the Indians of south-central Chile began an insurgency that was to persist, intermittently, for more than 300 years. Spaniards tried to establish control by founding villages and military outposts, but an Indian uprising in 1598 took more than 1000 Spanish lives and cost the colonists many villages and outposts south of Concepción. This wartime history limited the Spaniard’s ability to maintain written records of natural disasters, such as tsunamis, throughout south-central Chile, including Quidico (Cisternas et al., 2012).
Sands 1 and 2 were deposited by the 2010 and 1960 tsunamis, respectively. Our age model suggests that Sand 3 was deposited between 1820 and 1959 CE and Sand 4 was deposited between 1690 and 1910 CE. During this time range, there are historical accounts of four tsunamis that could have inundated Quidico: 1730, 1751, 1835, and 1837 (Figures 1 and 6; Cisternas et al., 2005; Lomnitz, 2004; Udías et al., 2012). Based on historical and geological evidence, the earthquake in 1837 ruptured south of Quidico; only a low tsunami was recorded at the northern end of the rupture near Concepción (Cisternas et al., 2005; Lomnitz, 2004; Moernaut et al., 2014). In contrast, the 1835 earthquake probably ruptured offshore of Concepción and Quidico, generating a higher tsunami (Lomnitz, 2004; Udías et al., 2012). We suggest that Sand 3, which forms a prominent, widespread deposit at Quidico, was deposited by the 1835 tsunami.
If so, Sand 4 could have been deposited by either the 1751 or 1730 tsunamis (Figure 6). Descriptions of the 1751 tsunami suggest that the earthquake began in a similar location to the 2010 earthquake rupture, between Santiago and Tirúa (Figure 1; Lomnitz, 2004; Udías et al., 2012). Destruction from the 1751 tsunami prompted inhabitants of Concepción to move the city inland (Udías et al., 2012). In contrast, the 1730 tsunami was generated by an earthquake that likely ruptured between La Serena (30°S) and a point north of Concepción (Figure 1). Although the 1730 tsunami could have reached Quidico, it is unlikely that a deposit from 1730 would be as thick and extensive as those produced by a tsunami generated by the two other very large and closer ruptures during this time period in 1751 and 1835.
Our age model shows that Sand 5 (1445–1490 CE) precedes the historical earthquake catalog for south-central Chile, which begins with an earthquake and tsunami near Concepción in 1570 (Figure 6; Lomnitz, 2004; Udías et al., 2012). This newly discovered tsunami, recorded by Sand 5, extends the tsunami record in this part of south-central Chile back in time by about a century.
Comparison of Quidico tsunami history with other tsunami records
A comparison of our Quidico tsunami chronology with a neighboring site at Tirúa, 13 km to the south, shows a similar, but not identical, tsunami history (Ely et al., 2014). The 500-year stratigraphic record described at Tirúa, gathered mainly from riverbank exposures and in cores and pits within the river floodplain, contains evidence of at least four tsunamis likely to have occurred in 1575, 1751, 1960, and 2010 (Ely et al., 2014). Within that timeframe, the Quidico record has the tsunamis in 2010, 1960, and 1751 with an additional event in 1835, but we did not find a deposit matching the 1575 tsunami. With the exception of the 1960 earthquake, all of the other tsunamis identified at Quidico were caused by earthquakes originating to the north (Table 3). In contrast, Tirúa preserves a record of tsunamis generated by earthquakes originating to the north (2010 and 1751) and south (1960 and 1575) (Ely et al., 2014).
The difference in tsunami histories at Quidico and Tirúa may be due to differences in the coastal morphology of the sites. Tirúa has a coastline that is more open to the Pacific Ocean, which allows better access for tsunamis coming from either north or south. The bay at Quidico faces north and is protected by bedrock ridges to the south and west. Therefore, the accumulation and preservation of deposits from southern ruptures may be limited to extremely large tsunamis, as in 1960. Together, the sequences at Tirúa and Quidico complement each other and clarify the history of tsunamis in south-central Chile during the last 600 years.
Studies conducted south of Quidico may provide more information on Sand 5, a newly discovered prehistoric tsunami in south-central Chile. Lake turbidite sequences in southern Chile (39°S to 40°S), generated by strong shaking during earthquakes, provide a record of earthquakes in 1960, 1837, 1737, 1575, 1466 ± 4, 1319 ± 9, and 1127 ± 44. The 1466 deposit is an unlikely match with Sand 5 at Quidico, dated to 1445–1490, because deposits from 1466 are not widespread. The 1466 turbidite was found in lakes Riñihue and Calafquén but not in Villarica, the northernmost lake (Figure 1; Moernaut et al., 2014). South of the lakes, a study of sediments along the Río Maullín yielded a 2200-year record of tsunamis that lacks evidence for a tsunami during the mid- to late-1400s (Cisternas et al., 2005). Combined, the two studies suggest that the 1466 turbidite likely formed from a smaller, more localized earthquake and that Sand 5 was not deposited by a southern-sourced tsunami as large as the 1960 tsunami. More sites in south-central Chile should be searched for evidence of this prehistoric earthquake and its tsunami.
Conclusion
Using stratigraphic, sedimentologic, microfossil (diatom), and dating (137Cs and 14C) analyses from 26 cores, 17 pits, and 12 riverbank exposures, we identified five sand beds that we interpret as having been deposited by tsunamis inundating the Quidico River floodplain in the last 600 years. We use three criteria to infer deposition by tsunamis: (1) anomalous sand beds that are laterally continuous over 100 m in the abandoned meander and over 400 m along the riverbank, and terminate 1.2 km inland from the coast; (2) the sand beds have a sharp and erosional lower contact and a mixed provenance similar to that of modern source sediments; and (3) a higher percentage of marine and brackish diatoms in the sand beds than in their host freshwater sediment.
Sands 1 and 2 were deposited by tsunamis accompanying the great earthquakes of 2010 and 1960. Based on radiocarbon ages and historical records, we interpret Sands 3 and 4 as having been deposited during large tsunamis in 1835 and 1751. Sand 5 (1445–1460 CE) is a newly discovered tsunami deposit that predates historical records in this part of Chile. Based on the continuity and good preservation of Sands 1, 2, and 4, which we infer were generated by earthquake ruptures from the north, Quidico has an apparent preservation bias for tsunami deposits from northern earthquake sources. The Quidico record extends the tsunami history of this region back in time by almost a century, emphasizing the value of stratigraphic investigations of historical and prehistoric tsunami deposits.
Footnotes
Acknowledgements
We thank Edmund Garrett, Diego Muñoz, and Alexandra Ruiz for assistance in the field; Jessica Pilarczyk for grain-size tomography; and Breanyn MacInnes and Tim Melbourne for providing helpful feedback on earlier drafts of this work. Reviews by Eileen Hemphill-Haley, Yuki Sawai, and Alastair Dawson led to improvements in the manuscript. Any use of trade, product, or firm names is for descriptive purposes only and does not imply endorsement by the US Government. This article is a contribution to IGCP Project 639.
Funding
This project was funded by NSF grants EAR 1036057 and 1145170 to Ely, EAR 1144537 to Horton, and RAPID 439021 to Dura. Additional support was provided by the FONDECYT project N°1150321 to Cisternas and by GeoEngineers to Hong. Nelson is supported by the Earthquake Hazards Program of the US Geological Survey.