



Abstract
Climate change poses many challenges for the future management and development of the coastal zone. Uncertainties in the rate of future sea-level rise reduce our ability to project potential future impacts. This study seeks to further develop the past–present–future methodology proposed in Baker and McGowan and apply it to an additional case study, the Macleay River estuary, New South Wales (NSW), Australia. The past–present–future methodology uses evidence from the past, the Holocene and Pleistocene, to formulate a response function that can be used to project future sea-level heights. Three scenarios for 2100 were developed to emphasise the uncertainties surrounding future sea levels and the need to consider multiple sea-level rise scenarios when planning for the future: a best case (90 cm rise), mid-case (2.6 m rise) and worst case (5 m rise). Light detection and ranging (LiDAR) data were used to project each of the three scenarios onto the case study area of South West Rocks. The methodology was tested by using shell samples extracted from cores which were AMS dated to determine whether or not Holocene estuarine conditions correlated with the proposed future sea-level rise inundation scenarios. We also conducted an audit of potentially affected infrastructure and land uses, and proposed possible future adaptation strategies for the case study area.
Introduction
Globally, sea-level rise associated with climate change poses a threat to many coastal communities. Future higher sea levels are expected to permanently and periodically inundate natural environments, residential dwellings, infrastructure, industry and other land uses. This, combined with possible increased occurrences and intensity of extreme events, is likely to result in large-scale impacts on both natural and human coastal environments. The ability of human and natural environments to adapt to these changes is limited. In an attempt to better understand potential future changes in sea levels, the past–present–future (PPF) methodology was developed by Baker and McGowan (2013) and applied to Hexham, New South Wales (NSW), Australia. This paper seeks to advance the PPF methodology and to further demonstrate its validity by applying it to the second case study of the Macleay River estuary, NSW, Australia. The idea of using past sea-level evidence to assist in developing an understanding of future sea-level variability is a concept that is supported by numerous authors (including Baker and McGowan, 2013; Gehrels, 2010; Kennedy, 2008; Woodroffe and Murray-Wallace, 2012).
Sea-level rise results from the thermal expansion of the oceans in response to climatic variations and the melting of ice caps and glaciers (Intergovernmental Panel on Climate Change (IPCC), 2007). Various estimates have been made as to the rate of recent sea-level rise. Satellite observations between 1993 and 2009 show a global average rise in sea levels of 3.2 ± 0.4 mm/yr (Church and White, 2011). Church and White (2011) report a linear trend of average global sea-level rise of 1.7 ± 0.2 mm/yr from 1900 to 2009. This contrasts with more recent work undertaken by Houston and Dean (2011) who report decelerations in the rate of sea-level rise recorded in a selection of tide gauge records from the United States and globally. Watson (2011) also reports a deceleration in the rate of sea-level rise in a selection of Australian and New Zealand tide gauges.
Sea-level rise has not occurred at a uniform rate globally, with significant variations occurring between and within regions (Becker et al., 2012; Cazenave and Llovel, 2010; Church et al., 2008; Milne et al., 2009). Regional variations may result from a number of factors, including hydro-isostatic and isostatic rebound, variations in ocean currents, changes in the physical properties of water (e.g. density or temperature), freshwater fluxes, tectonic effects and changing air pressures (Watson, 2011). In eastern Australia, sea levels vary annually depending on which El Nino-Southern Oscillation (ENSO) phase is occurring.
The rate of future sea-level rise is highly uncertain. As a result, a range of predictions for sea-level heights by 2100 have emerged, extending from 0.15 to 5 m above present. The IPCC (2013) has produced a range of predictions for global average sea-level heights for 2100 based on a series of scenarios, extending from 0.26 to 0.98 m above present. Additional research shows that maximum sea levels for 2100 may be between 1 and 1.9 m (Church et al., 2011; Jevrejeva et al., 2012; Milne et al., 2009; Rahmstorf, 2009). Sea levels will continue to rise past 2100 because of the lag between atmospheric warming and the time required for ice sheets to melt. Future sea levels are not expected to rise at a uniform rate globally, with regional variations of ±0.15 m of the typical mean global sea-level rise projection expected (IPCC, 2007).
During previous episodes of sea-level rise, significant variations in the rate and extent of rises occurred globally. The use of past episodes of sea-level rise as an analogy for predicting future sea-level heights is limited, despite the argument posed by many authors that the palaeo-record can be used to illustrate how the climate system has responded to past climate changes (Alley, 2003; Bentley, 2010; Bradley, 2000, 2008; Raynaud et al., 2000).
Planning for future sea-level rise
Sea-level rise poses many challenges to the strategic planning and management of the coastal zone (Kennedy, 2008). Coastal development has predominately occurred with little consideration of possible future changes to the natural system (Rigby, 2005). Many policy makers find the uncertainty of the effects of climate change and the complexity of the issues involved challenging (Hebert and Taplin, 2006). Planners would desire more certainty about the rate of future sea-level rise (Rigby, 2005; Walsh et al., 2004) as this absence of certainty has resulted in sea-level rise not being considered in the development of many coastal planning policies (Cooper and Lemckert, 2012). This is concerning as decisions are being made now regarding the development of both public and private land and infrastructure that will exist beyond the period when current predictions of sea levels will inundate the land (Deyle et al., 2007). Impacts of climate change are expected to be noticeable in the next 30 years, which is well within the 70+ year replacement cycle of infrastructure (Walsh et al., 2004), highlighting the need to consider changes in climate when making present planning decisions.
Because of the high levels of uncertainty associated with future climate change, it is necessary to adopt a precautionary approach when making coastal decisions. The precautionary principle provides the means for policy makers to make judgements in the absence of scientific certainty (Peterson, 2006; Stein, 1999; Weale, 2007). It also ensures that the variations resulting from climate fluctuations are taken into account. Policies need to be regularly reassessed in light of new scientific findings (Walsh et al., 2004). Another factor that needs to be considered during policy development is the importance of making decisions at a local scale. Decisions need to take into account local variations in geomorphological, climate and tidal conditions, as these will all impact how an area will respond to future climate changes. It is therefore necessary for coastal policies to be developed at a local scale with guidance from higher levels of government. Sea levels will continue to rise past 2100 because of the lag effect between atmospheric and oceanic warming and the required time for ice sheets to melt (Jevrejeva et al., 2012). This needs to be considered when implementing urban planning decisions as many decisions made today (particularly regarding land use) will affect urban environments past 2100.
As has been outlined, there is an urgent need for a sea-level rise impact assessment methodology to be developed that accounts for
Regional variations in rates of sea-level rise;
The oscillating nature of sea-level rise;
The uncertainty of future sea-level rise.
The identification of these three factors led to the development of the PPF methodology published by Baker and McGowan (2013). The PPF methodology seeks to use evidence from the past (the Pleistocene, Holocene and recent past) to produce a range of possible future sea-level rise scenarios that can be used to inform urban planning and coastal management decisions. The PPF methodology also seeks to emphasise the uncertainty associated with future sea-level projections, and does this by proposing three alternate inundation scenarios. This study seeks to further develop this methodology and apply it to an additional case study in NSW Australia, the Macleay River estuary.
Using the past to predict future sea-level rise
The PPF methodology seeks to utilise evidence from past episodes of higher sea levels in order to develop an understanding of the sea-level response mechanisms associated with rising atmospheric temperatures. Understanding the variability of past sea levels can provide us with an insight into how the coast could change in the future as a result of climate change. The idea of using evidence from periods of higher sea levels than present is a novel idea that is gaining momentum (see, for example, Baker and McGowan, 2013; Gehrels, 2010; Kennedy, 2008; Woodroffe and Murray-Wallace, 2012). Many existing models that have been developed to predict future sea-level rise do not use past episodes of sea-level rise as a proxy for future predictions (Baker and McGowan, 2013). The absence of changes at this scale in the recent past necessitates the need to use records of Holocene and Pleistocene sea levels in order to better understand how sea levels will respond in the future to climate changes (Alley, 2003; Bentley, 2010; Bradley, 2000, 2008; Raynaud et al., 2000). The PPF methodology sought to develop a new methodology to predict future sea levels on the eastern Australian coastline. It utilised evidence from the last interglacial (Pleistocene) and the Holocene from the NSW region to formulate a response function that would take into account regional variations.
During the last interglacial, and the Holocene, atmospheric temperatures were warmer than today and were accompanied by higher sea levels than present on the east coast of Australia. A number of researchers (see Clark and Huybers, 2009; Kopp et al., 2009) have proposed that the last interglacial could be used as an analogue for future warming as the global distribution of warming during the last interglacial was similar to that proposed in many scenarios. A general consensus has been reached that during the last glacial maximum, sea levels in Australia were 4–6 m above present (Murray-Wallace and Belperio, 1991; Thom et al., 1981). Maximum temperatures of 3.23°C above present were recorded in data from the Antarctic Vostok ice core 128,357 yr BP (Petit et al., 2001), and temperatures of 5.46°C above present were recorded 400 years later in the European Project for Ice Coring in Antarctica (EPICA) C ice core (Jouzel et al., 2007).
Holocene palaeo-records also provide an insight into how coastal environments may respond to possible future changes. A range of views have been presented on Holocene sea levels in Australia with three main models emerging. The first is that during the past 6000 years, sea levels have been relatively stable and not higher than present subject to a small zone of uncertainty of ±1 m (Belperio, 1979; Thom and Roy, 1985). The second view is that during the Holocene, sea levels reached a peak of ~1 m above present, from which they smoothly fell to present levels (Chappell, 1987). This view evolved from the first to take into account hydro-isostasy (Chappell, 1983). The final view is that sea levels reached a highstand of ~1.7 m above present 6000 yr BP (Baker et al., 2001a; Baker and Haworth, 2000a; Lewis et al., 2008). A number of oscillations of ~1 m occurred before the present level was reached (Baker et al., 2001a; Baker and Haworth, 2000a). Evidence supports that at least one peak (3600–4200 cal. yr BP) in sea levels was associated with warmer sea surface temperatures of at least 1°C (possibly up to 2°C) above present along the eastern Australian coast (Baker et al., 2001b). This warming occurred in-phase with warming in Antarctica (Baker and McGowan, 2013) and was associated with a period of greater solar insolation than present (Steinhilber et al., 2009). This evidence illustrates one possible response mechanism that has occurred in the past in response to higher sea surface temperatures. As increases in sea surface temperatures are predicted for the future, past responses during the Holocene and Pleistocene may be used as an analogue for future conditions.
Baker and McGowan (2013) identified a Pleistocene response function of 1°C = 0.86 m for the lower Pleistocene sea-level boundary (4 m) and 1°C = 1.29 m for the upper Pleistocene sea-level boundary (6 m). A Holocene response function of 1°C = 0.88 m was also proposed based on the Holocene sea-level curve which utilises evidence from the tubeworm Galeolaria caespitosa (developed by Baker et al., 2001a, 2001b, 2004; Baker and Haworth, 1997, 2000a, 2000b). The response of sea levels to rising temperatures during the Pleistocene and Holocene could be used to determine a possible response function between the cryosphere, atmospheric temperatures and sea levels and to develop future sea-level models.
As recognised in the ‘Introduction’, there are high levels of uncertainty associated with the prediction of future sea levels. To illustrate this uncertainty, and to highlight the need to plan for worst-case scenarios, Baker and McGowan (2013) developed three different scenarios. Scenario 1 is a 0.9 m sea-level rise and is the equivalent of an ~1°C rise in temperature under the PPF model. It represents the height adopted by the NSW government (Department of Environment Climate Change and Water (DECCW), 2009). Scenario 2 is a 2.6 m rise in sea level and is the equivalent of an ~2.9°C rise in temperature under the PPF model. It could possibly result from natural and anthropogenic climate change occurring simultaneously and is the combination of the highest Holocene sea level, 1.7 m above present, plus the 0.9 m anthropogenic height adopted by the NSW government. Scenario 3 is a 5 m sea-level rise and is the equivalent of an ~5.7°C rise in temperature under the PPF model. It represents the maximum sea-level height attained during the Pleistocene. Under the IPCC A1F1 scenario, an increase in temperature of 4°C is predicted; therefore, based on past sea-level evidence, a rise in sea-level heights similar to this scenario may be possible.
Case study: using the past to predict future sea-level rise in the Macleay River estuary
The Macleay River estuary is located on the south-eastern Australian coast as shown in Figure 1. Numerous studies have previously investigated the palaeo-environmental conditions of the Macleay River estuary. Some of the most well-studied Aboriginal middens on the Australian coastline also exist within the estuary. This extensive existing research makes it an ideal case study for testing the PPF methodology

Sea-level scenarios in the Macleay Estuary.
Background
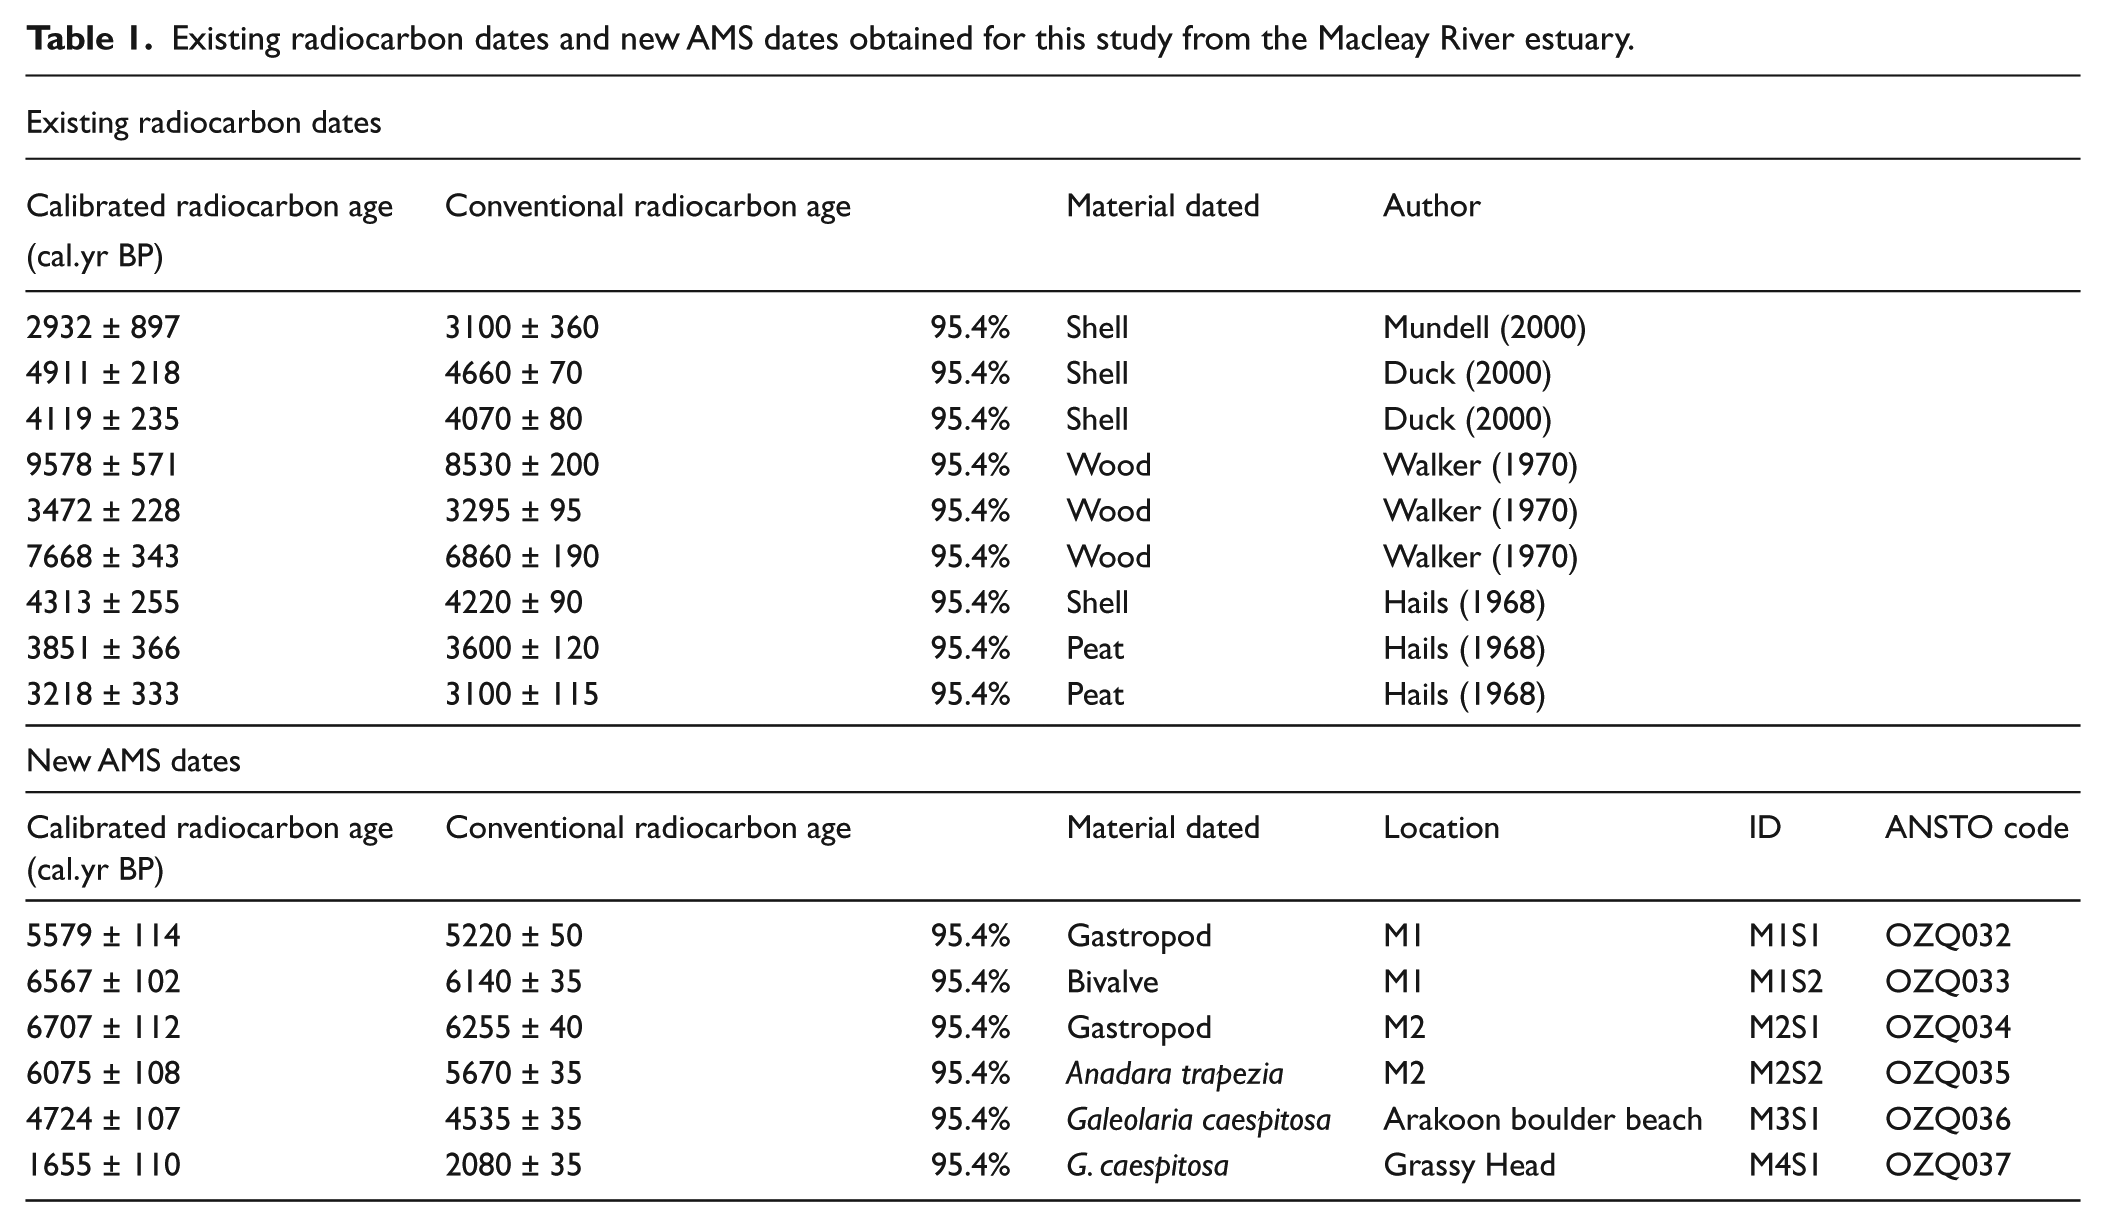
Formation of the Macleay River estuary was initiated during the last interglacial; however, it has predominately been formed during the last 6000 years as a result of rising sea levels (Duck, 2000; Hails, 1964, 1968). Initial work by Hails (1969) suggests that during the Holocene transgression, the last interglacial sequence was completely submerged. Rising sea levels inundated the seaward sections of the river valley, creating an embayed coastal lagoon (Duck, 2000). Around 3000 yr BP, the Macleay River became more fluvially dominated because of a sudden drop in sea level, leading to the formation of the outer barrier and causing the entrance of the Macleay River to prograde to the north (Mundell, 2000; Walker, 1970). These conclusions are supported by a number of radiocarbon dates obtained by numerous authors included in Table 1. The location for each of these radiocarbon dates is shown in Figure 2. As the radiocarbon dates highlight, during the Holocene, marine shell species were present up to 14 km inland from the present coastline. The development of the Macleay River estuary is summarised in Figure 3.
Existing radiocarbon dates and new AMS dates obtained for this study from the Macleay River estuary.
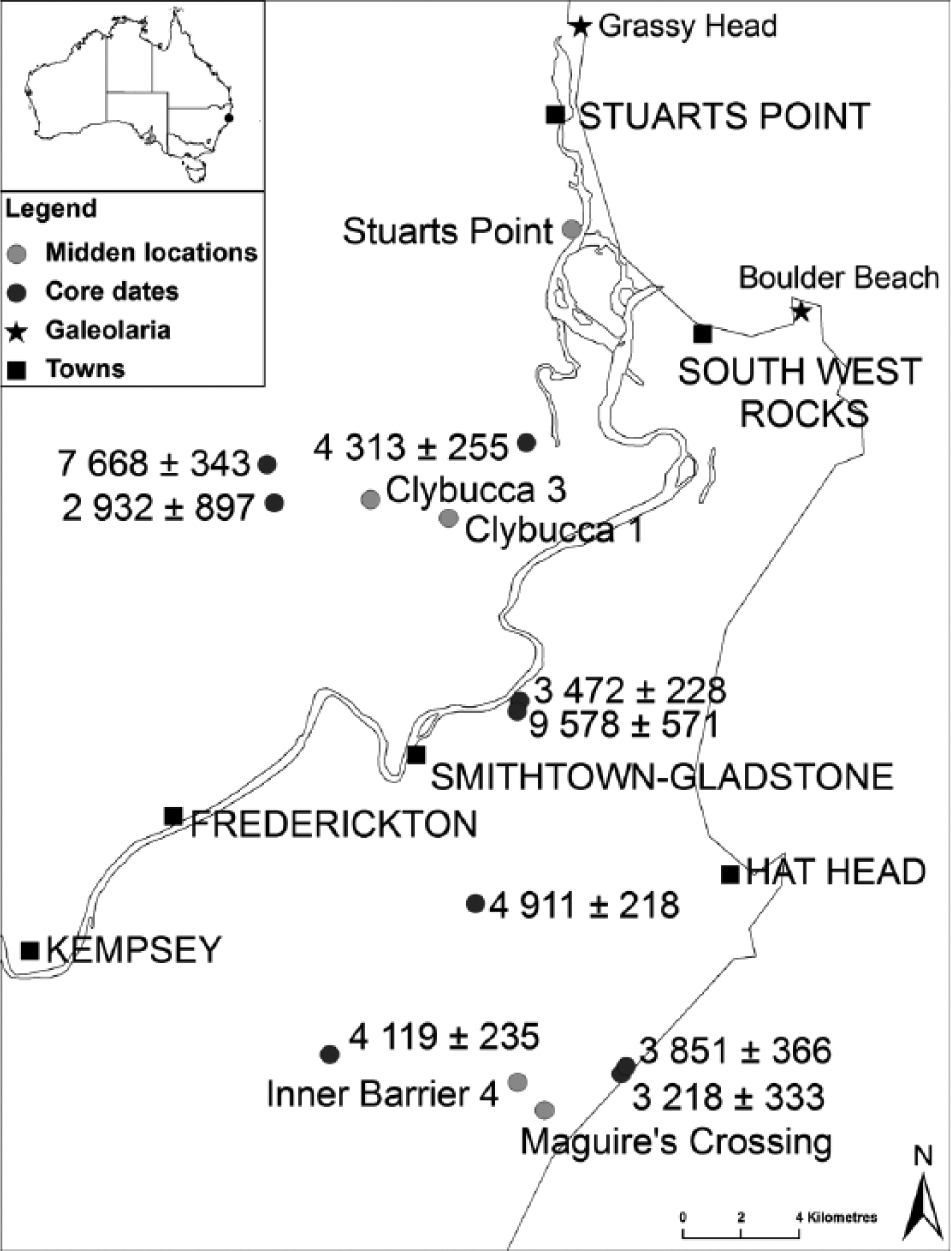
Locations of previously published conventional radiocarbon dates (Table 1) and Aboriginal middens in the Macleay.
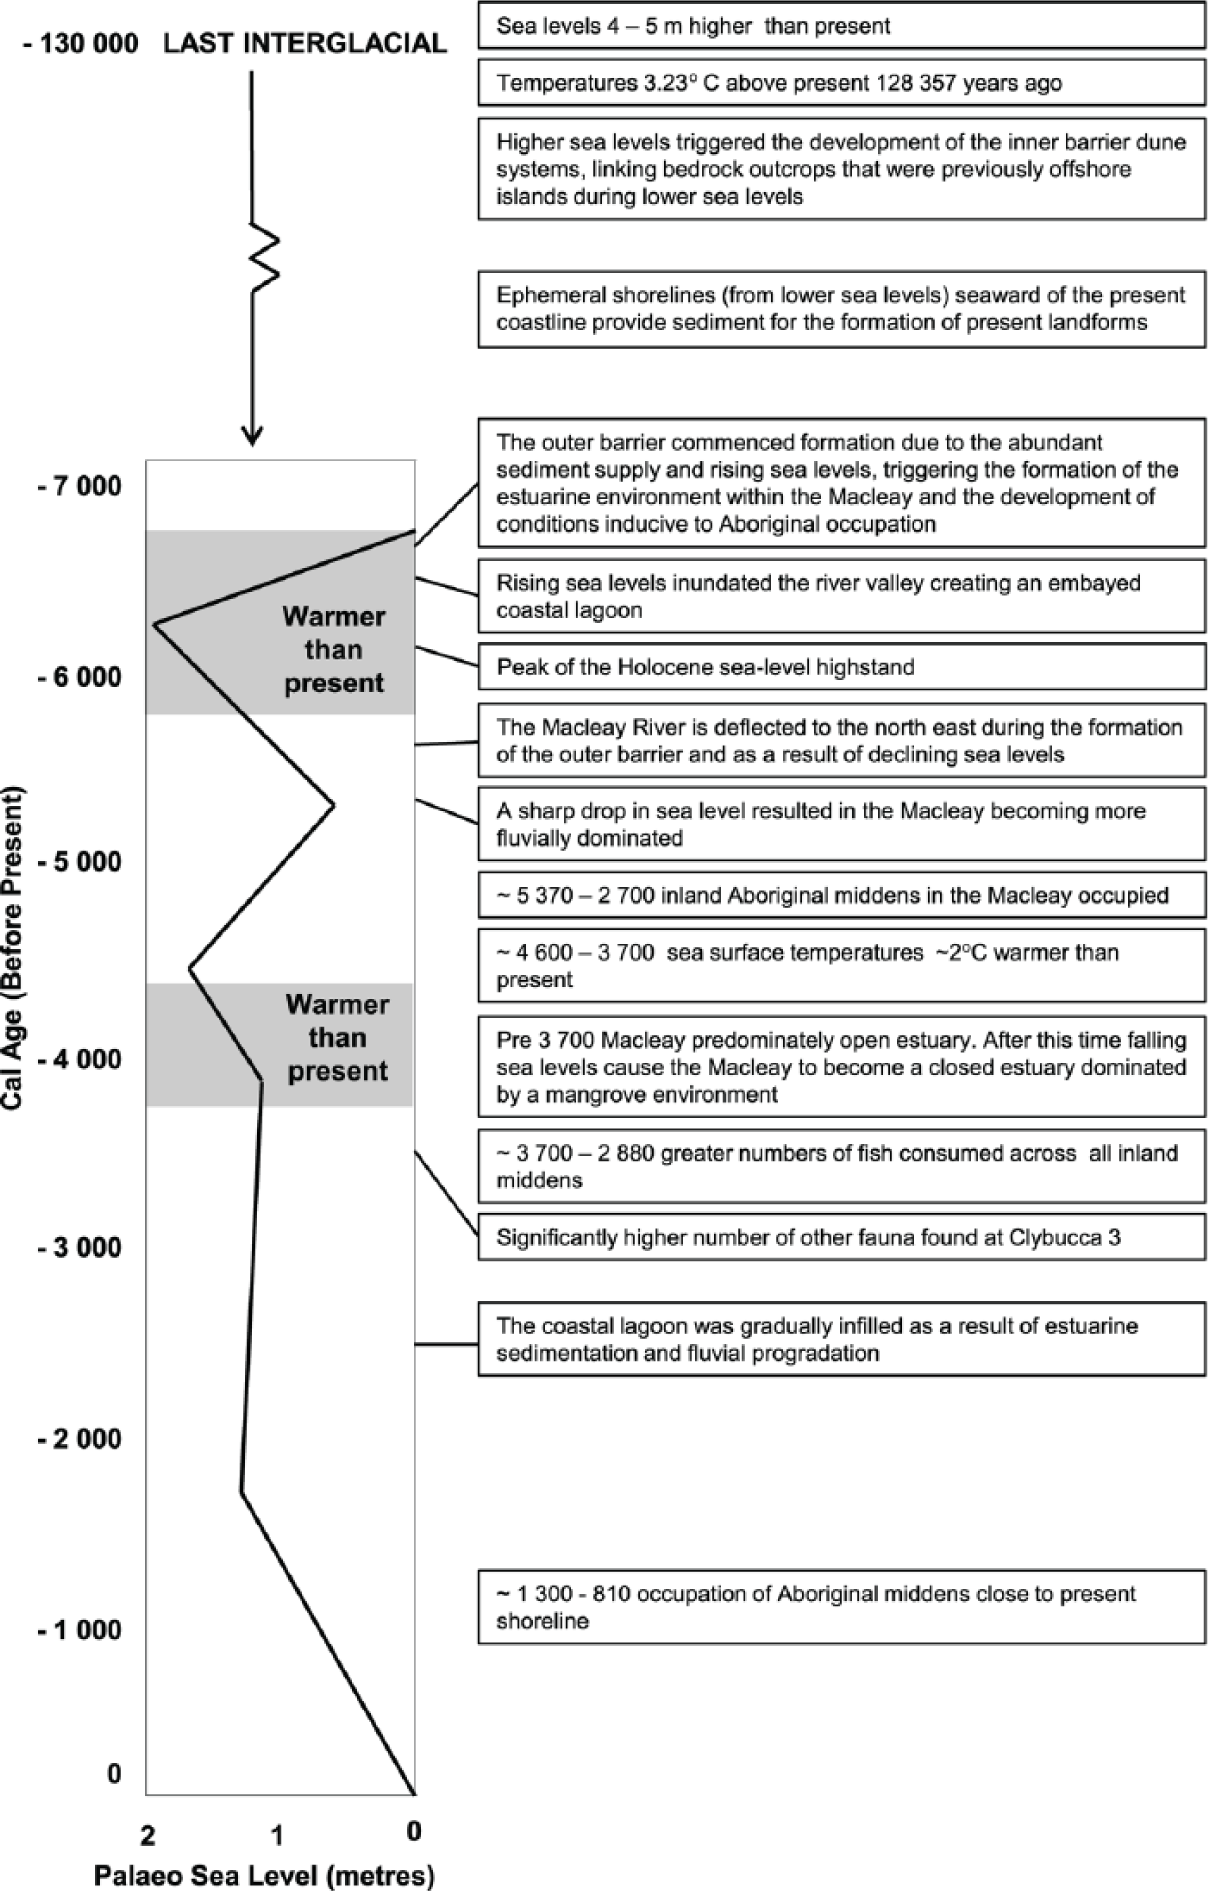
Evolution of the Macleay Valley, NSW.
Aboriginal middens: illustrating environmental change
The Macleay Region is home to some of the most extensive, well-studied Aboriginal middens on the east coast of Australia. Middens are collections of debris from shellfish and other food sources deposited over time by Aboriginal people. They provide a unique record of environmental changes that have occurred in an area and can be used as a secondary source for reconstructing palaeo-climatic conditions. Aboriginal people did not transport food far from the collection site, and as a result, middens are generally located close to the food source (Vale, 2004). Environmental change in the surrounding environment can also be inferred when a distinct change in the species present within a midden occurs (Ambrose, 1967; Nunn, 2007; Rodrigues et al., 2011; Sim, 1999). A fluctuating sea level would have had a significant effect on the prehistoric coastal populations of Australian Aborigines. A rising sea level would reduce available land and resources, while a retreating sea level would make available new shorelines and resources for exploitation (Vale, 2004). As Aboriginal middens were generally located close to the food source, they can thus be used as a secondary indicator of sea levels.
Aboriginal middens in the Macleay River estuary are located up to 12 km inland from the present coastline (see Figure 2 for midden locations). Radiocarbon dates from the inland middens of the Macleay River estuary show that they were occupied from ~5000 to 2000 yr BP, as shown in Figure 4. Changing proportions of species throughout the stratigraphy of the middens suggest that environmental change occurred during the life of the middens (Figure 4). In the Clybucca middens on the northern side of the estuary, Anadara trapezia and Pyrasus obinonus, increase in percentage towards the base of the middens and favour mudflats with still water, while the oyster (Crassotrea commercialis) increases in numbers towards the top and also thrives in these areas but requires roots or mangroves to establish (Campbell, 1969). Approximately 3700 cal. yr BP, an increase in the consumption of fish occurred simultaneously with an increase in the number of other fauna (such as kangaroos) in the middens.
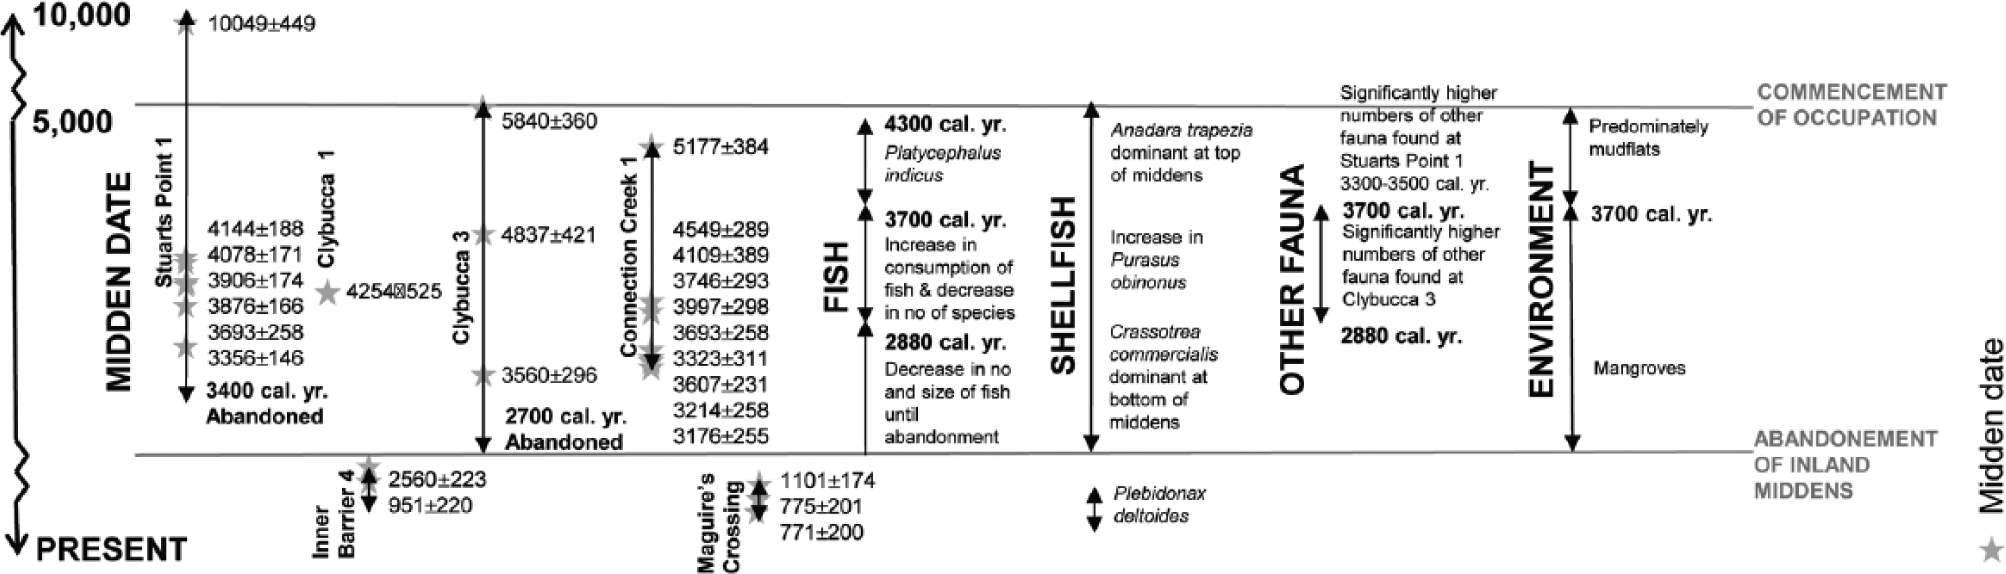
Macleay midden dates and species distribution.
Environmental change has also been observed in the Stuarts Point midden complex with similar changes in species’ distribution occurring to the Clybucca middens (Sullivan and Hughes, 1982) as illustrated in Figure 4. The disappearance of the tropical fish species Platycephalus indicus ~ 3700 cal. yr BP implies that temperatures also dropped at this time. This further supports the change, outlined in the Case Study Background, from an open estuary in the early Holocene to a series of confined channels with mangrove communities (Sullivan and Hughes, 1982). Later work undertaken by Connah (1975), Knuckey (1999) and Vale (2004) supported the conclusions made by Campbell (1969, 1972, 1978) and Sullivan and Hughes (1982). The abandonment of the inland midden sites ~ 2000 yr BP, seen clearly in Figure 4, supports a rapid fall in sea level (Sullivan and Hughes, 1982). Vale (2004) therefore concluded that changes in the location and species composition of the Macleay middens from the mid-Holocene were consistent with the expectations of a decreasing sea level, including two small oscillations.
Further work on the evolution of the Macleay coastline
Using light detection and ranging (LiDAR) data, each of the three scenarios proposed by Baker and McGowan (2013) were projected onto two sections of the Macleay. Because of limitations in accessing LiDAR data, it was not possible to complete LiDAR mapping on further areas within the Macleay River estuary. Inset 1 (Figure 1) illustrates the three scenarios applied to the township of South West Rocks, while Inset 2 (Figure 1) shows the three scenarios applied to a section of the former Holocene relict coastline identified by Duck (2000). The findings of the previous studies completed in the Macleay River estuary are supported by an additional two AMS dates obtained as part of this study. These were undertaken in order to gain a greater understanding of the environmental evolution of the Macleay River estuary. This paper also sought to apply and further advance the PPF methodology through the undertaking of ‘core samples’ to determine whether or not the proposed sea-level rise scenarios corresponded with the location of the Holocene shoreline.
Rocky coastline evidence
The occurrence of higher sea levels during the Holocene is supported by an AMS date of 1655 ± 110 cal. yr BP obtained from a relict G. caespitosa sample 1.46 m above the present G. caespitosa upper boundary at Grassy Head (located at the northern end of the study area, as seen in Figure 2). The height differential between relict and modern day equivalents has been used extensively by Baker et al. in the development of their Holocene sea-level curve (see Baker et al., 2001a, 2001b, 2004; Baker and Haworth, 1997, 2000a, 2000b; Flood and Frankel, 1989; Haworth et al., 2002; Smedley, 2009; Wright, 2007). The height of the G. caespitosa sample in relation to the Baker et al. curve can be seen in Figure 5. The date of this sample supports the evolutionary model of the Macleay River estuary outlined in the Case Study Background.
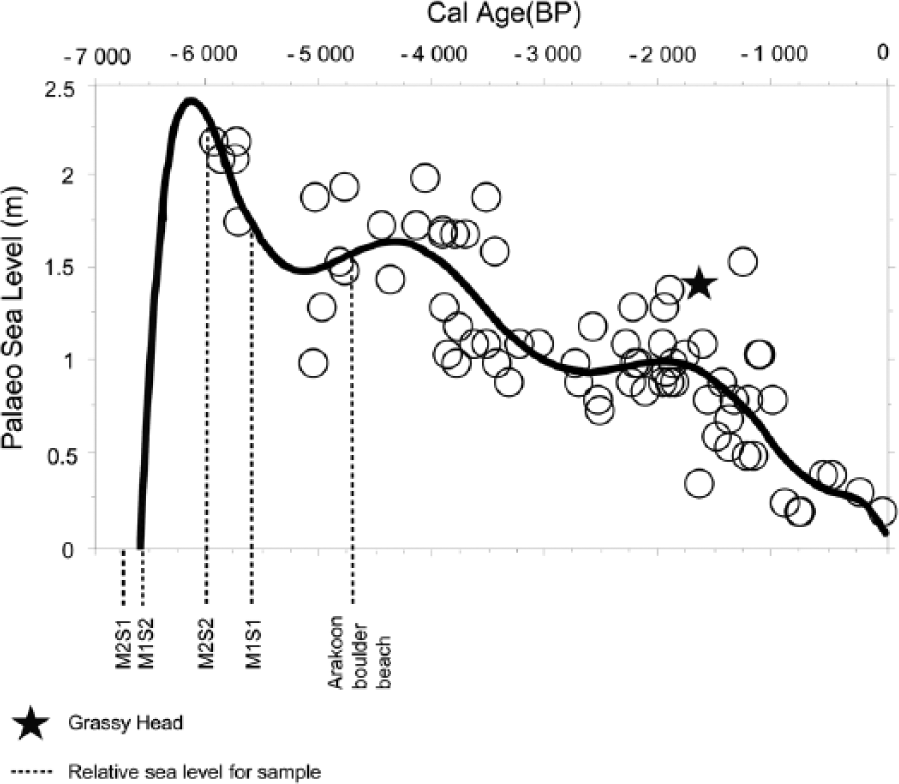
Relative heights of samples compared with the Baker et al. G. caespitosa sea-level curve.
Predominant wave direction and strength were also different to present during the Holocene. This is illustrated by the presence of a boulder beach at the southern end of Main Beach on the northern side of Arakoon Headland (see Figures 2 and 6). A minimum age of 4724 ± 107 cal. yr BP can be placed on the boulder beach based on an AMS date of a relict sample of G. caespitosa attached to a boulder. At present, the dominant swell direction on the east coast of Australia is from the south-east. Therefore, any boulder beaches forming under present swell conditions would be located at the northern end of the beach. The absence of a boulder beach on the northern end of the beach indicates that the current wave environment is not of sufficient strength to allow for the development of a boulder beach. The presence of a boulder beach at the southern end of the beach thus shows that at the time of formation, the wave direction was predominately from the north, under a higher energy wave environment than present. Figure 5 shows the relative height of sea levels, based on the Baker et al. curve, for the minimum age obtained from the G. caespitosa sample.
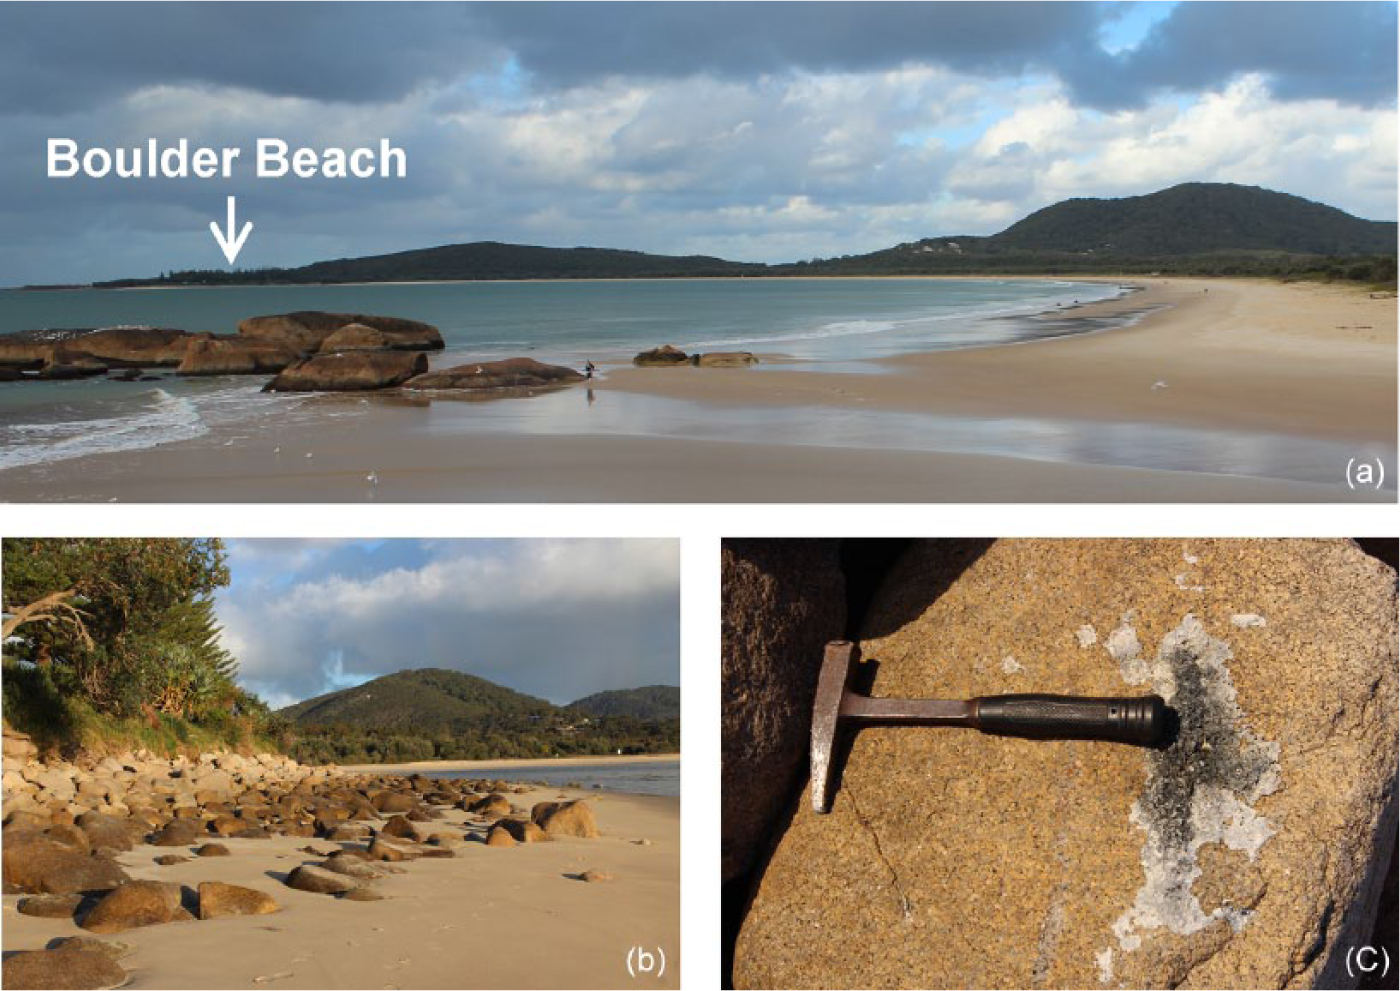
Boulder Beach at Arakoon Headland. (a) shows the extent of the Boulder Beach, (b) is a close up of the Boulder Beach and (c) shows the G. caespitosa sample that was collected from one of the Boulders for AMS dating.
Past estuarine evidence
As previously outlined, this study sought to further develop the PPF methodology. Additional coring was undertaken to check the results found in previously unpublished work and to test the proposed sea-level rise inundation scenarios. The undertaking of sample cores was necessary to ascertain whether or not the study area was estuarine during the Holocene, and whether these Holocene estuarine environments correlated with the proposed scenarios.
Three cores were collected from the Macleay River estuary study area in order to check the methodology. It was not possible to collect samples from the South West Rocks area as it has largely been disturbed by development. It was therefore decided to collect the samples from the area shown in ‘Inset 2’ of Figure 1 as this area had previously been identified as having Holocene evidence by Duck (2000). The location of each of the cores, and their correlation to each of the proposed scenarios, is outlined in Figure 1. A number of shells, including bivalves and gastropods such as A. trapezia, were extracted from the cores and AMS dated (AMS dates are presented in Table 1). A. trapezia is an estuarine species which inhabits intertidal mudflats. In the absence of tectonic uplift on the stable NSW coastline, its presence implies an ~2 m higher Holocene shoreline. In order to determine the relative sea-level height of each shell sample, they were plotted against the Baker et al. G. caespitosa sea-level curve (Figure 5). The species of the shells, and the relative sea level, support the evolutionary model of the Macleay River estuary outlined in the Case Study Background and Aboriginal middens, and Figure 3. All four of the samples support the first stage of the Holocene development of the Macleay River estuary where ~6500 yr BP rising sea levels inundated the valley, triggering the development of estuarine conditions and the formation of an embayed coastal lagoon. As can be seen in Figure 1, the locations of the sample cores correspond with the location of the proposed best-case scenario of a 0.9 m rise in sea level by 2100.
This new evidence, combined with both the geomorphological and midden evidence collected by previous authors, consistently demonstrates the presence of a sea level higher than present during the Holocene, with estuarine conditions extending significantly further inland. As a return to conditions similar to the Holocene is possible under a future higher sea level, it is important that the Holocene palaeo-environment is well understood. This demonstrates the importance of using the PPF methodology when projecting possible inundations under future climate change.
Planning implications of proposed scenarios
Future sea-level rise poses many challenges for the strategic planning and management of the coastal zone. The uncertainty associated with climate change is one of the greatest limiting factors in the prediction of climate change impacts and has greatly restricted the development of policy and the ability to plan for future changes (Nursey-Bray, 2009). As has been demonstrated (by Baker and McGowan, 2013), the PPF methodology provides an alternative for predicting the height of possible future sea levels as a result of climate change. To further illustrate its applicability, each of the three proposed scenarios was projected onto the case study area of South West Rocks in the Macleay River estuary. An audit was undertaken of infrastructure and land uses that would be inundated under each of the proposed scenarios. The extent of infrastructure affected under each scenario was quite different because of the large variations in the heights of each of the scenarios. As a result, the future adaptation options for each scenario will also be vastly different.
Under either a Scenario 1 sea-level rise of 0.9 m or a Scenario 2 sea-level rise of 2.6 m, little land would be inundated as illustrated in Figures 1 and 7. As outlined in Figure 7, sections of a few roads would be affected under either a Scenario 1 or a Scenario 2 rise in sea level, along with the Surf Club. However, the amount of land impacted would greatly increase under Scenario 3 conditions, along with a dramatic rise in the number of roads affected. As shown in Figure 7, a caravan park, the golf course and small sections of residential and industrial land would also be impacted under this worst-case scenario. Infrastructure such as power lines and sewerage were not included in this study as it was not possible to obtain information regarding their locations.
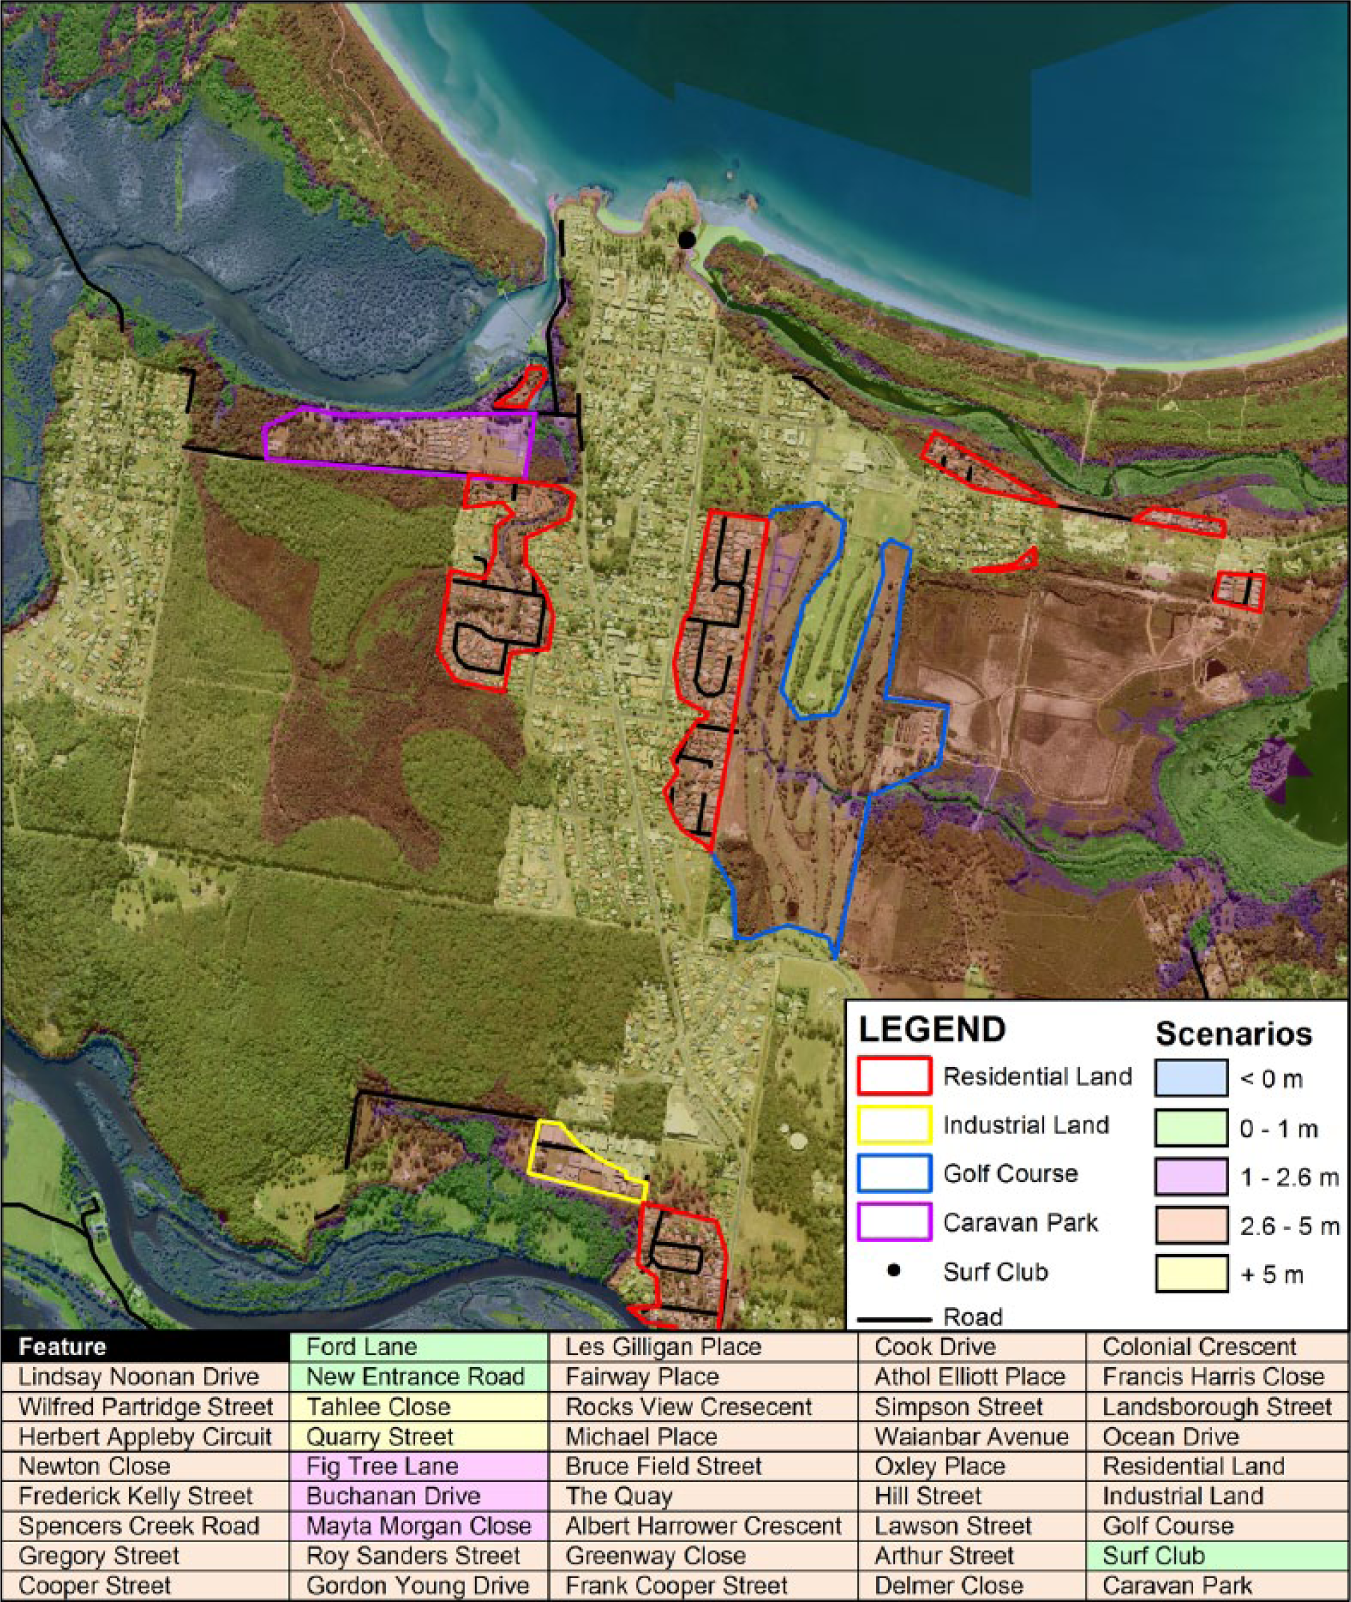
Affected infrastructure in South West Rocks.
It is important to note that outside of the case study of South West Rocks, there are numerous other towns that would be expected to be impacted by higher sea levels, including Smithtown, Gladstone and Stuarts Point. Large amounts of productive agricultural land would also be affected by either permanent inundation or increased flood heights. The Aboriginal middens identified in the Macleay would also be impacted under higher sea-level conditions. The potential impact of climate change on Aboriginal middens has largely been ignored in Australia, and it is predicted that many remaining coastal sites may be damaged or lost entirely as a result of rising sea levels and fluctuating coastal conditions (Rowland and Ulm, 2012). Changing conditions have already recently destroyed coastal midden sites, with an example of this occurring at Arrawarra, 140 km to the north of the study area (Smith, 1998).
Management responses to impacts
Management options available include retreat, accommodation or protection. Retreat is recognising that sea-level rise is inevitable, and therefore, the application of the precautionary principle is necessary (New et al., 2011). It involves the planned abandonment of infrastructure, buildings and land in vulnerable areas (Barnett, 2001; Hallegatte, 2009). Future development seawards of the setback line is prevented and existing development relocated (Titus, 2000; Yohe et al., 2007). Buildings constructed seaward of the setback line must be relocatable or sacrificed at the time of inundation (Rigby, 2005). Long-term, this option is more cost-effective than engineered solutions (Alexander et al., 2011); however, it may decrease market certainty and property values, and face significant resistance from affected property owners. New government policies and planning regulations would need to be developed to support the implementation of a retreat policy, with State and Federal Governments supporting Local Government through increased funding and technical support.
Accommodation allows for the continued occupation of vulnerable areas via adaptation of human activities (Nicholls, 2003; Niven and Bardsley, 2013; Hallegatte, 2009). Although accommodation is less desirable than retreat, it may be a necessary policy response in areas where retreat is not practical or possible (Bates, 2006; McDonald, 2007; New et al., 2011). Accommodation may be supported through a number of methods, including modification of buildings, land-use changes, modification of infrastructure and implementation of rolling easements. Rolling easements are a particularly effective management option as they allow shorelines to respond naturally to climate change with human activities retreating inland (Titus, 2000). They are based on the concept that a setback line is developed that allows for a buffer between the ocean and high economic value land uses and infrastructure. This setback line gradually moves inland in response to rising sea levels, with land uses of high economic value and infrastructure gradually retreating inland. Land uses with low economic value, such as parks, are located seaward of the setback line and are sacrificed as the shoreline moves inland. The construction of ‘hard’ or ‘soft’ engineering methods to protect assets is prohibited (Yohe et al., 2007). Rolling easements are one of the most flexible policies to account for scientific uncertainty and are able to be easily adapted in light of new scientific knowledge (Yohe et al., 2007). In the Macleay River estuary, a rolling easement is a viable policy option to accommodate climate change as few land uses of high economic value are potentially threatened under each of the three scenarios. Any land uses that are affected could be relocated further inland prior to impact.
Protection involves the defence of land, infrastructure and buildings vulnerable to sea-level rise (Hallegatte, 2009), and generally occurs when building retrofits are not possible, or property or infrastructure is not expendable (Bates, 2006; McDonald, 2007). It is likely that protection strategies will be adopted in areas that are densely populated or where heavy investment has occurred (Bates, 2006). Both ‘hard’ and ‘soft’ engineering approaches can be adopted, including the construction of built structures, such as sea walls, groynes and embankments, and the undertaking of beach nourishment (Barnett, 2001; Bray et al., 1997). While protection may allow for the continued occupation and use of vulnerable land and assets, it has high associated economic costs and can result in the loss of amenity and environmental values in surrounding areas. Protection can also worsen the impacts of sea-level rise in adjoining areas (Rigby, 2005). It may further encourage development in vulnerable areas, committing authorities to continue protection (Harding et al., 2009).
In the township of South West Rocks, relatively little developed land will be impacted by any of the three sea-level rise scenarios. A large portion of this land would be the golf course, which could easily be relocated with little impact to residents. All residential and industrial land (and associated roads and infrastructure) that may be impacted would only be affected under a worst-case Scenario 3 rise in sea levels of between 2.6 and 5 m. As this scenario is highly unlikely to occur, and because of the relatively high elevation of the land, it is probable that plenty of warning would be available to allow for the relocation of these vulnerable land uses. However, it would be recommended that authorities develop a rolling easement approach when considering development in areas affected by each of the three scenarios, and only approve activities and infrastructure that may be sacrificed or easily relocated at the time of inundation.
Although it was not possible to undertake vulnerability mapping in parts of the Macleay River estuary outside of South West Rocks (LiDAR data for other areas could not be obtained), an important piece of infrastructure that may potentially be affected by rising sea levels is the Pacific Highway. Rising sea levels, combined with an extreme flooding event, would lead to a significantly greater area of land being inundated. At present, the Pacific Highway is regularly inundated during flooding events (WMAwater, 2012). In order to address this, upgrade works are presently being completed to raise the Pacific Highway above the Macleay River floodplain. In the flood assessment for the upgrade, rising sea levels were considered; however, the report determined that under the NSW Government adopted 90 cm rise for 2100, no additional impacts would occur during a flood at the new Pacific Highway location because of the weaker tidal influences (WMAwater, 2012). Whether or not a rise in sea-level base will impact flooding events this far upstream is unknown, although it is more likely for higher sea-level scenarios (such as the proposed Scenarios 2 and 3) which were not considered as part of the assessment conducted for the Pacific Highway.
Finally, Aboriginal middens are vast stores of cultural, palaeo-climate, sea level and ecological information, all of which need to be recorded and preserved, where possible, to ensure that knowledge is not lost to future society. However, the location of Aboriginal middens within the Macleay River estuary presents a unique future management challenge under projected higher sea levels. Many of these sites are located within 5 m of present sea level, and could therefore be inundated by one or all of the proposed future sea-level scenarios. At this stage, very little has been published regarding possible future management options for Aboriginal middens. Climate change should thus signal the need to define and refine management processes in regards to archaeological sites, particularly in vulnerable coastal localities. Midden sites should therefore be identified, recorded and monitored to ensure that any changes that may occur are observed and subsequent management plans implemented in consultation with the local Aboriginal community (Rowland, 1992, 1999; Rowland and Ulm, 2012).
Conclusion
This study illustrates the need to consider a range of sea-level rise scenarios when undertaking vulnerability assessments at the local scale. Additionally, it highlights the potential of utilising evidence from previous episodes of sea-level rise when developing sea-level rise projections. A precautionary approach should be adopted to ensure that adequate planning occurs in the absence of certainty and policies should be updated continuously in light of new scientific evidence. Urban planning decisions also need to take into consideration that sea levels will continue to rise past 2100.
Footnotes
Acknowledgements
We would like to thank Cate MacGregor for her technical support and Heath Milne and Gavin Marks for their assistance with fieldwork. The LiDAR data and aerial images have kindly been provided by Land and Property Information (LPI) within the NSW Department of Finance and Services.
Funding
This work was supported by AINSE (Grant 12/112) and the School of Behavioural, Cognitive and Social Sciences at the University of New England.