



Abstract
Mean weighted Ellenberg indicator values were calculated for vegetation recorded from four successional stages on 39 glacier forelands in the Jostedalsbreen and Jotunheimen regions of southern Norway. The sites ranged in altitude from 80 to 1860 m a.s.l. Results revealed a trend of decreasing mean indicator values for light, reaction and nitrogen on successively older terrain. Mean indicator values for moisture did not show a consistent pattern of variation according to successional stage. When stratified according to altitude, sub-alpine and boreal sites showed the most rapid decrease in pH and productivity levels through time. Within this altitudinal zone, mean values after 70 years of succession were already indistinguishable from those for the mature vegetation. At higher altitudes, in the alpine zone, a more gradual decrease was detected but culminated in similar values. A significant trend in decreasing indicator values for light with succession was found at all except the high-alpine sites where the value for mature vegetation was not significantly different from that for earlier stages. Also evident was the greater decrease in mean value for light at the lowest altitudes, reflecting the establishment of a birch-woodland canopy. Use of snowmelt indicators improved interpretation of the differences between late-successional stages according to altitude. Variance partitioning revealed that differences between successional stages accounted for 29% of the variation in mean indicator values, whereas altitude accounted for an additional 12%. Indicator values have provided a useful comparison of rates of succession and associated vegetation development within different altitudinal zones, inferring possible mechanisms of change at a regional scale.
Keywords
Introduction
The use of ecological indicator (EI) values has provided a valuable tool for understanding climatic and edaphic elements of environmental change, using vegetation assemblages as a proxy for field measurements of environmental factors (e.g. Hill and Carey, 1997; Persson, 1981; Seidling and Fischer, 2008). EI values have been used to investigate a variety of habitats, particularly in Europe, including Swedish park-meadow (Persson, 1981), British grassland (Hill and Carey, 1997) and Norwegian alpine tundra (Odland, 2009). A broad geographical approach was used to detect changes in the level of nitrogen deposition in European forest ecosystems (Seidling and Fischer, 2008). They have proved particularly useful in examining vegetation responses to environmental changes such as levels of atmospheric nitrogen deposition and acidification (e.g. Diekmann and Duprè, 1997; Duprè et al., 2009; Stevens et al., 2010) and have also been used in palaeoecological studies (e.g. Birks et al., 1990). For an overview of the use of indicator values in applied plant ecology, see Diekmann (2003).
This paper aims to determine whether and in what ways indicator values can be extended by contributing to the understanding of ecological and environmental change during the process of primary succession, including the early pioneer phase of vegetation colonisation and later phases in the development of a mature vegetation cover. Glacier forelands are ideal field sites for such a study, as they are relatively simple ecosystems, and geomorphological research on many of the sites has led to terrain dating, thereby facilitating the use of the chronosequence approach (Matthews, 1992). While a small number of glacier forelands in Norway have been intensively studied in terms of primary vegetation succession and related environmental change (Haugland and Beatty, 2005; Matthews, 1978, 1979; Matthews and Whittaker, 1987; Vetaas, 1994, 1997; Whittaker, 1989, 1991, 1993), studies on a regional level that allow wider generalisations to be made are fewer (Robbins and Matthews, 2009, 2010). Using a large data set also enables analysis of indicator values over a range of altitudes. Thus, the relative contributions of altitudinal factors and successional change to variation in indicator values can be quantified.
The specific objectives of this paper are as follows:
To use EI values to quantify changes in physical and chemical factors on glacier forelands along successional gradients;
To analyse the effects of altitude on variation in mean EI values between successional stages;
To discuss the implications of the results in relation to underlying processes operating in primary vegetation succession;
To evaluate the use of EIs as a tool for the study of ecological and environmental change in a severe and frequently disturbed environment.
EI values
EI values constitute an ordinal scale of values for plant species that quantify the factors (e.g. moisture or light intensity) that are typical of sites where that species is commonly found. In order to be a useful indicator, a species needs to occur within a limited range of environmental variables, that is, to have a narrow ecological amplitude. Based on this assumption, combining indicator values for species occurring together provides an estimate of abiotic conditions influencing the vegetation as a whole. The result can provide a proxy for instrumental field measurements, and the use of combined EI values to detect vegetation community responses to environmental change therefore has potential application at a broad geographical scale. This is particularly useful when direct measurement of environmental variables is not possible because of time or equipment constraints or in retrospective evaluation of data sets (e.g. Duprè et al., 2009; Jandt et al., 2011).
The original Ellenberg EI values for vascular plants (Ellenberg, 1974; Ellenberg et al., 1991) constitute a system that continues to be used extensively to quantify six factors based on vegetation or floristic data: moisture (F), light (L), reaction (R), temperature (T), continentality (K) and nitrogen (N). EI values have been criticised as being subjective (e.g. Wiegleb, 1986) for not being independent of each other (Pakeman et al., 2008) and for not quantifying ecological amplitudes (Wamelink et al., 2005). Ellenberg et al. (1991) maintained that direct measurements of environmental variables and species distribution data were used where possible to calibrate the original values and that the indicator values are intended to characterise the ecological behaviour of plants rather than their ecological requirements.
Hill and Carey (1997), in their study of the correlation between EI values and grassland yield, considered Ellenberg nitrogen (N) values to reflect general productivity or soil fertility rather than being a measure solely of available nitrogen levels. Similarly, Southall et al. (2003) concluded that the N value represented a combination of nutrient availability (including N, P and K). Seidling and Fischer (2008) found a strong correlation (r = 0.77) between EI values for reaction and pH measurements in the soil organic layer and between EI values for nitrogen and measured available nitrogen in the soil. As soil pH influences the general nutrient status of the soil, including total calcium content and exchangeable calcium ions, it has been proposed that EI values for reaction may be more accurately regarded as a reflection of ‘calcium values’ (Schaffers and Sykora, 2000). For simplicity, the original terms allocated to this value, that is, ‘nitrogen’ and ‘reaction’ (or pH), are used throughout this paper, but the findings are discussed in terms of more general soil nutrient/productivity levels.
Ewald (2003) supported the robustness of Ellenberg’s values, finding them to be fairly resilient to incomplete sampling in an experiment that progressively omitted species. Southall et al. (2003) in their spatial and temporal analysis of vegetation mosaics in Cornish poor-fen communities found weighted EI values for nitrogen, light, reaction and moisture to be an effective method of typifying plant communities. Minor variations in species composition and relative abundance were found to reflect environmental variation. In practice, they have proved useful, for example, in aiding the interpretation of ordination diagrams (Persson, 1981). Zelený and Schaffers (2012) questioned the validity of using mean EI values as variables to explain ordination axes, pointing to the danger of circular reasoning when using EI values derived from vegetation to explain patterns within the vegetation. However, in a meta-analysis of published studies, they found that, although patterns may appear stronger than those detected using measured environmental variables, in most cases this did not produce a misleading interpretation of ecological relationships.
Ellenberg’s original values were compiled for Central Europe and have since been adapted on a regional/national basis (e.g. Hill et al. (1999) for Great Britain and Ireland and Vevle (1985) for Norway). This is of considerable importance, as the relationship of species to particular environmental factors may change as they reach the limits of their range (Persson, 1981).
The use of plant assemblages as environmental indicators has been extended to include factors other than Ellenberg’s original six values. For example, Odland and Munkejord (2008) devised snow indicator values based on vegetation cover in plots where the Julian day of complete snowmelt was also recorded. The values range between 1 (strictly chionophobous) and 9 (strictly chionophilous) and were used to compare snow conditions at different altitudes.
EI values and successional change
Previous studies using EI values have tended to focus on their use in characterising established rather than developing vegetation. For example, Wamelink et al. (2005) found that the predictions of pH for older successional stages were more accurate than those for younger stages. This supports the conclusions of Hill and Carey (1997) that long-established vegetation provides the most sensitive measure of environmental factors and the findings of Dzwonko (2001) that indicator values provided a more accurate assessment of conditions in ancient than recent forests. One explanation of this is the fact that ‘early’ vegetation can be determined by initial floristic composition (IFC) rather than environmental constraints. However, the IFC model may be more appropriate for consideration of processes in secondary rather than primary succession. Schaffers and Sykora (2000) suggested that EI values also represent integration over time. This presents a challenge if the aim of research is to detect change occurring during succession or in frequently disturbed or high-altitude habitats where it is questionable whether the vegetation ever becomes ‘mature’ in the commonly used sense of the term. Moreover, the geoecological model of succession is based on the assumption that vegetation establishment is an integral component of the developing landscape (Löffler, 2003; Matthews, 1992; Troll, 1971, 1972). Zonneveld (1983) considered the temporal dimension of vegetation recording in his comment on the value of biological indicators to assess factors that cannot easily be represented by a single field measurement, that is, the fact that the vegetation may reflect the cumulative effects of environmental change. This has implications for the study of successional processes and points to the potential value of EIs as a measure of the effects of environmental factors along vegetation gradients in space and time.
A small-scale study by Grimm (2000) on two glacier-foreland chronosequences in southern Norway compared estimates of soil pH using EI values for reaction with Messer’s (1988) direct measurements, and found statistically significant correlations. Grimm concluded that, although small-scale disturbance on glacier forelands tends to produce a mosaic of substrate characteristics, average environmental conditions could be estimated from the vegetation as a whole. Mean EI values for light, moisture, nitrogen and pH were also used successfully by Bossuyt et al. (2003) to characterise processes of succession on wet dune slacks. Thus, previous evaluation of the use of EI values in the context of succession has been limited, and the present investigation represents the first time a large data set has been used to investigate this question.
Variability in successional processes with altitude
The use of a large data set also allows site analysis according to altitude where, over short distances, steep environmental gradients can be equivalent to very large differences in latitude. Altitude is associated with changes in a large number of environmental variables and is generally considered to be a complex of inter-related factors. For example, increasing altitude in the temperate zone is generally accompanied by decreasing temperature, strengthening winds and higher maximum solar radiation (Körner, 2003), while research on glacier forelands in Norway has revealed a pattern of decreasing cation exchange capacity (CEC), loss on ignition and soil depth with increasing altitude (Messer, 1988). The decrease in species richness with altitude (e.g. Austrheim, 2002; Bruun et al., 2006) is attributed to abiotic factors, which result in fewer successful colonisations at higher altitudes. Succession has also been shown to proceed at a slower rate with increasing altitude in the study area, with little successional change occurring above 1600 m (Robbins and Matthews, 2010). The effectiveness of altitude-related controls on vegetation composition was also found by Robbins and Matthews (2010) to increase during succession (i.e. altitudinal effects were detected to a greater extent in mature than in early-successional vegetation).
Materials and methods
Study sites
The study involved 39 glacier forelands within the Jotunheim and Jostedalsbreen regions of south-central Norway, ranging in altitude from 80 to 1860 m a.s.l. and lying between latitudes 61°N and 62°N and longitudes 6°E and 9°E. The 10 glacier forelands in the Jostedalsbreen region are mainly below the ~850 m tree-line, within the boreal and sub-alpine birch (Betula pubescens) belts, whereas the forelands in Jotunheim predominantly lie above the tree-line (which occurs at 1100–1200 m) in the low- to high-alpine belts (Dahl, 1986; Moen, 1987). Meteorological data for the Jotunheim region give a mean annual precipitation of 860 mm at an altitude of 1413 m, while for Jostedalsbreen at 324 m, the mean value is considerably higher at 1380 mm (Aune, 1993). Corresponding mean annual air temperatures are −3.1°C in the Jotunheim region and +3.7°C in the Jostedalsbreen region. The high-altitude forelands in Jotunheimen are affected by permafrost, where the lower altitudinal limit of widespread mountain permafrost lies at ~1600 m (Etzelmüller and Hagen, 2005). The underlying geology is acidic granitic gneiss in the Jostedalsbreen region and pyroxene granulite gneiss in the Jotunheim region. The main land uses are, in the Jostedalsbreen region, agriculture, recreational pursuits and hydro-electric power generation and, in the Jotunheim region, outdoor recreation and summer grazing of sheep, goats, cattle and domestic reindeer. Much of both regions have National Park status.
The glacier forelands studied have a general northerly or easterly aspect and are subject to disturbance from glacial fluctuations, strong winds, cryoturbation of the substrate and meltwater inflow during the summer months. These disturbances are particularly strong within the pioneer zone adjacent to the glaciers (Matthews, 1999). The substrates consist of unconsolidated glacial and glaciofluvial sediments in the process of adjusting to removal of the ice and are predominantly water-saturated.
Data collection
Vegetation in four successional stages was sampled on the 39 glacier forelands (Table 1) using a chronosequence approach. Details of the location of each foreland are given in Robbins (2007) and Robbins and Matthews (2009, 2010). The presence of vascular plants was recorded in contiguous 2 × 0.5 m2 quadrats along a transect perpendicular to the glacier snout, and recording continued until 100 plants had been recorded in each stage. This is a rapid method of assessment, providing a measure of the relative local frequency of each species and allowed sampling at a large number of forelands. Terrain age was ascertained using a combination of methods, including geomorphological and historical evidence, lichenometric dating and the frontal variations of glaciers that have been monitored, in some cases on an annual basis, since the beginning of the 20th century (Bickerton and Matthews, 1993; Matthews, 2005; Nesje et al., 2008). The pioneer stage was recorded on terrain that had been deglaciated within ~20 years. Subsequent stages recorded were as follows: early successional, on terrain deglaciated for ~70 years; late successional, on terrain deglaciated for ~250 years; and mature vegetation, on terrain deglaciated for ~10,000 years. Altitude was estimated to the nearest 10 m a.s.l. using the position of the glacier snout on topographic maps with a contour interval of 20 m.
List of glacier forelands in relation to region, altitude and altitudinal zone.

Regions – Jost: Jostedalsbreen; Jot: Jotunheimen. Altitudinal zones – 1: boreal/sub-alpine; 2: low-alpine; 3: mid-alpine; 4: high-alpine.
Glacier forelands are naturally heterogeneous habitats, but efforts were made to locate the transects on flat, even and relatively stable surfaces, avoiding streams, pools and lakes to ensure similar microtopography and moisture conditions. Nomenclature conforms with Lid and Lid (1994).
Data analysis
Data analysis was carried out using PC-ORD Version 4.33 (McCune and Mefford, 1999), Canoco Version 4.54 (ter Braak and Šmilauer, 2006) and Minitab Version 15.
Mean EI values
All sites were initially included in a single analysis to identify general successional trends in mean EI values between the pioneer vegetation and subsequent successional stages for glacier forelands within the region as a whole. Mean weighted EI values were used, thus taking into account the relative abundance of each species at each stage of succession (cf. Odland and Munkejord, 2008).
EI values for Norwegian plants (Vevle, 1985) adapted from those of Ellenberg were used, where available, rather than the original Ellenberg values. Odland (2009) suggested that these revised values may be better suited to environmental conditions found in this region of Norway. For a number of species, there were individual values missing from Vevle (1985), and original Ellenberg values were substituted (50 species). The majority of these (34 species) had only one value missing. In the small number of cases where Ellenberg had not attributed individual values (eight species), those for British Plants (Hill et al., 1999) were used: notably, the pH value for Poa alpina (an important pioneer species), the implications of which are discussed below. For species occurring at low abundances with no attributed indicator values (suggesting a broad ecological tolerance), these were omitted from the calculation and the relative frequencies of remaining species were adjusted accordingly. Only one abundant species (Salix glauca) was omitted from the analysis because of missing indicator values. Thus, 122 of the 136 species recorded were included in the analysis of mean EI values.
Snowmelt indicators (Odland and Munkejord, 2008) were available for a number of species within the data set. These values, where available, were used to provide an additional perspective for key indicator species. Where published field measurements were available (Messer, 1988) for the sites studied, these were correlated with the estimated mean weighted EI values.
Ordination of sites
The relationship between the composition of vegetation on sites at different stages of succession was analysed using non-metric multidimensional scaling (NMS), with Sørensen distance as the dissimilarity measure (Bray and Curtis, 1957). This provided a visual representation of the compositional differences between sites based on species relative abundances. NMS ordination was carried out using the most thorough PC-ORD autopilot option (40 runs with real data, 50 randomised runs, a maximum of 400 iterations and an instability criterion on 0.00001). Stress levels below 20% were judged to provide a satisfactory representation of the relationship between sites (Clarke, 1993). A final instability of 10−4 was considered to be acceptable (McCune and Grace, 2002). NMS was selected as a suitable ordination method as it plots sites in rank order of compositional distance and therefore extracts information from non-linear as well as linear relationships. Site symbols on the resulting ordination diagrams were subsequently scaled according to mean EI values.
Altitudinal variation
Mean EI values were calculated for vegetation at four successional stages within the following altitudinal bands: <1000, 1100–1480, 1500–1600 and 1620–1860 m. This particular stratification facilitated analysis by allocating a similar number of forelands (9–11) to each altitudinal band. Although these bands do not correspond exactly with traditionally recognised alpine zones and belts (e.g. Moen, 1987, 1999), they are more or less equivalent to boreal/sub-alpine, low-alpine, mid-alpine and high-alpine belts, respectively, and these terms are used throughout this paper. Robbins and Matthews (2010) found that this did not significantly alter the vegetation units identified.
Variance partitioning as a component of canonical correspondence analysis (CCA) using Canoco (ter Braak and Šmilauer, 2006) was used to provide a measure of the relative contributions of successional stage and altitudinal band to the variation in mean weighted EI values within the data set.
Indicator species analysis
Robbins and Matthews (2010) identified four major vegetation groups on the 39 glacier forelands sampled, used indicator species analysis (Dufrêne and Legendre, 1997) to identify important species within these groups and described the occurrence of the groups in different successional stages and at different altitudes. As species that are good indicators of vegetation groups are those that are, by definition, relatively abundant in and faithful to sites within that group, the EI values of these species are considered to be particularly useful in defining ecological and environmental change. These indicator species values are therefore considered in addition to mean weighted site indicator values.
Results
A total of 136 species were recorded on the 39 glacier forelands in the study area. Of these, the 122 species used in the analyses were those to which EI values could be assigned for all four indicators.
General trends in EI values with succession
A single NMS ordination of sites at all four stages of succession on the glacier forelands produced a two-dimensional ordination with a stress of 20% (p = 0.03) and an instability of 10−4 after 75 iterations. The ordination was rotated to obtain maximum correlation between axis 1 and successional stage (r = 0.792, p < 0.01) to facilitate identification of successional patterns. This also revealed a strong correlation between axis 2 and altitude. Vectors were superimposed on the ordination diagram to indicate the direction of trends in increasing EI values and to relate these to successional stage and altitude (Figure 1). Correlation coefficients between NMS ordination scores and mean EI values were also calculated (Table 2). These reveal a trend of decreasing mean EI values for light, reaction and nitrogen with successional stage (r = −0.431, −0.802 and −0.621, respectively) and increasing EI values for light with altitude (r = 0.682).
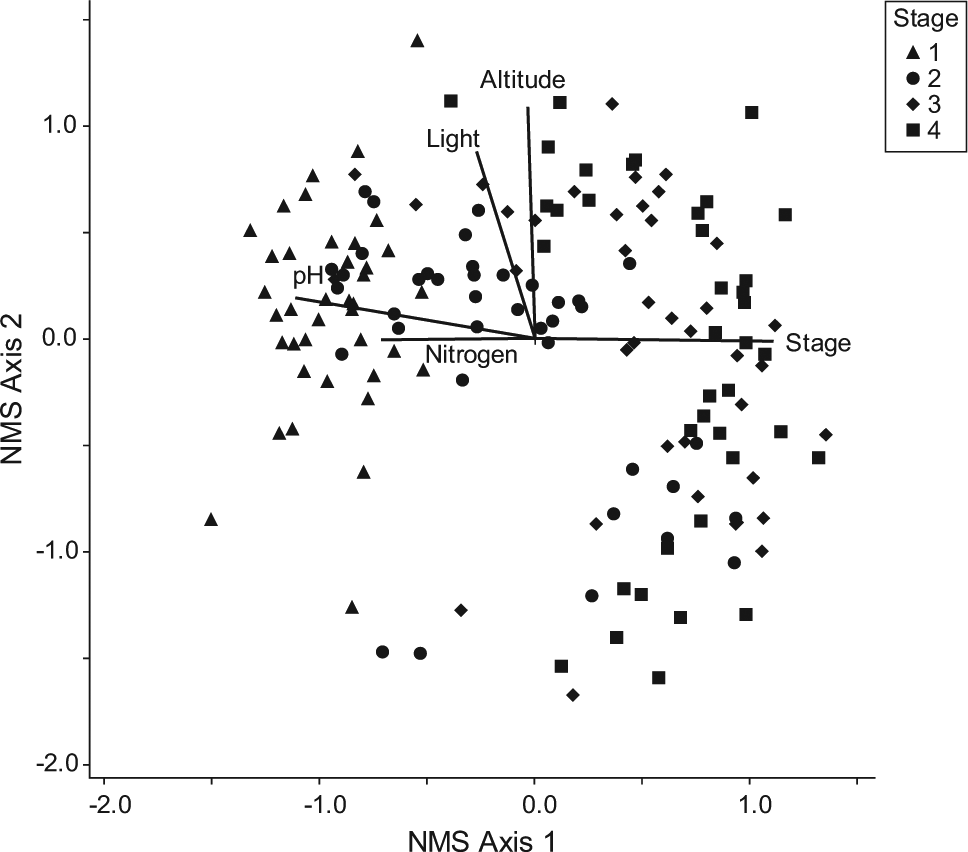
NMS ordination of four stages of succession on 39 glacier forelands. Stages: 1 = <20 years (pioneer), 2 = ~70 years (early successional), 3 = ~250 years (late successional) and 4 = ~10,000 years (mature). Superimposed vectors indicate trends in increasing EI values for mean light, reaction (pH) and nitrogen and relate these to altitude and successional stage.
Correlation coefficients between NMS ordination scores and mean EI values for all glacier-foreland sites.

NMS: non-metric multidimensional scaling; EI: ecological indicator.
The results are also presented in the form of ordination diagrams with site symbols scaled according to mean EI values (Figure 2a–d). Variation in mean EI values between sites at the same stage can thus be identified. These confirm the patterns identified above and also reveal that individual site values for moisture are highly variable within all stages, whereas those for light are much less variable and those for reaction and, to a lesser extent, nitrogen are more consistently variable between rather than within stages.
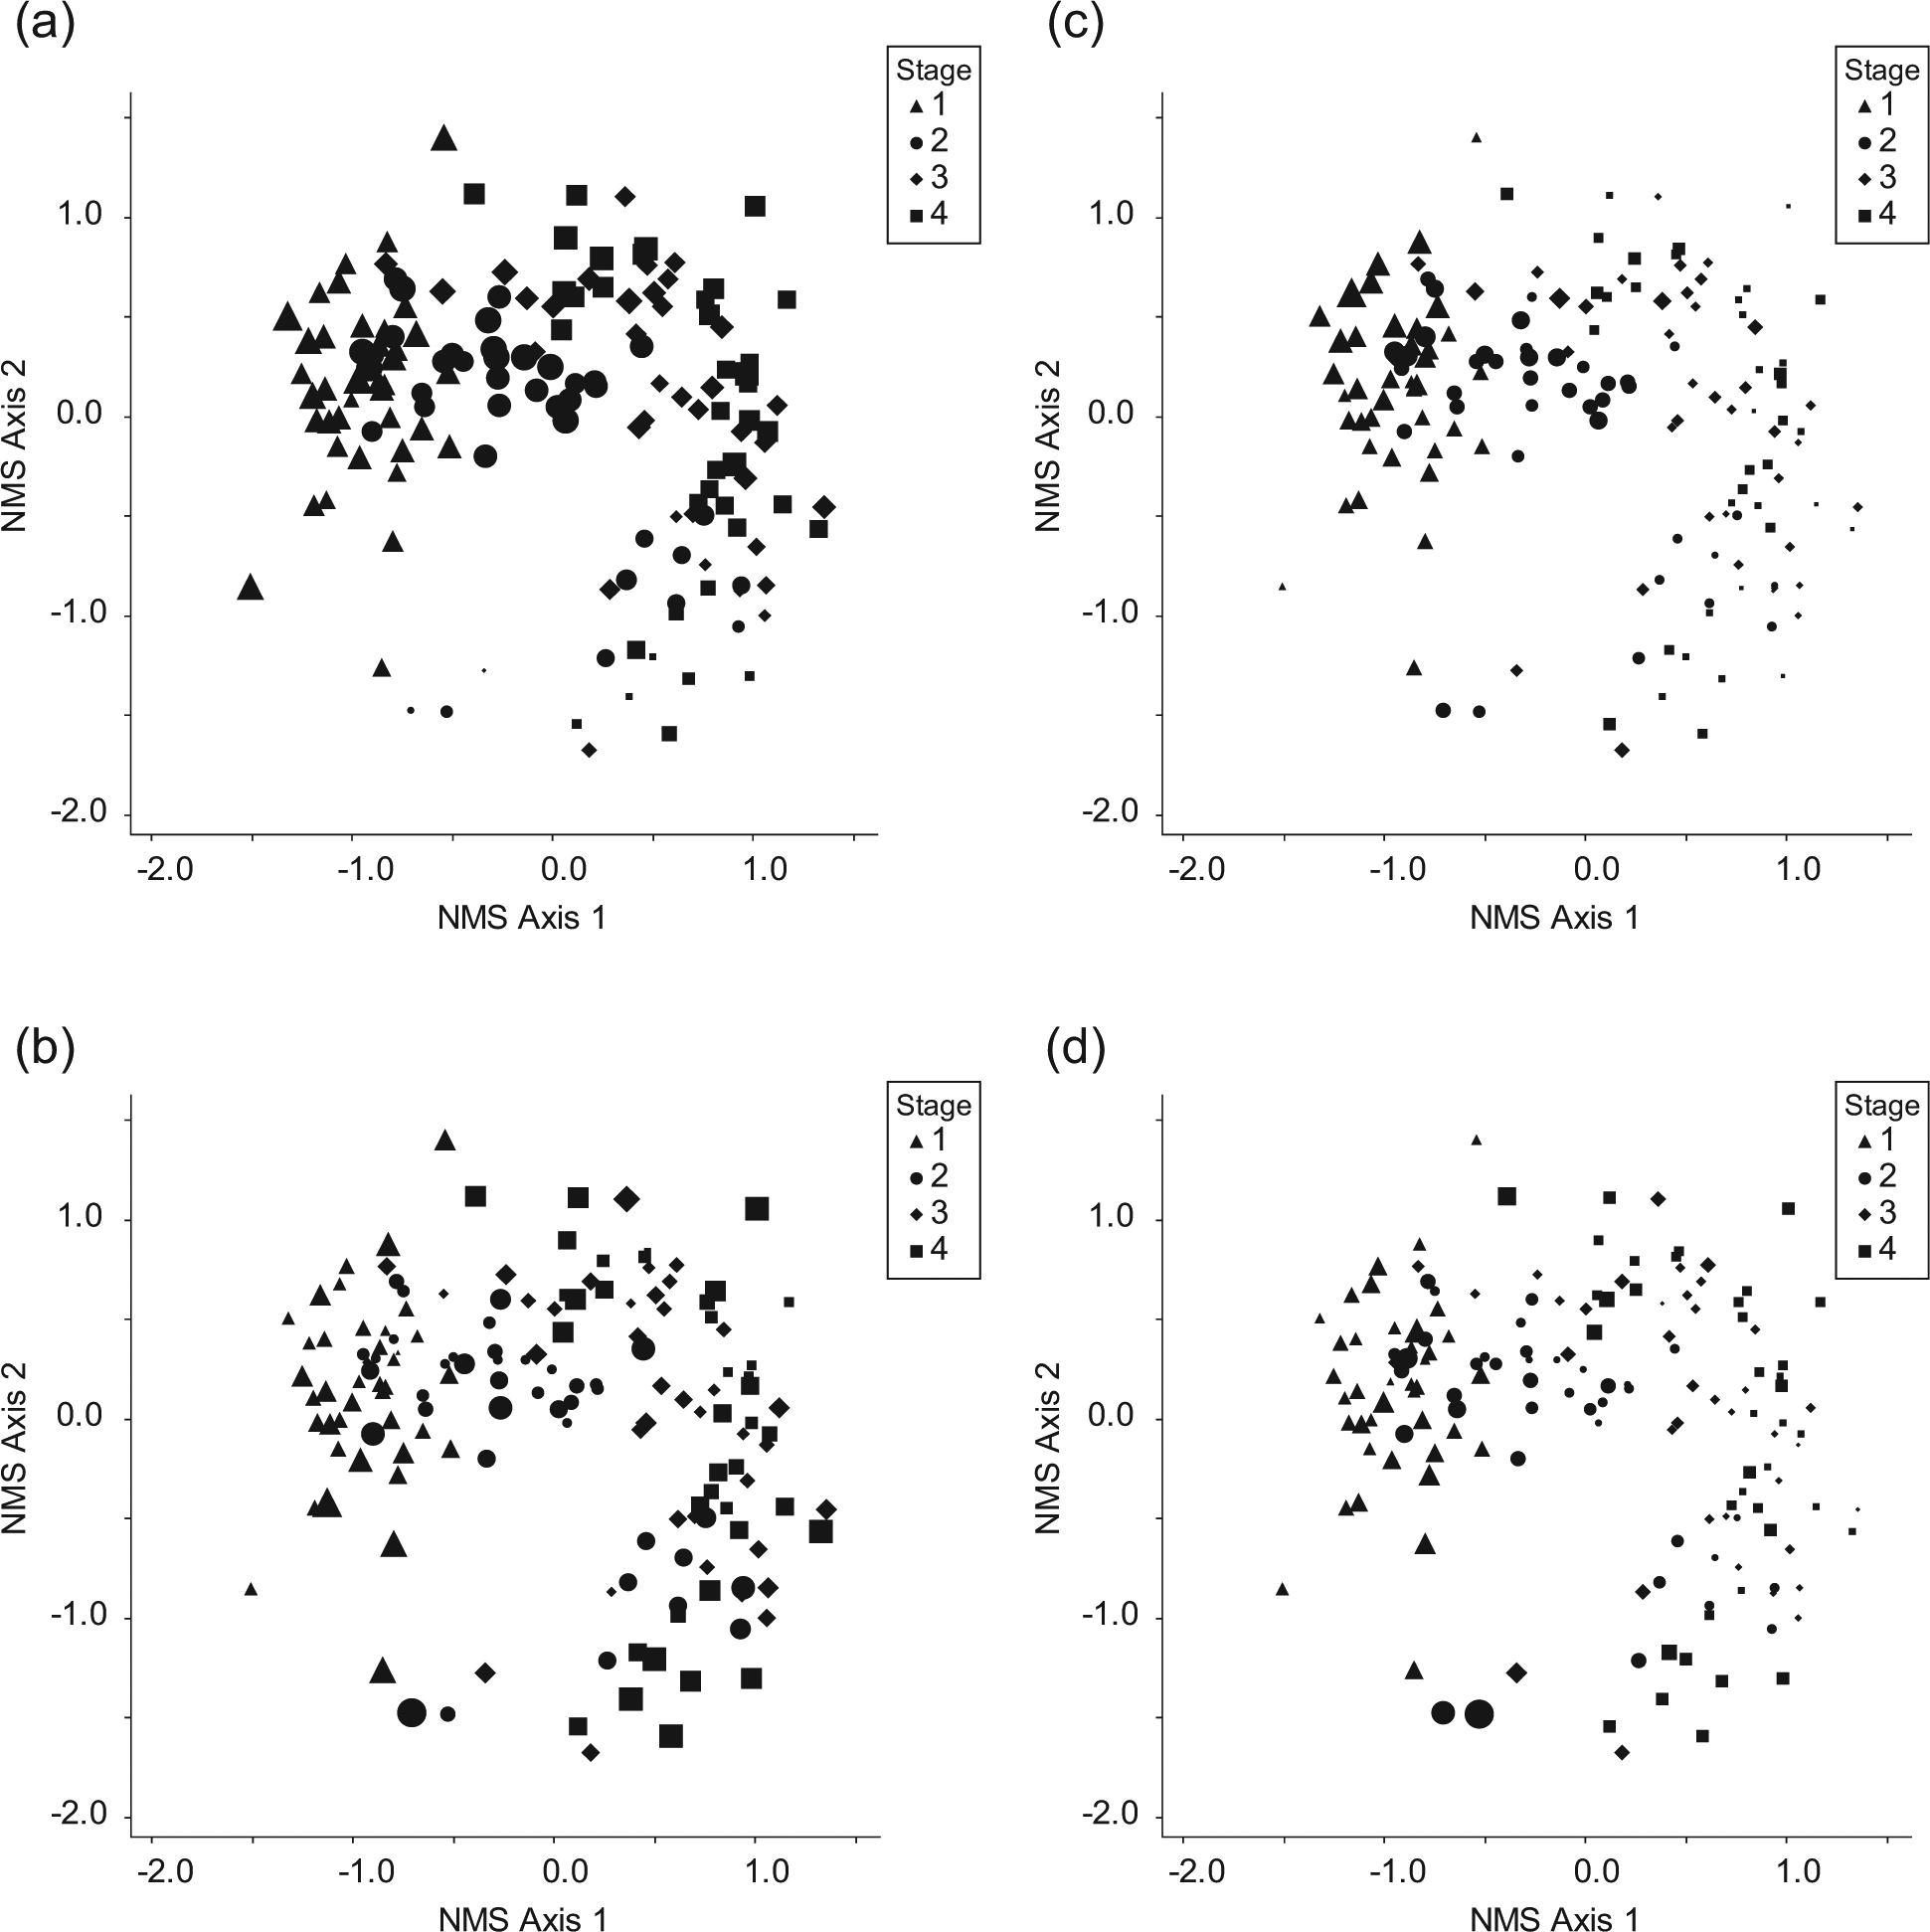
NMS ordination of four successional stages (1 = pioneer; 4 = mature) on 39 glacier forelands. Stage symbols are scaled according to relative EI values for (a) light, (b) moisture, (c) reaction and (d) nitrogen. See Figure 1 for full explanation of successional stages.
Table 3 and Figure 3 present the mean weighted EI values (± 95% confidence interval (CI)) for four stages of succession on the 39 glacier forelands. A number of successional trends can be confirmed. The most consistent trend can be seen in relation to the mean EI value for reaction, with a significant difference between all four stages and a consistent trend in decreasing values as succession proceeds (from 5.01 ± 0.27 in the pioneer stage to 3.07 ± 0.16 in the mature stage). These values represent a change from a moderately acidic substrate to one that is more strongly acidic. A steady decrease in the mean EI values for light can be seen in Figure 3, but the difference between successive stages is not significantly different. However, there is a significant difference between the values for the pioneer (7.57 ± 0.12) and mature stages (7.02 ± 0.17) (Table 3), suggesting an overall successional trend in decreasing light levels, albeit a gradual one. A value of 7 indicates species that are generally found in well-lit conditions but may also grow in partial shade. The EI values for moisture are similar at all stages (ranging from 5.24 ± 0.14 to 5.31 ± 0.16) (Table 3), indicating moist conditions, with no evidence of a significant successional trend. Mean nitrogen (productivity) EI values show no significant change between successive stages, but the differences between pioneer (3.29 ± 0.17) and both the 250-year and mature stages (2.58 ± 0.19) are significant. The values suggest infertile sites in which initially low levels of nutrients are decreased further as a result of uptake by initial colonisers, leaching from the substrate or a decline in availability due to increasing acidification.
Mean EI Values (± 95% CI) for four stages of succession on 39 glacier forelands.
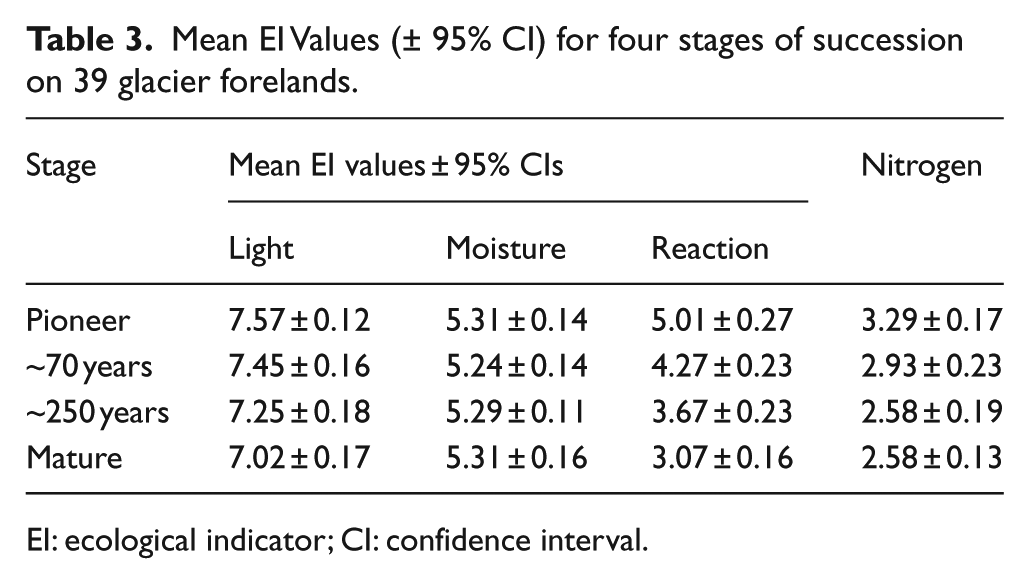
EI: ecological indicator; CI: confidence interval.
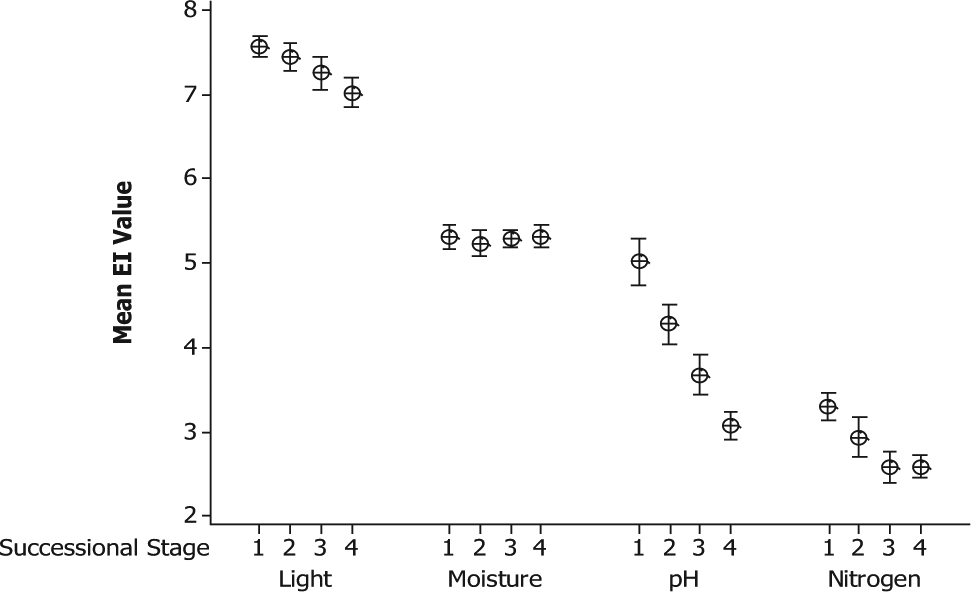
Mean Ellenberg indicator values (± 95% CI) for four stages of succession on 39 glacier forelands. See Figure 1 for explanation of successional stages.
Trends in EI values according to altitudinal zone
In order to assess whether the trends identified are influenced by factors related to altitude, Figure 4a–d presents the range of mean weighted EI values for each successional stage when the forelands are stratified according to altitude.
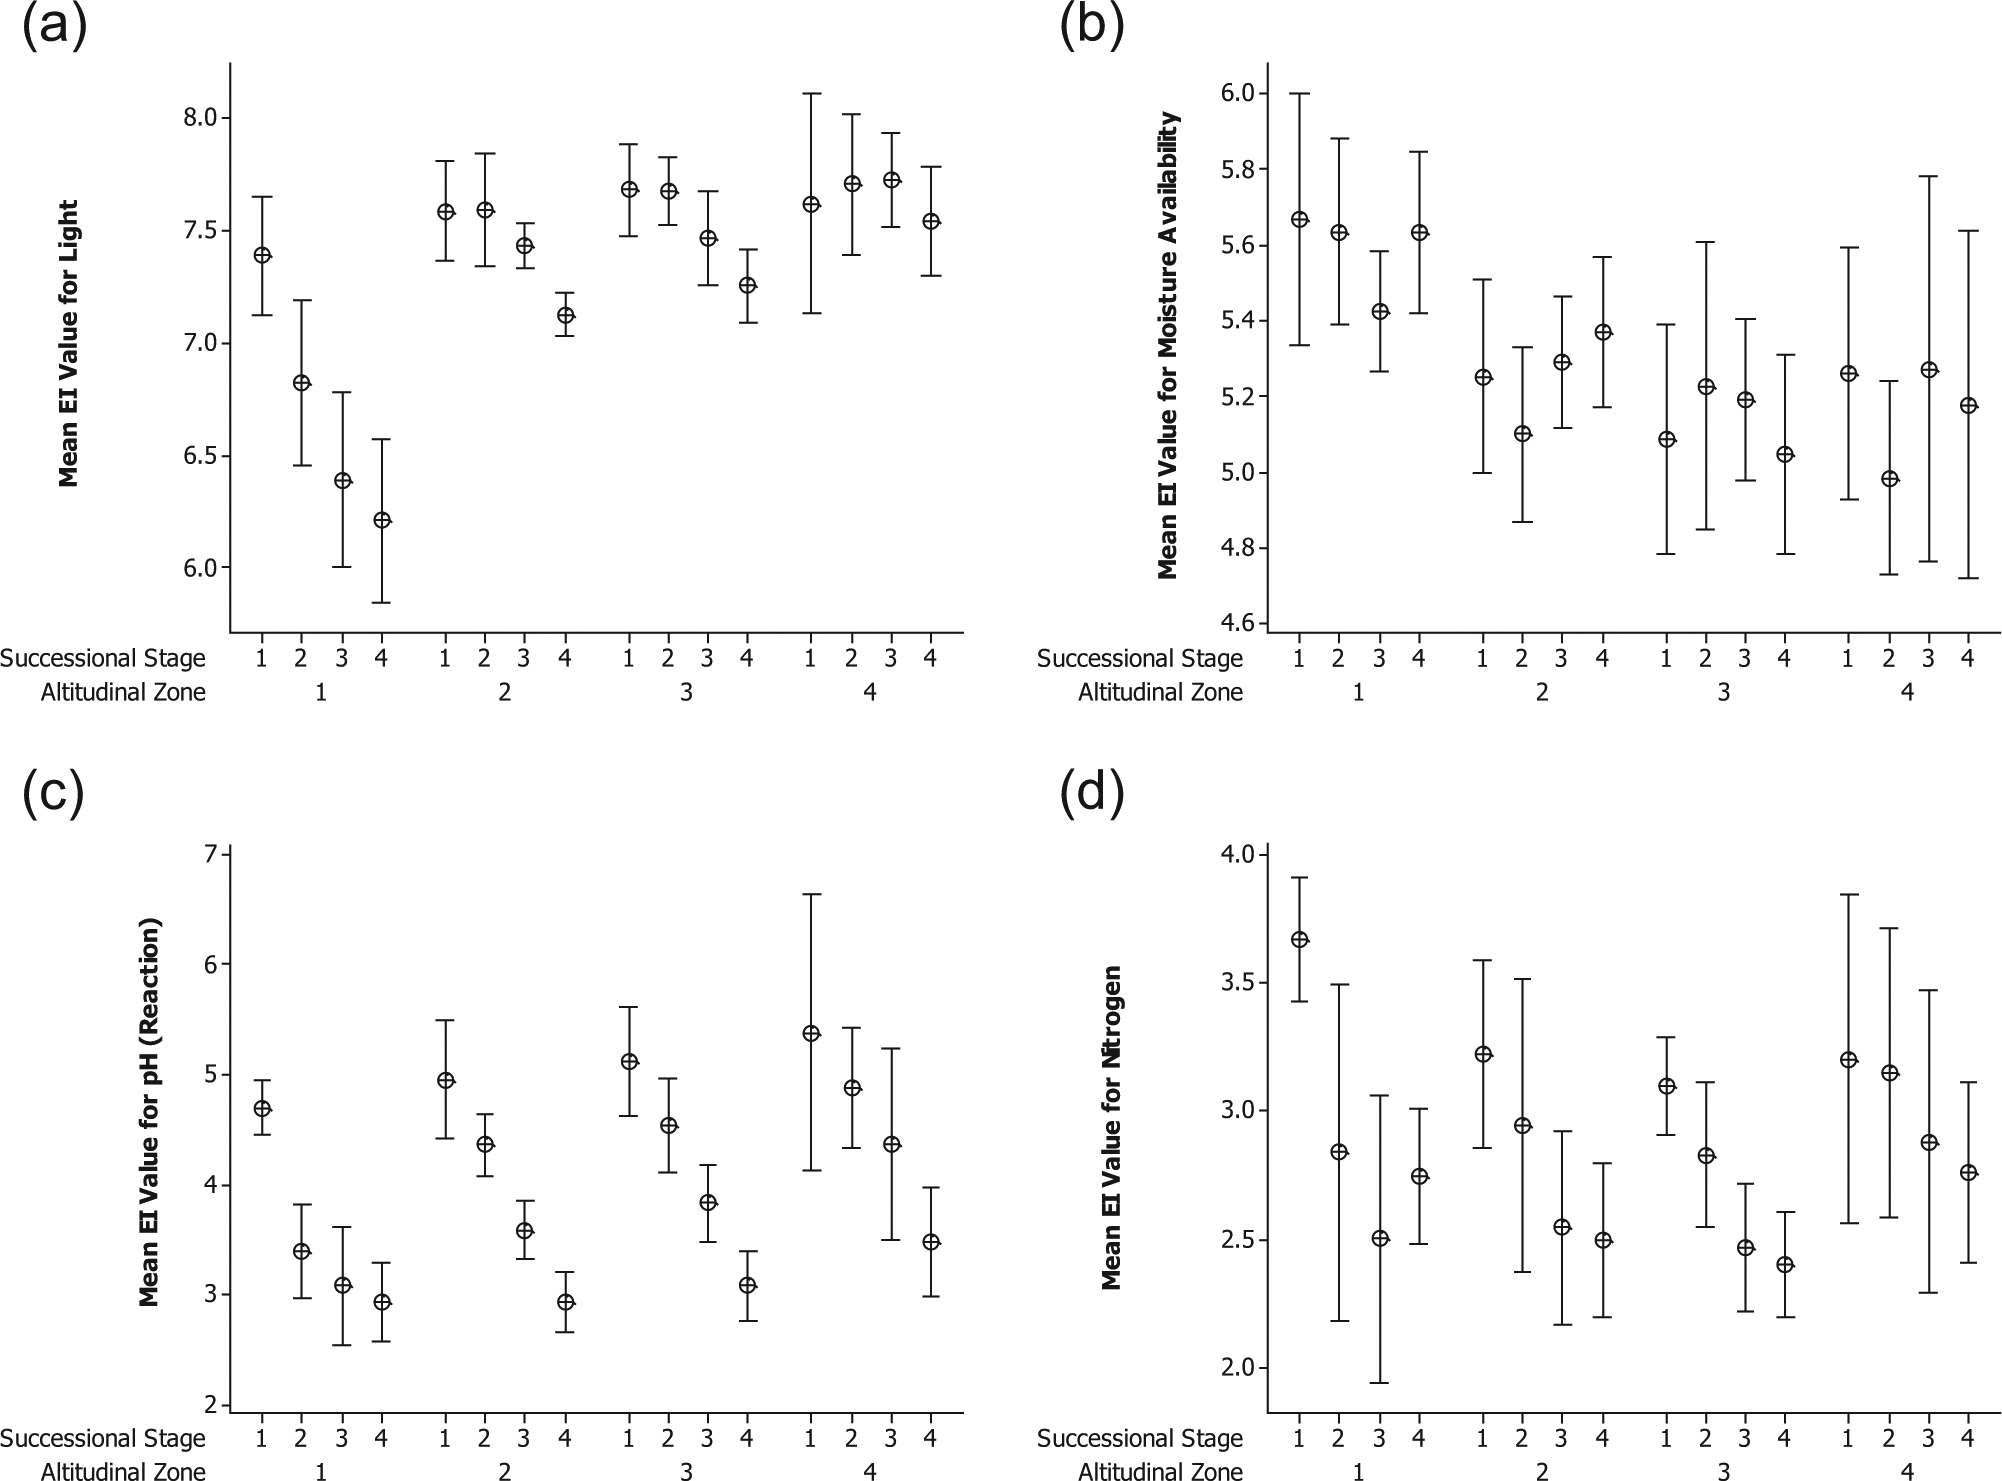
Mean EI values (± 95% CI) according to successional stage and altitudinal zone for (a) light, (b) moisture, (c) reaction and (d) nitrogen. See Figure 1 for explanation of successional stages. Altitudinal zones are as follows: 1 = boreal/sub-alpine; 2 = low-alpine; 3 = mid-alpine; 4 = high-alpine.
Although the highest mean EI values for moisture are found at the lowest altitudes and in the west of the region, which receives the highest mean annual precipitation, these values are only marginally higher than for the other altitudinal groups (Figure 4b). The mean values for reaction (Figure 4c) reveal a more interesting picture in that, although there is generally no significant difference between the values for each stage at different altitudes, the decrease in pH levels through time is faster in the boreal/sub-alpine zone. This results in a mean value for the 70-year stage that is already indistinguishable from the mature stage. A similar picture emerges for mean nitrogen values (Figure 4d) but with greater variability within each group and therefore broader CIs for the majority of stages.
Figure 4a shows a significant trend in decreasing EI values for light with succession in all except the highest altitudes where the value for mature vegetation is not significantly different from that of earlier stages. Also evident is the greater decrease through time in mean value for light at the lowest altitudes, reflecting the establishment of a tree canopy. As would be expected, the pioneer stage shows little variation in the mean light value with altitude, a finding that is supported by separately analysing the data from individual forelands. The Pearson correlation coefficient for the relationship between altitude and mean EI value for light is 0.364 for the pioneer sites (p ≤ 0.02) and 0.832 for the mature vegetation (p ≤ 0.001). The relationship between altitude and mean EI value for reaction is 0.28 (p < 0.05) in the pioneer stage, peaking at 0.61 (p < 0.005) at the 70-year stage and decreasing to 0.17 (n.s.) in the mature vegetation.
Measured pH values are available in Messer (1988) for soils of the pioneer and 230-year stages on eight of the forelands in this study (Suphellabreen, Bøyabreen, Nigardsbreen, Bødalsbreen, Haugabreen, Styggedalsbreen, Storbreen and Svartdalsbreen). A positive correlation was found between her values for these two stages and mean EI values for reaction within the pioneer and 250-year stages in this study (Pearson’s r = 0.71, p ≤ 0.002, n = 16). For these forelands, Messer (1988) also provided precipitation levels. When these were correlated with the change in mean EI value for nitrogen between the pioneer and mature stages, a Pearson’s correlation coefficient of 0.57 was obtained (p ≤ 0.03, n = 16), suggesting that precipitation may be having an effect on the rate at which minerals are leached from the substrate. Calculation of correlation coefficients between pH and nitrogen values showed a significant but weak relationship between these two factors at the 250-year and mature stages (r = 0.36, p≤ 0.02; r = 0.39, p ≤ 0.01, respectively) but not in earlier stages. These two findings suggest that leaching is having a greater impact on changes in nutrient levels with succession than the increasing acidification of an already weakly acidic substrate.
EI values of indicator species
In order to quantify the ecological preferences of vegetation found at different stages of succession and at different altitudes, the four vegetation units identified by Robbins and Matthews (2010) were used, the key indicator species of which are listed with their EI values in Table 4. Analysis of the vegetation data in this way facilitates consideration of the range of EI values that may be present within each successional stage and the species that may be having a particular influence on mean values.
Ecological indicator values (Hill et al., 1999; Vevle, 1985) and snowmelt values (Odland and Munkejord, 2008) for six indicator species within each vegetation unit (N/A = indicator value not available).
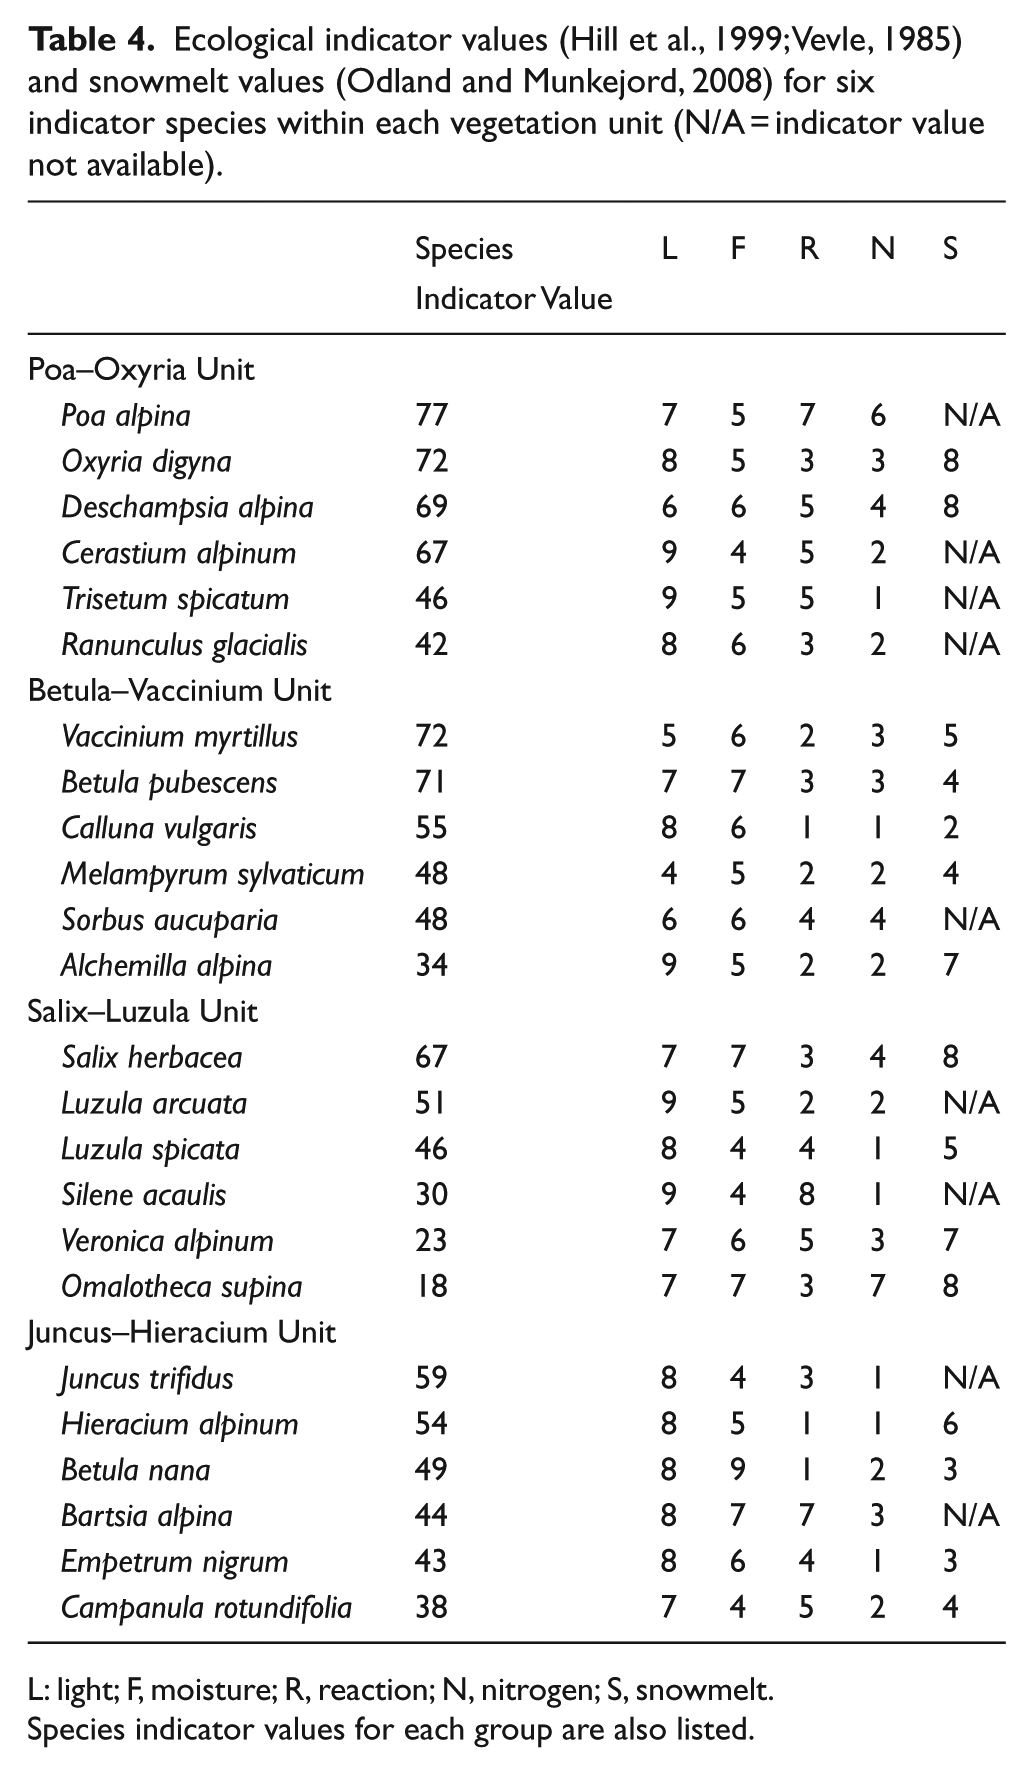
L: light; F, moisture; R, reaction; N, nitrogen; S, snowmelt.
Species indicator values for each group are also listed.
Robbins and Matthews (2009) concluded that the pioneer stage of succession on glacier forelands may be considered an emerging community rather than a discrete and predictable group of species. However, when examined in relation to late-successional stages (Robbins and Matthews, 2010), a relatively consistent vegetation composition was identified (their Poa–Oxyria unit) that characterised the pioneer zone on all but one of the forelands (Bøyabreen). The three species with the highest indicator values in this group (P. alpina, Oxyria digyna and Deschampsia alpina) have a particularly wide distribution in the pioneer zone of glacier forelands at all altitudes within this study. The other three key indicator species (Cerastium alpinum, Trisetum spicatum and Ranunculus glacialis) are more prominent in the pioneer stage of the alpine forelands above the altitudinal tree-line. These species have particularly high EI values for light (9, 9 and 8, respectively), and their presence would explain the positive correlation between altitude and mean EI value for light within the pioneer stage. They also have relatively low EI values for nitrogen (2, 1 and 2, respectively) compared with the strongest three indicator species within this unit (which have values of 6, 3 and 4). This could account for the greater variability in mean EI values for nitrogen in the pioneer zone at highest altitudes (Figure 4c). Poa alpina, the species with the highest indicator value within the Poa–Oxyria unit, is notable in that it has higher EI values for reaction (7) and nitrogen (6) than the other indicator species.
The Betula–Vaccinium unit is characterised by the presence of relatively abundant Vaccinium myrtillus and B. pubescens and typifies post-pioneer successional vegetation on glacier forelands in the boreal/sub-alpine zone. In addition to V. myrtillus and B. pubescens, which are components of developing woodland, Melampyrum sylvaticum (with an EI value for light of 4) is also indicative of the establishment of a higher vegetation cover and thus lower light intensity. The range of EI values for both reaction and nitrogen is 1–4, the highest value in both cases relating to the tree species Sorbus aucuparia.
Salix herbacea and Luzula arcuata are the strongest indicators within the Salix–Luzula unit, which is found on >250-year-old terrain in the high-alpine belt and >70-year-old terrain at intermediate altitudes. Within this vegetation type, the range of mean EI values for reaction is 2–5, with the notable exception of Silene acaulis, which has a value of 8. Nitrogen values are between 1 and 4. The Juncus–Hieracium unit (typified by Juncus trifidus, Hieracium alpinum and Betula nana) is found only at intermediate altitudes on >250-year-old terrain. Indicator species within this unit have a range of EI values for reaction from 1 to 7 (the highest value being for Bartsia alpina), and EI values for nitrogen range from 1 to 3.
Snowbed indicator values (Odland and Munkejord, 2008), although not available for many of the indicator species, are nevertheless useful to distinguish the characteristics of the Salix–Luzula and Juncus–Hieracium vegetation units. Snowbed indicator values are generally higher in the former unit, suggesting a largely chionophilous group of species that would tend to favour areas with snow cover lasting through to July.
Variance partitioning of EI values
Variance partitioning was used to apportion variability in mean EI values between successional stage and altitude. The overall variation in the data set was low (total inertia = 0.017), indicating that vegetation on the glacier forelands is not highly variable in terms of mean EI values. However, of the variation detected, 41% can be explained by these two factors; successional stage accounted for 29% of the variability and altitude 12% (Table 5). The shared component accounts for 11% of the total variability.
Variance explained (also expressed as % of total inertia) by altitude and stage for the glacier-foreland mean EI values.

VE: variance explained; TI: total inertia; A: altitudinal zone; S: successional stage; EI: ecological indicator.
All values are significant at p ≤ 0.002.
Discussion
Light intensity EI values
The decreasing mean EI values for light associated with later stages of succession would be expected as vegetation cover increases. This is consistent with the conclusions of other authors (e.g. Lammerts et al., 1999; Tilman, 1988; Whittaker, 1993) that the importance of biotic interactions increases as succession proceeds. Perhaps less predictable, however, is that the effects of light extend above the tree-line not only in the low-alpine zone, where there is often an appreciable dwarf-shrub canopy, but also into the mid-alpine zone, where there may be a weak form of vertical stratification among the dominant herbaceous perennials.
Moisture availability EI values and water supply
In a number of studies (e.g. Bossuyt et al., 2003; Chapin et al., 1994; Raffl et al., 2006), insufficient water supply has been identified as the main factor limiting vegetation occurrence in the pioneer stage. Chapin et al. (1994) found increasing moisture to be typical of vegetation succession at Glacier Bay, Alaska, and Raffl et al. (2006), in the Austrian Alps, concluded that the weak water-retaining capacity of raw soils, combined with low vegetation cover, increases the risk of desiccation in the pioneer phase. Strauss et al. (2009) also observed decreasing soil moisture with distance from glacier ice at Anvers Island on the Antarctic Peninsula. The evidence presented here does not concur with these findings, the mean EI value for moisture showing no significant change as succession proceeds (Figure 3 and Table 3). Moisture levels on the forelands sampled is generally good because of the supply of meltwater from the glaciers, snow and, at the highest altitudes, permafrost, which appears to counteract the effects of the well-drained substrate and the drying effects of glacier winds. The lack of a trend in mean moisture EI values may also be partly explained by the fact that data collection on the glacier forelands in this study was designed to avoid streams and depressions. Changes in moisture regime on forelands tend, moreover, to be localised rather than general (Whittaker, 1991). Thus, although canopy development (as indicated by a decrease in light EI values in the lowest altitudinal zone) has been associated in previous studies with glacier forelands and elsewhere with an increase in EI values for moisture (e.g. in the study of European forests by Seidling and Fischer (2008)), the absence of significant effects in the habitats of this study may be due to meltwater providing a constant supply of moisture. This would weaken any relationship between soil/vegetation development and moisture retention.
Snowmelt EI values
The boundary identified by Wijk (1986) between V. myrtillus and S. herbacea communities suggested the occurrence of interspecific competition along a gradient of snow duration. This is reflected in two of the vegetation units (Salix–Luzula and Juncus–Hieracium) described in this study. When V. myrtillus is absent, S. herbacea was found to occur on sites where snowmelt occurs earlier, suggesting that the latter is excluded where V. myrtillus is present. Snowmelt indicator values therefore suggest that a gradient of seasonal snowmelt may explain divergence to Salix–Luzula or Juncus–Hieracium vegetation in late-successional stages of succession in the low- to mid-alpine belts.
EI values and nutrient availability
EI values for pH and nitrogen are considered together, as soil pH influences the availability of nitrogen to plants, notably where immobilisation of nutrients occurs in acid soils. The correlation between these two factors may, however, be dependent on the presence of an organic layer, which tends to be extremely thin in the initial stages of soil development on glacier forelands (Matthews, 1992; Messer, 1988). This is supported by the significant correlations found between these two factors in the 250-year-old and mature stages of succession but their absence in the earlier stages. Furthermore, it is possible that any such relationship is influenced by frequent disturbance of glacier-foreland substrates (Haugland and Owen, 2005), where ‘safe sites’ (Harper et al., 1961) may relate to microsite levels of pH and nutrients.
In this study, the only significant difference in mean EI values identified among all four consecutive successional stages was a decrease in the value for pH. This trend in mean pH values is consistent with the findings of Messer (1988), Grimm (2000) and Darmody et al. (2005). Whittaker (1993) found a rapid decline in pH in the first 20 years post-deglaciation on Storbreen foreland and an accompanying reduction in nutrients, noting the high pH of the fresh till and the regular supply of nutrients in meltwater. The subsequent decline in nutrients was attributed to the low clay content and lack of organic material in the substrate. Thus, an initially rapid accumulation of organic N was identified by Darmody et al. (2005) on Storbreen foreland, followed by a decrease on terrain older than 70 years.
Chapin et al. (1994) stressed the importance of initial site conditions at Glacier Bay, where decreasing pH but increasing total nitrogen was found to be typical of changes following deglaciation. A decrease in pH and increase in organic matter were also found by Jones and del Moral (2005) on the foreland of Coleman Glacier, Washington, USA. CCA ordination of vegetation data from successional stages in the central Austrian Alps (Raffl et al., 2006) produced a first axis that was strongly correlated with terrain age and soil pH. The pH trends found in this study are therefore consistent with those of other researchers.
Messer (1988) found the rate of decrease in pH and increase in CEC on forelands to be related to initial conditions rather than climate, with the more acidic geology of the Jostedalsbreen region being reflected in a more rapid decrease in pH than the less acidic Jotunheim region. Initial pH on the 18 forelands studied by Messer ranged from 5.3 to 8.5, decreasing to 3.8–5.9 after 230 years, suggesting a degree of convergence in soil conditions with time. However, both CEC and soil depth showed divergence in their values over time, although they both generally increase. The mean soil pH values for the pioneer stage on forelands in the Austrian Alps (with an underlying calcareous geology) were 7.4–7.5, decreasing to 5.8–6.5 on older terrain after 140 years (Raffl et al., 2006). The range of values on the older terrain, along with variability in the moisture and temperature regime on different sides of the valley, led to two distinct successional pathways. This confirms that a relatively small variation in mean pH value can result in differences in vegetation composition and cover.
Nutrients might be expected to increase with succession as the amount of organic matter in the substrate accumulates. However, the young substrate on glacier forelands in the study region is relatively rich in minerals, which are subsequently depleted from upper layers by leaching (Matthews, 1992) and, to a lesser extent, by the increasing absorption of nutrients by plants as vegetation cover develops. Jones and Henry (2003) found that N from nitrogen-fixing bacteria decreases on older terrain on glacier forelands in the Canadian High Arctic, while Knelman et al. (2012) suggested that, in the early stages of primary succession on Mendenhall Glacier foreland (Alaska), nitrogen inputs from N-fixing bacteria were influencing early vegetation succession, with cyanobacteria contributing to N fixation in unvegetated soils. In addition, it was proposed that interactions between plants and the microbial community had an effect on soil pH. The results of variance partitioning were used to support the argument that a decrease in pH was driven by changes in vegetation, that is, a ‘vegetation-derived effect’ (Knelman et al., 2012). Whittaker (1993) considered the initial decline in pioneer species at Storbreen to have an allogenic basis but attributed their eventual disappearance to competitive interactions with later colonisers. Later colonisers, particularly ericaceous shrubs, may increase substrate acidity (Ehrenfeld et al., 2005), and acid input from litter decomposition also generally contributes to this pattern (Strauss et al., 2009).
The decrease in mean nitrogen EI values with succession is therefore consistent with leaching of minerals and subsequent acidification of the substrate that makes nutrients less available. The significant correlation between mean annual precipitation and the decrease in mean EI values for nitrogen between pioneer and mature vegetation supports the possibility that leaching of nutrients is occurring, although this could also be explained by other associated factors that were not tested. The findings are consistent with the theory that early colonisers require a ‘pool of uncontested resources’ (Matthews and Whittaker, 1987), including low cover, high moisture and pH levels and no depletion of nutrients.
The relative effects of altitude and time
The use of variance partitioning to quantify the relative effects of altitude and successional stage on mean EI values has shown that successional stage explains more than twice the proportion of the variation in mean EI values than altitude. Mean EI values for N show no significant difference between altitudinal zones, all within the range of low productivity. Cold temperatures have been shown to limit microbial processes that decompose organic matter and mineralise nitrogen (Kelley et al., 2012), so a gradient of decreasing values with altitude would have been expected. In cold conditions such as in alpine tundra, nitrogen is considered to be a key limiting factor for plant growth, and Kelley et al. (2012) found that the thickness of the soil organic layer decreased as climatic conditions became increasingly harsh. The lack of an altitudinal pattern is consistent with Diekmann’s (2003) conclusions that weighted mean indicator values may reflect random fluctuations in species composition rather than consistent variation along a gradient. Similarly, Messer (1988) found that rates of change in soil pH and organic matter content were not related to climate, although changes in CEC were.
Odland (2009) found that moisture indicators in South Central Norway were highest at intermediate altitudes, whereas this study found highest values within the lowest altitudinal band (Figure 4a). This may reflect particular conditions on glacier forelands and the oceanic influence on the lower altitude forelands to the west of the study area (Jostedalsbreen). The most important indicator species for the Juncus–Hieracium unit, J. trifidus, is considered by Odland and Munkejord (2008) to change its response to snowmelt along an altitudinal gradient. They suggest that the species may occur in snowbeds at lower altitudes and on exposed ridges in the mid-alpine zone. Snowmelt indicator values may therefore be valuable in explaining the occurrence of different mature vegetation groups in cases in which the Ellenberg values do not distinguish them.
Conclusion
EI values for light, moisture, reaction (pH), nitrogen and snow are shown to provide useful geoecological insights into primary succession from glacier-foreland chronosequences.
The decreasing EI values for light with successional stage are consistent with an increase in vegetation cover and the likelihood that competition for light, and biotic interactions more generally, becomes more important in all but the high-alpine belt.
Insensitivity of EI values for moisture suggests it is not a limiting factor for species colonisation on the glacier forelands studied due to the widespread availability of meltwater from glacier ice, snow and permafrost.
EI values for pH showed a consistent decrease with succession, which was most rapid in the early-successional stage in the boreal/sub-alpine zone. This supports the concept of progressive leaching of nutrients from poorly developed soils through time, accentuated by organic matter inputs at relatively low altitudes.
A significant relationship between pH and the availability of nitrogen does not develop until the later stages of succession, which can be explained by the higher organic matter content in the later stages of soil development. A significant relationship between mean precipitation and the amount of successional change in mean EI values for nitrogen supports the concept of progressive leaching of nutrients. Thus, EI values for nitrogen (nutrient) availability decreased with succession.
Snowmelt indicator values suggest that a gradient of seasonal snowmelt may explain divergence in late-successional stages of succession in the low- to mid-alpine belts.
Although successional stage and altitude explain significant proportions of the variation in mean EI values, successional stage explains more than twice as much of the variation (29%) than altitude (12%). While emphasising the potential of EI values in successional studies, this supports the usefulness of chronosequences with environmental gradients in ecology.
Footnotes
Acknowledgements
Thanks to Robert Cook, Alexander Fuller, Geraint Owen and Paul Richards for fieldwork assistance and to the University of Wales and the Jotunheim Research Trust for financial support. This paper is Jotunheim Research Expeditions Contribution No. 190
Funding
This research received no specific grant from any funding agency in the public, commercial or not-for-profit sectors.