
Abstract
We compare well-dated Holocene stalagmite δ18O records from the East Asian Summer Monsoon (EASM) region and from the Indian Summer Monsoon (ISM) region. We found that the pattern of latitudinal change of speleothem δ18O values from the Indian monsoon region to the East Asian monsoon region is almost identical to that of modern precipitation. This suggests that the modern moisture transport route from the Indian Ocean to the East Asian monsoon region has existed since at least the early Holocene. The δ18O records from both regions exhibit a remarkably similar trend of variation in that the values are more negative during the early Holocene, rapidly become heavy from the mid-Holocene, and are heaviest during the late Holocene. The stalagmite δ18O changes in the East Asian monsoon region are statistically well correlated with those in the Indian monsoon region, both over the entire Holocene and in detail over the last 2000 years. However, in contrast to the obvious consistency of the δ18O values in all of the speleothem records, both instrumental and historical climate records indicate significant spatial variations in rainfall over eastern China. The early-Holocene strong EASM pattern referred from speleothem δ18O in the East Asian monsoon region is quite different to that of other paleoclimatic records such as Holocene paleosol development in the Chinese Loess Plateau, eolian activity in the northern Chinese sandlands, and lake sediments in EASM-dominated region in China, in which the strongest EASM was documented during the mid-Holocene. These findings suggest that the speleothem δ18O record from the East Asian monsoon region may not record EASM variability, but rather that it is controlled by variations in the isotopic composition of precipitation, which is determined mainly by rainfall variability in the ISM region.
Keywords
Introduction
The East Asian Summer Monsoon (EASM) is one of the most important components of the Asian monsoon system (Figure 1, Tao and Chen, 1987; Wang et al., 2005a), which significantly affects economic activity and society within its area of influence. Thus, it is clearly important to understand its history and driving mechanisms in order to predict future climate changes. The variability of the EASM has been reconstructed from various types of paleoclimatic archives and proxies such as loess–paleosol sequences (An and Thompson, 1998; Chen et al., 1997; Liu and Ding, 1998), lake sediments (Gergana et al., 2007), sandlands in northern China (Jin et al., 2011), and speleothem oxygen isotope records (Hu et al., 2008; Wang et al., 2001, 2005b, 2008; Yuan et al., 2004; Zhang et al., 2008). Among these archived proxies, stalagmites possess unique advantages as they can be precisely dated by U-series methods (Cheng et al., 2005) and they have been widely used for reconstructing the EASM. Among the various indicators extracted from stalagmites, speleothem δ18O records are regarded as yielding the most significant and reliable information about EASM changes on different time scales (Cheng et al., 2012; Hu et al., 2008; Partin et al., 2007; Wang et al., 2001, 2005b, 2008; Yuan et al., 2004; Zhang et al., 2008). However, researchers have long struggled to develop a definitive interpretation of variations in speleothem δ18O values in the East Asian monsoon region. Wang et al. (2001) attributed the long-term variations of δ18O values in the Hulu Cave stalagmite to changes of the isotope ratios of summer and winter precipitation. Yuan et al. (2004) argued that variations in calcite δ18O values in these records could be mainly explained in terms of variations in the δ18O values of meteoric precipitation, which is further controlled by the fraction of water vapor that was removed from air masses between the tropical Indo-Pacific and southern China. In addition, Cheng et al. (2009) concluded that a higher proportion of regional EASM rainfall, in terms of annual total, would result in more negative δ18O values. They further suggested that variations in calcite δ18O could be interpreted as an indicator of summer monsoon intensity, which is supported by a recent modeling study, although from a different perspective (Liu et al., 2014).
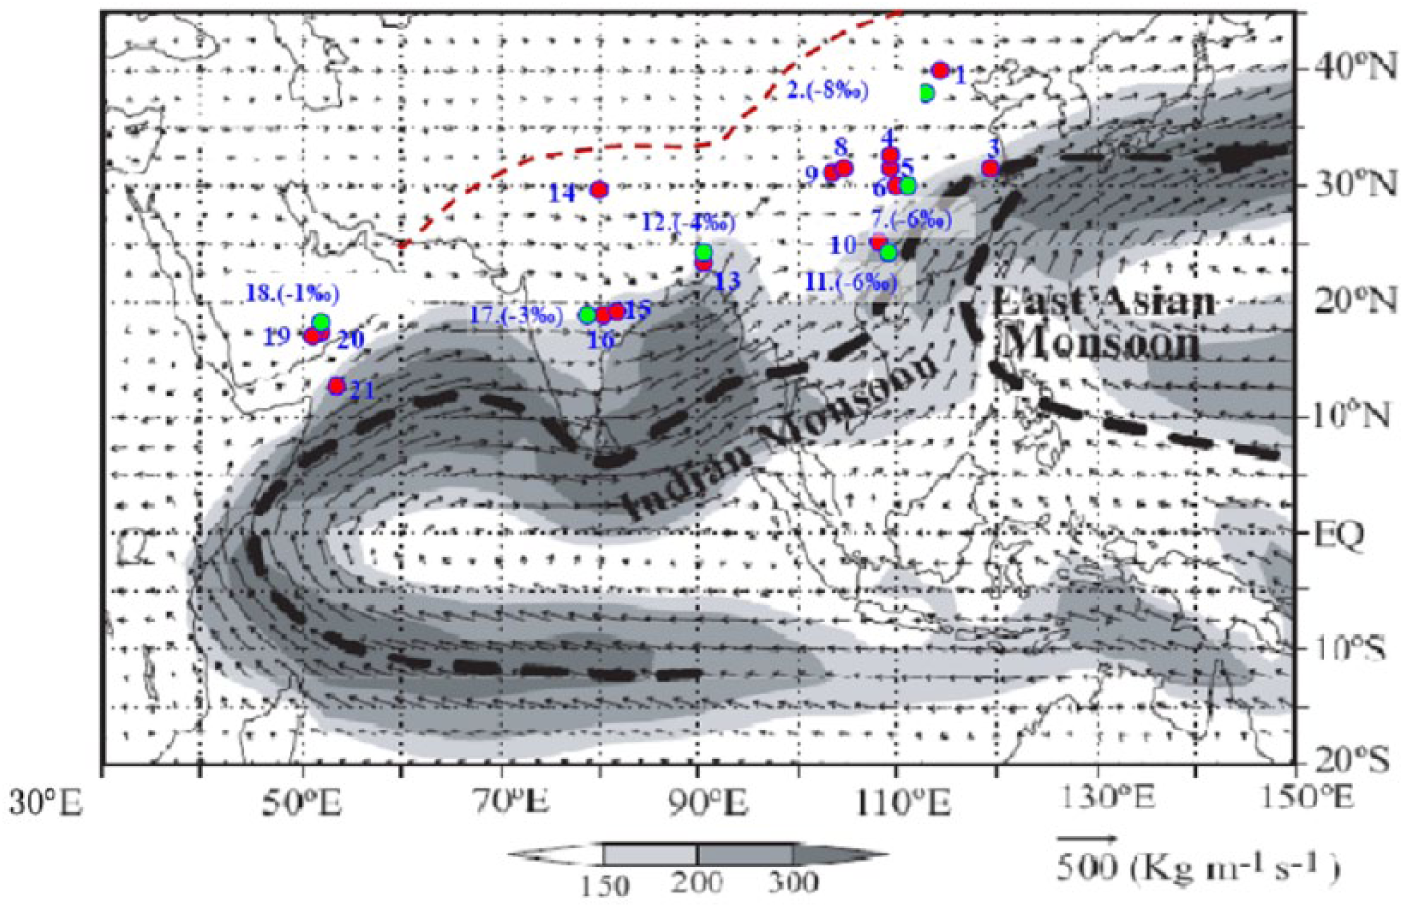
Moisture transport patterns averaged for 1990–1999 (after Ding et al., 2004). Units: kg/m/s. Shading indicates strong moisture transport. The modern summer monsoon limit is indicated by a red dashed line (after Chen et al., 2008). Locations of the stalagmite records (red dots) and meteorological stations (green dots) discussed in this study are indicated. The location numbers are listed in Table 1. Modern average δ18O values of local precipitation are listed in parenthesis immediately after the number of the sites. Precipitation isotopic data were obtained from the Global Network of Isotopes in Precipitation (http://www.iaea.org/water).
However, these interpretations have been challenged by recent studies. After reassessing stalagmite records from the Asian monsoon region, Maher (2008) and Maher and Thompson (2012) argued that variations in speleothem δ18O in southern China are more likely to reflect changes in moisture source rather than that of total precipitation amount on site. In addition, it was found that changes in atmospheric–oceanic circulation can influence the variation in the ratio of water vapor originating from distant oceans (relatively negative δ18O) and the local ocean (relatively positive δ18O), which is supplied to monsoonal China (Tan, 2009, 2014). Within this framework, the generally lightest δ18O values during the early Holocene are attributed to a La Niña-like pattern in the tropical Pacific at that time (Tan, 2011). Clemens et al. (2010) argued that variations in δ18O values of meteoric precipitation in east China are because of a mixture of moisture from three different sources, including summer monsoon precipitation, winter monsoon precipitation, and precipitation en route from the Pacific Ocean; and they concluded that variations in stalagmite δ18O actually reflect changes of the fractions of moisture from these three sources. Modeling results also indicate that during Heinrich events during the last glacial, the variations of stalagmite δ18O in southern China caves mainly reflect δ18O changes in the source vapor from the Indian Ocean (LeGrande and Schmidt, 2009; Pausata et al., 2011).
Consequently, there is a considerable need to review all of the published stalagmite δ18O records and to discuss the possible factors controlling the δ18O variations in stalagmites in the East Asian monsoon region. Here, we compare the stalagmite δ18O records from the East Asian monsoon region with those from the Indian monsoon region, and conclude that the most likely interpretation of variations in speleothem δ18O in the East Asian monsoon region is that they reflect precipitation isotopic variations, which are determined mainly by rainfall variability in the Indian Summer Monsoon (ISM) region, rather than EASM intensity.
Data and methodology
Many stalagmite δ18O records on various time scales from the Asian monsoon regions have been published (Cheng et al., 2012; Dong et al., 2010; Dykoski et al., 2005; Fleitmann et al., 2003; Hu et al., 2008; Partin et al., 2007; Wang et al., 2001, 2005b, 2008; Yuan et al., 2004; Zhang et al., 2008) (see Figure 1 and Table 1). Most of the records are from the East Asian monsoon region (Dong et al., 2010; Dykoski et al., 2005; Hu et al., 2008; Li et al., 1998; Paulsen et al., 2003; Tan et al., 2011; Wang et al., 2001, 2005b, 2008; Zhang et al., 2008), with relatively few from the monsoon-dominated southwestern Asia region (Fleitmann et al., 2003, 2004, 2007; Sinha et al., 2005, 2007, 2011). A map of the pathways of moisture transportation during summer in Asia (Figure 1) demonstrates that the Indian monsoon region receives atmospheric vapor mainly from the Indian Ocean, while eastern Asia including China receives atmospheric vapor for precipitation from both the distal Indian Ocean and the proximal Pacific Ocean (the South China and East China Seas, as well as the Pacific Ocean). Precipitation vapor in the East Asian monsoon region mainly comprises atmospheric vapor from the Indian Ocean and the trans-equatorial atmospheric vapor transport associated with the ISM circulation (Zhou et al., 2009). In this study, we compared 15 stalagmite records (locations marked in Figure 1) from the ISM-dominated region and the EASM-dominated region in order to discuss the paleoclimatic significance of speleothem δ18O variations in the East Asian monsoon region.
List of sites (records) discussed in this study.
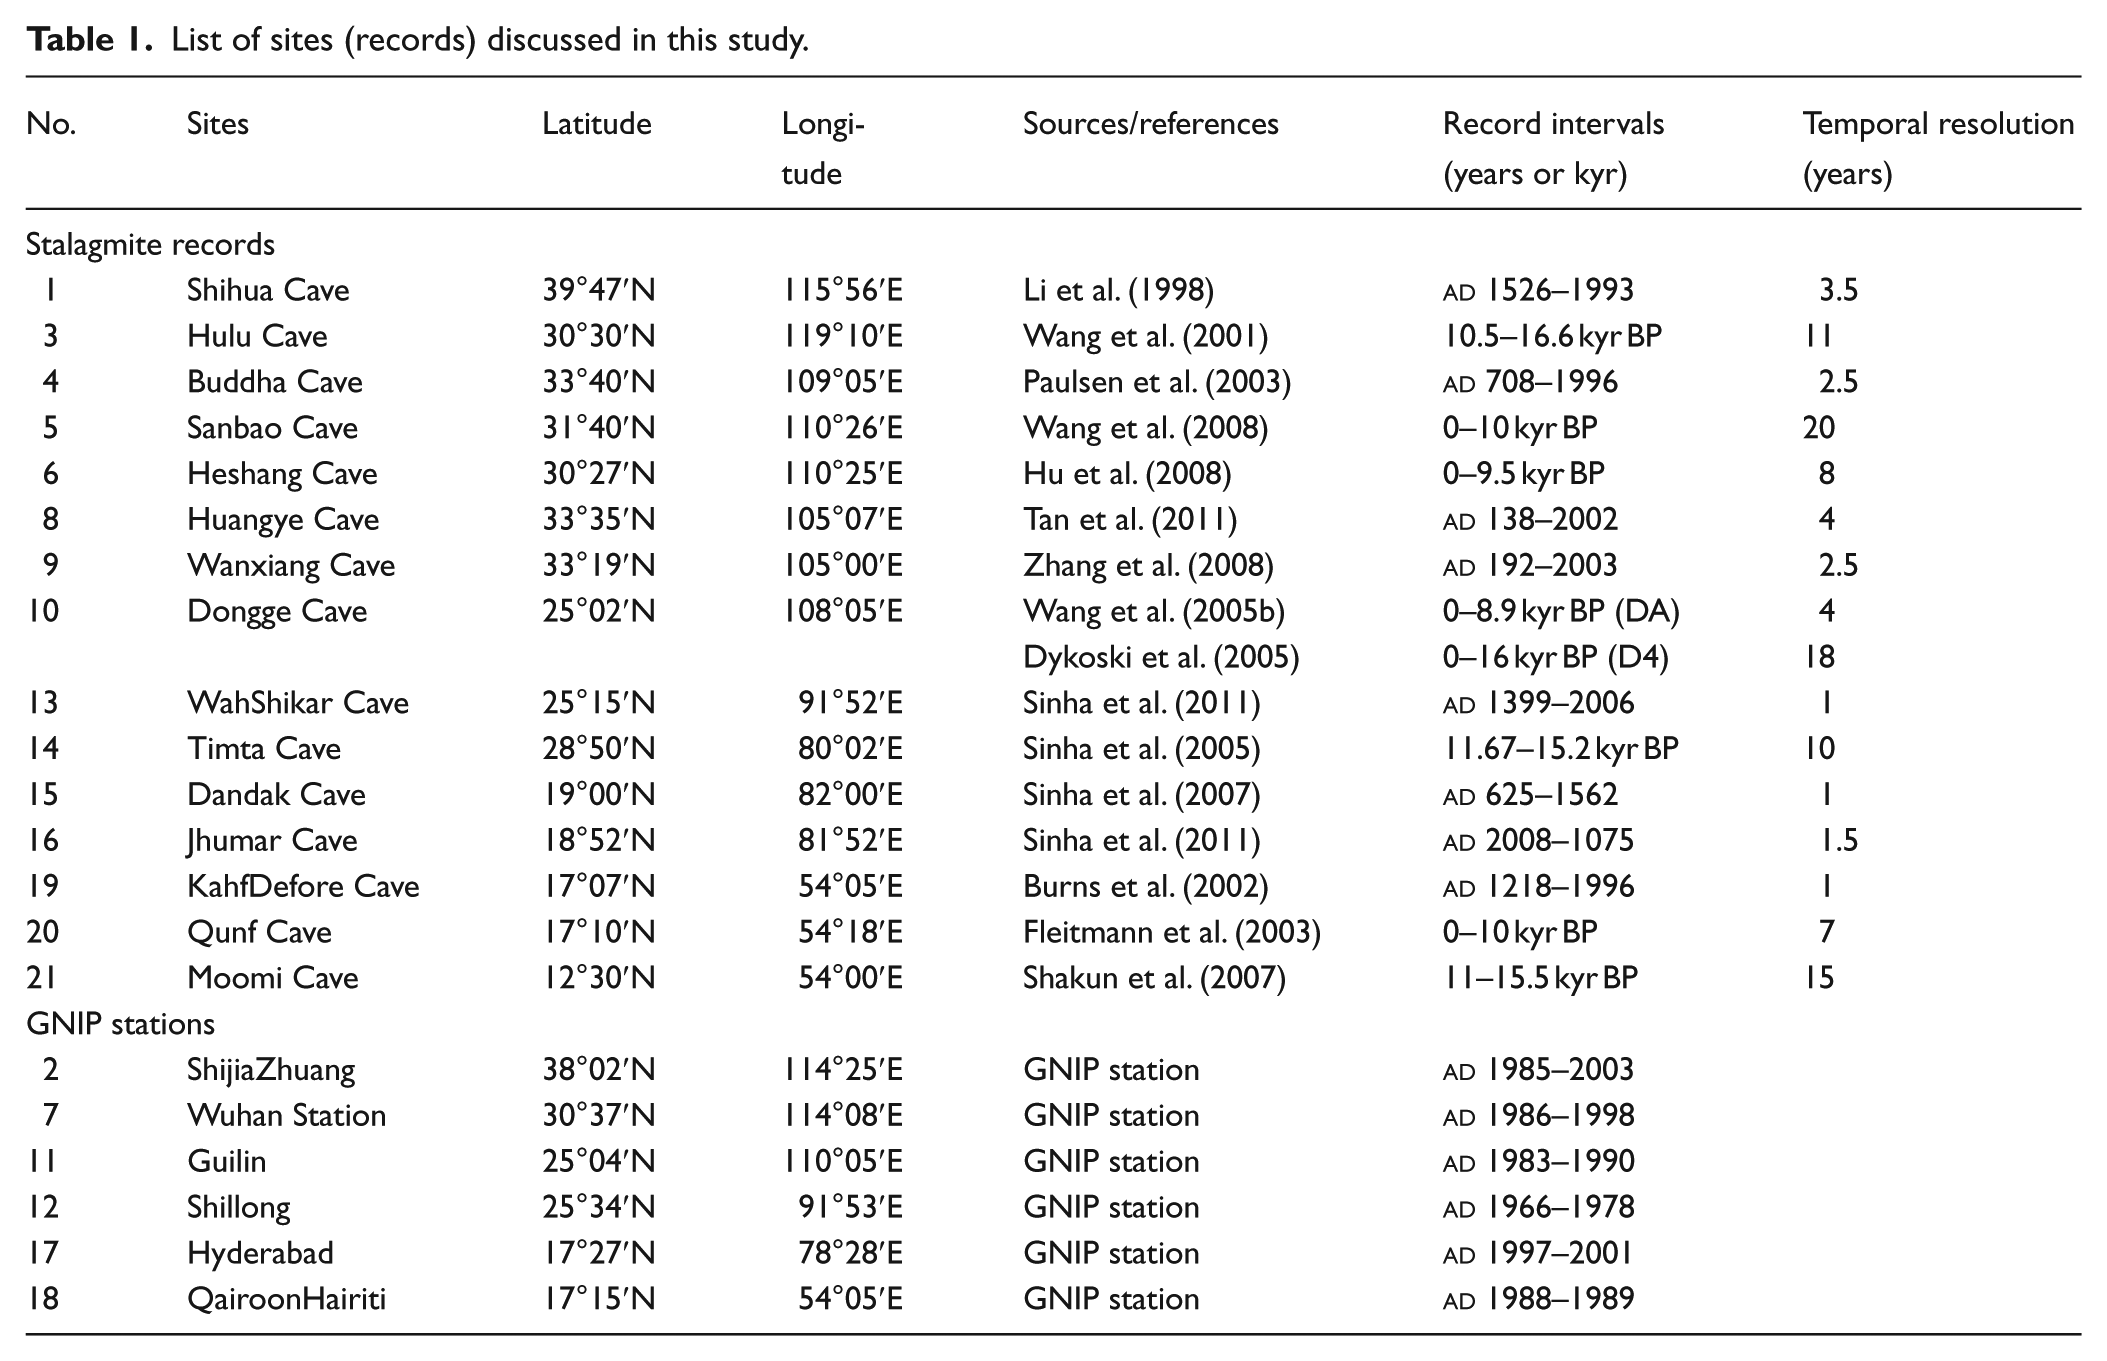
We compared records from two different time periods and of different resolution during the Holocene: 10–0 kyr BP (Dong et al., 2010; Dykoski et al., 2005; Fleitmann et al., 2003; Hu et al., 2008; Wang et al., 2005b, 2008) and the last 2000 years (Fleitmann et al., 2004; Paulsen et al., 2003; Sinha et al., 2005, 2007, 2011; Tan et al., 2011; Zhang et al., 2008). The temporal resolution of these records is different because of differences in stalagmite growth rates and sampling interval used for isotope analysis (Table 1). AnalySeries 2.0.4 (Paillard et al., 1996) was used to downscale the higher resolution record to match the record with a lower temporal resolution, which is an appropriate approach for comparing paleoclimatic records of different temporal resolution (Zhao et al., 2009).
Results
Correlation of stalagmite δ18O records from the East Asian monsoon region with those from the Indian monsoon region over the last 2000 years
Among all of the stalagmite records over the past 2000 years, the Wanxiang record (Zhang et al., 2008) and the Jhumar–Dandak composite record (Sinha et al., 2007, 2011) have very similar temporal resolutions – of 2.5 years and 1.5 years, respectively. Wanxiang Cave is located in the current EASM region, where the speleothem oxygen isotope is highly correlated with local rainfall amount (Liu et al., 2008; Yang et al., 2007), and the record is very sensitive to variations in precipitation amount (Zhang et al., 2008). In contrast, Jhumar Cave and Dandak Cave are located in the ISM region and the composite record is mainly affected by the ISM (Sinha et al., 2007, 2011). Although the δ18O values in the Wanxiang Cave record are consistently more negative than those of the Jhumar–Dandak composite δ18O record, their patterns of variation are quite similar (Figure 2a). The δ18O values of these two records during the period from
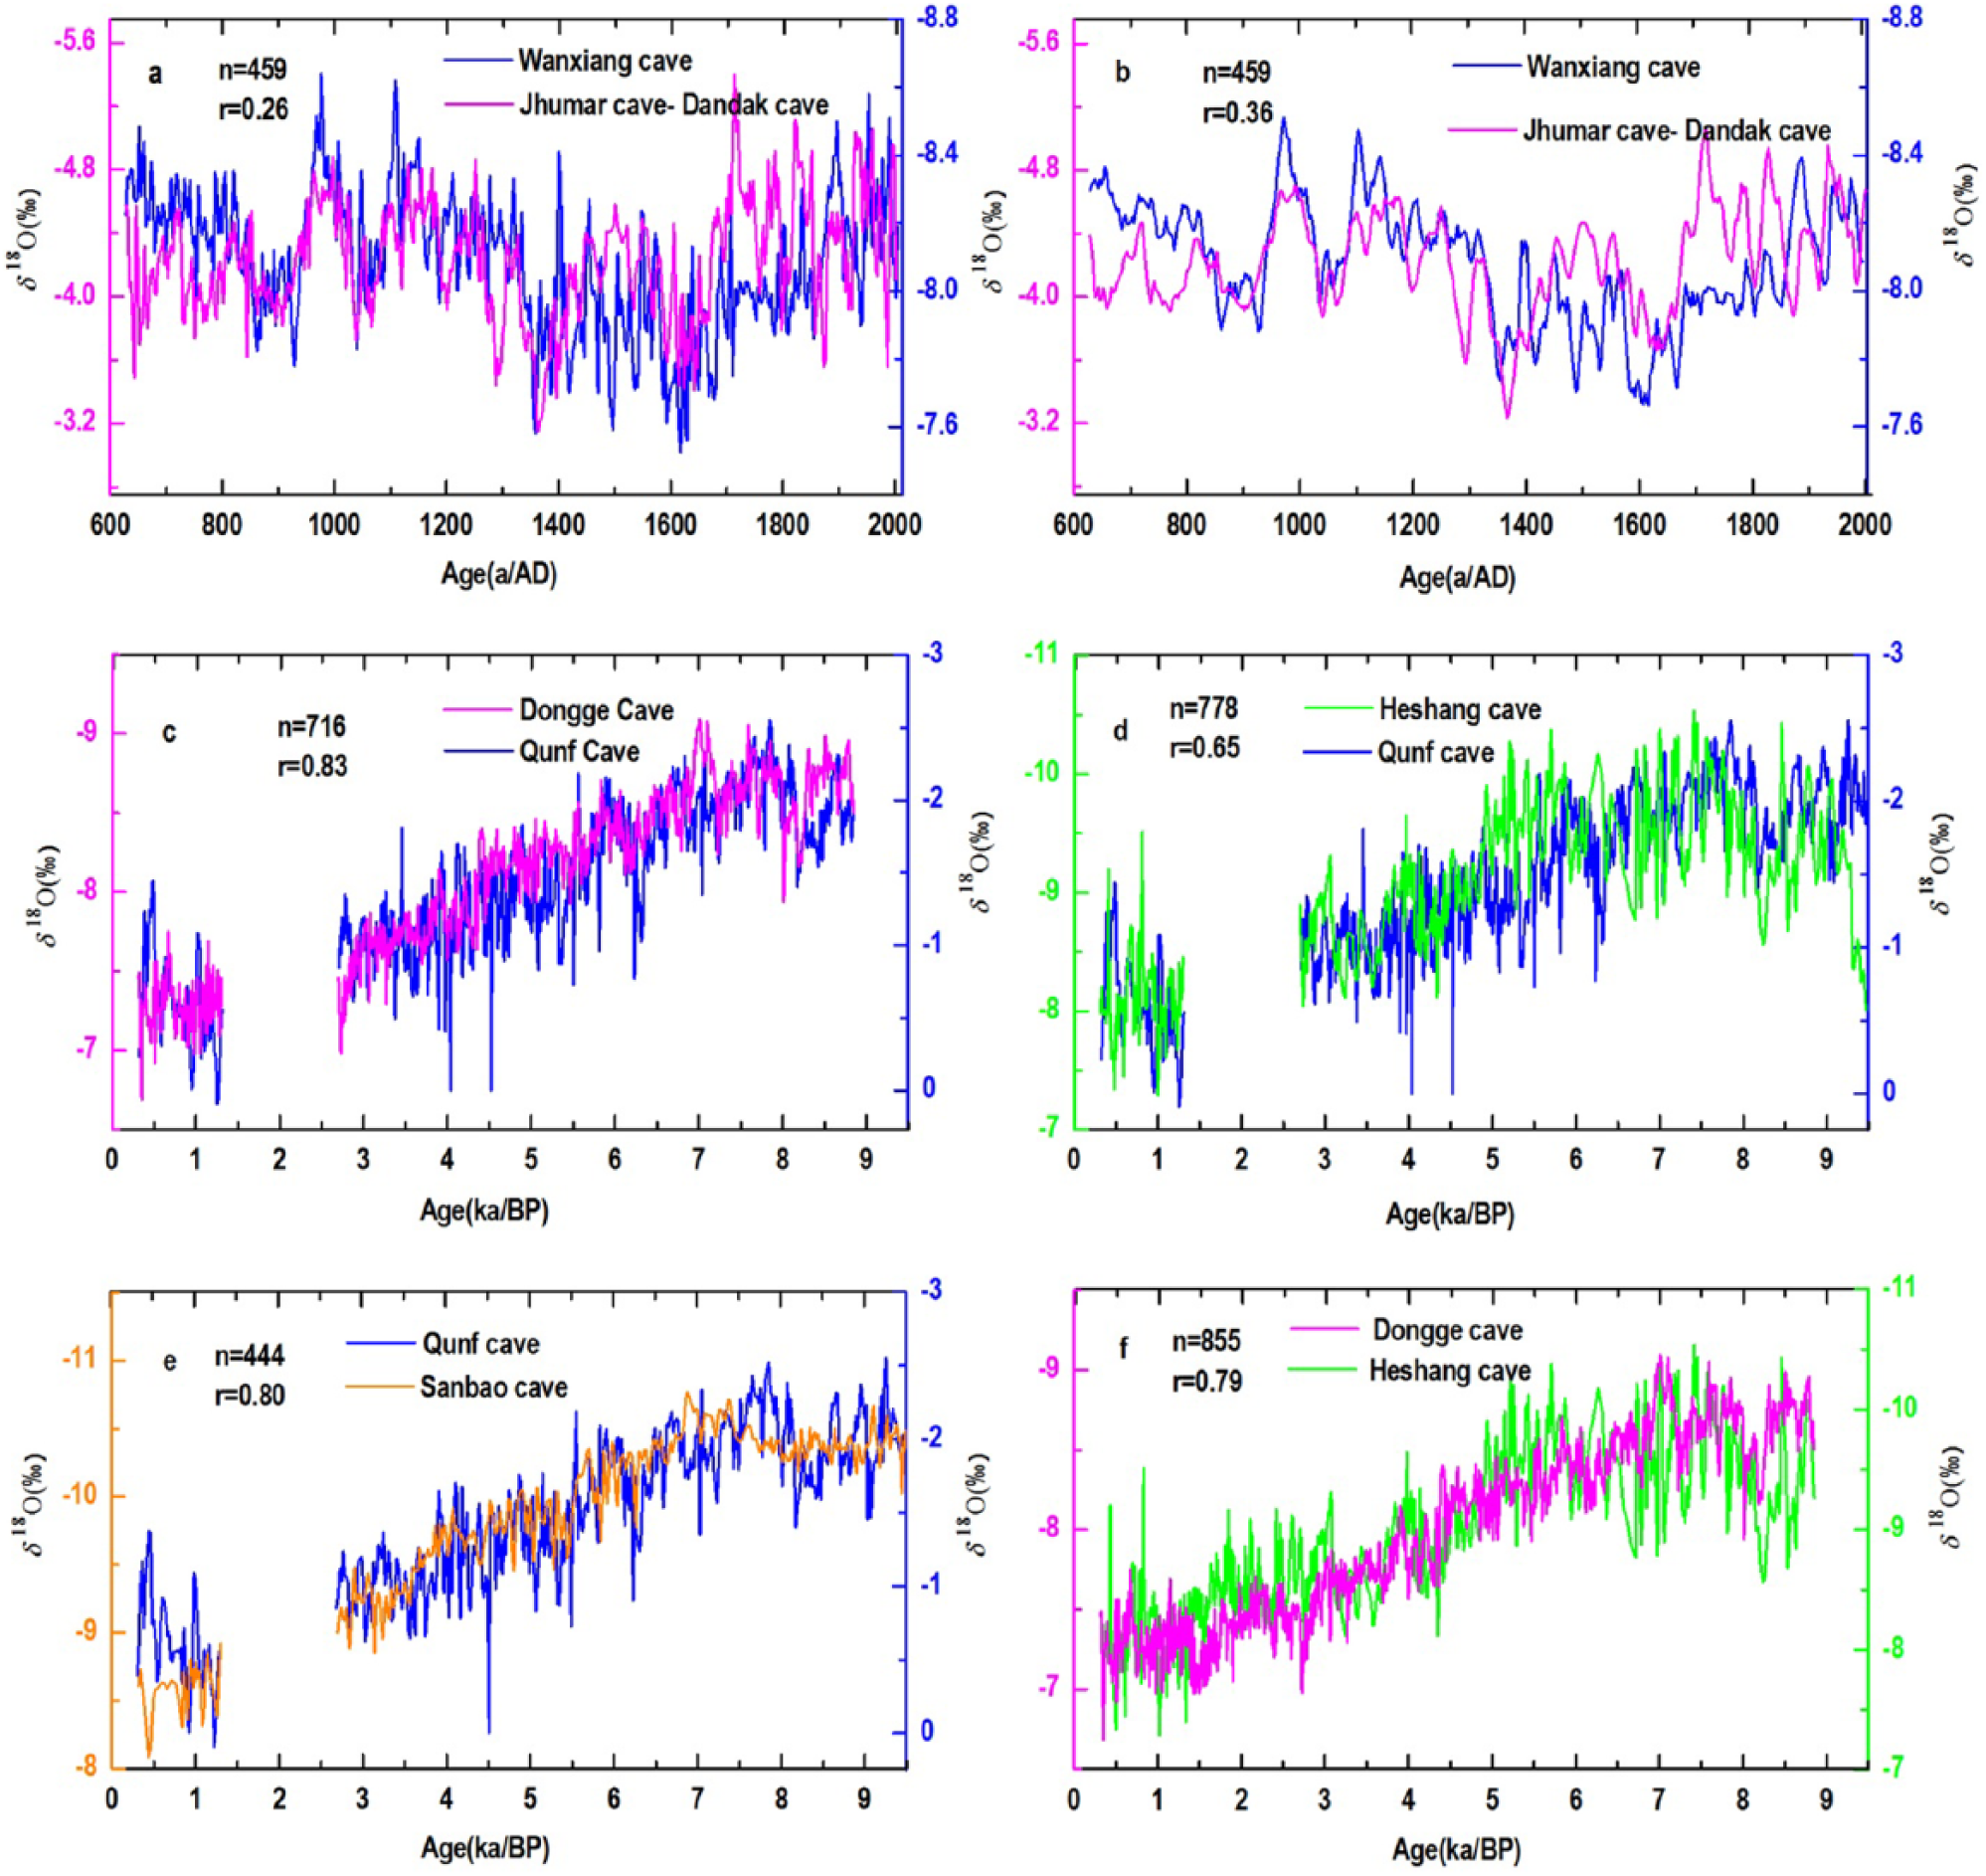
(a–b) Comparisons of stalagmite δ18O records over the last 2000 years: the Wanxiang δ18O record (Zhang et al., 2008) and the Jhumar–Dandak composite δ18O record (Sinha et al., 2007, 2011); (c–f) correlation of the Holocene stalagmite δ18O record from Qunf Cave (Fleitmann et al., 2003) with those from Dongge Cave (Wang et al., 2005b), Heshang Cave (Hu et al., 2008), and Sanbao Cave (Dong et al., 2010; Wang et al., 2008), and between Dongge Cave (Wang et al., 2005b) and Heshang Cave (Hu et al., 2008). Note that all stalagmite δ18O curves are very well matched, although the absolute values are different.
Correlation of stalagmite δ18O records in the East Asian monsoon region with those in the Indian monsoon region during the Holocene
Many Holocene stalagmite δ18O records from the Asian monsoon region have been published. Considering their temporal resolution, chronology uncertainties, and representativeness, four stalagmite δ18O records from Dongge Cave (Dykoski et al., 2005; Wang et al., 2005b), Qunf Cave (Fleitmann et al., 2003), and Heshang Cave (Hu et al., 2008) and Sanbao Cave (Dong et al., 2010; Wang et al., 2008) (Table 1) were correlated (Figure 2c–f). Qunf Cave is located in the ISM-dominated region, while the other three caves are all located in southern China (Figure 1). The three stalagmite δ18O records from southern China exhibit a very similar pattern of variability as that of the Qunf record during the Holocene period (Figure 2c–e), which is even clearer after c. 8 kyr, subsequent to the light δ18O platform in the early Holocene (Figure 2c–e). The correlation coefficients between the Qunf record and the Dongge, Sanbao, and Heshang records are 0.83, 0.76, and 0.80, respectively. There is also a strong correlation between the Dongge and Heshang records, with an R value of 0.79 (Figure 2f). All of the correlations are significant at the 99.9% confidence level. In summary, these records, covering a broad geographical region, are all strongly correlated. Given the chronological uncertainties, the stalagmite oxygen isotope records from the East Asian monsoon region and the Indian monsoon region appear to have the same controlling factor.
Discussion
Under the present-day pattern of atmospheric circulation, the direction of the trans-equatorial water vapor flow is from west to east through the Arabian Sea and Bay of Bengal, finally penetrating into southern China and moving northeastwards across China (Figure 1). Along this route, the δ18O values in modern precipitation (Figure 1) gradually become more negative because of Rayleigh fractionation (LeGrande and Schmidt, 2009; Liu et al., 2007; Tan, 2009; Wei and Lin, 1994). They decrease from −0.59‰ at QairoonHairiti station close to KahfDefore Cave (Fleitmann et al., 2004) and Qunf Cave (Fleitmann et al., 2003) to −2.59‰ at Hyderabad station close to Dandak Cave and Jhumar Cave (Sinha et al., 2005, 2011), to −3.64‰ at Shillong station close to WahShikar Cave (Sinha et al., 2011), to −5.69‰ at Guilin Station close to Dongge Cave (Wang et al., 2005b); to −5.76‰ at Wuhan Station close to Heshang Cave (Hu et al., 2008) and Sanbao Cave (Dong et al., 2010; Wang et al., 2008), and to −7.74‰ at ShijiaZhuang Station close to Shihua Cave (Li et al., 1998) (Figure 1). There is a c. 5‰ difference between southern China and the Arabian Sea. A similar trend of decreasing stalagmite δ18O values at sites along the vapor transport route is also evident for the 2000 years (Figure 3). The three speleothem δ18O values in the Indian monsoon region, close to the water vapor source region of the Arabian Sea and Indian Ocean, are generally heavier than those in China, which is distant from the water vapor source region. The stalagmite δ18O values at KahfDefore Cave are the heaviest, with a mean value of c. −0.5‰ (range −1.49 to 0.11‰), over the last 2000 years (Figure 3a). The values at Jhumar Cave–Dandak Cave in the Indian sub-continent, which is slightly further away from the vapor source, are slightly more negative at c. −4.0‰ (range −5.21 to −2.95‰) (Figure 3b–c), while at the more distant WahShikar Cave, they are c. −6.0‰ (Figure 3d). In addition, at sites in southern China, such as Dongge Cave, over the last 2000 years, the oxygen isotope values are generally lighter than in the ISM region. The mean values are c. −7.5‰ (Figure 3e). At Wanxiang Cave, more distant from the Indian Ocean than Dongge Cave, the stalagmite δ18O values reach around −8.0‰. Finally, over the last 2000 years, the lightest oxygen isotope values of stalagmites occur at the northern end of the water vapor transport route at Shihua Cave near Beijing, reaching −9.5‰ (Figure 3g). The oxygen isotope records exhibit an almost parallel series of changes over the last 2000 years, except for Shihua Cave which may be strongly influenced by water vapor from the Westerlies, as suggested by Clemens et al. (2010). Again, the oxygen isotope values of stalagmites exhibit a c. −7.0‰ difference between the East Asian monsoon region and the Indian monsoon region, such as the Qunf Cave area (Figure 3).
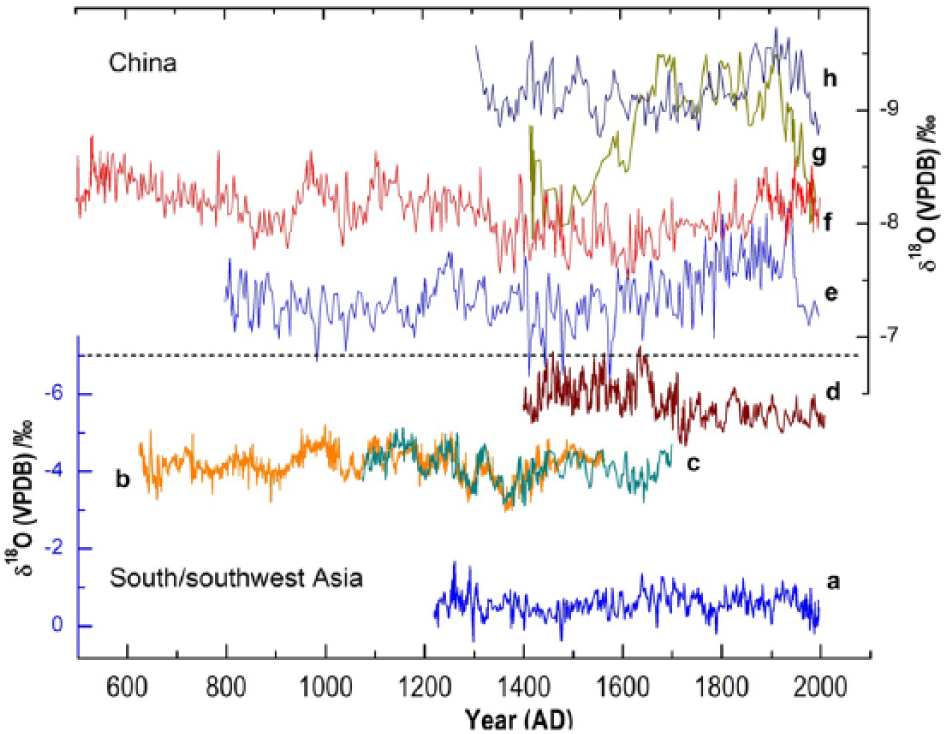
Stalagmite δ18O changes along the water vapor transport route (see Figure 1 for the locations) from the Indian monsoon region to the EASM region in China over the last 2000 years: (a) KahfDefore Cave (Fleitmann et al., 2004), (b) Dandak Cave (Sinha et al., 2007), (c) Jhumar Cave (Sinha et al., 2011), (d) WahShikar Cave (Sinha et al., 2011), (e) Dongge Cave (Wang et al., 2005b), (f) Wanxiang Cave (Zhang et al., 2008), (g) Shihua Cave (Li et al., 1998), and (h) Huangye Cave (Tan et al., 2011).
Similar systematic changes in speleothem δ18O values along the water vapor transport route are also observed during the Holocene, as shown in Figure 4. The oxygen isotope values of stalagmites exhibit a parallel series of changes during the early and mid-Holocene (Figure 4). The difference in δ18O values of stalagmites between southern China and the Qunf Cave area is c. −7.0‰. Clearly, the Indian Ocean is the dominant water vapor source, not only for the precipitation of the Arabia peninsula and the Indian sub-continent but probably also for the precipitation in the East Asian monsoon region during the Holocene. This is shown by the similar pattern of speleothem δ18O changes on different time scales and of modern precipitation along the water vapor transport route, and which results in the speleothem δ18O records from the East Asian monsoon region being significantly correlated with stalagmite δ18O changes in the ISM region.
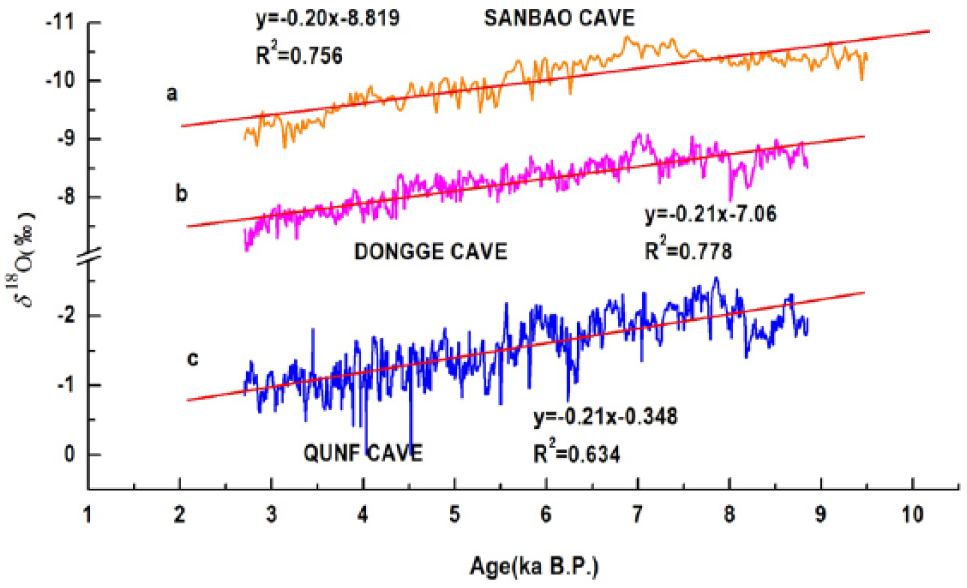
Parallel trend of stalagmite δ18O changes of Qunf Cave (Fleitmann et al., 2003), Dongge Cave (Wang et al., 2005b), and Sanbao Cave (Dong et al., 2010; Wang et al., 2008) during the Holocene.
The foregoing analysis demonstrates that the stalagmite δ18O records from the East Asian monsoon and the Indian monsoon regions are well correlated on different time scales during the Holocene. More specifically, the stalagmite δ18O values exhibit remarkably similar trends: (1) gradually decreasing values during the Pre-Boreal period (11.5–9.5 kyr BP), (2) relatively stable values from 9.5–6.0 kyr BP, and finally, (3) a gradual increase in values from 6.0–0 kyr BP. In addition, modern observations indicate that the moisture for precipitation in the East Asian monsoon region is mainly derived from the Indian Ocean (Drumond et al., 2011). Therefore, the strong correlation of δ18O records in the East Asian monsoon region and the Indian monsoon region, and the same pattern of latitudinal changes in δ18O values in speleothems as in modern meteoric precipitation, further suggest that the Indian Ocean provides the dominant moisture source for precipitation in the East Asian monsoon region. Consequently, we propose that the speleothem δ18O records from the East Asian monsoon region do not reflect changes in EASM intensity, rather that they are essentially a signal of the isotopic composition of precipitation, which is determined mainly by rainfall variability in the upstream region over the Indian Ocean and Indian Monsoon region.
In the last decade, several EASM records with a relatively high resolution, reliable chronology, and unambiguous proxies have been published. Many records from North China indicate relatively dry conditions during the early Holocene and the strongest EASM during mid-Holocene, as documented by paleoclimatic records from the Chinese loess deposits (Huang et al., 2004; Lu et al., 2013; Wang et al., 2014), sandlands (Wang et al., 2014; Yang et al., 2012), and lake sediments (Shen et al., 2005; Sun et al., 2010). For example, paleoclimatic indexes from Chinese loess deposits (Lu et al., 2013) suggest a mid-Holocene climatic optimum. In addition, a synthesized low-resolution record from the EASM region also clearly demonstrates that the wettest climate and strongest summer monsoon occurred during the mid-Holocene (Wang et al., 2010) (Figure 5). Therefore, the speleothem δ18O record in the East Asian monsoon region is quite different from the EASM record from the EASM region, and it seems clear that the speleothem δ18O records from the East Asian monsoon region may not be a reliable indicator of the EASM.
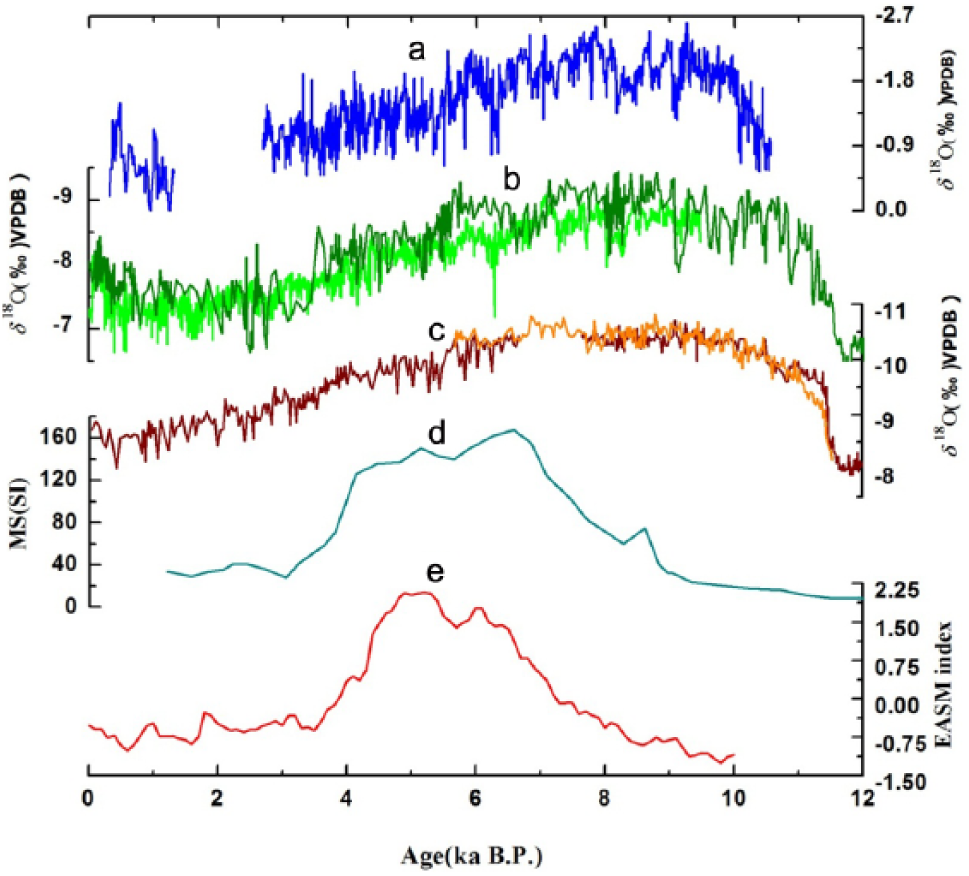
EASM proxy variations recorded in northern China and their comparison with speleothem records: (a–c) Speleothem δ18O records from Qunf Cave (Fleitmann et al., 2003), Dongge Cave (D4, dark curve, Dykoski et al., 2005; DA, green, Wang et al., 2005b), and Sanbao Cave (orange for SB10, wine for SB43, Dong et al., 2010); (d) magnetic susceptibility (MS) curve of the Yulin loess–paleosol record (Lu et al., 2013); (e) synthesized EASM index (Wang et al., 2010).
Conclusion
In this study, we compared δ18O records of speleothems from the East Asian monsoon region with those from the Indian monsoon region. The records exhibit a remarkably similar trend of variation and are well correlated on different time scales, suggesting a strong relationship between the different speleothem δ18O records from the ISM and EASM regions. In addition, the pattern of latitudinal change of speleothem δ18O values from the Indian monsoon region to the East Asian monsoon region is almost identical to that of modern precipitation. This suggests that the modern moisture transport route from the Indian Ocean to the East Asian monsoon region was probably established since at least the early Holocene, and it results in the speleothem δ18O records from the East Asian monsoon region being significantly correlated with stalagmite δ18O changes in the ISM region on different time scales during the Holocene. As a result, although we cannot exclude the role of circulation effects and different moisture sources (Maher, 2008; Maher and Thompson, 2012; Tan, 2014), our results imply that these speleothem records do document precipitation isotopic variations, and which reflect the changes of the isotopic composition of precipitation in the ISM region during the Holocene.
In contrast to the clear consistency of the δ18O values of all of the speleothem records, both instrumental and historical climate records indicate the occurrence of significant spatial variations in rainfall on a decadal-to-centennial time scale over eastern China (Ding et al., 2008; Ge et al., 2012; Wang et al., 1987; Zheng et al., 2006; Zhou et al., 2011); and both paleoclimatic records and modeling results suggest that during the Holocene EASM, precipitation reached a maximum at different times in different regions of China (Liu et al., 2014; Lu et al., 2013; Xie et al., 2013). In addition, the pattern of variation of the speleothem δ18O records is quite different to that of the EASM, since the strongest EASM occurred during mid-Holocene, as documented by paleoclimatic records from Chinese loess deposits, sandlands, and lake sediments. Therefore, we conclude that variations in speleothem δ18O values in the East Asian monsoon region mainly reflect changes in the isotopic composition of precipitation, which is determined mainly by rainfall variability in the upstream region over the Indian Ocean and Indian Monsoon region, rather than by EASM variability.
Footnotes
Acknowledgements
We thank Dr Jan Bloemendal for substantially improving the English and the anonymous reviewers for their constructive comments.
Funding
This work was supported by grants of National Nature Science Foundation of China (41272192, 41072141, 41202128, and 41372177) and the Fundamental Research Funds for the Central Universities (XDJK2012A003).