
Abstract
This study focuses on the reconstructions of vegetation and climate changes during the past ~11,000 years on the basis of 222 fossil pollen samples from Qigai Nuur (core QGN-2004) in the southern part of the Mongolian Plateau. Plant Functional Type – Modern Analogue Technique was used for quantitative climatic reconstructions from fossil pollen data. Our results showed that regional vegetation experienced dramatic shifts between steppe forest and dry steppe before 9200 cal. yr BP in the Qigai Nuur region. The reconstructed mean annual temperature and especially mean annual precipitation also showed fluctuations at that time. From ~9200 to ~2800 cal. yr BP, the vegetation was dominated by steppe forests, and the reconstructed climate was generally warm and wet, but with two cold and dry intervals at ~7400 to ~6000 cal. yr BP and at ~4000 to ~2800 cal. yr BP. From ~2800 to ~850 cal. yr BP, dry steppe vegetation dominated the landscape under slightly cooler and much drier climate conditions. During the past ~850 years, the vegetation was characterized by abundant herbs and the climate showed rising temperature and fluctuating precipitation. The comparison of the reconstructed precipitation from the Qigai Nuur core with monsoon-strength records from southern China shows that the first-order variation in the precipitation was most likely controlled by the summer insolation-dictated Inter-Tropical Convergence Zone movements (i.e. N–S shifts). The comparison of the reconstructed precipitation from Qigai Nuur core with surface sea temperature in the Western Tropical Pacific Ocean suggests that the second-order variation in the precipitation was most likely modulated by the El Niño-Southern Oscillation dynamics (i.e. E–W shifts).
Introduction
The southern part of the Mongolian Plateau is important in context of ongoing global climate change for two reasons. First, as a part of the Central Asian Arid Zone (CAAZ), the climate has been very sensitive to natural and anthropogenic forcing factors (Intergovernmental Panel on Climate Change (IPCC), 2007) and the warming-induced drying trend in CAAZ during the past 100 years is a warning sign for severe water shortage and ecological degradation under projected future warming conditions. Second, the present summer monsoonal margin is primarily situated within the southern part of the Mongolian Plateau (Gao, 1962) and the sensitivity of the monsoonal margin to climate change has been a research focus in climate and palaeoclimate communities because the sensitivity is of a serious concern for future regional socio-economic development (Huang et al., 2004; Xu, 1997). To understand the significance of current global change, it is necessary to establish the temporal background of the climate changes during the most recent geological era, i.e. the Holocene (i.e. the past 11,500 years), because the projected global changes will occur under similar natural boundary conditions.
This research places a particular focus on the reconstruction of Holocene climate change based on pollen fossil data retrieved from Qigai Nuur (39.5°N and 109.5°E) that is situated just within the aforementioned monsoonal margin (Figure 1a). We hope that our reconstruction can facilitate the reconciliation of the existing controversies surrounding the Holocene climatic changes in the East Asian monsoonal margin. These controversies include very different points of views on: (1) synchronous or asynchronous association of temperature and precipitation (e.g. Chen FH et al., 2006; Feng et al., 2006; Shi et al., 1993; Xiao et al., 2004), (2) the timing of the Holocene Thermal Maximum (e.g. An et al., 2000; Feng et al., 2006; Xiao et al., 2004; Zhou et al., 2001), and (3) the dynamics of the monsoon northern limit (e.g. An, 2000; Hartmann and Wünemann, 2009; Herzschuh et al., 2004; Zhao et al., 2008).
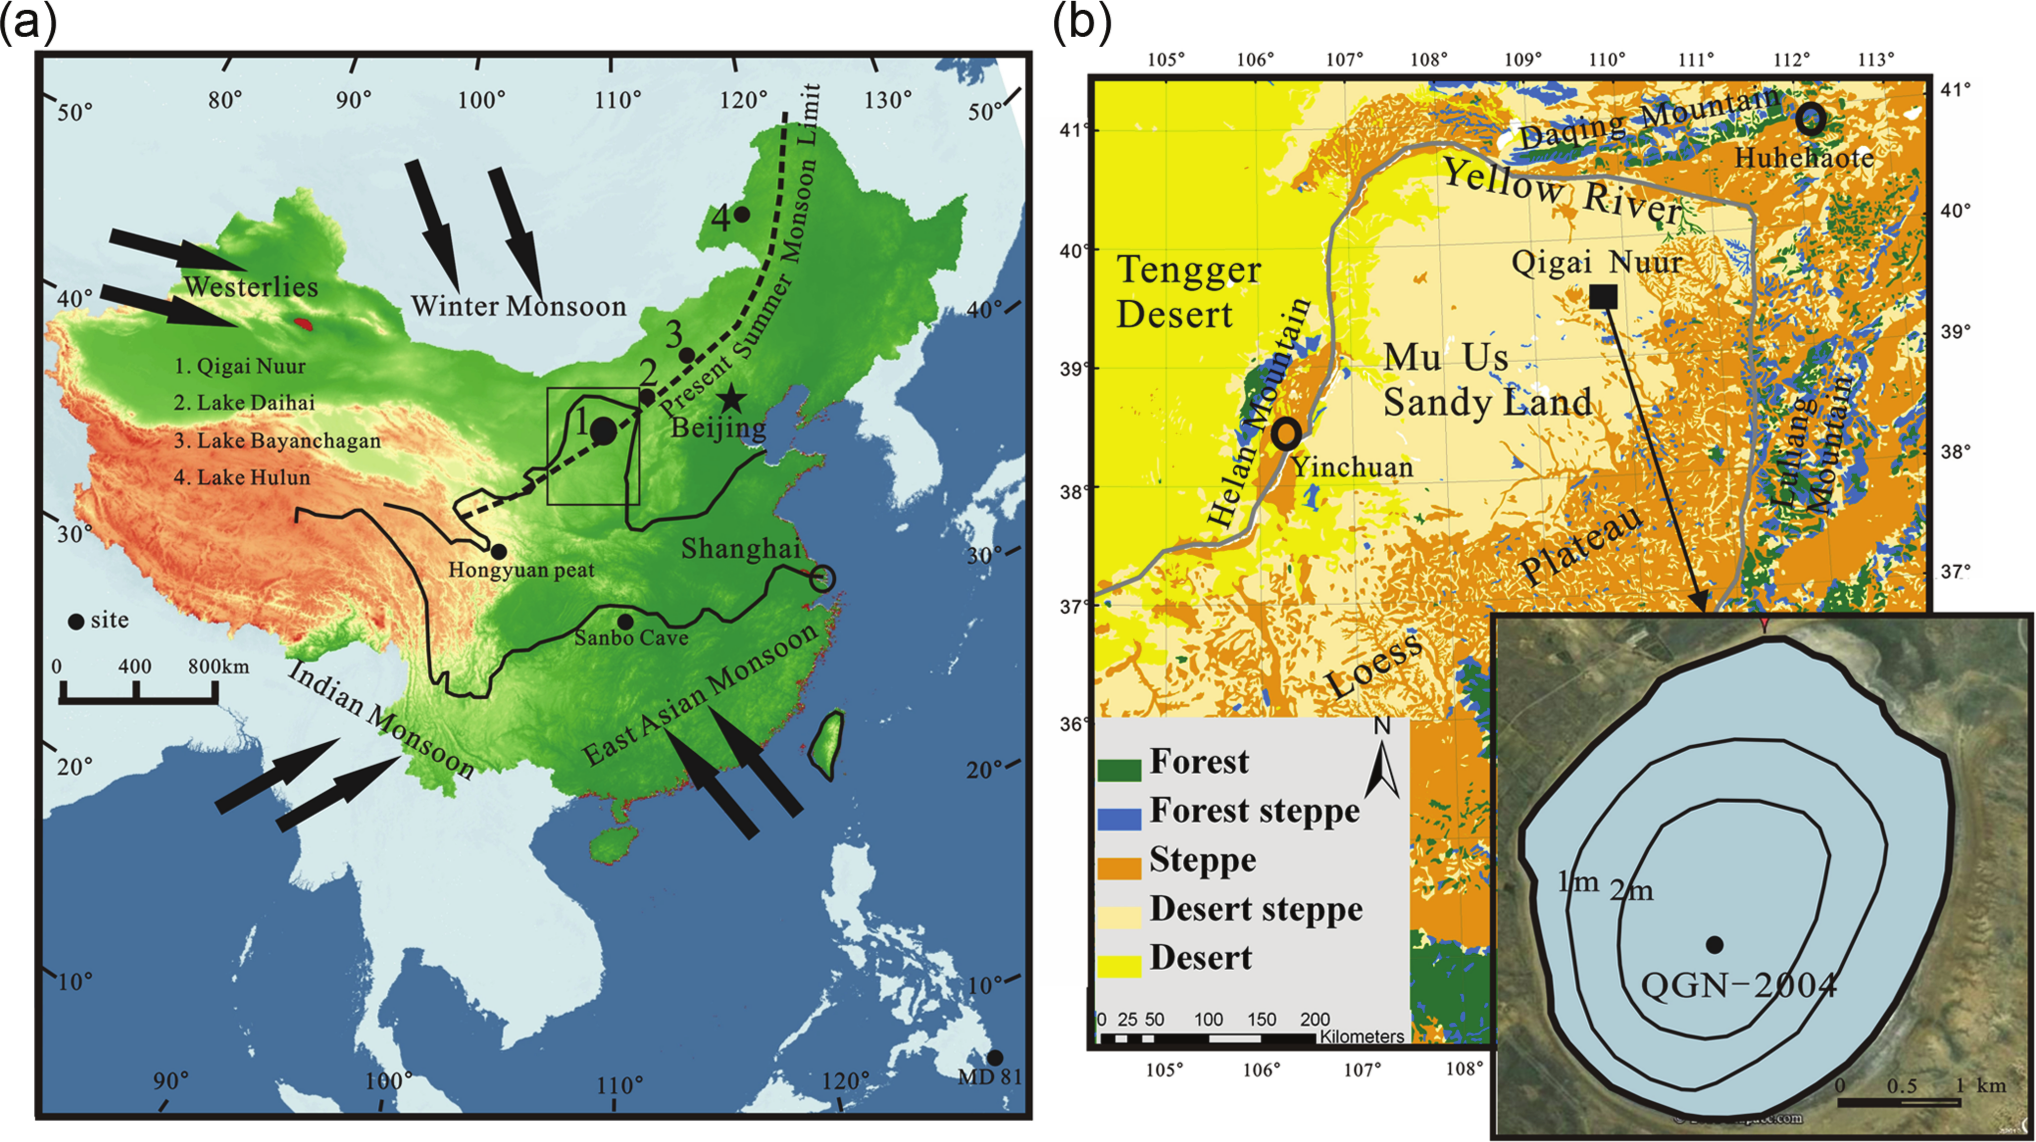
Location of Qigai Nuur and other lakes mentioned in the text. (a) Present summer monsoon limit (Gao, 1962); (b) vegetation distribution in study region, inset showing lake bathymetry and coring location (e.g. Qigai Nuur basin and surrounding area) (Zhang, 2007).
Study region and site
Qigai Nuur is situated in the middle part of Mu Us Sandy Land, which lies between the steppe-dominated margin of the Loess Plateau to the southeast and the Tengger Desert to the northwest (Figure 1b). The mean annual temperature (MAT) is ~7°C and the mean annual precipitation (MAP) is ~300 mm with the evaporation exceeding 1000 mm at Wushen County Meteorological Station that is only 20 km from Qigai Nuur. Qigai Nuur is the sixth of seven catenulated lakes forming along an abandoned river channel that were later modified by sand-dune activities. At present, it is a closed basin lake with a surface area of about 5 km2 and a maximum water depth of about 3 m. The modern natural vegetation in the Qigai Nuur region is dominated by steppes (Figure 1b), mainly consisting of Salsola spp., Caragana, Artemisia arenaria, Chenopodiaceae, Agriophyllum squarrosum, and Corispermum spp. Meadow steppes and wetland marshes are also found in topographic depressions, lake shores and river valleys (Zhang, 2007).
Material and methods
Core collection and sediment composition analysis
An 8.2 m long sediment core (QGN-2004) was collected with a UWITEC piston corer in the summer of 2004 in the central part of Qigai Nuur where the water depth is 2.9 m. The core was cut longitudinally into two halves and visually described immediately after core retrieval in the field. The grain size was measured at 2 cm intervals using a Malvern Mastersizer 2000 laser diffraction particle size analyzer (size range 0.02–2000 μm). Sample pretreatment for grain-size analysis included: (1) using H2O2 to remove organic matter and soluble salts, (2) using diluted 1 N HCl to remove carbonate and (3) using Na-hexametaphosphate to disperse aggregates. Total organic matter content (TOC) was determined at 2 cm intervals using the titration method with concentrated sulfuric acid (H2SO4) and potassium dichromate (K2Cr2O7). All of the aforementioned analyses were conducted in the MOE Key Laboratory of Western China’s Environmental Systems at Lanzhou University.
Dating analysis
Seventeen samples of bulk sediment were radiocarbon dated using accelerator mass spectrometry (AMS) at the NSF-AMS Facility at the University of Arizona (Table 1). To assess the carbon reservoir effect, we obtained an age of 1947 14C yr BP on the bulk sediment sampled at 0–2 cm. We also constructed a linear relationship between the depths and the nine dates for the upper 300 cm of the core without including the top date (i.e. 1947 14C yr BP) and the intercepted age for the top (i.e. 0 cm) is 2020 years, being reasonably consistent with the measured reservoir effect of ~1950 years. To account for the reservoir effect for the entire core, 1950 years were subtracted from the bulk sediment radiocarbon dates assuming that the reservoir effect is the same throughout the core. Then, all dates were calibrated to calendar years before present (BP=
Radiocarbon dates and calibrated ages of Qigai Nuur core.

Pollen analysis
A total of 222 pollen samples were obtained at 2–4 cm intervals from the sediment core. For pollen analysis, a tablet of Lycopodium (containing 27,637±563 spores) was first added for calculation of pollen concentration (Moore et al., 1991). The procedure for fossil pollen analysis includes treating 5–10 g of sediment sample with 10% HCl, 10% KOH, 36% hydrofluoric acid (HF) to eliminate carbonate, humid acid, and silicate, respectively. Furthermore, the pollen in the residue was concentrated with a 7 μm mesh sieve in conjunction with ultrasonic vibration. Finally, water-free glycerol was used for mounting pollen samples on microscopic slides. The treated samples were then examined with a transmitted light microscope (Olympus BX 51) at 400× to 1000× magnification. More than 300 pollen grains (not including spores) were counted for each sample. Pollen types were identified using pollen references including pollen books and photographs (Erdtman, 1978; Moore and Webb, 1987; Wang et al., 1995) and our own reference slide collection of more than 200 plant species from northern China. The percentage of each pollen type was calculated based on the sum of all counted pollen grains excluding spores. Pollen concentrations were calculated on the basis of exotic Lycopodium spore counts and were expressed as the number of grains per gram (grains/g). Pollen diagrams were plotted using Tilia (version 1.7.16) (Grimm, 1990). CONISS cluster analysis was conducted for providing reference for pollen zoning.
Several pollen indices have been designed to capture climate-related information for arid and semi-arid regions. For example, the C/A ratio (Chenopodiaceae/Artemisia) has been shown to be a useful aridity index in arid and semi-arid Asia (El-Moslimany, 1990; Liu et al., 1998; Van Campo et al., 1996; Zhao et al., 2009a). But, this index was found to be problematic in the northern part of the Mongolian Plateau when Chenopodiaceae pollen overwhelmingly dominates the pollen spectrum in the arid conditions (Wang et al., 2011) or when Poaceae pollen is adequately represented in the pollen spectrum in semi-arid conditions (Fowell et al., 2003). Another pollen percentage ratio ((C+A)/P) of the combined Chenopodiaceae and Artemisia (C+A) to Poaceae (P) was designed to retrieve the Holocene aridity history in central Mongolia (Fowell et al., 2003). However, Poaceae has been sufficiently demonstrated to be under-represented in pollen spectrum in the entire Mongolian Plateau (Gunin, 1999; Ma et al., 2008) and this index is thus also questionable (Wang et al., 2011). Here, we design another index (A/(E+N)) for capturing the Holocene humidity variations in the Qigai Nuur area (where A is Artemisia pollen percentage, E is Ephedra pollen percentage, N is Nitraria pollen percentage). It is well documented that the abundance of Ephedra and Nitraria increases with increasing aridity in arid environments (Li et al., 2005; Sun et al., 1994; Xu et al., 2009; Zhao et al., 2008). In contrast, the abundance of Artemisia increases with increasing humidity in arid environments (Ma et al., 2008; Wang et al., 2011; Wen et al., 2010a, 2010b). Therefore, a pollen percentage ratio of Artemisia (A) to the combined Ephedra and Nitraria (E+N) is used here as a humidity index. Furthermore, we also design another index (Br/Co) for capturing the Holocene temperature variations in the Qigai Nuur area (Br is broadleaved tree pollen percentage, Co is coniferous tree pollen percentage). The rationale for designing this index is based on global plant function types in general (Prentice et al., 1996) and on the Mongolian Plateau’s plant geography in particular (Demske et al., 2005; Ma et al., 2008; Tarasov et al., 2007; Xu et al., 2010). That is, coniferous trees grow in cool environments, while broadleaved trees in warm environments.
Quantitative climatic reconstructions using fossil pollen data
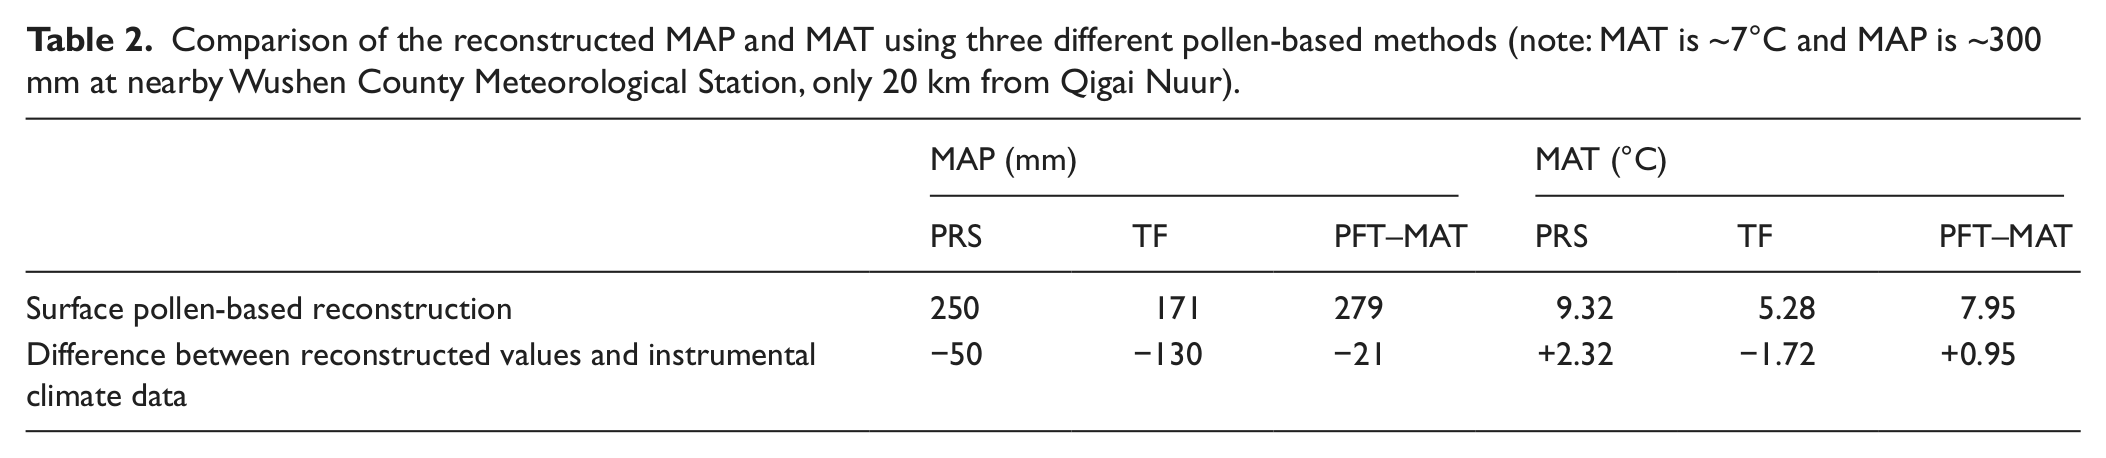
Three different pollen-based methods have been adopted to quantitatively reconstruct the Holocene temperature and precipitation along the East Asian summer monsoonal margin: (1) pollen response surface (PRS) at Lake Daihai (Xu et al., 2003); (2) transfer function (TF) at Lake Hulun (Wen et al., 2010b), and (3) Plant functional type – modern analogue technique (PFT–MAT) at Lake Bayanchagan (Jiang et al., 2006, 2009). PRS method was developed on the basis of 215 surface pollen spectra from northern China (Sun et al., 1996) and TF method was developed on the basis of 646 surface pollen spectra across a S–N transect from northern China to northern Mongolia (Wen et al., 2010b). PFT-based quantitative reconstruction searches for the affinity between the fossil pollen assemblage considered and the modern pollen data set compared (Prentice et al., 1992, 1996; Tarasov et al., 2000) and the modern pollen data set used by Jiang et al. (2006, 2009) includes 211 surface pollen spectra from northern China (Members of China Quaternary Pollen Data Base, 2001) and 1855 surface pollen spectra from the former Soviet Union and Europe (Guiot et al., 1993; Tarasov et al., 1998). We applied the aforementioned three methods to the modern pollen spectra (i.e. the surface pollen data) of Qigai Nuur core to test their adaptability to the pollen data of Qigai Nuur core. The results show that the PFT–MAT method performs the best, the difference between the reconstructed MAP and the recorded MAP being only ~20 mm and the difference between the reconstructed MAT and the recorded MAT being only ~1°C (Table 2). Therefore, the PFT–MAT method is adopted in this study to reconstruct the Holocene climate in the Qigai Nuur area.
Comparison of the reconstructed MAP and MAT using three different pollen-based methods (note: MAT is ~7°C and MAP is ~300 mm at nearby Wushen County Meteorological Station, only 20 km from Qigai Nuur).
Based on broad classes of plants defined by life form, leaf form, phenology and climatic thresholds, pollen taxa were assigned into the plant functional type (PFT) (Prentice et al., 1996). The PFT assignments of each pollen taxon were carried out mainly using the PFT classification scheme of Jiang et al. (2006). PFT scores are defined as the sums of the square root of the pollen percentage values above 0.5% (Prentice et al., 1996). After each pollen taxon within each sample had been given a PFT assignment, we reconstructed the changes in vegetation, based on the affinity scores for biome types. In this study, we are restricted to 50 taxa that are represented in the modern pollen data base.
The PFT–MAT method calculates a chord distance between the pollen taxa considered and the modern analogues compared to determine the dissimilarity between the fossil and modern pollen spectra (Davis et al., 2003; Nakagawa et al., 2002). For each fossil spectrum, we selected eight modern analogues with the smallest chord distance that represents the ‘best modern analogues’. The mean climate parameters of each fossil pollen assemblage are then calculated using the method described by Guiot et al. (1993) and Magny et al. (2001). All calculations were carried out using the PPPBASE software package (Guiot and Goeury, 1996). The climate data of a specific surface pollen sample site are obtained by a weighted average of observed data from its adjacent weather stations within an area of 5°×5° (Guiot and Goeury, 1996).
Results
Chronology
The 8.2 m lacustrine sediments core covers the last 10,700 years (Figure 2b). The estimated depositional rates for the four core segments are: ~175 cm/kyr between 0 cm and 302 cm, ~35 cm/kyr between 302 cm and 382 cm, ~50 cm/kyr between 382 cm and 572 cm, and ~90 cm/kyr between 572 cm and 820 cm (Figure 2b). Again, it should be particularly noted that the ages between 632 cm and 820 cm were extrapolated based on the linear relationship between the three dates and the corresponding depths between 570 and 632 cm (Figure 2b). This age extrapolation for the depths between 632 cm and 820 cm is admittedly not statistically robust, but the considerably coarser strata between 630 and 820 cm are reasonably collaborated by the steeper line of the age–depth model.

Lithology, core photo, OM (%), mean grain size (μm), age–depth model, and estimated sedimentation rate of Qigai Nuur core.
Sediment lithology and composition
The core can be stratigraphically divided into six units primarily according to the mean grain size and the organic matter content (OM) (Figure 2a). Sediment Unit 1 (820–780 cm) is a brown-gray silt layer with the mean grain size of ~15 μm and the average organic matter content (OM) of ~3%. Sediment Unit 2 (780–720 cm) is a dark-colored clayey silt layer with the mean grain size of ~10 μm. This layer is also distinctively characterized by an elevated OM content (up to ~4%). Sediment Unit 3 (720–650 cm) is a light-colored sandy silt layer with the mean grain size of ~60 μm. Considerably lowered OM content (down to ~1%) and variably coarse grain size (from ~20 to 80 μm) are unique features of this unit. Sediment Unit 4 (650–340 cm) is a laminated and dark-colored clayey silt layer. The lamination is marked by relatively dramatic variations in OM contents, ranging from ~1% to ~5%. Sediment Unit 5 (340–120 cm) is a brown-gray clayey silt layer with mean grain size of ~20 μm and the mean OM content of ~1%. Sediment Unit 6 (120–0 cm) is a brown-gray clayey silt layer with the mean grain size of ~15 μm and the mean OM content of ~2%.
Fossil pollen data
In total, 56 different types of terrestrial fossil pollen were identified from all samples analyzed in this study and they include 16 tree taxa and 40 herbaceous and shrubs taxa. In addition, Pediastrum also was identified. The core can be palynologically divided into six pollen assemblage zones based on percentages of the major pollen taxa using the constrained incremental sum of squares (CONISS) method and the six pollen zones are reasonably corresponding with the aforementioned sediment units with more sub-units within the pollen zones 4, 5 and 6 (Figure 3).

Pollen spectra and taxa percentages of Qigai Nuur core.
Pollen Zone 1 (820–780 cm; ~10,700–10,300 cal. yr BP) corresponds with Sediment Unit 1 and the pollen assemblage is dominated by herbs, mainly including Chenopodiaceae (30–50%), Artemisia (7–20%) and Ephedra (5–12%). The coniferous tree component including Pinus (10–30%), Cupressaceae (1–6%) and Picea (1–5%) contributes to ~20% of the total pollen sum. The percentage of broadleaved tree pollen and the pollen concentration are quite low.
Pollen Zone 2 (780–720 cm; ~10,300–9800 cal. yr BP) corresponds with Sediment Unit 2. The assemblage is marked by an increase in broadleaved tree pollen (up to 20%) at the expense of herb pollen. The broadleaved trees are Quercus (5–10%), Betula (0.3–1.6%), Alnus (0–1%), Ulmus (0–2%) and Juglans (0–1.3%), and Quercus is the major contributor to the increase of broadleaved tree pollen. It is also notable that the percentages of ‘wet’ terrestrial herbs (i.e. Cyperaceae and Ranunculaceae) and aquatic Typha and the concentrations of Pediastrum increased significantly compared with the underlying Pollen Zone 1.
Pollen Zone 3 (720–650 cm; ~9800–~9200 cal. yr BP), corresponding with Sediment Unit 3, is distinctively characterized by dramatic increases in drought-tolerant shrubs (Ephedra, Nitraria and Aster-type) and also by dramatic decreases in pollen concentration and in percentages of Cyperaceae and Quercus pollen.
Pollen Zone 4 (650–330 cm: ~9200–~2800 cal. yr BP), corresponding with Sediment Unit 4, is uniquely typified by a variably high pollen concentration and by a relatively high percentage of broadleaved tree pollen (e.g. Quercus, Betula and Ulmus). The pollen percentages of some herb and shrub pollen (e.g. Artemisia, Cyperaceae, Chenopodiaceae, Rosaceae, Corylus and Tamarix) are also higher than the underling Pollen Zone 3. Pollen Zone 4 can be divided into three subzones (i.e. 4-1, 4-2 and 4-3).
Subzone 4-1 (650–580 cm; ~9200–~8500 cal. yr BP) is marked by increases in herb and in broadleaved pollen at the expense of the coniferous tree pollen. The increase in broadleaved tree pollen is primarily attributable to the increases in Quercus (up to 6%) and Ulmus (7%). It is also noticeable that mesophytic-types (e.g. Artemisia, Rosaceae and Hippophae) increase, while xero-types (e.g. Ephedra and Nitraria) decrease in this subzone.
Subzone 4-2 (580–430 cm; ~8500–~5800 cal. yr BP) is characterized by an upward-decreasing trend of herbs (especially Artemisia) and also by an upward-increasing trend of coniferous tree (especially Pinus). The most remarkable feature of this subzone is considerable increases in Chenopodiaceae and Ephedra pollen percentages. Subzone 4-3 (430–330 cm; ~5800–~2800 cal. yr BP) is quite distinguishable from the underlying subzone 4-2 in four aspects: (1) a higher pollen concentration, (2) a dramatic increase in Quercus pollen, (3) a considerable increase in Ranunculaceae pollen, and (4) a dramatic increase in the Pediastrum concentration.
Pollen Zone 5 (330–140 cm; ~2800–~850 cal. yr BP) approximately corresponds with Sediment Unit 5 (340–120 cm). The pollen assemblage is marked by high coniferous tree pollen (40–95%) at the expense of some herbs (especially Chenopodiaceae and Artemisia) and broadleaved trees (especially Quercus) with a drastically lowered pollen concentration. Another noticeable feature is drastically lowered percentages of wet-indicative species including Cyperaceae and Typha, and lowered concentration of Pediastrum. This zone can be further divided into two subzones (i.e. 5-1 and 5-2).
Subzone 5-1 (330–220 cm: ~2800–~1300 cal. yr BP) has the highest coniferous tree pollen and the lowest Chenopodiaceae and Artemisia pollen percentages of the entire core. It should be reiterated that coniferous tree pollen (especially Pinus) dominated this interval (~2800–~1300 cal. yr BP). Subzone 5-2 (220–140 cm; ~1300–~850 cal. yr BP) has increased herbs and decreased coniferous trees. The increase of herbs in subzone 5-2 is mainly contributed by increases in Poaceae (5–17%), Cyperaceae (3–15%), Chenopodiaceae (10–50%) and Taraxacum-type (5–18%).
Pollen Zone 6 (140–0 cm; ~850–~0 cal. yr BP) approximately corresponds with Sediment Unit 6 (120–0 cm) and is dominated by herbs. This zone can be divided into two subzones (i.e. 6-1 and 6-2).
Subzone 6-1 (140–80 cm; ~850–~450 cal. yr BP) is distinguished by high percentages of Chenopodiaceae and Cyperaceae pollen and also by a low pollen concentration.
Subzone 6-2 (80–0 cm; ~450–~0 cal. yr BP) is typified by a high percentage of Artemisia pollen (up to 70%) and also by a relatively high percentage of Cupressaceae (up to 12%) with a significantly elevated pollen concentration.
Quantitative climatic reconstructions
Our PFT–MAT-based reconstructions of the mean annual temperature (MAT) and the mean annual precipitation (MAP) show that the regional climate experienced three different phases from ~10,700 to ~9200 cal. yr BP, that is, cold and dry (i.e. Pollen Zone 1 in Figure 4), warm and wet (i.e. Pollen Zone 2), and cold and dry (i.e. Pollen Zone 3). The climate in the Qigai Nuur area was a generally warm and wet from ~9200 to ~2800 cal. yr BP (i.e. Pollen Zone 4) with obvious fluctuations in the reconstructed MAP. From ~2800 to ~1400 cal. yr BP the regional climate was considerably cooling and slightly drying and the past ~1400 years was characterized by rising MAT and fluctuating MAP.
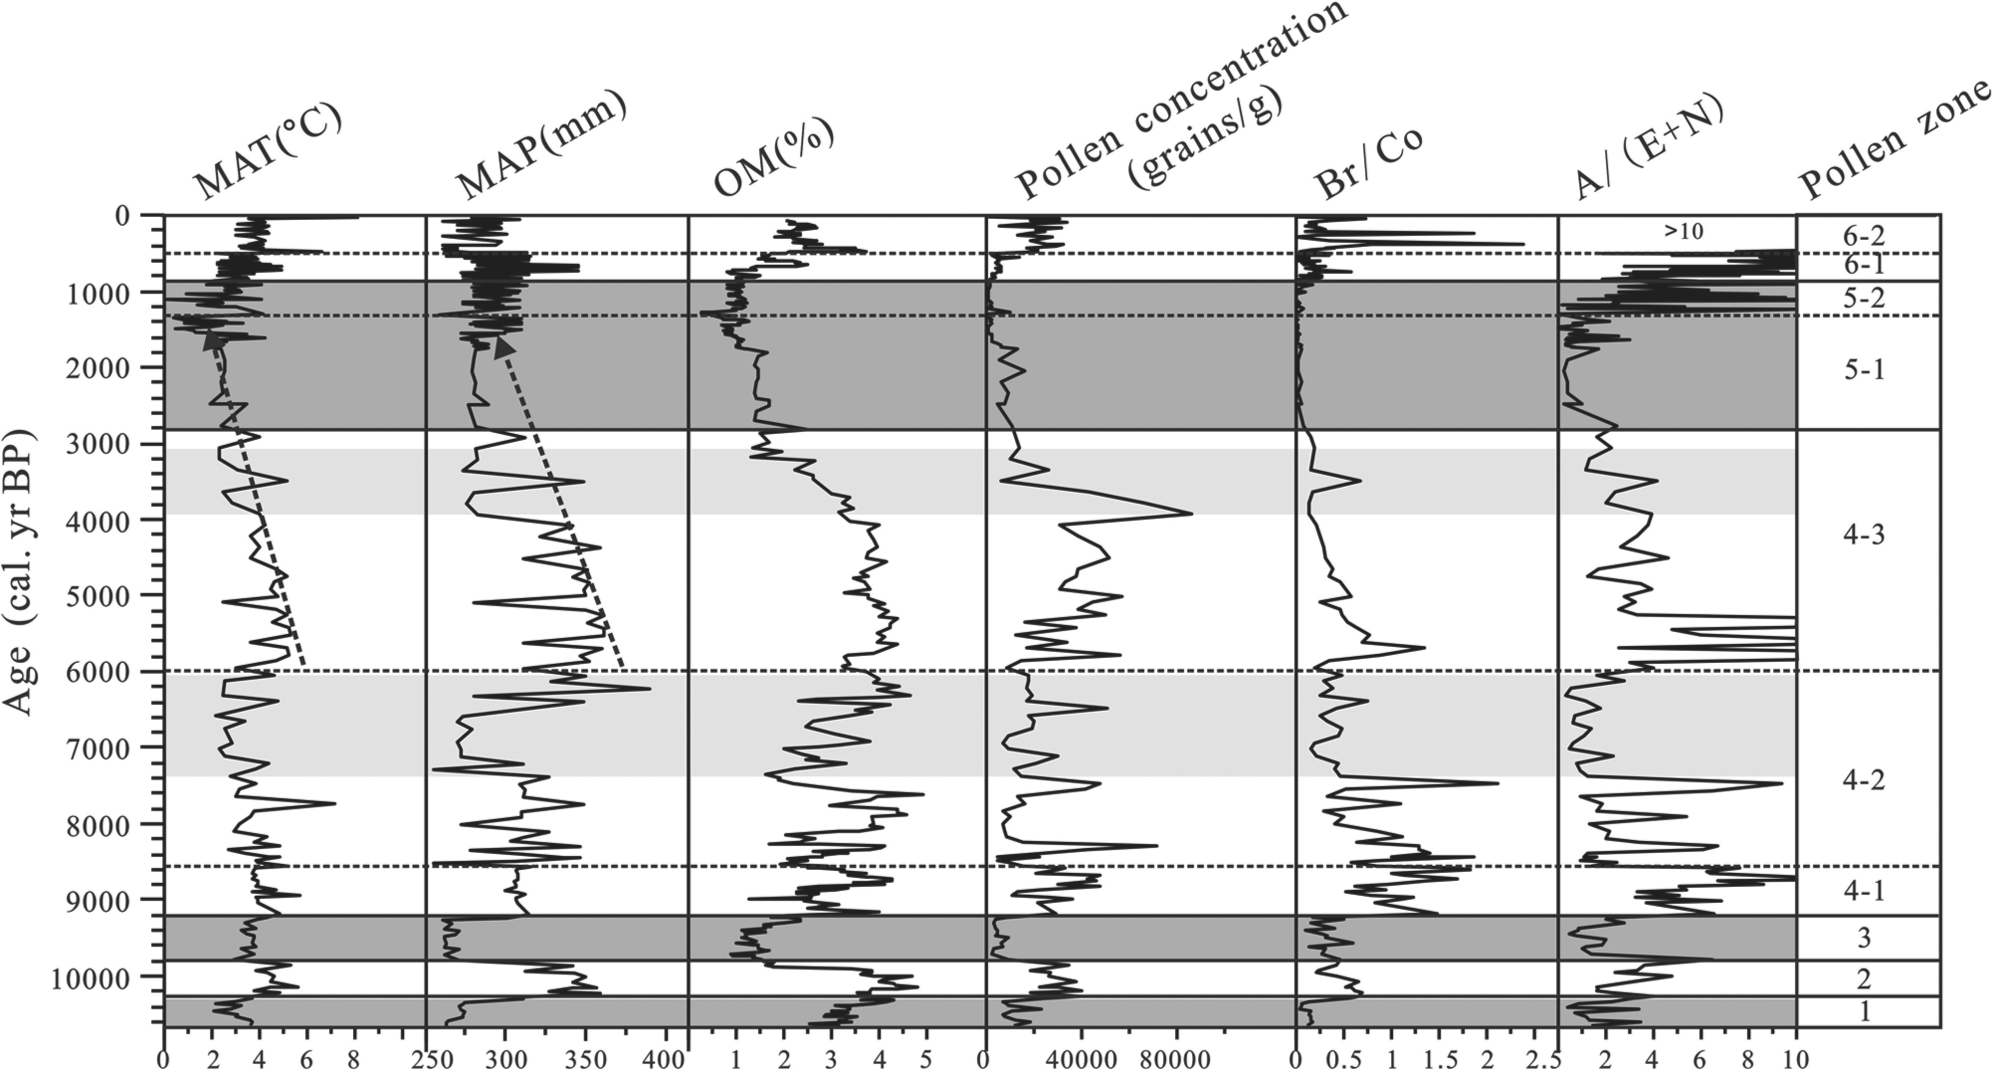
Comparison of reconstructed mean annual temperature (MAT) and mean annual precipitation (MAP) with other proxy data including OM (%) and pollen concentration (grains/g). Two pollen ratios are also presented for comparison and they are Br/Co (where Br is broadleaved tree pollen percentage, Co is Coniferous tree pollen percentage) and (E+N)/A (where E is Ephedra pollen percentage, N is Nitraria pollen percentage, A is Artemisia pollen percentage). The dark-shaded strips mark the Holocene cool and dry stages (i.e. Pollen Zones 1, 3 and 5) and the light-shaded strips mark the mid-Holocene cool and dry epochs. The dashed lines mark the trends of MAT and MAP changes.
From ~9200 to ~2800 cal. yr BP, after a brief mild and relatively humid interval between ~9200 and ~8500 cal. yr BP, the first pronounced warm and wet period persisted from ~8500 to ~7400 cal. yr BP and this warm and wet climate was succeeded by a rather pronounced cool and dry interval lasting from ~7400 to ~6000 cal. yr BP. The following period from ~6000 to ~2800 cal. yr BP was characterized by three distinctive features: (1) a generally warm and wet early period (i.e. from ~6000 to ~4000 cal. yr BP), (2) a generally cool and dry late period (i.e. from ~4000 to ~2800 cal. yr BP), and (3) declining trends of both MAT and MAP from ~6000 to ~2800 cal. yr BP.
Our PFT–MAT-based reconstructions of MAT and MAP are relatively well corroborated by other proxy data from the core. For example, the organic matter content (i.e. OM content in Figure 4) nearly parallels the reconstructed MAP curve. The pollen concentration appears to reflect the first-order variations in MAP. That is, the major climatic stages corresponding with pollen zones are reasonably replicated by the pollen concentration. Our temperature index, Br/Co (where Br is broadleaved tree pollen percentage, Co is coniferous tree pollen percentage), seems to have captured the first-order variations in MAT and our humidity index, A/(E+N) (where A is Artemisia pollen percentage, E is Ephedra pollen percentage, N is Nitraria pollen percentage), seems to have captured the first-order variations in MAP. In other words, the major variations of MAT are reasonably replicated by the Br/Co ratio and the major variations of MAP are reasonably replicated by the A/(E+N) ratio.
To sum up, the Qigai Nuur area experienced three major cool and dry stages corresponding with Pollen Zones 1, 3 and 5 and two major warm and wet stages corresponding with Pollen Zones 2 and 4 during the Holocene. The final stage (i.e. Pollen Zone 6; past ~850 years) has been characterized by rising MAT and fluctuating MAP. The generally warm and wet climate from ~9200 to ~2800 cal. yr BP (i.e. Pollen Zone 4) was interrupted twice by cool and dry epochs, the first occurring from ~7400 to ~6000 cal. yr BP and the second occurring from ~4000 to ~3000 cal. yr BP. Two more observations can be made from Figure 4. First, the reconstructed MAT and MAP have changed more or less synchronously throughout the entire Holocene. Second, both of the reconstructed MAT and MAP exhibit declining trends from ~6000 to ~1400 cal. yr BP.
Discussion
Vegetation and climate changes in the Qigai Nuur area
Our data show that both lake sedimentation and regional vegetation of the Qigai Nuur area experienced pronounced shifts from ~10,700 to ~9200 cal. yr BP. Specifically, the lake first received silt deposits under a Chenopodiaceae-dominated regional vegetation condition (probably a steppe) between ~10,700 and ~10,300 cal. yr BP (i.e. Pollen Zone 1) and then clayey silt deposits under a greatly ameliorated regional vegetation condition (likely a steppe-forest) between ~10,300 and ~9800 cal. yr BP (i.e. Pollen Zone 2). A sandy silt layer was deposited in the lake between ~9800 and ~9200 cal. yr BP (i.e. Pollen Zone 3) when drought-tolerant shrubs (Ephedra and Nitraria) dominated the regional vegetation (probably a dry steppe or even a desert).
The lake level from ~9200 to ~2800 cal. yr BP (i.e. Pollen Zone 4) was generally high as indicated by uniformly fine clayey silt deposits, and the vegetation was dominated by relatively densely covered steppe-forests as suggested by high pollen concentrations and high percentage of broadleaved tree pollen. However, the vegetation types and coverage had also changed during this warm and wet period (Figure 3). Specifically, the vegetation probably started with a woodland landscape with scattered Quercus under a mild and relatively humid climate from ~9200 to ~8500 cal. yr BP (i.e. Pollen Subzone 4-1). The subsequent landscape was probably a Ulmus-marked woodland under a generally warm and wet climate from ~8500 to ~6000 cal. yr BP (i.e. Pollen Subzone 4-2) and the vegetation in the later part of this interval (i.e. from ~7400 to ~6000 cal. yr BP) was deteriorated probably to a steppe under a cool and dry condition. The vegetation between ~6000 and ~2800 cal. yr BP (i.e. Pollen Subzone 4-3) was characterized by increases in the percentages of Quercus and Ranunculaceae pollen and also in Pediastrum concentration and also by high pollen concentrations, suggesting that the climate was relatively warm and rather wet. It is also notable that the vegetation in the later part of this interval (i.e. from ~4000 to ~2800 cal. yr BP) was deteriorated probably to a steppe under a cool and dry condition. It should be noted that this cool and dry climate started at ~4000 cal. yr BP in Qigai Nuur area may well correspond with the widely reported ‘4000 cal. yr BP Event’ by Perry and Hsu (2000) or the ‘Holocene Event 3’ by Bond et al. (2001) or ‘4.2 ka Event’ by others that was reported to have played an important role in the collapse of Neolithic cultures in northern China (Liu and Feng, 2012; Wu and Liu, 2004).
The period from ~2800 to ~850 cal. yr BP (i.e. Pollen Zone 5) is marked by high Pinus pollen percentage (40–95%) at the expense of broadleaved trees and some herbs with low pollen concentration. Pinus, the dominated pollen taxon in Pollen Zone 5, was widely reported to be by far over-represented in surface pollen spectrum (Li, 1998; Ma et al., 2004), thereby causing difficulty in its climatic interpretation. More specifically, in northern China and in Mongolia Pinus pollen percentage of surface samples can reach up to 55% with an average of 30% in the areas where no Pinus forest exists at all (Ma et al., 2004, 2008). We have investigated the over-representation issues of Pinus in the Qigai Nuur area where no Pinus forest exist. Our data from 30 surface samples show that Pinus pollen can reach up to 70% with an average of 35% (AZ Sun, unpublished data, 2004) and the Pinus pollen grains are basically airborne from the mountains that are ~200 km away from the lake (e.g. Daqing Mountains to the north, Helan Mountains to the west, and Luliang Mountains to the east; see Figure 1). It implies that Pinus-dominated coniferous forests in those mountains might have expanded considerably during the period from ~2800 to ~850 cal. yr BP under a significantly cooler climate and the Pinus pollen gains were then transported to the Qigai Nuur area. At the same time (i.e. from ~2800 to ~850 cal. yr BP), the Qigai Nuur area was poorly vegetated under a dry climate, as indicated by low pollen concentration and also by very low percentages of broadleaved trees and herbs. The pollen assemblages of late stage of the late Holocene (i.e. Pollen Zone 5; past ~850 years) were characterized by high percentages of Poaceae, Taraxacum-type, Cyperaceae and Chenopodiaceae pollen in the lower portion (i.e. Pollen Subzone 6-1; ~850–~450 cal. yr BP) and by high percentages of Artemisia, Plantago and Cupressaceae in the upper portion (i.e. Pollen Subzone 6-2; ~450–~0 cal. yr BP). The reconstructed MAT has a slight rising trend throughout Pollen Zone 6 (Figure 4) and the reconstructed MAP was slightly higher in the lower portion (i.e. ~850–~450 cal. yr BP) than in the upper portion (i.e. ~450–~0 cal. yr BP).
Comparison with regional palaeoclimate records
Shi et al. (1993) reported that the Holocene Megathermal (i.e. maximum temperature) Period occurred from ~9500 to ~3300 cal. yr BP in China and its climax (i.e. warmest period) was inferred to have occurred from ~8000 to ~6850 cal. yr BP. An et al (2000) reported the onset of the Megathermal Period was variously placed at 10,000–7500 14C yr BP and its end at 5000–2000 14C yr BP. Later, Feng et al. (2004) argued that the Holocene Megathermal Period was actually expressed as the Holocene Megahumid Period (i.e. maximum precipitation) in northern China and it spanned from ~10,000 to ~4000 cal. yr BP, with its climax (i.e. the wettest period) occurring from ~8400 to ~6000 cal. yr BP. The Holocene Megathermal Period or/and the Holocene Megahumid Period was later translated into the Holocene Maximum Strength Period of the East Asian Summer Monsoon (Herzschuh, 2006; Zhao et al., 2009b). The maximum strength period was inferred to have lasted from ~10,000 to ~3500 cal. yr BP by Herzschuh (2006), from ~11,000 to ~4000 cal. yr BP by Zhao et al. (2009b), and from ~7000 to ~4500 cal. yr BP by Wang et al., (2010).
Here, our attention will be directed to the timings of the Holocene Megahumid Period (i.e. maximum precipitation) along the summer monsoon margin in northern China by focusing on recently published pollen-based quantitative reconstructions (Figure 5). The Holocene Megahumid Period seems to be bracketed by ~6000 and ~4000 cal. yr BP with a secondary ‘Megahumid’ interval lasting from ~9200 to ~7400 cal. yr BP at Qigai Nuur (site 1 in Figure 1). At Lake Daihai (site 2 in Figure 1) to the northeast of Qigai Nuur, the quantitative reconstruction by Xu et al. (2010) was achieved by applying a transfer function to the data of 277 fossil pollen samples. The reconstruction shows that the Holocene Megahumid Period lasted from ~7500 to ~3500 cal. yr BP. At Lake Bayanchagan (site 3 in Figure 1) to the northeast of Lake Daihai, the quantitative reconstruction by Jiang et al. (2009) was achieved by PFT–MAT (i.e. PFT Modern Analogue Technique) to the data of 90 fossil pollen samples. The reconstructed MAT maximum (i.e. the Holocene Megathermal Period) occurred between ~10,500 and ~8000 cal. yr BP and the reconstructed MAP maximum (i.e. the Holocene Megahumid Period) occurred between ~10,500 and ~5500 cal. yr BP. At Lake Hulun (site 4 in Figure 1) to the northeast of Lake Bayanchagan, the quantitative reconstruction was achieved through applying their own transfer functions (Wen et al., 2010b) to the data of 170 fossil pollen samples. The Holocene Megahumid Period at Lake Hulun is bracketed by ~7500 and ~5000 cal. yr BP with a secondary ‘Megahumid’ interval lasting from ~3400 to ~1500 cal. yr BP.
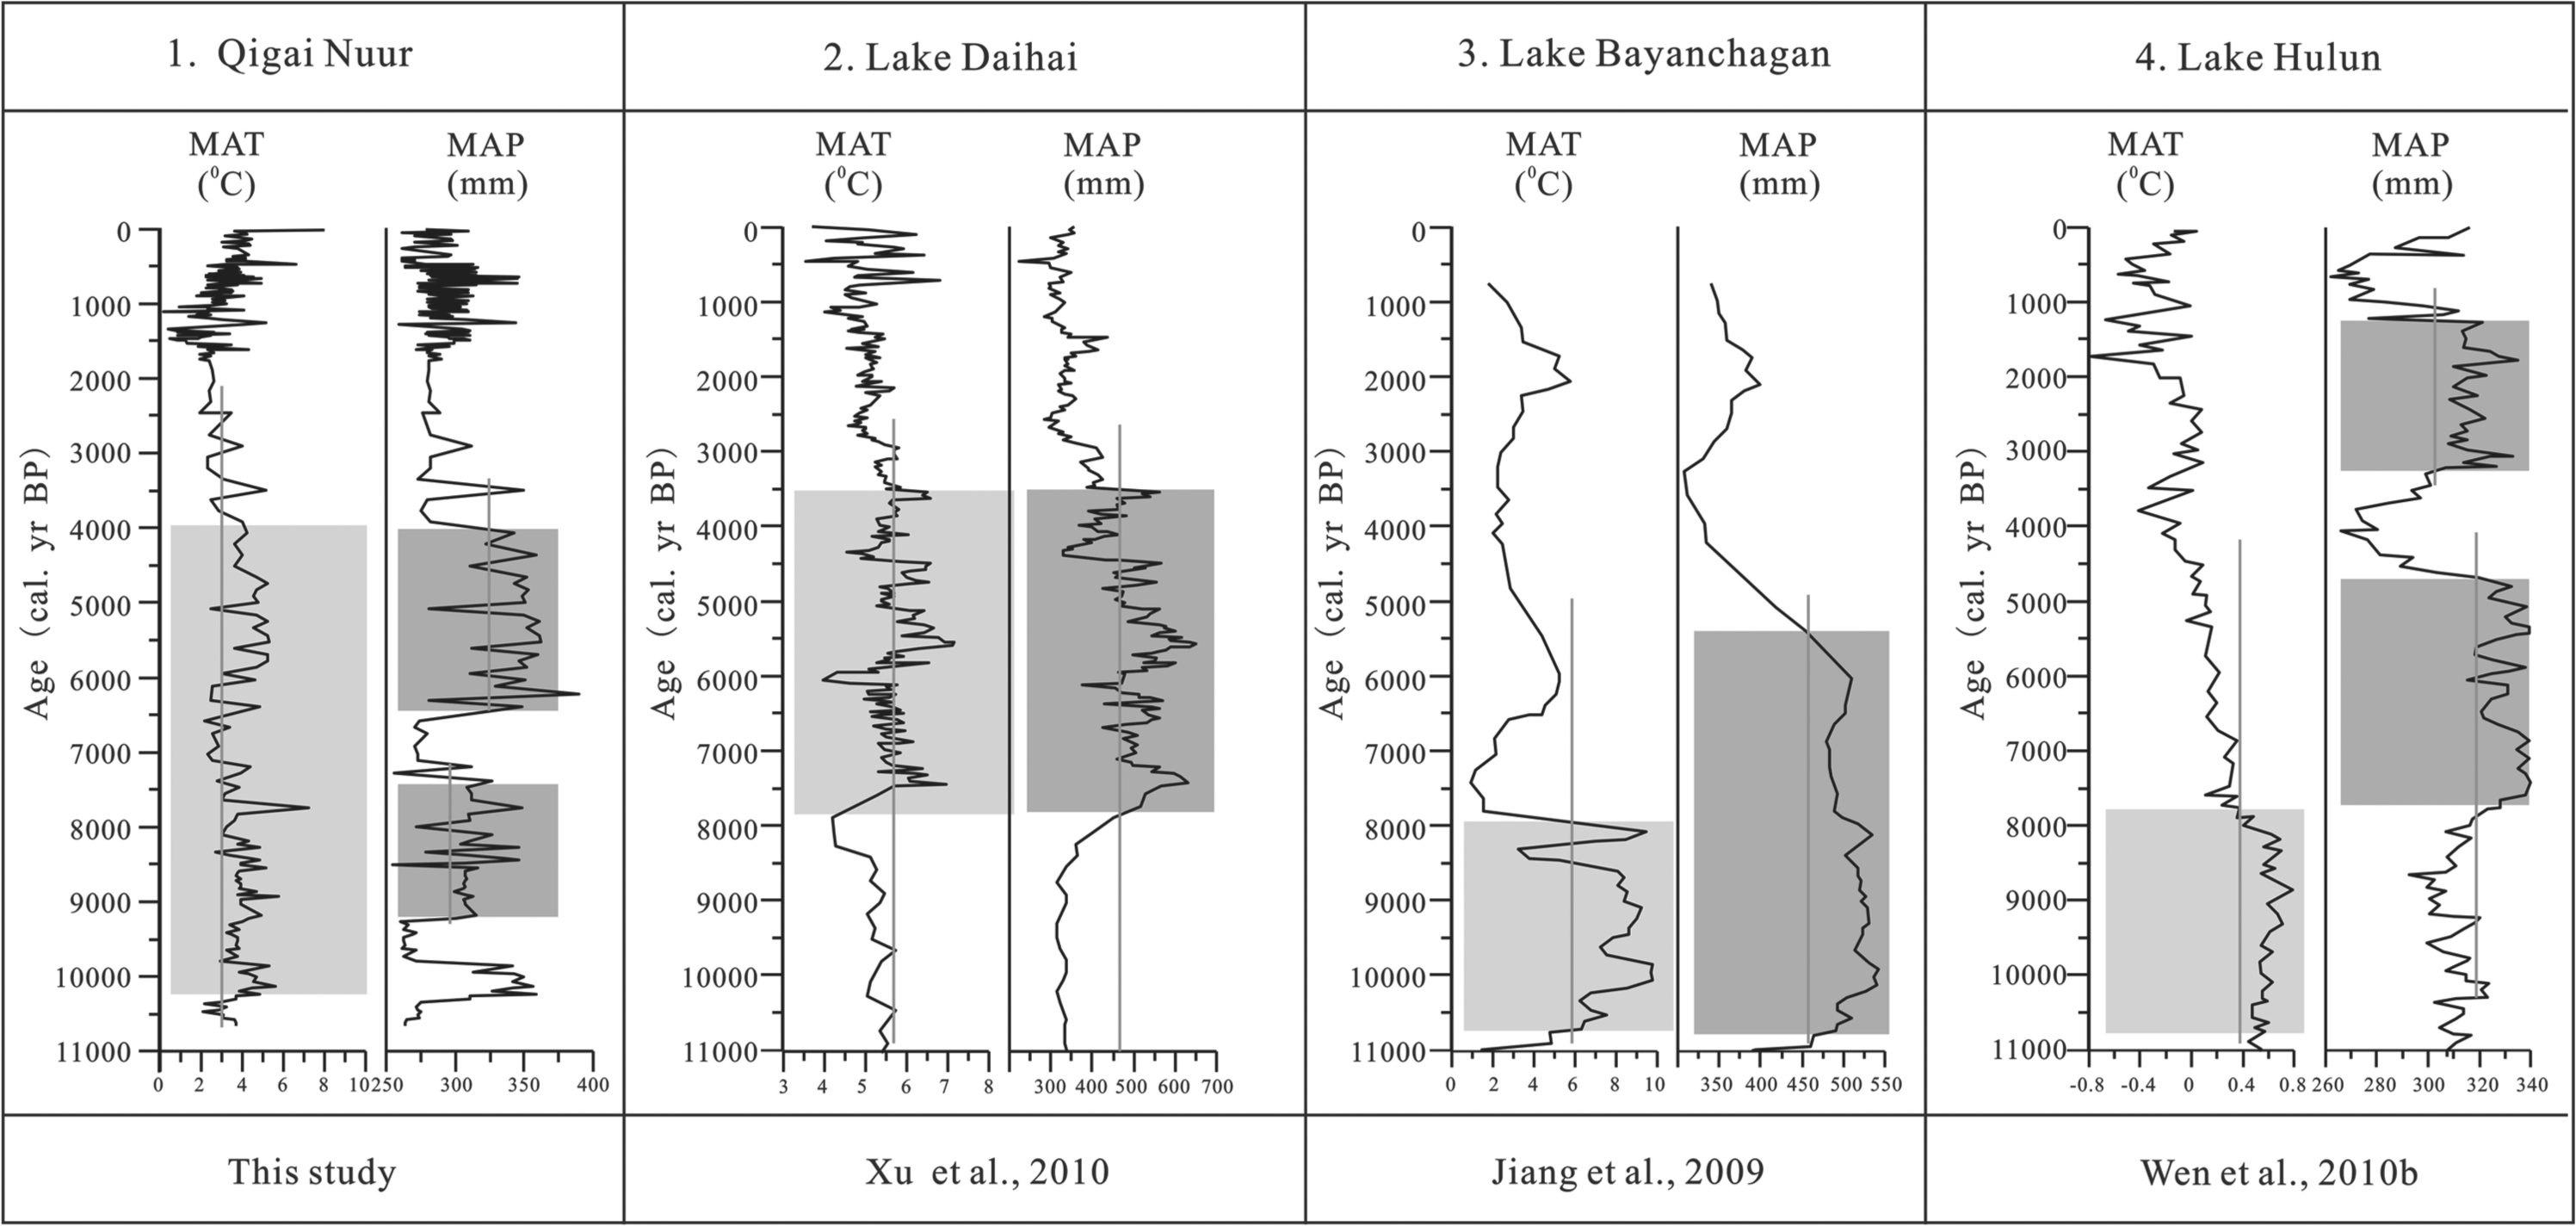
Comparison of the reconstructed MAT and MAP variations from Qigai Nuur core with those from Lake Daihai, Lake Bayanchagan and Lake Hulun. The light-shaded areas mark the time intervals of the Holocene Megathermal Period (i.e. high temperature). The dark-shaded areas indicate the time intervals of the Holocene Megahumid Period (i.e. high precipitation). The gray lines indicate the mean values of different stages.
Apparently, these four quantitative reconstructions failed to reach an agreement either on the compatibility between MAT and MAP (i.e. first group of controversies) or on the timing of the Holocene Megahumid Period (i.e. second group of controversies) or on the competitive relationship between precipitation and evaporation (i.e. third group of controversies). These large discrepancies or inconsistencies may be a result of chronology-related issues (e.g. dating targets, number of dates, methods for age–depth models, etc.) or/and methodology-related issues (e.g. three different methods used). Or, they may be ‘real’ expressions in different regions. But, our reconstruction is generally consistent with those widely accepted reconstructions of the East Asian summer monsoon strength from cave (e.g. Sanbo Cave in Figure 1a) stalagmites (e.g. Dong et al., 2010; Hu et al., 2008) and peat sequences (e.g. Hongyuan peat in Figure 1a) (Hong et al., 2003) in southern China. The consistency and the observed modern linkage between the monsoon strength in southern China and the climate in the monsoonal margin (Liu et al., 2008; Wang et al., 1981; Zhang and Li, 1994) are somewhat boosting our confidence on our reconstruction. In addition, the reconstructed MAP at the Qigai Nuur bears a great resemblance to the reconstructed sea surface temperature (SST) in the Western Tropical Pacific Ocean (see Stott et al., 2004) and the resemblance offers a reasonable explanation for the reconstructed MAP at Qigai Nuur (see section ‘Underlying mechanisms’). That is, our reconstruction from Qigai Nuur demonstrates that: (1) MAT and MAP have changed more or less synchronously, (2) the Holocene Megahumid Period occurred during the early and middle Holocene, that is, the wettest period occurred between ~6000 and ~4000 cal. yr BP and the secondary ‘Megahumid’ interval lasting from ~9200 to ~7400 cal. yr BP, and (3) strengthened monsoon under higher temperature may have brought more precipitation to the monsoonal margin, thus resulting in wetter climates. Of course, the discrepancies demand further studies.
Underlying mechanisms
Summer insolation in the Northern Hemisphere, as a major driver of the global temperature change, started to increase at ~20,000 cal. yr BP, reached a maximum at ~10,000 cal. yr BP and has been gradually declining since ~10,000 cal. yr BP (Figure 6; Kutzbach and Gallimore, 1988). The summer insolation trend has been closely followed by the reconstructed trend of the East Asian summer monsoon strength retrieved from Sanbao Cave in Hubei Province of southern China (Figure 6) and the causal linkage between the summer insolation and the East Asian monsoon strength have been extensively and intensively explored (see An et al., 2000; Feng et al., 2006; Koutavas et al., 2002; Kutzbach and Gallimore, 1988; Kutzbach and Liu, 1997; Shi et al., 1993). The reconstructed MAT at Qigai Nuur situated at the East Asian summer monsoonal margin should have been controlled or modulated by the East Asian summer monsoon strength during the Holocene and it is thus not surprising to see the similar trends between the MAT at Qigai Nuur and the monsoon strength at Sanbo Cave. The well-expressed broad similarities imply that the first-order Holocene variations in MAP of Qigai Nuur area should have been responding to the summer insolation with some time lags resulting from the ‘oceanic buffering effect’. The oceanic buffering effect means that low-latitude oceans were gradually and sufficiently warmed from the peak insolation period (~10,000–~9000 cal. yr BP) to the Holocene Climatic Optimum (approximately from 9000 to 6000 cal. yr BP) so that the enhanced evaporation effectively injected more water vapor into the East Asian Monsoon system (see Feng et al., 2006). The first-order variations in reconstructed MAP were most likely resulted from the summer insolation-dictated Inter-Tropical Convergence Zone (ITCZ) positioning. That is, northward shift (i.e. wetting) or southward shift (i.e. drying) determined the general strength of the East Asian monsoon (An et al., 2000; Chiang and Kushnir, 2000). However, more detailed or second-order variations in the reconstructed MAP at Qigai Nuur resemble those in the reconstructed sea surface temperature (SST) in the Western Tropical Pacific Ocean (site MD81, 5°N, 127°E, see Figure 1a) and the resemblance implies that the MAP variations in Qigai Nuur area might have been tightly modulated by the SST in the Western Tropical Pacific during the Holocene (Stott et al., 2004). Specifically, the Q1-labeled segment in the reconstructed MAP at Qigai Nuur covering the period from ~10,300 to ~4000 cal. yr BP corresponds with W1-labeled segment in the reconstructed Western Tropical Pacific SST from ~11,000 to ~4400 cal. yr BP with some time lags; the Q2-labeled segment of MAP with W2-labeled segment of SST; and the Q3-labeled segment of MAP with W3-labeled segment of SST. That is, higher MAP in the East Asian monsoonal margin has most likely resulted from higher SST in the Western Tropical Pacific. The causal linkage between the MAP and the SST might have been established via the SST influence on the East Asian summer monsoon strength and the variations in the SST in the Western Tropical Pacific was most likely modulated by the El Niño-Southern Oscillation (ENSO) dynamics (Higginson et al., 2004; Ju and Slingo, 2006). That is, more frequent ENSO activities brought more warm water to the Eastern Tropical Pacific (i.e. American side) and thus resulted in lower SST in the Western Tropical Pacific, leading to less water vapor transported to the East Asian monsoon margin where Qigai Nuur is situated.
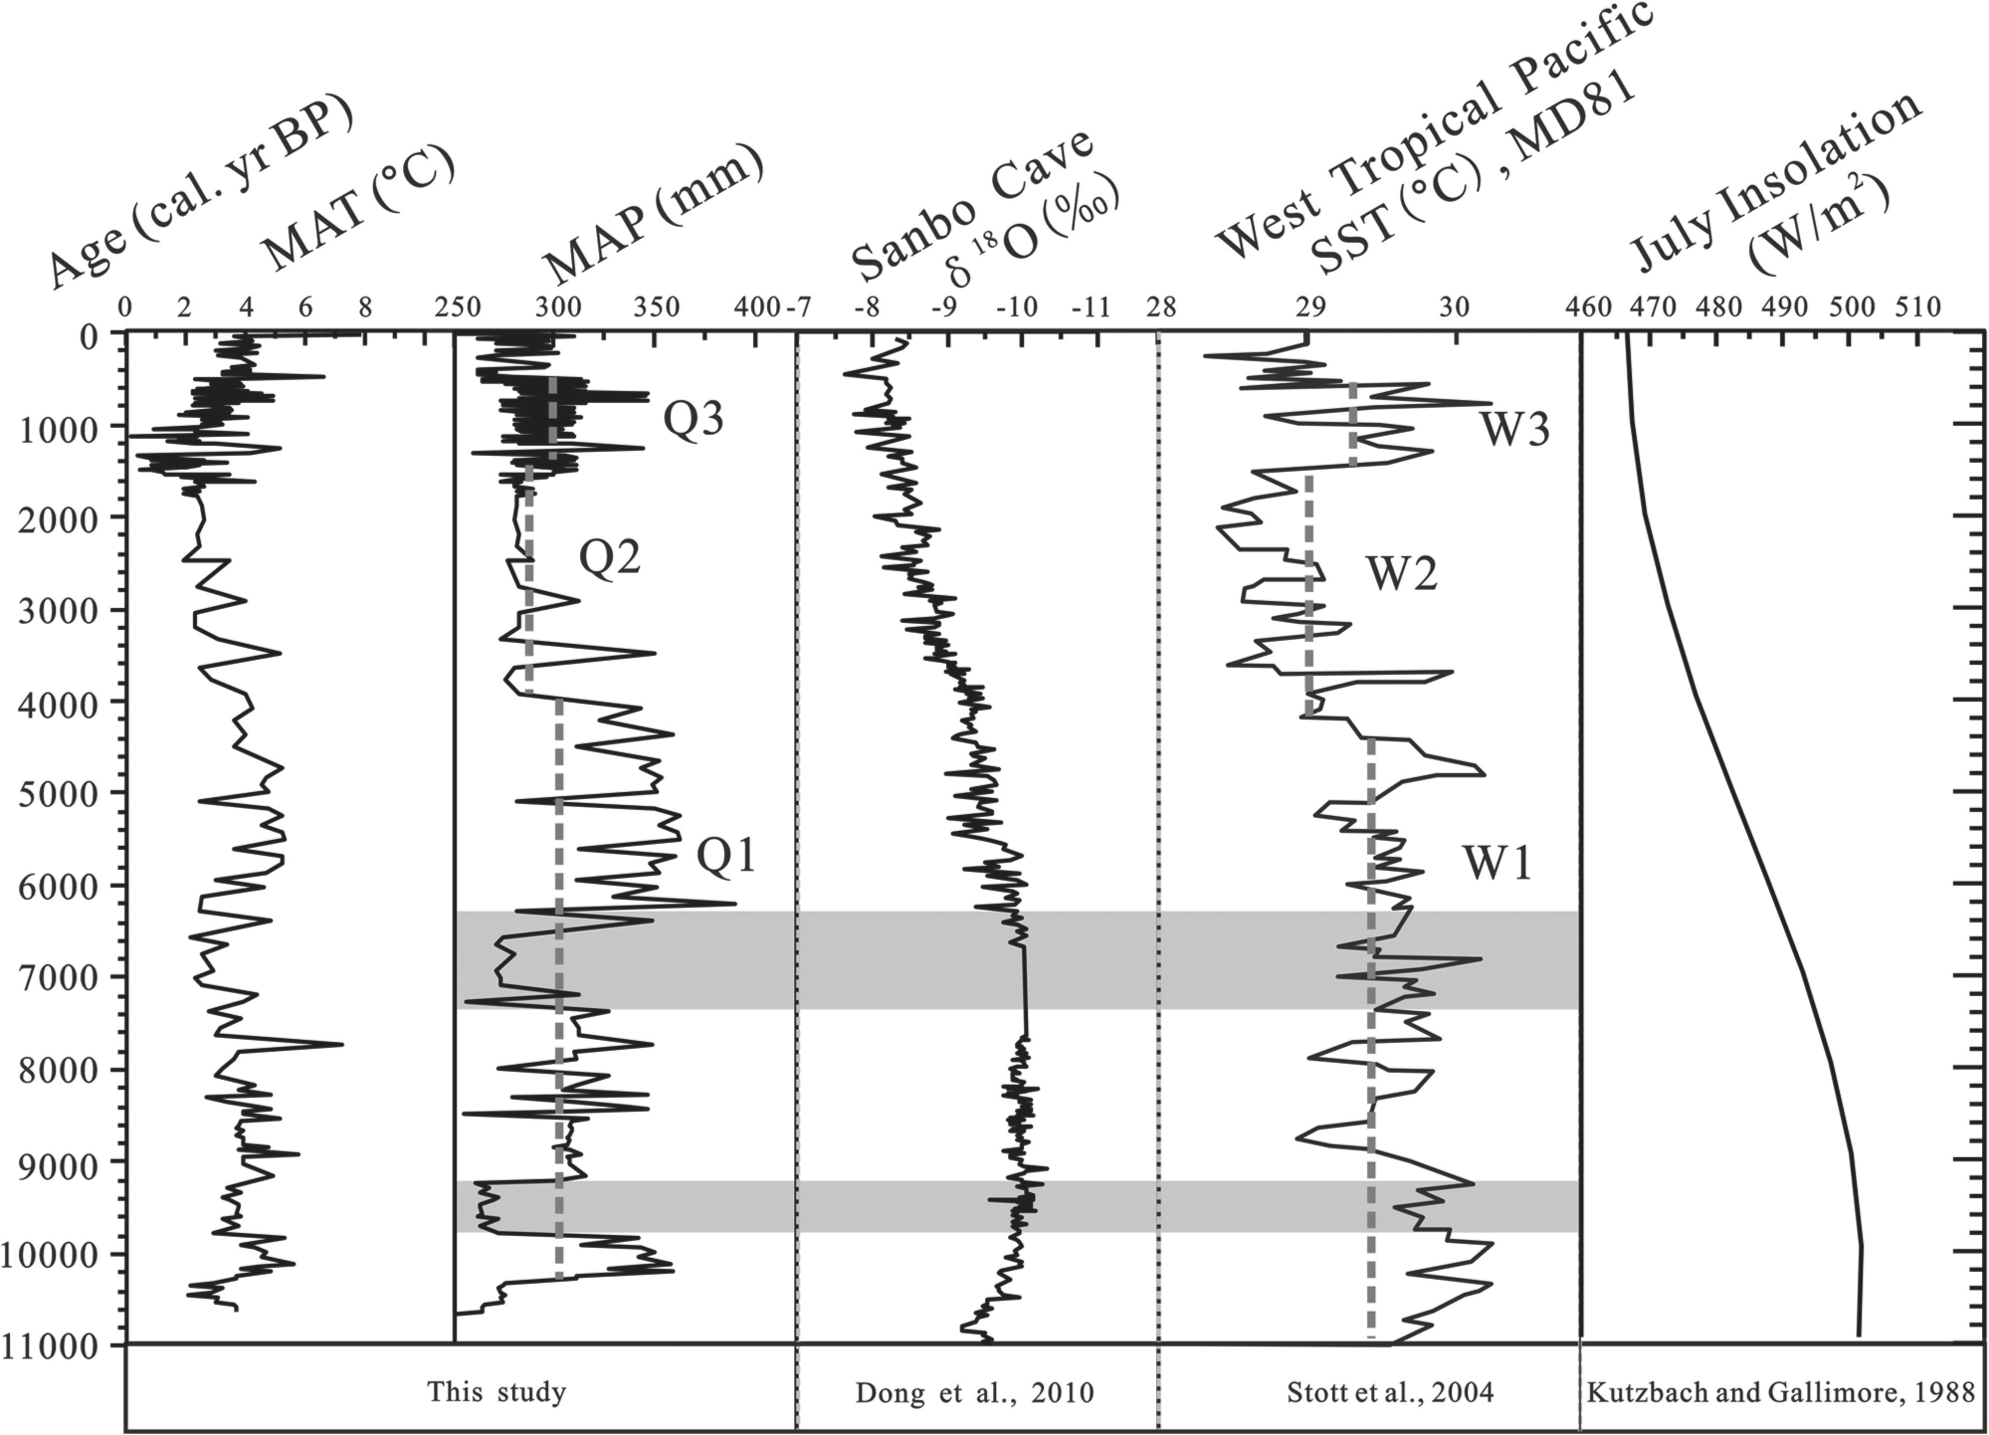
Comparison of the reconstructed MAT and MAP variations from Qigai Nuur with δ18O of Sanbo Cave stalagmite, sea surface temperature (SST) of the Western Tropical Pacific Ocean (site MD81, 5°N, 127°E), and July insolation at 25°N. The dashed lines show the mean values of different stages. The light-shaded areas mark the time intervals of two major dry intervals during the early and middle Holocene.
Finally, we are encountering difficulties in explaining two major dramatically dry intervals that are well defined by pollen data and other proxy data (e.g. organic matter content and grain size). The first such interval occurred between ~9800 and ~9200 cal. yr BP and the second one occurred between ~7400 and ~6000 cal. yr BP. These two dry intervals chronologically correspond with relatively high SST intervals in the Western Tropical Pacific (Figure 6). Admittedly, we are not yet able to offer a reasonable explanation for these two ‘oddly’ dry events.
Conclusions
Fossil pollen data at Qigai Nuur in the southern Mongolian Plateau show that regional vegetation changed dramatically between steppe forest and dry steppe during the period from ~10,700 to 9200 cal. yr BP. The vegetation was then dominated by steppe-forest from ~9200 to ~2800 cal. yr BP and then deteriorated to dry steppe vegetation between ~2800 and ~850 cal. yr BP. During the past ~850 years, the vegetation was characterized by high percentages of various herbs. PFT–MAT quantitative reconstruction revealed that the climate changed in three steps before ~9200 cal. yr BP: (1) cold and dry from ~10,700 to ~10,300 cal. yr BP, (2) considerably warm and significantly wet from ~10,300 to ~9800 cal. yr BP, and (3) slightly cool and dramatically dry between ~9800 and ~9200 cal. yr BP. From ~9200 to ~2800 cal. yr BP, the climate was generally warm and wet with two cold and dry intervals at ~7400–~6000 cal. yr BP and at ~4000–~2800 cal. yr BP. The climate was cooler and slightly drier from ~2800 to ~1400 cal. yr BP and has been characterized by rising temperature and fluctuating precipitation during the last ~1400 years. Our reconstructions demonstrate that: (1) temperature and precipitation have changed more or less synchronously, (2) the Holocene Megathermal Period occurred during the early and middle Holocene, (3) the first-order variations in the reconstructed MAP were most likely a result of summer insolation-dictated ITCZ positioning (i.e. N–S shifts), and (4) the second-order variation in the reconstructed MAP was most likely modulated by the ENSO dynamics (i.e. E–W shifts).
Finally, we want to add that two indices we defined in this paper appear to work reasonably. The curve of pollen percentage ratio between broadleaved tree and coniferous tree (Br/Co ratio) parallels the general trend of the reconstructed MAT and the curve of pollen percentage ratio of Artemisia (A) to the combined Ephedra and Nitraria (E+N) (A/(E+N)) shows a similar trend with the reconstructed MAP, suggesting that these two pollen indices are useful for estimating MAT and MAP.
Footnotes
Acknowledgements
We are indebted to Professor Yuzhen Ma, Professor Chengjun Zhang, Dr Xinwei Zhai, Dr Huining Wu, Dr Wei Wang, Dr Qili Yang and Ms Yixin Hu for their help during coring in the field and for core slicing (sampling) in the laboratory of Lanzhou University. Thanks also go to Professor ZC Yu and two anonymous reviewers for their valuable comments and suggestions on paper structure and some minor modifications.
Funding
This study was financially supported by several NSFC grants (No. 40930120, No. 41002058, No. 41172332, No. 40331012, No. 40421101) and two US NSF grants (NSF-ESH-04-02509, NSF-BSC-06-52304).