



Abstract
Accurate chronologies are fundamental for detailed analysis of palaeoenvironmental conditions, archaeological reconstructions and investigations of Holocene coastal morphological changes. Chronological data enable estimation of rates of shoreline progradation, and provide appropriate context for forecasting future coastal changes. A previously reported radiocarbon chronology for the Moruya coastal plain in south-eastern Australia indicated a decelerating overall rate of progradation with minimal net seaward shoreline movement in the past ~2500 years. Single-grain and multi-grain aliquot optically stimulated luminescence (OSL) analyses demonstrate that marine sands from this region have excellent luminescence characteristics. A series of OSL ages across this coastal barrier indicates a remarkably linear trend of Holocene shoreline progradation. The linear trend of seaward shoreline movement indicates that the barrier has grown at an average rate of 0.27 m/yr with successive ridge formation every ~110 years. The oldest ridge on the barrier appears to correspond to cessation of rapid post-glacial sea-level rise, and the large foredune at the seaward margin of the barrier is <400 years old. The contrast between the existing radiocarbon chronology and the OSL ages reported in this study implies the need for a more cautious interpretation of coastal barrier chronologies, in Australia and around the world, where they have been based on radiocarbon dating of shell hash.
Keywords
Introduction
Geomorphological and geochronological studies of prograded barriers, also called strandplains, provide important long-term evolutionary context within which to view present-day patterns of coastal behaviour and are likely to be relevant for understanding how these coasts will respond in the future (Woodroffe et al., 2014). The origins and definitions of beach-ridge plains have been widely debated (see Davies, 1957; Hesp, 2006; Otvos, 2000). Some studies have used prograded barriers as potential repositories of palaeoenvironmental data, such as past sea levels (Dougherty, 2014; Van Heteren et al., 2000), sediment delivery patterns (Tamura, 2012) and storm records (Buynevich et al., 2007). Such studies require robust chronological data to enable accurate reconstructions.
Radiocarbon-based chronological reconstruction of coastal barriers has been used by many researchers around the world (Bernard and LeBlanc, 1965; Curray et al., 1969; Hayes, 1994; Timmons et al., 2010). Many Holocene coastal depositional reconstructions have used radiocarbon dating of shell material included in shoreface sediment facies (Moslow and Heron, 1981; Nummendal, 1983). In south-eastern Australia, radiocarbon dates have provided the basis for chronological interpretation of Quaternary sea-level changes (Lewis et al., 2013; Murray-Wallace and Woodroffe, 2014; Sloss et al., 2007). Dating of shell from sedimentary facies has enabled the reconstruction of past patterns of sediment accumulation and formed the basis for detailed models of coastal barrier evolution (Chapman et al., 1992; Roy et al., 1994; Thom, 1983). Studies of several prograded barriers along the southern coast of New South Wales (NSW) have used radiocarbon dating of shell material to estimate rates of progradation (Roy et al., 1980, 1994). Some imply built out at a constant rate, for example, Wonboyn in southern NSW, whereas the barrier at Moruya displays a decelerating rate of shoreline progradation (Thom et al., 1981a). Despite apparent ‘noise’, an overall age model is evident at different sites along the NSW coastline (Roy et al., 1994; Thom et al., 1981a).
The prograded barrier at Moruya, comprising a sequence of relict foredune ridges backing Bengello Beach, has been a particularly important site because its radiocarbon chronology has provided detailed evidence of coastal behaviour over the past 6 millennia (Thom et al., 1981a). In addition to this long-term record of barrier evolution through the Holocene, detailed beach profiling at this site, conducted since 1972, documents storm erosion and recovery over the past four decades (McLean and Shen, 2006; Thom and Hall, 1991). Conceptual models and subsequent computer simulation models have been developed, based on these studies, and have provided baseline data for informing coastal management at other sites (Stive et al., 2009). The central radiocarbon dating transect at Moruya has been particularly important for modelling shoreface sand delivery (Cowell et al., 2000) and has been utilised in the development of models of coastal change (Daley, 2012; Kinsela, 2014).
In order to understand barrier progradation patterns, it is first necessary to consider the morphological characteristics of each site and to resolve several problems often encountered when attempting to establish accurate geomorphological chronologies based on radiocarbon dating. Two major concerns have been identified in south-eastern Australia. First, there have been concerns about overestimation of ages due to the reworking of shell material within the nearshore environment (Nielsen and Roy, 1981), coupled with uncertainty in calibration of radiocarbon years to sidereal years. For Moruya, this uncertainty is exacerbated by the dating of ‘shell hash’ rather than intact portions of shell material (Thom et al., 1981b).
A second concern when inferring rates of progradation of the relict foredunes at Moruya, based on radiocarbon dating, is that the samples dated came from nearshore shelly sand (commonly 10–30 m below the surface of the barrier) rather than the upper quartz-rich dune sand (Thom et al., 1981b). This means that interpreted isochrons, from age estimations deeper within the barrier profile, have been used to estimate the ages of features at the surface and for calculation of rates of sediment accumulation over the Holocene. The validity of the ridge chronology is, therefore, dependent on the accuracy of the interpreted isochrons from estimated ages within the shoreface sand, an issue that was recognised by Thom et al. (1981b). Reconstruction of the evolving shoreface geometry would assist in a more reliable isochron interpretation of progradation history. Roy et al. (1994) demonstrated the potential of imaging beachface geometry using ground penetrating radar (GPR) to model progradation of the upper shoreface at Tuncurry, NSW. Similarly, at Guichen Bay, South Australia, GPR has been used to delineate beachfaces and morphostratigraphic relationships within the barrier sequence (Bristow and Pucillo, 2006). Preliminary comparison of an optically stimulated luminescence (OSL) and radiocarbon ridge sequence chronology has previously been attempted for these mixed quartz–carbonate sand ridges at Guichen Bay (Murray-Wallace et al., 2002). This study used OSL to estimate the time of deposition of the upper metre of individual sand ridges at Moruya, to provide a revised chronology for past shoreline positions over the Holocene.
Regional context and past studies
The Moruya coastal plain is a Holocene prograded barrier on the tectonically stable coast of NSW, approximately 240 km south of Sydney (Figure 1). The plain, spanning a maximum width of almost 2 km, consists of ~60 relict foredune ridges (Figure 1) which are low relief (1–2 m crest to swale), laterally persistent features comprising a composite of regressive beach sands with an aeolian capping (Figure 2; Thom and Roy, 1985). Behind the ridge series lie a number of freshwater swamps, the largest of which, Waldrons Swamp, still connects to the ocean via a narrow channel (Figure 1). The Palaeozoic bedrock backing and underlying the site is a turbidite sequence comprising siltstone, claystone, sandstone, quartzite and chert (Rose, 1966). At the southern end of the barrier, the Moruya River (upstream named the Deua River) connects to the ocean through breakwalls which were completed in 1954.
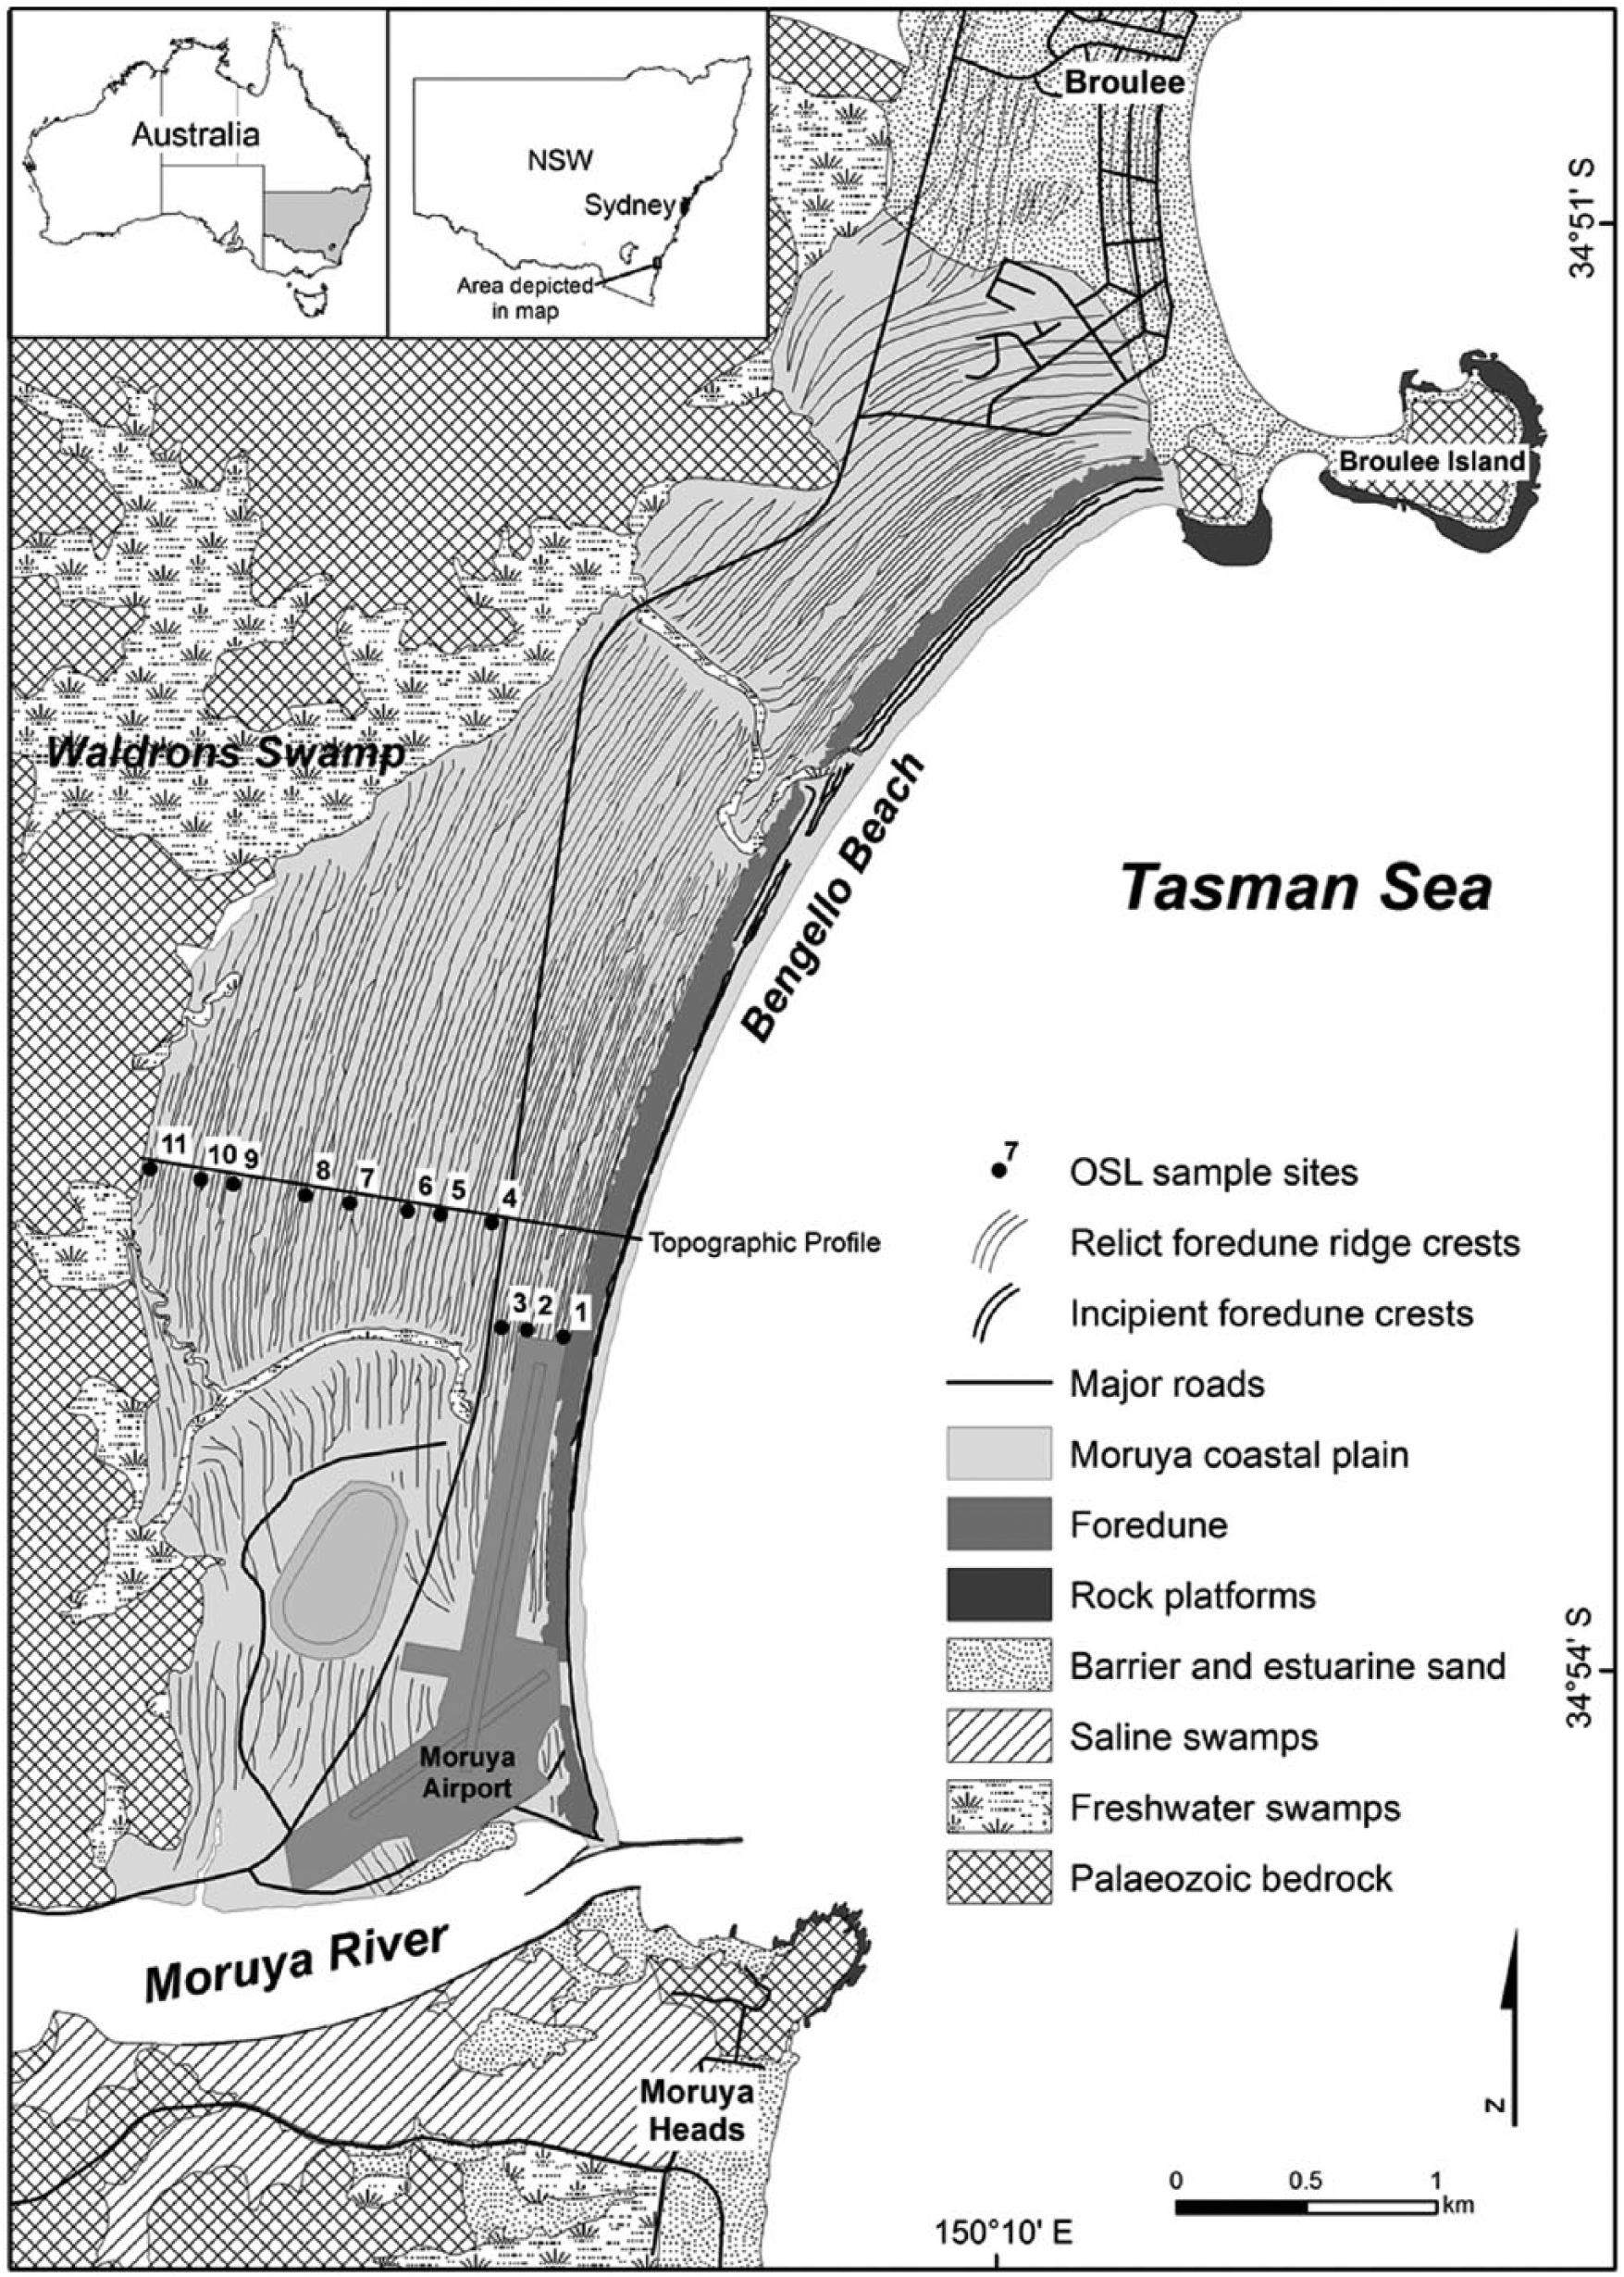
Location of the prograded barrier at Moruya showing the Holocene embayment fill. Ridge crests have been derived from high-resolution LiDAR (© Land and Property Information, NSW) and show the progradation pattern with the modern foredune reaching a higher elevation along the seaward margin of the plain. The freshwater swamps behind the barrier as well as the truncated Palaeozoic bedrock are shown.

A comparison between the published radiocarbon chronology and associated facies model according to Thom et al. (1981b) and the OSL age estimates presented in this study. The topographic barrier profile is extracted from LiDAR data (© Land and Property Information, NSW) acquired for this region in 2012 and was taken adjacent to the OSL sampling sites which is in the central portion of the barrier (see Figure 1). * refers to age estimates determined using single-grain OSL techniques.
Details of the ridge sequence at Moruya were first described by Thom et al. (1978) who undertook topographic surveying to document the morphology and drilling to extract sediments for stratigraphic and age reconstructions. The stratigraphy of the Holocene infill comprises a series of facies shown in Figure 2. The uppermost ‘beach-ridge and dune sand’ overlies ‘nearshore shelly sand’, under which is a shelly sand with gravel layer interpreted as an early Holocene transgressive unit; an estuarine clay and organic mud layer occurs at the base of the sequence (Thom et al., 1981b). Samples for radiocarbon dating were collected from the ‘nearshore shelly sand’ as identified in cores and distinct from the overlying ‘beach-ridge and dune sand’ (Thom et al., 1981b).
Radiocarbon dating was carried out in laboratories at Sydney University and the Australian National University, with results published in a series of papers and reports which explored the Holocene evolution of this part of the Australian coastline (Polach et al., 1979; Roy and Thom, 1981; Thom, 1983; Thom et al., 1981b). The resulting age model placed the commencement of barrier progradation at ~6500 cal. yr BP (calibrated ages are corrected for marine reservoir effects), with progradation culminating around ~3000–2500 cal. yr BP. The overall rate of progradation was considered to have decelerated after ~5000 cal. yr BP (Roy et al., 1994), interpreted as a decreasing volume of sand supplied from the shoreface (Cowell et al., 2000). This decrease in sand supply is thought to have been caused either by the shoreface progressing towards equilibrium or due to bed armouring by a surface lag deposit on the lower shoreface (Cowell et al., 2000). Soils along the central Moruya transect were investigated by Bowman (1989) who observed good agreement between soil characteristics and the radiocarbon-based age model.
The large foredune adjacent to the modern beach is approximately twice the height of landward ridges for most of its length. While the published radiocarbon chronology for the central transect indicated that progradation ceased around 3000–2500 cal. yr BP, a charcoal sample from the large foredune close to the northern transect gave an age of 720 ± 270 cal. yr BP (Thom et al., 1981b) recalibrated according to Stuiver and Reimer (1993). This age aligns closely with the radiocarbon chronology for the northern transect where a date of ~1000 cal. yr BP was recorded beneath the large foredune (Thom et al., 1981b). This disparity between transects is reflected in the progradation rates for Moruya in Figure 4.18 in Roy et al. (1994) and was also highlighted by Thom et al. (1981a).
Luminescence dating of coastal facies
OSL dating is a method that can be used for determining the elapsed time since quartz grains were exposed to sunlight and subsequently buried (Aitken, 1998; Huntley et al., 1985). Upon exposure to sunlight, electrons are released from traps in the crystal lattice of the mineral grains and the latent OSL signal is reset. During burial, grains are exposed to ionising radiation from cosmic rays and the decay of 238U, 235U, 232Th (and their daughter products), 40K and 87Rb in the surrounding sediment. Consequently, charge accumulates in traps within the crystal lattice of luminescent grains at a rate that is proportional to the flux of cosmic rays and ionising radiation in the surrounding environment (i.e. the environmental dose rate). When the grain is stimulated with light in the laboratory, the stored energy is released and photons (i.e. OSL) are emitted, which can be measured and used to calculate the equivalent dose (De) absorbed by the grain since burial. The burial age is then calculated by dividing the De (Gy) by the dose rate (Gy/ka).
OSL dating of coastal barriers and relict foredune ridge plains has been successful at many locations globally (Choi et al., 2014; Jacobs, 2008; Mallinson et al., 2008; Nielsen et al., 2006; Reimann et al., 2010, 2011; Rendell et al., 2007; Rink and Forrest, 2005; Rink and López, 2010; Roberts and Plater, 2007). These studies demonstrate the applicability and success of this technique for dating coastal sediments and encourage its application for similar locations.
OSL has also been used successfully to date relict foredune ridge plains in Australia since the early 2000s (Brooke et al., 2008a, 2008b; Forsyth et al., 2010, 2012; Goodwin et al., 2006; Murray-Wallace et al., 2002; Nott et al., 2009). These studies have focused on northern NSW and Queensland, with the exception of Guichen Bay in South Australia. Broader scale patterns of Holocene infill and rates of shoreline progradation have also been examined (Brooke et al., 2008a; Goodwin et al., 2006).
Only in the case of the Guichen Bay ridge sequence has there been a direct comparison between OSL and radiocarbon chronologies across a prograded barrier. The OSL ridge chronology determined at Guichen Bay has been interpreted to indicate broad accordance between OSL and radiocarbon (Murray-Wallace et al., 2002), although there are disparities of more than a thousand years between OSL and radiocarbon age estimates at the rear of the plain (Tamura, 2012). This disparity may be partially explained by the presence of a late Pleistocene carbonate aeolian sand component eroded from the Robe and Woakwine Ranges surrounding Guichen Bay within the barrier infill sediment (Murray-Wallace et al., 2002). Radiocarbon dating is particularly suited to calcareous ridge plains, such as Guichen Bay, where biogenic carbonate material is being actively produced in the nearshore environment and reworked into the beachface facies (hence reasonable agreement of OSL and radiocarbon ages in the seaward portion of the barrier) but is not ideal for carbonate-poor sites such as Moruya, where deeper cores were required to recover shell fragments from the nearshore facies.
Methods
Radiocarbon recalibration and reporting
The radiocarbon ages reported by Thom et al. (1981b) were calibrated to sidereal years according to the procedure of Stuiver and Reimer (1993) using CALIB 7.0.2. A Delta R of 11 ± 85 years was adopted for this calibration based on studies by Gillespie and Polach (1979) who collected and analysed modern shell material from the south-eastern coastline of NSW. All radiocarbon ages are reported in calibrated years before present and rounded to the nearest 10 years. It should be noted that all radiocarbon ages represent years before 1950 (Gillespie, 1984), so there is a 63-year offset between radiocarbon and OSL ages.
Light detection and ranging analysis
Airborne light detection and ranging (LiDAR), flown in 2012 by the NSW Government (Land and Property Information), was acquired in order to better understand barrier morphology. A digital elevation model (DEM) of the ground surface was produced using the triangular irregular network (TIN) method in ArcGIS 10.1. Relict foredune ridge crests and geomorphic unit boundaries were digitised from this DEM with the aid of georectified aerial photography. Field inspection involving ridge crest counting along shore-normal transects indicated good agreement between the DEM and the location of ridge crests. Real-time kinematic GPS measurements provided additional ground truthing of ridge crest locations, except where impeded due to dense vegetation over much of the western barrier complex.
OSL
In all, 11 samples of undisturbed aeolian facies (>80% quartz) were collected for OSL dating between 70 and 100 cm depth within the relict foredune ridges in 2012 and 2013. Cores were extracted by auguring to a depth of 70 cm with a 100-mm-diameter sand auger head. After this, a 1-m-long opaque PVC pipe section, 50 mm in diameter, was hammered until flush with the surface of the ground collecting 30 cm of sample within the base of the tube. A void space was created adjacent to the PVC tube with a smaller 50-mm sand auger to a depth of 1 m. The core tube was then easily removed utilising this void space beneath light-impenetrable black plastic. This approach ensured preservation of light-safe grains that were not exposed to sunlight during recovery. Cores were capped and wrapped in black plastic in the field and then stored in a refrigerated cold storage laboratory until opened under light-safe conditions. Table 1 lists sample names and numbers, with samples listed by their geographic position from east to west.
OSL ages for relict foredune ridges across the Moruya Barrier, NSW. The samples are ordered according to sample position with respect to the ocean, so that the first sample listed in the table corresponds to the sample closest to the shore. All samples include an internal dose rate contribution of 0.03 ± Gy/ka assumed based on measurements made on Australian quartz (Bowler et al., 2003).

The beta and gamma dose rates for these samples were measured directly in the laboratory with GM-25-5 beta counting and thick source alpha counting. The other samples were measured with ICP-MS (U and Th) and ICP-OES (K).
All samples were prepared using standard laboratory techniques (Wintle, 1997) to isolate the 180- to 212-µm grain size fraction of quartz. Under dim red-light conditions, the top and bottom 4 cm of material was extracted and used to estimate the environmental dose rate for each sample and gives an indication of in situ water content. The light-safe grains were wet sieved to isolate the 180- to 212-µm grain size fraction and then treated with 15% HCl to remove carbonates and 15% H2O2 to remove any organic material. Each sample was then put through two iterations of sodium polytungstate separation at densities of 2.7 and 2.62 to remove heavy minerals and feldspars, respectively. The pure quartz samples were etched with a 40% HF solution for 45 min to remove any remaining feldspars and the outer 5–10 µm of quartz grains. Each sample was then dried at 50°C in an oven and dry sieved to remove any grains outside the 180- to 212-µm size fraction. Single-quartz grains and multi-grain aliquots were loaded into a Risø TL/OSL reader and were stimulated, measured and irradiated as reported by Gliganic et al. (2012a, 2012b).
De values were estimated using a modified single-aliquot regenerative-dose (SAR) procedure (Murray and Wintle, 2000). To ensure the suitability of the SAR procedure for each single- and multi-grain aliquot, standard tests were applied, including a recycling ratio test, recuperation test (Murray and Wintle, 2000) and OSL-IR depletion ratio test (Duller, 2003). Appropriate regenerative and test dose preheat combinations were determined using preheat plateau (Aitken, 1998) and dose recovery experiments (Murray and Wintle, 2003; Roberts et al., 1999). Eight preheat combinations were assessed using preheat plateau experiments (Figure 3a), and two of these combinations were subsequently assessed using dose recovery experiments (Figure 3b). The latter experiment also serves to assess the suitability of the SAR procedure and to aid accurate test dose determination for these samples.
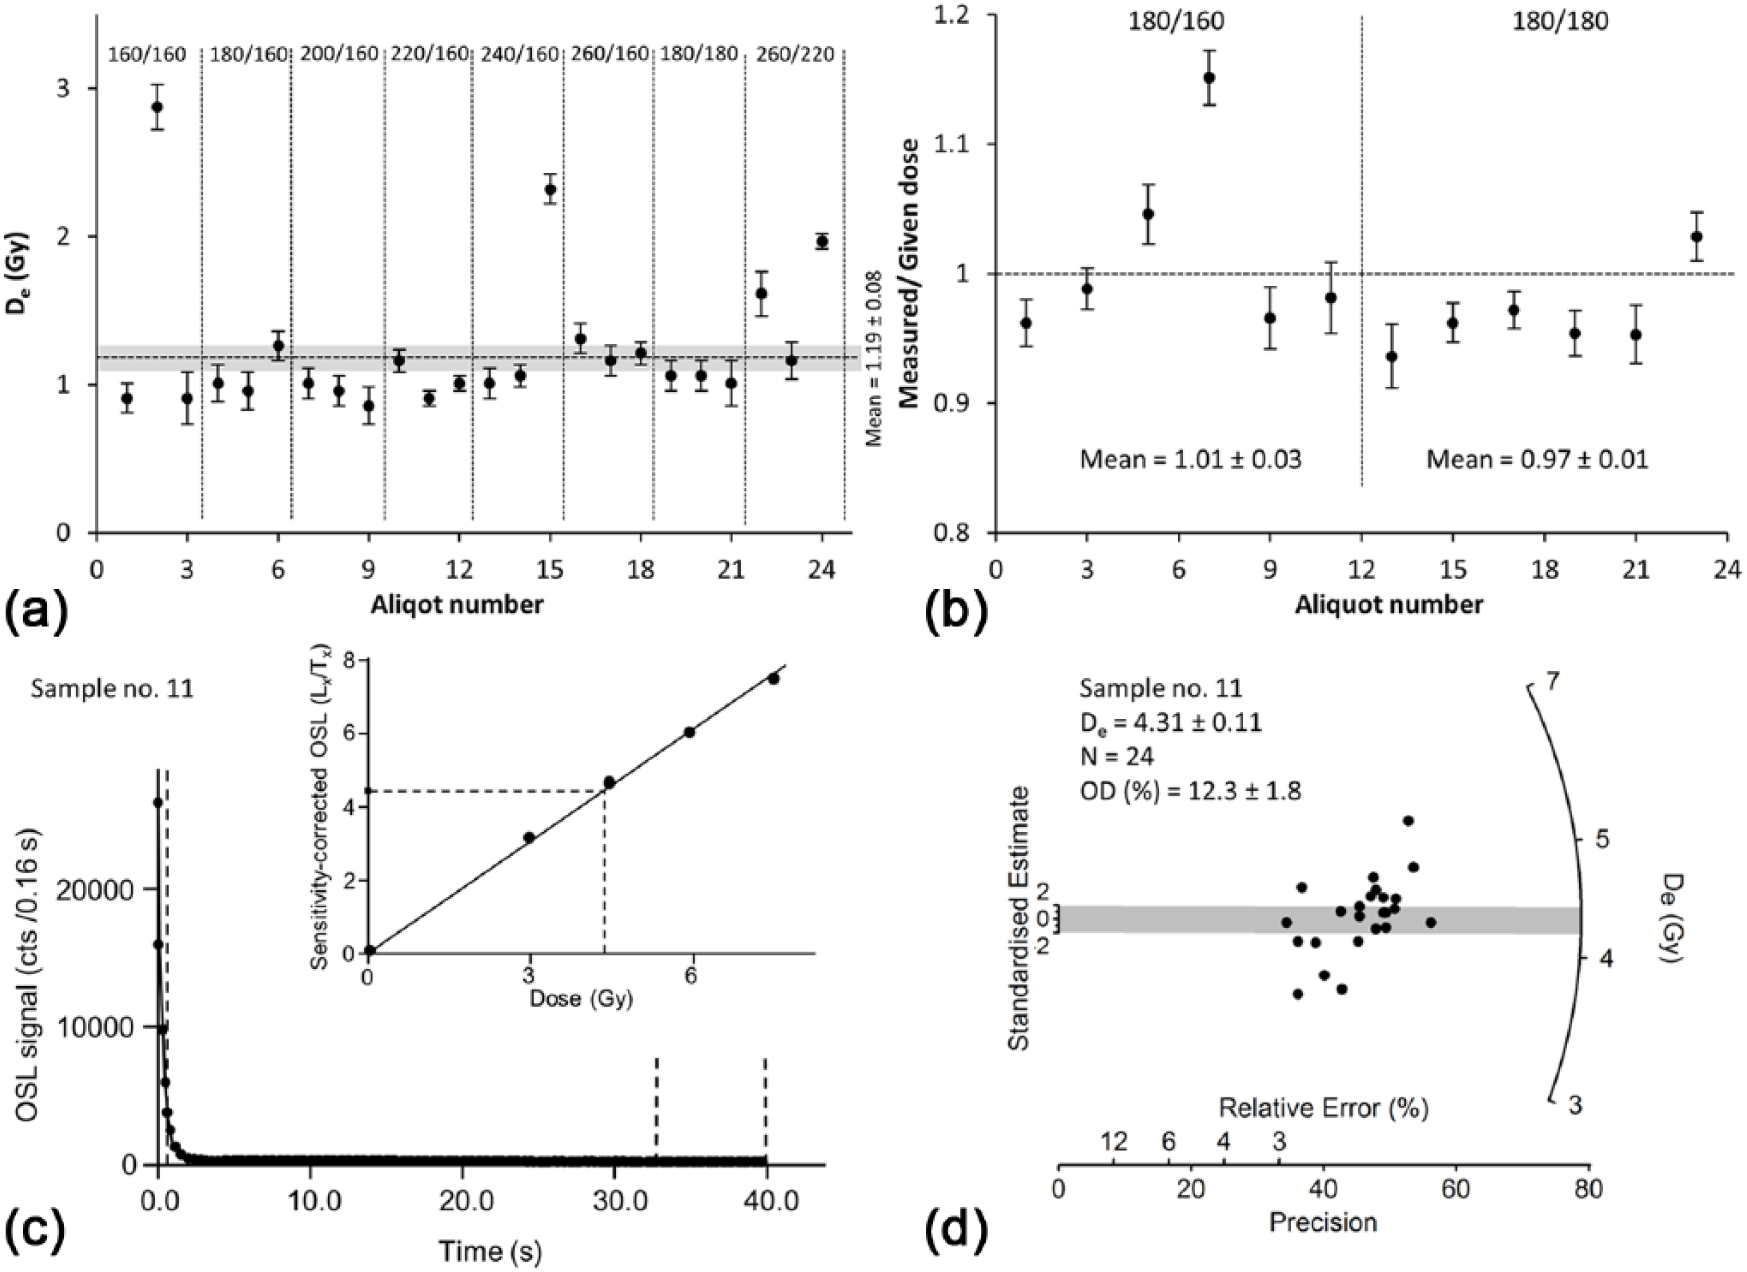
(a) Preheat plateau experiment for 24 aliquots of sample 2 (Table 1). 180/160 denotes regenerative-dose preheat = 180°C and test dose preheat = 160°C. The mean De value (in Gy) and associated error (grey shading) are plotted as a dotted line. (b) Dose recovery experiment on 12 aliquots of sample 2 (Table 1). Aliquots are plotted according to the ratio of measured dose/given dose and divided into the two preheat/cut heat combination categories. (c) A typical decay curve of an aliquot’s OSL signal and an associated dose recovery curve taken from sample 11. The dotted lines on the decay curve indicate the integration intervals for calculating the De where the first 0.8 s was used for the OSL signal and the final 8 s for the background correction. The dose–response curve shows linearity, as did all other samples, and higher doses were unnecessary due to De values all being less than 6 Gy. (d) A radial plot of the De distribution for sample 11 is typical for all other samples. The shaded band is centred on the De value determined using the CAM, and the relative error is less than 3% and precision greater than 30 for all 24 aliquots.
For three samples (samples 1, 6 and 10; Table 1), 500 individual quartz grains were measured (180/180 preheat combination) to identify and eliminate those with unsuitable OSL properties and to allow the identification of incomplete bleaching and post-depositional mixing prior to age calculation. In doing so, these three samples served to assess the suitability of using multi-grain aliquots to determine ages for this depositional environment. For the remaining eight samples (Table 1), 24 aliquots, each comprised 50–60 grains, were measured (180/160 preheat combination) to estimate De values, which were calculated using the sum of the first 0.8 s of signal minus a background derived from the final 8 s. Dose–response curves were fitted with a linear function. The final De and overdispersion (spread in De data beyond that expected based on the standard error of each De value) values for each sample were calculated using the central age model (CAM; Galbraith et al., 1999).
For samples 1, 6 and 10 (Table 1), the beta dose rate for each sample was measured using a GM-25-5 beta counter (Bøtter-Jensen and Mejdahl, 1988), and a correction was made for grain size attenuation (Mejdahl, 1979). The gamma contributions were measured by thick source alpha counting. For samples 2–5, 7–9 and 11 (Table 1), ICP-MS analysis (completed by Intertek Genalysis) was used to measure uranium, thorium and potassium concentrations. All dose rates were calculated using the conversion values of Guérin et al. (2011), and an assumed water content of 5 ± 2.5% was used for all samples. The cosmic dose for each sample was calculated taking into consideration geographic position, sediment density, altitude and depth of overburden following Prescott and Hutton (1994).
Results
OSL results
The preheat plateau results suggest that multiple preheat combinations could be selected for age determinations (Figure 3a). Of the possible combinations, two were selected as most appropriate: 180/160 and 180/180 (Figure 3a) and were used for a dose recovery experiment. Both preheat combinations could be used to accurately recover a known dose in the laboratory (Figure 3b) demonstrating their suitability for De estimation. Both experiments illustrate that the thermally transferred charge component of the total De is minimal and that other preheat combinations could be applied with comparable results.
The example OSL signal decay curve (Figure 3c) is typical of all samples tested. The sensitivity corrected dose–response curve shows linearity typical for De values below 6 Gy (Figure 3c). The spread in De data is low (overdispersion values between 5% and 23%), as indicated by an example De distribution (plotted as a radial plot; Figure 3d.) for sample 11 (Table 1). The single-grain measurements indicate that these deposits do not suffer from post-depositional mixing or partial bleaching. Consequently, multi-grain aliquots can be used to estimate De values for samples from this study area. Combined, these results demonstrate that young marine sands from SE Australia are ideally suited to OSL dating (Jacobs, 2008). OSL age data are presented in Table 1. All samples experienced similar environmental dose rates (weighted mean of 0.96 ± 0.04 Gy/ka), and there is no discernible trend either seawards or landwards in the total dose rates (Figure 4). The overdispersion results (Table 1) are within the normal bounds expected for well-bleached marine quartz samples (Olley et al., 2004).
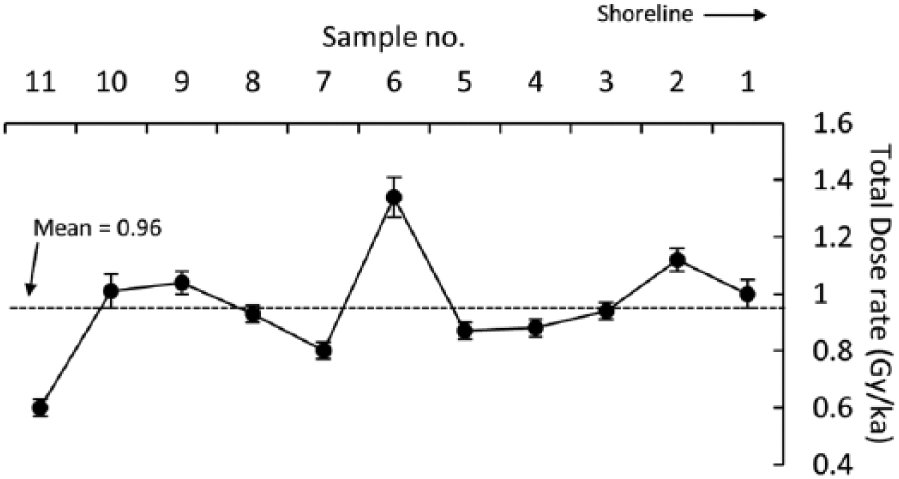
Total dose rate (in Gy/ka) plotted for all samples arranged according to distance from the shore.
Radiocarbon recalibration results
The recalibrated radiocarbon ages from Thom et al. (1981b) are presented in Table 2 and Figure 2. The recalibrated ages are not significantly different to the calibrated ages previously reported (Polach et al., 1979; Thom et al., 1981b) as the Delta R values (Gillespie and Polach, 1979) for the marine reservoir correction are the same as those used by Thom et al. (1981b) in the original calibration.
Radiocarbon samples from Thom et al. (1981b) ordered seaward to landward and shallowest to deepest (‘Ref. no’. corresponds to Figure 2). ‘Radiocarbon Age’ is the ‘Laboratory age’ and is corrected for isotopic fractionation only. The calibrated age is presented in cal yr BP according the calibration of Stuiver and Reimer (1993) using CALIB REV 7.0.1. The Delta R used for the calibration is taken from Gillespie and Polach (1979).
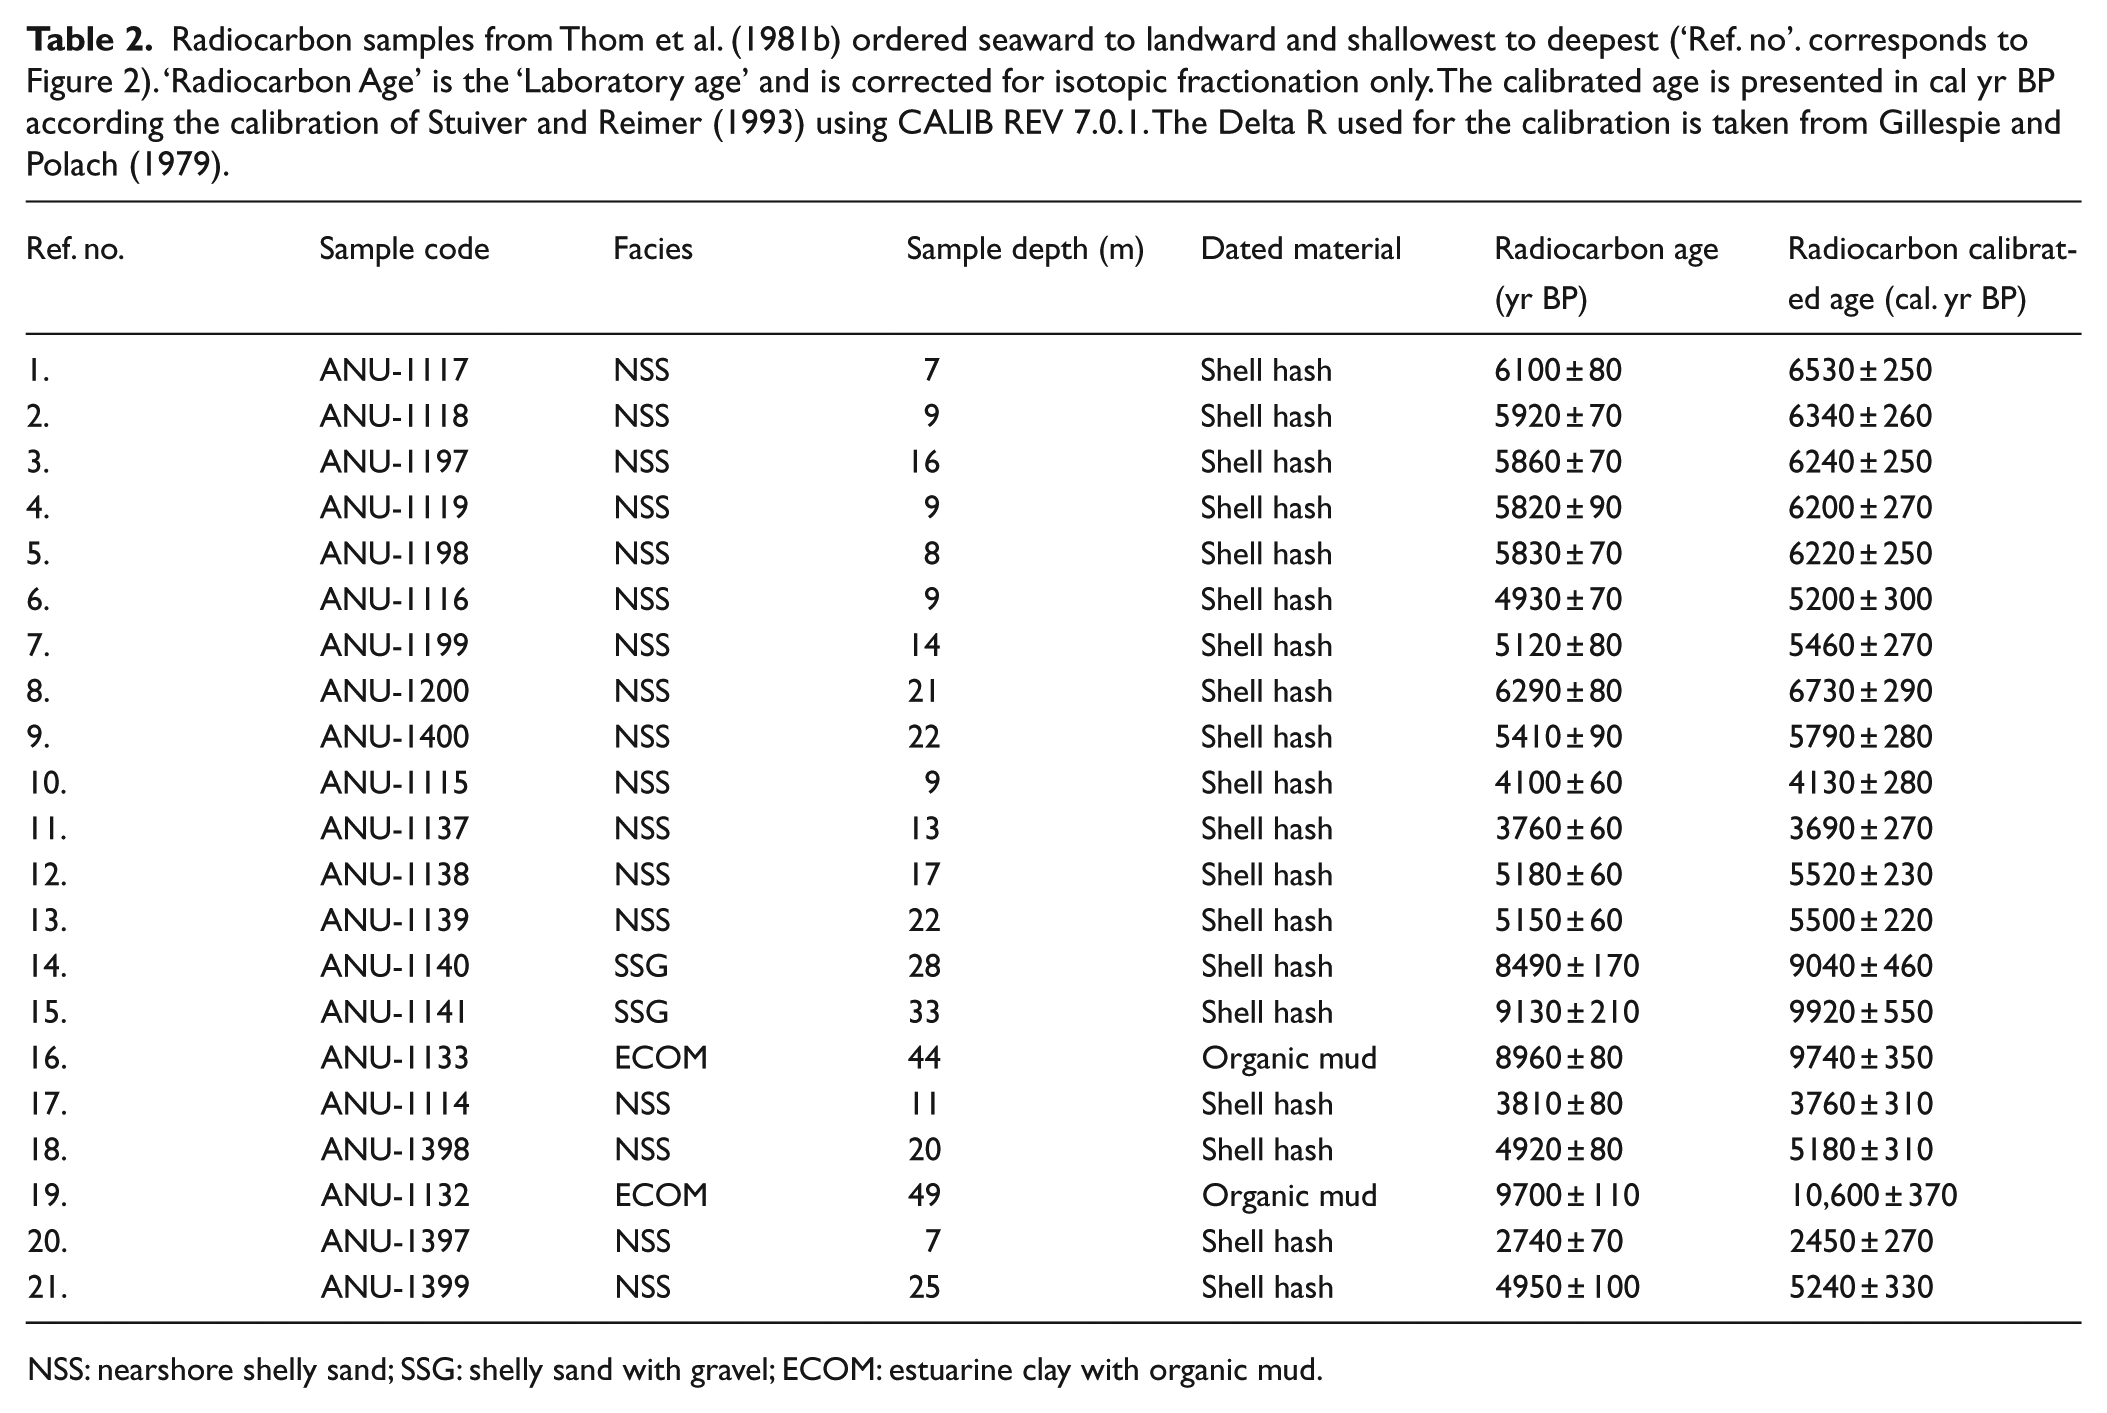
NSS: nearshore shelly sand; SSG: shelly sand with gravel; ECOM: estuarine clay with organic mud.
All but two of these age estimates are from the dating of ‘shell hash’. These shell hash samples composed of mixed species shell fragments are distributed evenly throughout the regressive and transgressive facies and appear anomalously old in comparison to the overlying shallow-core OSL age estimates. Samples 16 and 19 (Table 2, Figure 2) are from the estuarine clay and organic mud sequence underlying the transgressive and regressive facies and are early Holocene in age.
Discussion
The OSL age estimates from this study show a distinctly different pattern of Holocene shoreline progradation than that inferred from radiocarbon ages reported by Thom et al. (1981b; Figure 2). The radiocarbon chronology suggested an initially rapid phase of sediment accretion, which then slowed until eventually ceasing ~2500 cal. yr BP (Figure 5a; Thom et al., 1981a). After this time, the last 10% of the barrier was formed, mostly comprising the large foredune which is adjacent to the present-day beach (Roy et al., 1994).

(a) Radiocarbon and (b) OSL age estimates plotted against dimensionless barrier width for the Moruya Barrier. A linear regression and corresponding R2 value has been defined for the OSL age estimates. Errors correspond to 1 sigma. (a) Modified from Roy et al. (1994) and Thom et al. (1981a).
In contrast, the OSL chronology shows a linear rate of seaward shoreline progradation. The sequence of ridges according to OSL dating spans from 7220 ± 390 years ago to 390 ± 50 years ago at an average linear rate of 0.27 m/yr (Figure 5b). The youngest age of 390 years ago indicates that the large foredune is only a few hundred years old. The linearity of the ages is especially pronounced in the seaward 40% of the barrier indicating neither cessation, nor slowing, of shoreline progradation over the past 3000 years. This linear pattern of progradation is more consistent with radiocarbon dating along the northern transect at Moruya which shows progradation beginning at ~6000 cal. yr BP and ceasing at ~1000 cal. yr BP (Roy et al., 1994; Thom et al., 1981a). The oldest OSL age of 7220 years ago and the innermost shoreface radiocarbon age of 6530 ± 250 cal. yr BP, while differing, both indicate sea level close to the present with a sufficiently shallow shoreface profile to trigger shoreline progradation (Cowell et al., 2003).
There does not appear to be evidence for an ‘adjustment phase’ where shoreline progradation is initially more rapid following culmination of the rapid post-glacial sea-level rise around 7400 cal. yr BP (Sloss et al., 2007). Such an ‘adjustment phase’ seems to be evident from other radiocarbon chronologies in NSW (e.g. Woy Woy and Fens; Roy et al., 1994) and is supported by the radiocarbon chronology for nearshore facies at Moruya (Figure 5a). However, the OSL age for the most landward ridge at Moruya of 7220 years ago and the following three ages indicate that progradation commenced once sea level reached its present position and continued at a similar rate thereafter.
Each of the 60 ridges in this sequence had an average ‘lifetime’ of ~110 years. This is comparable to the average lifetime of 80 years inferred for each ridge for the linear portion of the Holocene ridge sequence at Guichen Bay (Murray-Wallace et al., 2002). This longer ridge ‘lifetime’ is also reflected in the progradation rate of 0.27 m/yr which is slower (with the exception of Wonga Beach, QLD) than inferred for other prograded barriers in Australia that have been dated using OSL (Table 3). This formation time of approximately 110 years per ridge requires further qualification with additional dates, especially multiple dates along individual ridges. The beach survey programme that has been conducted at Bengello Beach for the past 40 years provides important information on beachface behaviour and post-storm recovery (McLean and Shen, 2006; McLean et al., 2010). However, given the estimated formation time 110 years per ridge, it will be important to continue this survey programme if the full lifetime of individual ridges is to be observed.
A list of other relict foredune ridge plains with OSL chronologies and their respective apparent progradation rates.
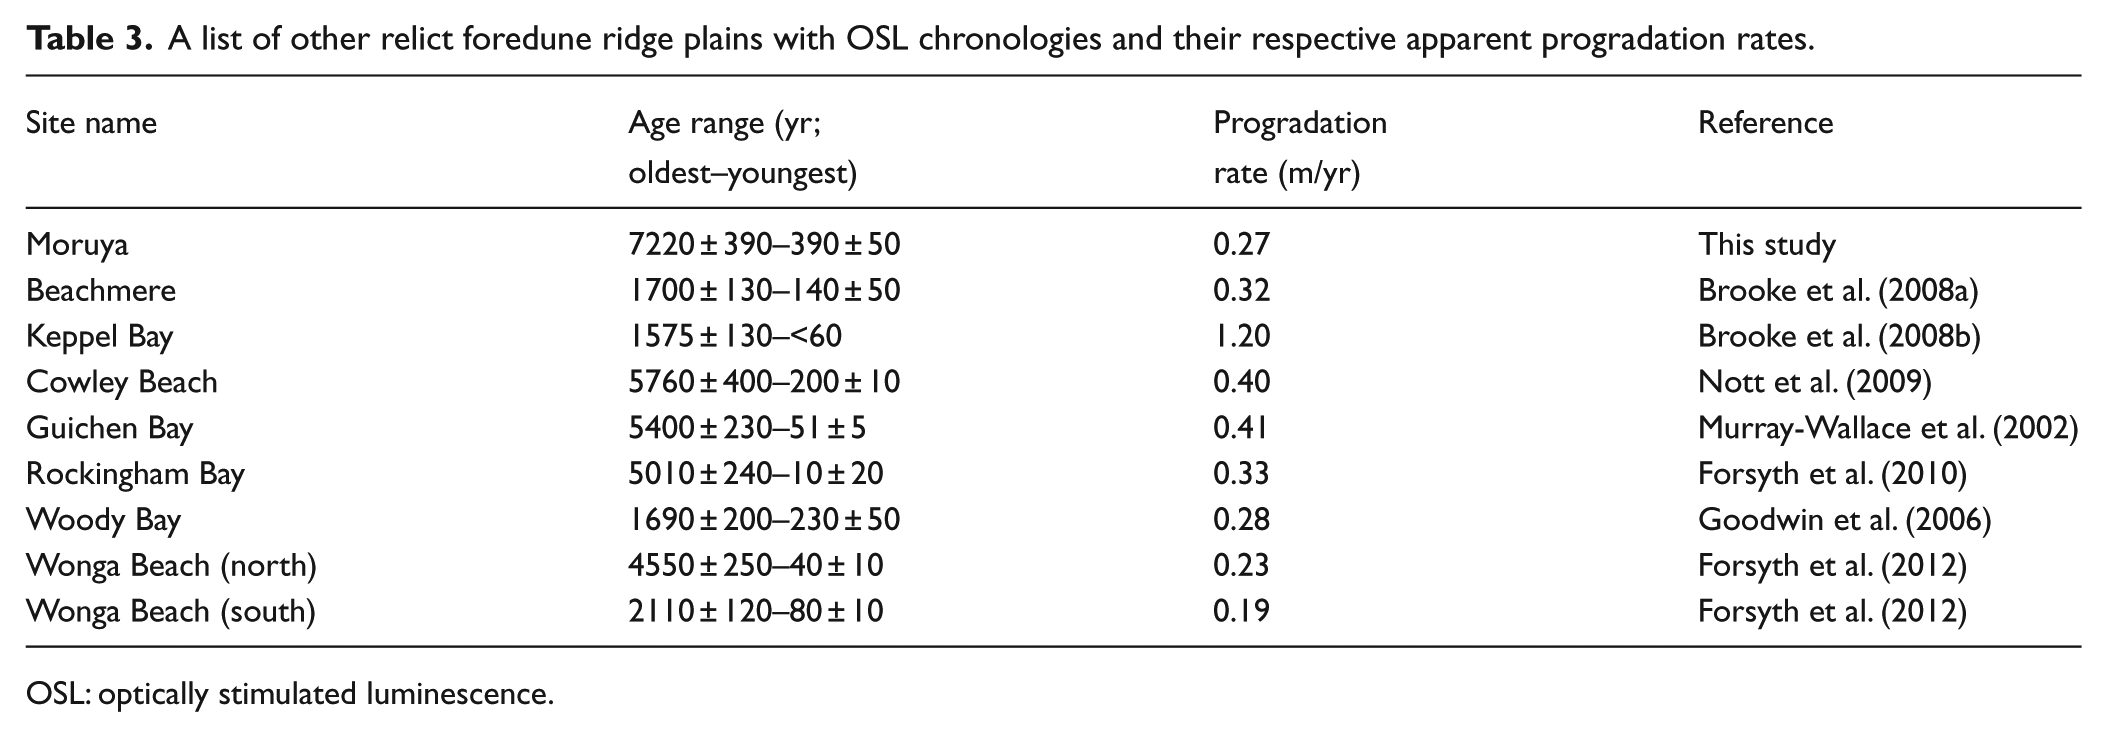
OSL: optically stimulated luminescence.
The sequence does include one age reversal; samples 5 and 6, although on closer inspection, it can be seen that these ages are not statistically significantly different (Figures 2 and 5b). These two samples are separated by one large compound ridge with deep swales on either side; therefore, this reversal may be explained by considering average ridge formation time of 110 years and the 1 sigma error on the two ages (samples 5 and 6) of 110 and 150 years, respectively.
Another uncertainty exists between samples 8 and 9 where the ages overlap at the 1 sigma error; yet the distance between the sample locations is around 300 m spanning seven identifiable ridge crests. Despite this, the linearity of the sequences of ages is still apparent (Figure 5b). More OSL dates on individual ridges along the dating transect presented in this paper could resolve the question of whether there were episodic periods of rapid progradation; however, the errors associated with OSL dating of samples (especially older than ~2000 years) make it likely that such episodes would remain masked by dating uncertainties. However, further OSL dating north and south along specific ridges would enhance the precision of ridge formation time and shed light on problems of alongshore variation of progradation patterns identified by the three radiocarbon dating transects for this site (Thom et al., 1981a).
No OSL ages were obtained within the nearshore sands at depths comparable to those of Thom et al. (1981b). Justification for this approach, which involved shallow sampling of upper dune facies, is found principally in Murray-Wallace et al. (2002) who contrasted a radiocarbon chronology of a Holocene prograded barrier sequence using OSL samples from comparable depths to this study. Other studies have also applied a similar shallow sampling technique with great success, see, for example, Forsyth et al. (2012). However, OSL ages for samples from depths comparable to those sampled by Thom et al. (1981b) would be of great benefit and highlight differences in precision and utility of the two techniques for constructing prograded barrier chronologies.
The differences between the OSL ages presented in this study and the well-documented radiocarbon chronology warrant further discussion. While the ~63-year offset between radiocarbon and OSL ages cannot account for the different ages, a number of concerns mentioned in the earlier studies may be possible explanations for this disparity. First, radiocarbon dating of shell hash from nearshore shelly sand may result in a general trend of overestimation of ages, due to the higher probability that older reworked shell fragments would be included in a sample thus biasing the age (Roy, 1991; Thom et al., 1981b).
A second consideration is the uncertainty involved in projecting isochrons to the surface based on ages from sample material collected from depths of 10–30 m within the nearshore shelly sand unit. The validity of this method relies on the accurate reconstruction of palaeo-beachfaces. GPR data collected for this site may provide a future means for determining the precise geometry of such beachfaces and will likely further clarify interpretation of radiocarbon ages from the nearshore shelly sand.
The overall linearity and significantly younger OSL ages for the seaward half of the barrier highlights the possibility of differing emplacement of these two facies over the Holocene. While one explanation for the older ages in the radiocarbon chronology is older shell fragment populations in the samples collected and dated by Thom et al. (1981b), an alternative explanation involves the early stillstand emplacement of shoreface sand creating a disequilibrium profile, the upper portion of which was then reworked onto the accreting beachface over the interval defined by the OSL dates.
Dimensionless barrier width (Figure 5) has typically been used for comparative analysis with other prograded barriers in NSW (Roy et al., 1994). However, this measure of progradation makes no allowance for factors such as changing embayment size. Changing embayment size could also result in some difference between chronological data from different facies (i.e. OSL dates are from dune facies, and radiocarbon dates are from nearshore facies), and the relationship between accumulation rate of sediment in the nearshore and the beachface may differ in a non-linear fashion as accommodation space of the embayment changes over time (Bristow and Pucillo, 2006). As can be clearly seen from the morphology of the Moruya coastal plain (Figure 1), the size and shape of the embayment has changed considerably, with a longer embayment shoreline after ~2500 years ago. Therefore, while a constant rate of progradation is clearly demonstrated with the OSL dates, it is premature to infer the pattern of sediment delivery through time, and the volume of sand sequestered in the embayment. Ongoing work involving LiDAR and GPR may provide additional evidence to unravel the complexities of sediment delivery over time and better understand relationships between nearshore, offshore and aeolian geomorphological components of this system in relation to the chronological evidence.
This revision of progradation history raises new morphostratigraphic and morphodynamic questions regarding timing and mode of emplacement of shoreface, beachface and dune sand. These may be best addressed through further advances in coastal behavioural modelling, similar to that advocated in recent barrier studies (see Daley and Cowell, 2012; Kinsela, 2014; Lorenzo-Trueba and Ashton, 2014).
Conclusion
OSL dating is a suitable method for dating the timing of deposition of quartz-rich marine sands on this section of the coast of south-eastern Australia. Coupled single-grain and multi-grain aliquot measurements indicate that quartz grains in this setting have good luminescence characteristics and do not suffer from post-depositional mixing or partial bleaching. Consequently, multi-grain aliquots are sufficient for De estimation for these samples.
The OSL ages indicate that shoreline progradation on the central transect of the Moruya barrier has occurred at a relatively uniform rate (~0.27 m/yr) from approximately 7000 years ago to the present, giving an average lifetime of ~110 years for each relict foredune ridge. The oldest ridge in the sequence corresponds closely to the culmination of rapid post-glacial sea-level rise with the proceeding OSL ages indicating that the shoreline continued to prograde until ~390 years ago. There are several possible explanations for the variation between the radiocarbon dates along this transect and the OSL ages reported in this study, and further analyses are required to better understand these differences.
These results suggest the need for a more cautious approach to chronological interpretation of coastal barriers based on radiocarbon dating in Australia and worldwide and encourage further use of OSL dating to enhance our understanding of Holocene coastal evolution.
Footnotes
Acknowledgements
We are grateful to Dr Zenobia Jacobs for her overseeing OSL dating. Thanks to Dr Christina Neudorf for helping Dr Amy Dougherty develop this efficient methodology used to collect these OSL samples. Dr Terry Lachlan and Yasaman Jafari assisted in the laboratory, and Brendan Dougherty, Dr Anthony Dosseto and Edward Oliver assisted in the field. We thank Colin Murray-Wallace for his helpful comments on this manuscript. This manuscript was greatly improved as a result of valuable comments by two anonymous reviewers.
Funding
The OSL dating was supported by the GeoQuest Research Centre, University of Wollongong. while Mr Thomas Oliver was on a postgraduate scholarship and Dr Amy Dougherty was on an NCCARF-supported postdoctorate.