
Abstract
Variations in the Nile River water level have been historically associated with social development of the Egyptian civilization, particularly through times of famine. In addition, the Nile River water levels have been strongly linked to variations in climate teleconnections, specifically El Niño/Southern Oscillation, the North Atlantic Oscillation (NAO), and the Pacific Decadal Oscillation. In this paper, we demonstrate that the cumulative effects of these three teleconnections link strongly to the occurrence of famine in Egypt. To create a cumulative response, we employed a principal component analysis (PCA) of the reconstructions of these three climate teleconnections that yielded a composite accounting for 61% of the total variance in the three datasets. We compared that analysis to a new compilation of drought and famine in Egypt. Analysis reveals 8 of 10 major famines in Egypt over the last thousand years correspond to low points or downward movements in a detrended composite eigenvector of the three major climate teleconnections discussed. This Southern Oscillation Index–NAO (SOI-NAO) eigenvector has a statistically significant discrimination between the occurrence of famine and non-occurrence of famine (t = 2.56; p = 0.013). Additionally, the composite climate eigenvector correctly identifies 50 out of 80 events (63%) of lesser incident years mentioned in other Arabic texts. While this climate composite teleconnection analysis alone does not explain all famine events in Egypt over the last thousand years, the relative strength of linkage suggests that potential exists to account for even older (e.g. Egyptian Empire) famines as climate reconstructions extending further back in time become available.
Introduction
The Nile River and its flood patterns have had a profound impact on the culture and civilization of northeast Africa (Diaz and Markgraf, 1992; Hassan, 2007b; Kondrashov et al., 2005). In particular, the variability of the Nile River has historically been linked to times of prosperity and famine in Egypt. Accounts of famine-based behavior graphically chronicled how closely historical life and death were linked to environmental changes. For example, in an account by Al Baghdadi (1204 [1964]) in the famine of 1200–1203 CE, conditions had deteriorated to an extent that led to cannibalism. Addressing the environmental processes that contribute to famine events aids our understanding of how future climate variations may affect society. Determination of the causal impacts of climate on globally important historical regions can provide valuable information on past societal impacts. In particular, the link between the Nile River and well-known teleconnective climate phenomena such as El Niño/Southern Oscillation (ENSO), Pacific Decadal Oscillation (PDO), and the North Atlantic Oscillation (NAO) may provide a means of assessing an aspect of the interrelationships between climate and civilization. This study describes these relationships and demonstrates that these teleconnective climate forces have had a direct impact on the historical reoccurrence of Egyptian drought and famine through the use of a new compilation of documented drought and famine records.
Study area and data
Nile River levels
The building of the Aswan Dam reduced the unpredictability of the lower Nile River levels today. Despite the Aswan High Dam, the Upper Nile River system still experiences major variations in discharge from year to year (El Din, 1977). Some of the Upper Nile River discharge variations are linked to distinct climatic teleconnection locations. Teleconnections such as ENSO, NAO, and PDO have been identified as having distinct impacts on Nile River levels (e.g. Amarasekera et al., 1997; Bliss, 1926; Eltahir, 1996; Hassan, 2007b; Kahn et al., 2006; Taye and Willems, 2011).
Because of the importance of Nile River levels to the Egyptian society, specific heights of the river were historically recorded using devices known as Nilometers. There are several noncontiguous records from Nilometers dating back to 622 CE (Common Era; Kondrashov et al., 2005). Several reconstructions of river levels using these historical Nile River or other proxy data have been attempted (Hassan, 2007b; Kondrashov et al., 2005; Wils et al., 2010). The most complete reconstruction to date was compiled using Nile River level data from Rawdah Island, located on the Nile River in central Cairo (Kondrashov et al., 2005). However, because of gaps in the data, Kondrashov et al. (2005) have applied advanced spectral analysis methods such as Singular-Spectrum Analysis (SSA) and the Multi-Taper Method (MTM) to fill the gaps and to locate interannual and interdecadal periodicities (Kondrashov et al., 2005; Thompson, 1982). Such methods have yielded a continuous reconstructed record of Nile River levels between the years of 622–1921 CE.
Famine data
There is an extensive history of famine occurrence in Egypt as early as 2200–2150 BCE associated with the fall of the Old Kingdom in Egypt (Hassan, 2007a). Specifically, a long history of famine in the Nile River Valley exists with documentation of specific episodes. Since 1049 CE, these occurrences include famines in 1064–1072, 1097, 1200–1202, 1218, 1263–1064, 1372–1373, 1403, 1641, 1792, and 1877 (all dates in CE, with reference from Al Baghdadi, 1204 [1964]; Hassan, 2007b; Keys et al., 1950; Nash, 1976; Samy, 1915; Zakry, 1926). It is desirable to evaluate climate’s influence on the entire famine history of Egypt; however, the climate teleconnection reconstructions are limiting at this time, in particular the NAO reconstruction extends only to 1049 CE.
Climate data
Many different interannual climate teleconnective phenomena impact the weather in areas far beyond their specific location. In particular, a variety of atmospheric teleconnections are suggested as exerting influences on the watershed associated with the Nile River. One of the earliest studies of ENSO (Bliss, 1926) connected variations in the Nile River levels with perturbations of ENSO, the Nile River region is listed as one of the 10 geophysical variables that relate to the Southern Oscillation (Eltahir, 1996) and the Nile River ENSO relationship is one of the oldest and most well-established teleconnective impacts on nature (Diaz and Markgraf, 1992).
ENSO
Research of the past few decades has indicated that sea surface temperatures (SSTs) in the central Pacific ocean can explain 25–40% of the variance of Nile River discharge (Amarasekera et al., 1997; Eltahir, 1996; Kahn et al., 2006). When the Southern Oscillation Index (SOI) is in the negative phase, it creates changes in global circulation that limit moisture import over the eastern African continent (Seleshi and Demaree, 1995) such that higher pressure exists over the Ethiopian and Eritrean highlands, thereby reducing convection and reducing precipitation (Viste and Sorteberg, 2013). Since the highlands are the major watershed of the Blue Nile, which contributes a large amount of the Nile’s total water flow (Seleshi and Demaree, 1995), the entire lower Nile River system is affected by the SOI.
More recently, researchers have examined the Nile/ENSO relationship using a cumulative index of both El Niño and Southern Oscillation (Jury et al., 2002) such that a value of −7 or lower indicates a strong El Niño event and a value of +7 or greater indicates a strong La Niña event. Using the Jury et al. (2002) index, a significant relationship between strong El Niño events and reduced rainfall on the Blue Nile watershed exists at the 90% confidence level (Abtew et al., 2009).
We represent the ENSO teleconnection through the use of the SOI based on the alternating variations in atmospheric pressure between the central and western Pacific Ocean. Specifically, the SOI is defined as the sea level pressure difference between Tahiti and Darwin, Australia (Trenberth, 1997). The SOI serves as an indicator of the phase of ENSO with the negative SOI values associated with El Niño (Diaz and Markgraf, 2000; Yan et al., 2011).
For this study of historical variations in the Nile River, SOI values extending back over a thousand years were needed. Therefore, we employed reconstructed SOI values using reconstructed Pacific Ocean precipitation levels as a proxy (Yan et al., 2011). A strong and persistent correlation between SOI and precipitation has led researchers to construct a SOI index based on the difference in rainfall between the tropical western Pacific and the equatorial eastern Pacific (Yan et al., 2011).
NAO
Additionally, other teleconnections have been associated with Nile River levels. In particular, the NAO – variations in the pressure patterns between Iceland and the Azores (Lamb and Peppler, 1987; Trouet et al., 2009; Van Loon and Rogers, 1978) – has been examined as an influencing factor upon the Nile River. There exists a link between the NAO and rainfall in the Nile River watershed, and a direct link between Nile River discharge and Atlantic SSTs (Hassan, 2007b).
This relationship, however, has not remained constant over the period of reconstructed Nile River levels. Climate reconstructions of the NAO based on oxygen isotopes at Rana, Norway (Baker et al., 2002), and diatom transformations at Voring, Norway (Jansen and Koc, 2000), show an inverse relationship between Atlantic SSTs and Nile flood frequency during the early medieval period. The relationship between Atlantic SSTs and flood frequency becomes positive after the year 1000 CE. The apparent oscillatory pattern of the relationship between the NAO and North Atlantic SST is aperiodic over the years 800–1800 CE. This relationship between North Atlantic SSTs and the NAO is strongly reinforced by proxy speleothem records in the North Atlantic SSTs in the southwest of Scotland (Proctor et al., 2000). The coherence of the relationship between proxy and the Nile flood record is significant and reflects the oscillatory relationship shown in the Norwegian proxy records (Hassan, 2007b).
The NAO is the main synoptic mode of atmospheric circulation in the North Atlantic Ocean and is recognized as the air pressure difference between Iceland and the Azores (Jones et al., 1997; Lamb and Peppler, 1987; Trouet et al., 2009; Walker and Bliss, 1932). The positive phase of the NAO is associated with higher than usual pressure in the subtropics and lower than normal pressure in the arctic. This results in warm dry winters in southern Europe and wet conditions in northern Europe. The negative phase of the NAO creates opposite conditions over Europe. There is a weak, but positive, correlation between the NAO and precipitation in the Nile River Delta region (Brandimarte et al., 2011). Long-term studies of the Nile River have associated cold conditions in Europe with low Nile River levels throughout the Holocene (Hassan, 1981).
As with the reconstructed SOI index, for this study, we required a reconstructed NAO index that extends back for over a thousand years. We employed a NAO reconstruction that was developed from a tree ring drought reconstruction of Morocco and a speleothem-based precipitation proxy from Scotland (Trouet et al., 2009).
PDO
Beyond the NAO’s influence on the Nile River, the PDO – long-term variations in North Pacific SST (Taye and Willems, 2011) – is also suggested as an influencing factor on Nile River water levels. In particular, a negative correlation exists between PDO, rainfall, and flow extremes on the Blue Nile River basin (Taye and Willems, 2011). This relationship is reflective of the statistically significant inverse relationship between the PDO and Blue Nile River’s rainfall extremes and flow extremes during the June through September dry season (Taye and Willems, 2011).
The PDO is a long-term pattern of SST anomalies and atmospheric circulation in the North Pacific. The PDO index is derived from an empirical orthogonal functions (EOF) analysis of SSTs (MacDonald and Case, 2005). The positive phase of the PDO is typified by warm SSTs in the northeastern Pacific, whereas cool SSTs are indicative of the negative phase of the PDO (MacDonald and Case, 2005; Mantua and Hare, 2002). Previous research has noted that the positive phase of the PDO exerts strong climatic influence on precipitation over the Nile River basin (Jury, 2009).
The reconstructed PDO dataset is derived using tree ring chronologies from southern California and western Canada. The PDO chronology was calibrated using the 1940–1998 PDO index as a baseline. Reconstructions based on multiple regression analyses of the annual PDO extend from 933 to 1996 CE (MacDonald and Case, 2005).
Methods
Consequent to the available research connecting worldwide climate teleconnections to the climatology of the Nile River, we have selected these three teleconnections, the ENSO, the NAO, and the PDO, to determine whether their combined variances might more accurately represent variations in Nile River water levels and, therefore, on famine occurrence in Egypt. While each teleconnection has a complicated and independent relationship with Nile River discharge, their composite relationship has not been previously investigated.
Shared variances of teleconnections
Past research indicates that all three major climatic teleconnections have been linked to Nile River variability. Specifically, a significant relationship exists between strong El Niño events and reduced rainfall on the Blue Nile watershed (Abtew et al., 2009). Additionally, a weak but positive correlation between the NAO and precipitation exists in the Nile River Delta region (Brandimarte et al., 2011). Finally, previous research has also demonstrated a relationship between the positive phase of the PDO and precipitation over the Nile River basin (Jury, 2009).
While each teleconnection may contribute to Nile River variability, the cumulative or aggregated influence of these three major teleconnections (SOI, NAO, and PDO) with the Nile River has not been addressed. Consequently, we developed a composite teleconnection index that represents the shared variance among the three teleconnections in order to compare the cumulative effect of these teleconnections on the Nile River Basin.
The first step of this project was to extract the shared variance between the three reconstructed teleconnective time series (SOI, NAO, and PDO). To that end, we conducted an un-rotated Principal Component Analysis (PCA) on the three reconstructed teleconnection datasets (Jackson, 1991) from 1049 to 1922 CE. Analysis revealed that while the PDO data were normally distributed, the NAO and SOI data displayed slight variations from a normal distribution. However, normality or non-normality of the data does not impact PCA (Rummel, 1970).
The first eigenvector demonstrated an inverse relationship with NAO (r = −0.867) and positive correlations with SOI (r = 0.865) and PDO (r = 0.581). The first eigenvector accounted for 61.3% of the total variance in the three datasets. The loadings on this eigenvector are strongly NAO and SOI; therefore, we will call this the NAO-SOI factor. It is speculated in previous research that the NAO and the SOI have a combined impact on the climatology of the Nile River watershed (Toker et al., 2012).
The second eigenvector is heavily PDO related and demonstrated an inverse relationship with NAO (r = −0.269) and positive correlations with SOI (r = 0.277) and PDO (r = 0.814). The second eigenvector was of less significance explaining 27.1% of the total variance of the three datasets and the remaining eigenvectors significantly less. Consequently, we focus our attention on the first eigenvector as representative of the aggregated effects of the SOI/PDO/NAO indices.
Since the year-to-year variability of the NAO-SOI eigenvector is highly variable, in order to make a more visually clear time series, we employed a locally weighted scatterplot smoothing (LOWESS) algorithm (Cleveland and Devlin, 1988). For each data point, the statistical algorithm performs a weighted linear regression, giving the greatest weight in the smoothing to points closest to each x-value and limiting the influence of outliers. A smoothed fit line of the NAO-SOI eigenvector indicates 10 minima in the factor scores of the NAO-SOI eigenvector (Figures 1 and 2).
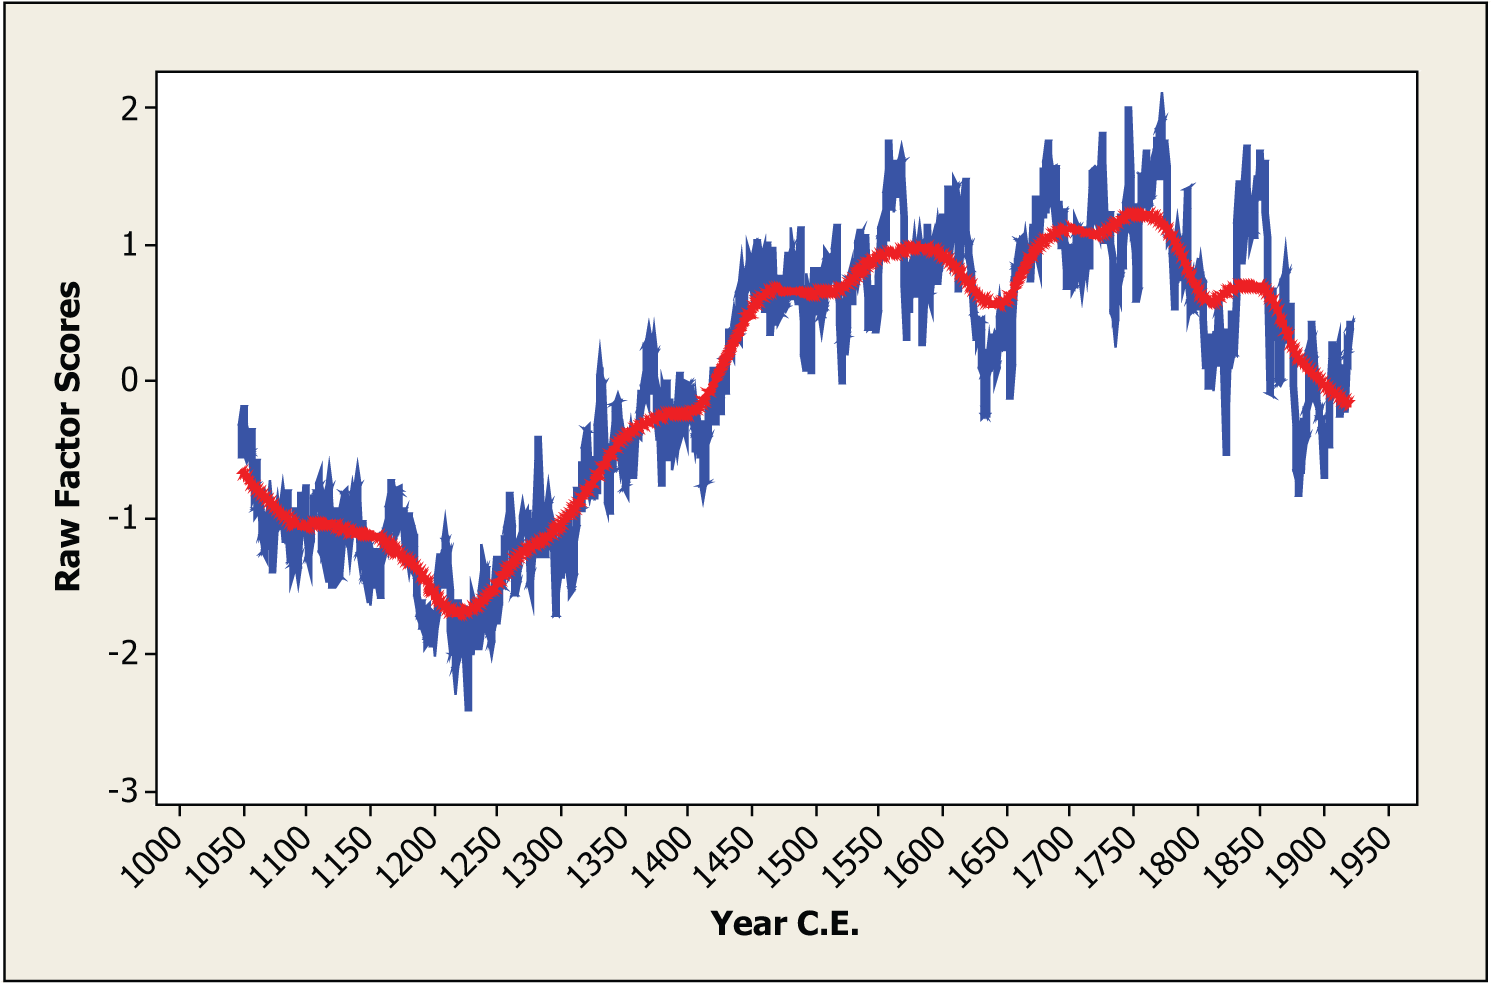
Raw factor scores (in blue) associated with the NAO-SOI eigenvector of the three climate teleconnections (SOI, NAO, and PDO) with smoothed fit line (produced by a locally weighted scatterplot smoothing algorithm) in red. Years are expressed in Common Era (CE).

Detrended (third-order polynomial regression analysis) factor scores associated with the NAO-SOI eigenvector of the three climate teleconnections (SOI, NAO, and PDO) with smoothed fit line (produced by a locally weighted scatterplot smoothing algorithm) in red, with specific dates of recorded historical famine years labeled on x-axis. Years are in Common Era (CE).
The plotted factor scores associated with the NAO-SOI eigenvector display a marked long-term positive trend over the last 1000 years (Figure 1). As this long-term trend potentially obscures identification of individual Egyptian famine periods embedded in the data, we extracted this long-term variability from the factor scores of the NAO-SOI eigenvector using a third-order polynomial regression analysis. A smoothed fit line of the residuals from the regression analysis indicates 10 distinct minima in the factor scores of the NAO-SOI eigenvector (Figure 2).
The centennial-scale trend apparent in the raw factor scores (Figure 1) may hinder the ability to see other decadal-scale trends but is a feature that should not to be completely ignored. The lowest raw factor scores occurred between 1200 and 1225 CE. This is concurrent with the 1200–1202 CE and the 1218 CE famine. It is also concurrent with the transition between the Medieval Climate Anomaly (MCA) and the ‘Little Ice Age’ (LIA; Esper et al., 2002). A substantial shift in the effects of the NAO as seen in proxy records in Scotland and Morocco also occurred during this transition (Trouet et al., 2009). It may be of interest in the future to analyze the effects of the MCA-LIA transition on the Nile River basin.
Although the direct linear correlation between the NAO-SOI eigenvector and the reconstructed Nile River levels is not significant at the 90% confidence level, the extremes (times of highest and lowest water levels) of the reconstructed Nile River are well-identified by the NAO-SOI eigenvector. Specifically, when the reconstructed Nile River values are classified into two classes, that is, ‘high’ river values as higher than one standard deviation of the mean (n = 116 out of 873 years) and ‘low’ river values as lower than one standard deviation from the mean (n = 94 out of 873 years), the NAO-SOI eigenvector significantly discriminated between those two classes at the 99.9% confidence level (t = 4.87; p = 0.0001).
As a corollary independent test, we conducted a complementary statistical analysis such that we divided the aggregated teleconnection index into two extremes, that is, ‘high’ yearly index values higher than one standard deviation of the mean (n = 131 out of 873 years) and ‘low’ yearly index values lower than one standard deviation from the mean (n = 136 out of 873 years). Lower reconstructed river levels were linked with the low extreme class of the aggregated teleconnective index at the 99.9% confidence level (t = 4.52; p = 0.0001). Significant results achieved by both analyses would indicate more robust confidence (Balling and Cerveny, 1995) in the potential relationship between the aggregated teleconnective index and the reconstructed Nile River. Consequently, these two statistical tests indicate that the aggregated teleconnective index does significantly distinguish high water and low water extremes of the Nile River levels. Since we have shown that Nile River extremes – particularly low extremes – are associated with occurrence of regional famine, a direct comparison of the NAO-SOI eigenvector and famine occurrence in Egypt without the intermediary of the Nile River water levels may prove enlightening. It should be noted that we did attempt to investigate these relationships against modern meteorological data. Unfortunately, secular meteorological datasets for the study area over the last century are fragmentary, and a comprehensive analysis using monthly data was not possible. As high-quality climate reanalysis data become available for this region, this analysis can hopefully be attempted.
Climate teleconnection composite and famines
Historically notable droughts and famine in Egypt have been documented; since 1049 CE, these occurrences include the famines of 1064–1072, 1097, 1200–1202, 1218, 1263–1264, 1372–1373, 1403, 1641, 1792, and 1877 (all dates in CE, with reference from Al Baghdadi, 1204 [1964]; Hassan, 2007b; Keys et al., 1950; Nash, 1976; Samy, 1915; Zakry, 1926).
When the dates of the NAO-SOI eigenvector’s factor score minima are compared with the dates of historical famines occurring since 1049 CE, a close visual similarity between dates of the NAO-SOI eigenvector factor score minima and dates of famine occurrence in Egypt is evident (Figure 2). This suggests that the NAO-SOI eigenvector composite does a good job identifying individual famine dates from decadal-scale variability in the factor scores.
Eight of the 10 famines correspond to low points or downward trends in this detrended NAO-SOI eigenvector. In addition to the strong relationship between Egyptian famines and Nile River levels (discussed above), it appears that the detrended climate composite is also a good predictor of famine in Egypt.
To assess the statistical validity of this visual relationship, we conducted a set of Student’s t-tests on the detrended residuals. The first t-test separated only the listed famine years into one group ‘famine years’ and all others into another group ‘non-famine years’. The detrended factor scores of the individual famine years can be seen in Figure 3. This classification resulted in a weak statistical distinction with a t-value 1.51 (p = 0.146). However, separating the 5 years before each famine into the ‘famine years’ group and all other years into the ‘non-famine years’ group captured cumulative effects of climate that may lead to famine conditions. The resultant t-value 2.57 (p = 0.012) shows that there is a significant statistical difference in the factor scores of the cumulative teleconnection composite associated with Egyptian famine years as opposed to non-famine years. Further t-tests incorporating the 10 and 15 years preceding a famine into the ‘famine years’ group yielded similar results with t-values of 3.33 (p = 0.001) and 3.84 (p = 0.000), respectively. This indicates that the aggregated climate teleconnection index not only captures the occurrence of famine events over the last thousand years of Egyptian records but also indicates that there may be a decadal-scale effect on climate that can lead up to and contribute to severe famine.
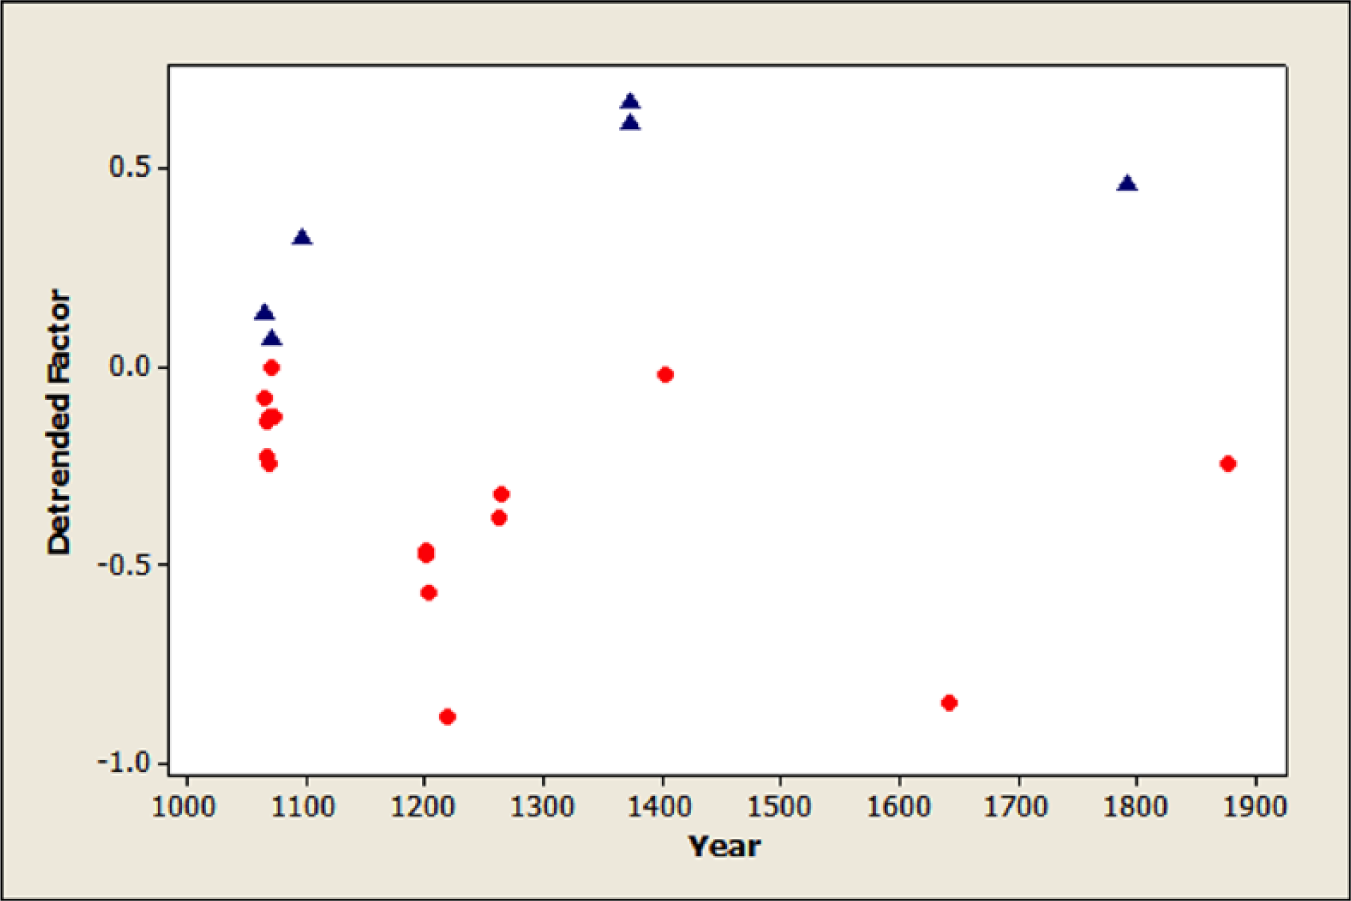
Individual years of famine and their detrended factor scores. This includes all years of famine, so while there were 10 famines included in this study, there were a total of 22 years in which famine was occurring because some of the famines extended beyond 1 year. Included here are each of the factor scores; positive factor scores are depicted as blue triangles and negative factor scores are depicted as red dots.
Many of the times of extremely low river levels are associated with the worst famines (Table 1). However, Nile-linked climate change does not appear to be the sole cause in some famines. Specifically, 3 of the 10 identified famines, the famines of 1264, 1792, and 1877 CE, occurred on years with Nile River floods within one standard deviation of the mean, and the 1097 CE famine occurred during an above average flood.
Dates of Egyptian Famines, Nile River flood maximum; listed date and flood level are of the lowest flood if the famine extended beyond 1 year, and literary reference information for famine occurrence. Dates are given in Common Era (CE) with the Islamic year or Anno Hegirae (AH) in brackets.

In addition to the well-documented severe famines listed above, numerous instances of stress to the ancient Egyptian population have been recorded because of poor or short Nile River floods (Samy, 1915; Zakry, 1926). These sources, in Arabic, contain detailed information about famine, drought, and other times of economic or social stress in the Nile River valley; they have previously been unavailable to most western sources. Famines mentioned within the Samy (1915) and Zakry (1926) texts can be categorized as years of (1) low flood where prices increased; (2) low flood not noted by historians; (3) short flood where prices increased; (4) drought, increasing prices, and death because of very low flood; (5) years of marginally shortened flood; (6) severe decline of flood; (7) late flood; and (8) when the Nile River was scarce. Within these categories, there were 80 recorded years, several of which are referenced above (1064–1072, 1200, 1372–1373, 1403, 1877; all dates CE).
Of the 80 incident years, 50 events (63%) were associated with a general decline of the teleconnection composite index (Figure 4). Many of these minor disruptions are associated with, or leading to, more serious famine. For example, 5 of the 15 years leading up to the disastrous famine of 1200–1202 CE were associated with increasing food prices or even deaths because of low Nile River levels. Additionally, these years saw dramatic decreases in the climate composite index (Figure 3). While many of these incidents were of relatively minor impact, this is a further indication of the strength of the teleconnection composite index’s relationship with Nile River civilization. It appears that there is a decadal-scale buildup of the conditions combined with extreme low flood years of the Nile that contribute the incidence of severe famine.
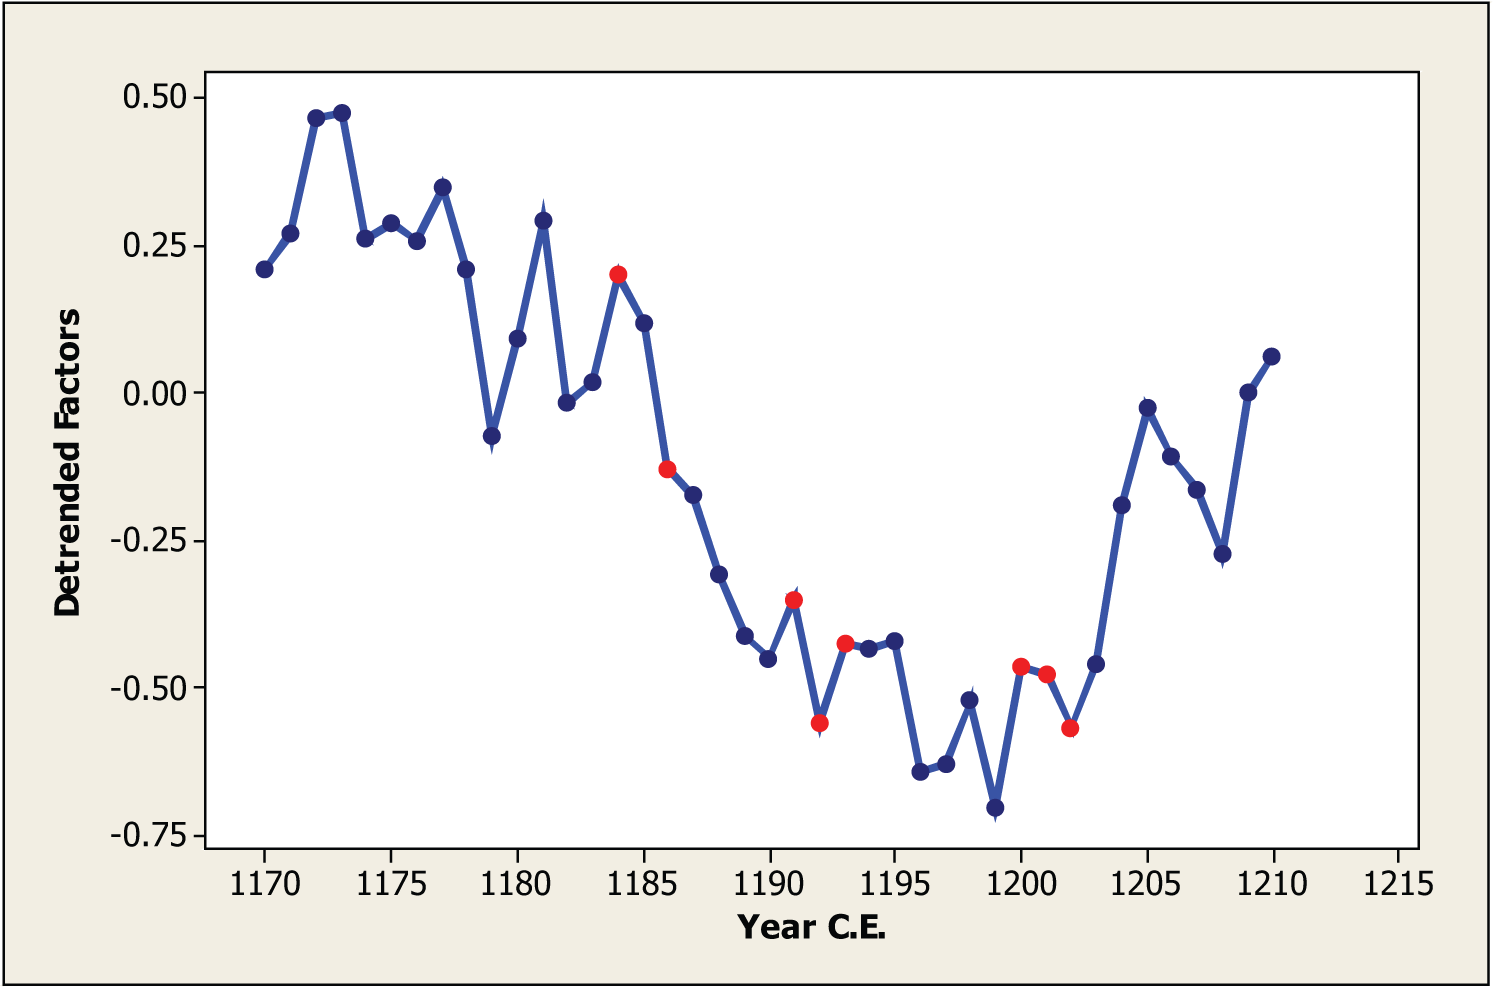
Detailed section of the detrended (third-order polynomial regression analysis) factor scores associated with the NAO-SOI eigenvector of the three climate teleconnections (SOI, NAO, and PDO) for the years 1170–1210 CE. Individual years are in blue and the connect line is blue. There were years (in red) of increased prices and deaths because of shortages in the years 1184, 1186, 1191, 1192, and 1193 leading up to the disastrous famine of 1200–1202. Years are given in Common Era (CE).
Discussion
The statistical aggregation of three climate teleconnections, the SOI, NAO, and PDO with well-established connections to the Nile River has produced an eigenvector that explains over 60% of the shared variance and which is strongly influenced by variations in SOI and NAO. This eigenvector shows distinct centennial-scale trend near the MCA-LIA transition that may obscure finer scale decadal trends in the data. Detrending of the long-term variability in this SOI-NAO eigenvector clearly shows these decadal-scale variations.
These variations are not strongly correlated to the Nile River annual flood variations as a whole, but rather are strongly correlated to the extremes, specifically the high and low extremes, associated with the Nile floods or failures. These decadal variations in the eigenvector are also strongly related to the incidence of famine. Eight of 10 major famines of the last millennia are associated with the decadal-scale downward trends of the SOI-NAO eigenvector. Documentation of other near-famine events noted to Egyptian society also coincided with these downward trends with 50 events of the 80 supplemental events, or 63%, associated with a general decline of the teleconnection composite index. Fundamentally, the decadal-scale buildup of global conditions (e.g. NAO and SOI) combined with extreme low flow years of the Nile contribute to the incidence of severe famine.
Conclusion
This research has demonstrated a relationship between aggregated climate teleconnections and a new compilation of famines over the last millennium. The decadal-scale buildup of global conditions (e.g. NAO and SOI) combined with extreme low flow years of the Nile contribute to the incidence of severe famine. Beyond the analyses of famines over the last thousand years in Egypt, there are records of famines for thousands of years with some dating as early as 2200–2150 BCE associated with the fall of the Old Kingdom in Egypt; for example, texts by the ancient Egyptian Ipuwer describe a famine catastrophe (Hassan, 2007a). However, at the present time, comprehensive reconstructions of climate teleconnections do not extend far enough back to allow detailed analysis of the global climate’s impact onto time periods associated with ancient famines. The relative strength of the climate/famine linkage established in this analysis suggests the potential exists to address climate’s impact on ancient (e.g. Old Kingdom) famines at a future time when climate teleconnection indices can be reconstructed into the distant past.