
Abstract
Stand-replacing wildfires are a keystone disturbance in the boreal forest, and they are becoming more common as the climate warms. Paleo-fire archives from the wildland–urban interface can quantify the prehistoric fire regime and assess how both human land-use and climate change impact ecosystem dynamics. Here, we use a combination of a sedimentary charcoal record preserved in varved lake sediments (annually layered) and fire scars in living trees to document changes in local fire return intervals (FRIs) and regional fire activity over the last 500 years. Ace Lake is within the boreal forest, located near the town of Fairbanks in interior Alaska, which was settled by gold miners in AD 1902. In the 400 years before settlement, fires occurred near the lake on average every 58 years. After settlement, fires became much more frequent (average every 18 years), and background charcoal flux rates rose to four times their preindustrial levels, indicating a region-wide increase in burning. Despite this surge in burning, the preindustrial boreal forest ecosystem and permafrost in the watershed have remained intact. Although fire suppression has reduced charcoal influx since the 1950s, an aging fuel load experiencing increasingly warm summers may pose management problems for this and other boreal sites that have similar land-use and fire histories. The large human-caused fire events that we identify can be used to test how increasingly common megafires may alter ecosystem dynamics in the future.
Introduction
In planning for the future during a time of changing climate, ecological disturbances are difficult to predict because the trends inferred from short historical records are often obscured by non-linear responses to climatic- and human-caused changes (Burkett et al., 2005). In the boreal forests of North America, most of the area burned by wildfires since 1950 has occurred during the warmest and driest growing seasons (Duffy et al., 2005; Flannigan et al., 2005; Kasischke et al., 2002), and many forecasts agree that these ‘megafire’ years will become more common as the climate warms (Balshi et al., 2009; Flannigan et al., 2009; Malevsky-Malevich et al., 2008). Initial climate-driven change to fire regimes may alter the ‘ecological memory’ of a landscape or trigger vegetation change, both of which can attenuate the sensitivity of wildfires to further warming (Kelly et al., 2013; Peterson, 2002; Terrier et al., 2013). An example of this process is a predicted ecological regime shift in which enhanced fire activity will redirect successional pathways from boreal conifers to drought-adapted, deciduous species possessing their own fire regime (Beck et al., 2011; Johnstone et al., 2010; Mann et al., 2012). Knowing how wildfires will interact with these feedbacks and respond to warming is germane to wildlife habitat, permafrost thaw, climate feedbacks, and public safety in the boreal biome (Bergeron et al., 2002; Chapin et al., 2004; Rogers et al., 2013). High-resolution paleo-studies of fire history have proved useful for quantifying prehistoric fire regimes and assessing how changes in these regimes can both respond to and impact ecosystem dynamics (Carcaillet et al., 2007; Clark, 1990; Higuera et al., 2010; Kelly et al., 2011).
Paleo-fire data are especially useful at the wildland–urban interface where human-caused changes may determine how fire will affect populated areas in the future (Radeloff et al., 2005). For example, in interior Alaska fire suppression that began in the 1960s has effectively masked the natural fire regime in forests near human settlements and roadways, which together comprise ~17% of the total burnable area in the region (Calef et al., 2008; DeWilde and Chapin, 2006; Todd and Jewkes, 2006). Several authors have remarked on the presence of even-aged forest stands around the city of Fairbanks, Alaska, that germinated in the first half of the 20th century (Duffy, 2006; Fastie et al., 2002; Kurkowski et al., 2008). They infer this was the result of large fires ignited by humans during the gold rush era (ca. 1902–1940), but this disturbance remains anecdotal and predates historical fire records. Recently, Calef et al. (2015) hypothesized that the gold rush legacy is responsible for an increase in annual-area burned within 100 km of Fairbanks since the 1980s because this aging fuel load has become increasingly ripe for fire ignition and spread. If such a situation exists, then the nature of future wildfire regimes in this and other communities with similar histories may be anomalous and require special management practices. Knowing the details of this human–wildfire experiment can also inform us how climate-induced changes in fire frequency and megafire occurrence could affect landscape diversity, vegetation states, and fire activity in more remote boreal ecosystems in the future.
Here we use a combination of high-resolution records including charcoal deposition in annually laminated lake sediment (varves), cambial fire scars in living trees, and historical records of burning to determine the preindustrial FRIs (years between local fires) over the last 500 years. We then quantify how FRIs changed after European settlement of the Fairbanks area starting in AD 1902 and whether this change affected the persistence of the inferred primeval vegetation regime. We demonstrate the varved nature of sedimentation in Ace Lake, establish the chronology for the charcoal record, and then describe the fire history of the area. We test the following hypotheses:
European settlement of the Fairbanks area radically changed the fire regime of the boreal forest there. It caused a large increase in fire frequency.
The vegetation cover in the Ace Lake watershed has remained in its primeval, black spruce–dominated state despite the changes in fire regime accompanying European settlement.
In addition, we discuss the legacy that these large and frequent fire events may have on forest-stand ages and subsequent fire occurrence in the boreal forest.
Study area
The Ace Lake watershed is located 10 km west of downtown Fairbanks, Alaska, at an altitude of 176 m (Figure 1). Fairbanks experiences a subarctic, continental climate with mean July and January temperatures of 17 and −22°C, respectively (Shulski and Wendler, 2007). Ace Lake has a surface area of 7.4 ha, a maximum depth of 8.9 m, and was formed by thermokarst processes (the subsidence of the ground caused by the thaw of ice-rich permafrost). The lake has inputs from both surface and groundwater flow; it is underlain by a talik penetrating through the underlying permafrost (Alexander and Barsdate, 1974; Parsekian et al., 2013). Previous studies have shown the Ace Lake water column remained stratified periodically in the 1960s and 1970s (Alexander and Barsdate, 1974). The surrounding watershed is northeasterly facing and covers an area of approximately 165 ha with an 18.5 watershed-to-lake-area ratio. Vegetation is typical of the upland conifer-dominated boreal forest of interior Alaska, with the dominant tree species being black spruce (Picea mariana Mill.), white spruce (Picea glauca (Moench) Voss), and Alaska birch (Betula neoalaskana Sarg.) (Viereck, 1973). In interior Alaska, topographic settings like that at Ace Lake are typically dominated by black spruce stands that undergo self-replacement after fires (Kurkowski et al., 2008), so we infer this was the primeval condition in the Ace Lake watershed. Permafrost underlies most if not all of the terrestrial watershed, and the active layer (the uppermost layer of the ground that annually thaws and refreezes) is typically 0.3–0.7 m thick, but sometimes >1.5 m thick on well-drained and/or south facing aspects in the watershed. After around AD 1970, a road and several houses were built near Ace Lake, one of which is now located on its southeastern shore.
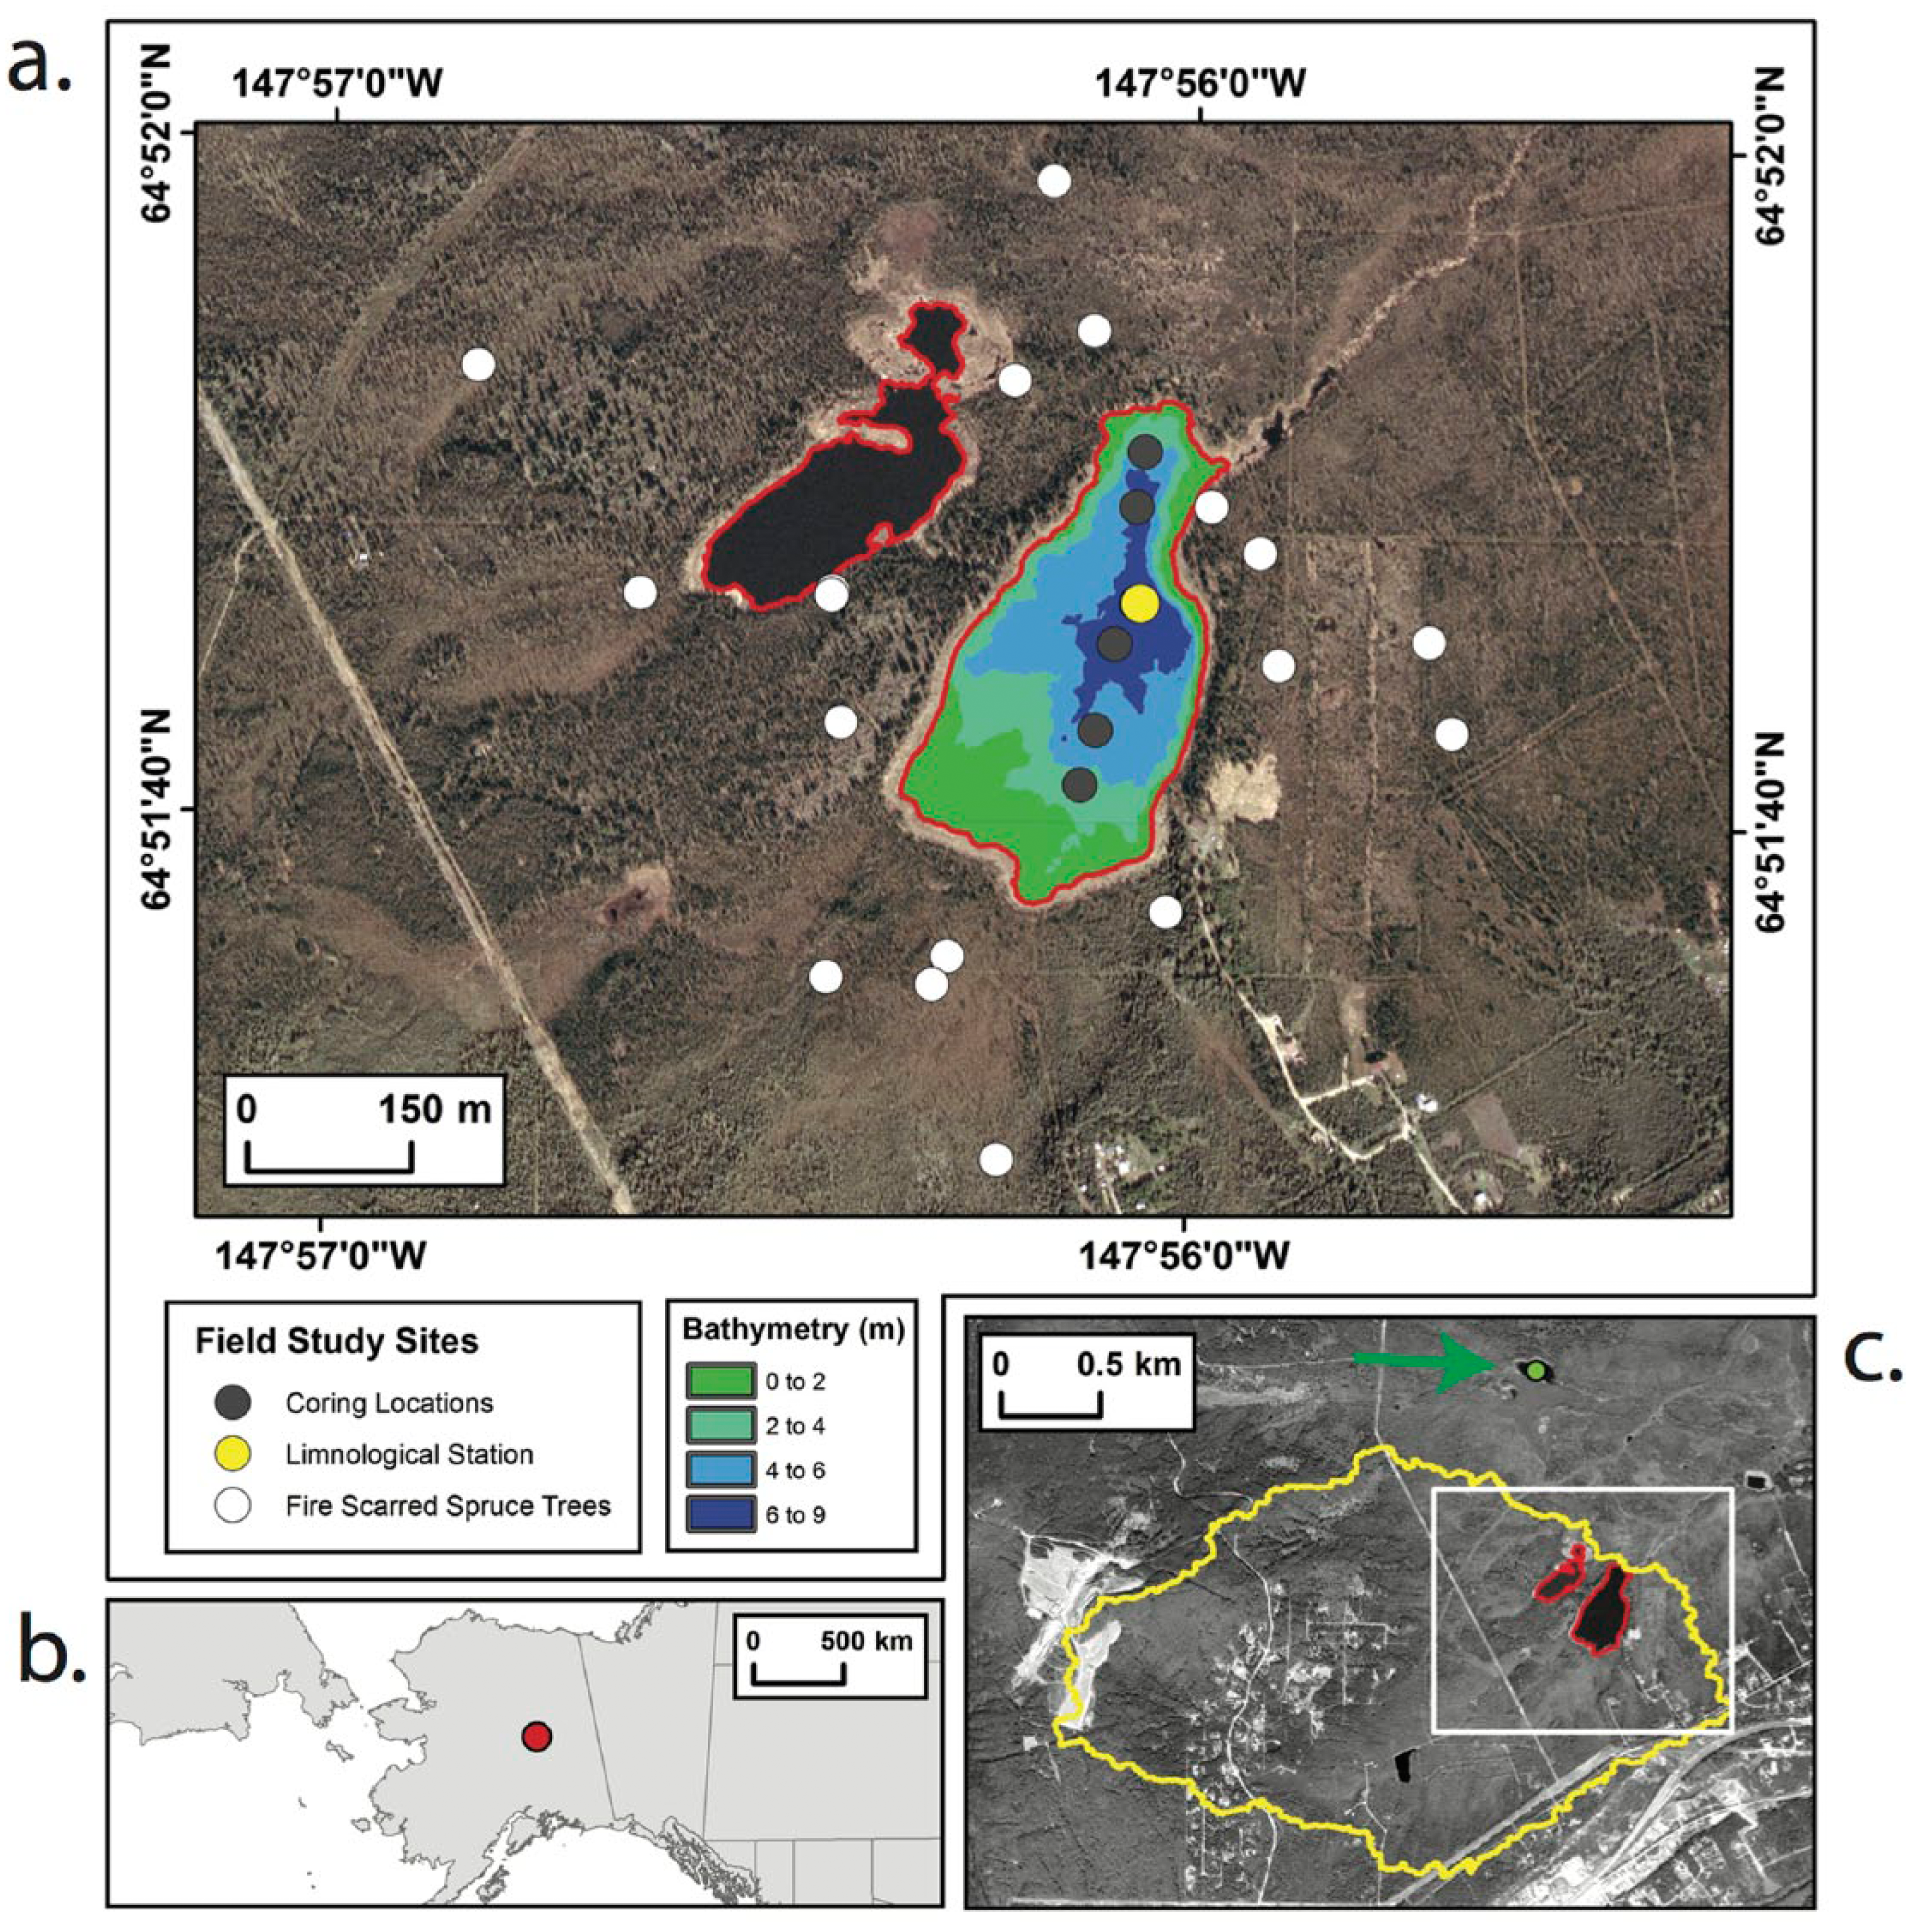
(a) 2007 orthophoto image of Ace Lake (to right) and its watershed with tree and lake sampling locations and lake bathymetry. Core location C is just south of the limnological station (yellow dot). Deuce Lake lies northwest of Ace Lake. (b) Study region. Red dot is the general location of Ace Lake and Fairbanks. (c) 2007 image of Ace Lake with watershed outlined in yellow. Green arrow/dot shows the unnamed lake referred to in Fairbanks New-Miner article (local newspaper) that was used as a water source to put out a wildfire in 1940. White box is the extent of aerial photo in Figure 1a.
Methods
Limnology
To determine whether Ace Lake has maintained conditions that favor the preservation of varved sediment, we measured the stratification of the water column throughout 2013 in the deepest part of the lake (Figure 1). Perpetually stratified lakes are favorable for preserving annual sediment layers because their anoxic bottom waters preclude bioturbation. Furthermore, a lack of lake overturn yields minimal water-current disturbance of the lake floor (Anderson, 1985; O’Sullivan, 1983). Measurements included dissolved oxygen percent saturation, electrical conductivity, and water temperature at 1-m-depth intervals (YSI 6600 v2 hydrological sonde; Xylem Company, White Plains, NY). Dissolved oxygen and conductivity sensors were calibrated using YSI standards.
Sediment coring and geochronology
We collected sediment cores at six locations in the lake using a piston corer fitted with a polycarbonate tube (Wright, 1967; Figure 1). The sediment–water interface of the master core from Location C was preserved with Zorbitrol. The core was then capped in the field and shipped to the National Lacustrine Core Facility (LacCore Laboratory) in Minneapolis, MN, where it arrived without disturbing the sediment. The top 45 cm of the master core from Location C were impregnated with epoxy at the LacCore Laboratory using their standard procedures (http://lrc.geo.umn.edu/laccore/assets/pdf/sops/thinsections.pdf). The samples were then cut into petrographic thin sections with a thickness of 30 µm and mounted onto microscope slides at National Petrographic Laboratories in Houston, Texas. Thin section slides were photographed at 50× magnification spanning the entire length of this core. The depth of the top of each lamination indicative of varve micro-stratigraphy was noted on the photo-mosaics while viewing them through a compound microscope at up to 100× magnification. These counts comprised the varve age–depth model for the entire laminated portion of the master core, which was the uppermost 45 cm. Following standard methods of varve analysis, we assume our estimate of the varve ages includes a 10% error (Ojala et al., 2012; Renberg, 1981).
To test the accuracy of the varve record, another lake-sediment core was taken from Location C (within 2 m of the master core). This core was sampled for 210Pb and 137Cs dating using gamma ray spectroscopy at the US Geological Survey gamma-counting laboratory in Woods Hole, MA. The constant rate of supply model was used with excess 210Pb activities (on a per in situ cm3 basis) to calculate ages of deposition (Appleby and Oldfield, 1978). Radiocarbon samples of macrofossils from nearby cores were assigned a depth in the master core by noting their depth relative to cross-correlated silt units, and then used to build an independent chronology of sediment accumulation. Care was taken to date delicate macrofossils (i.e. birch seeds, spruce needles) representing primary deposition and not macrofossils that are more likely to be reworked (i.e. large pieces of wood). This chronology was constructed for the laminated portion of the core and used to compare with the varve chronology. All 14C samples were analyzed at the National Ocean Sciences AMS facility in Woods Hole, MA, or at the Beta Analytic Laboratory in Miami, FL, and calibrated using the IntCal 13 curve (Reimer et al., 2013). We used the BACON (‘Bayesian accumulation histories’) modeling package in R statistical program software (©2012 R Inc.; R Core Team, 2012) to build an age–depth model for the Location C cores based on the 14C ages of terrestrial plant macrofossils and 210Pb and 137Cs chronologies (Blaauw, 2010). We rejected plant macrofossil dates that were sampled from lake cores along the lake margins (i.e. Supplemental Table 1, available online: ‘From a distant core’; Figure 3b: gray bars), and non-delicate macrofossils such as large woody debris that have a high likelihood of being reworked from soils (i.e. Supplemental Table 1, available online: ‘Low-delicacy grade’; Figure 3b: gray bars).
Paleo-wildfire reconstruction
We sampled 15 living spruce trees around Ace Lake that had basal scars indicative of fire damage (Schweingruber, 1988). We sampled fire scars in a spatially uniform manner around Ace Lake (Figure 1). Fire scars were rare, so we sampled every one we saw during extensive surveys. Cross-sections were incrementally sanded with up to 400-grit sand paper. We attempted to visually cross-date cross-sections using skeleton plots (Stokes, 1996) and a 1966 marker year found in a nearby black spruce tree-ring series (Wolken et al., 2013); however, we found visual methods for cross-dating to be ineffective because of reaction wood caused by unstable ground and asymmetrical growth due to fire scars. Individual rings were measured at a 0.001-mm resolution on a Velmex measuring system with Measure J2X software. To correct for missing rings and counting errors, we measured ring widths on at least two radii on 13 of the 15 cross-sections and then cross-dated the ring series using the COFECHA program (Grissino-Mayer, 2001; Holmes, 1983). Cross-dating statistics can be found in supplemental material, available online. We dealt with anomalous tree-ring widths around fire scars by measuring multiple radii on each tree. At least one radius was in a portion of the cross-section not containing the fire scar. A total of 10 trees with at least one cross-dated radii were used to infer local wildfires. Three additional trees that had scar ages that agreed with those scar ages on cross-dated trees, but did not cross-date with them were included in fire-scar counts. We interpreted a scar to indicate a wildfire when at least three different trees agreed on the same scar-year, or in the case of the AD 1940 fire, two trees and a historical record indicating a nearby fire. Historical records (including newspaper reports and the Alaska Inter-Agency Coordination Center (AICC) wildfire history database; http://afsmaps.blm.gov/imf/imf.jsp?site=firehistory) as well as aerial imagery from different years were used to constrain the timing and extent of wildfires within a 10-km radius of Ace Lake since 1940, and within a 100-km buffer of Fairbanks since 1950.
We used a variation of the Clark (1988a) method to quantify charcoal in varved lake sediment. We identified charcoal in thin sections as dark, opaque, shiny, and often-angular fragments that typically had visible cell structure. To detect the timing of local fires occurring near Ace Lake, we counted macroscopic charcoal fragments (in this case, >50-µm long axis diameter) under 100–250× magnification and measured their area in cross-section using the Olympus Cell Sens Standard XV microscope imaging software (©2011). These measurements were conducted every 1 mm in depth across the thin section width of 2 cm, and each depth was assigned a corresponding varve year.
We calculated macroscopic charcoal influx (charcoal area/cm2 of sediment/yr) using the CharAnalysis program developed by Higuera et al. (2009), which was run using MATLAB software (MATLAB version 7.10.0, 2014). Local fires were identified when high-frequency charcoal peaks exceeded the variability of low-frequency background levels. We used a Locally Weighted Smoothing Spline (LOWESS) robust to outliers with a time window span of 150 years to estimate background charcoal flux. This span was chosen because it is within the suggested 2–5× the mean FRI for the region and vegetation type (~43 years based on Yarie, 1981), and yields a sufficient signal to noise ratio, a measure of how much the peak charcoal fraction exceeds the background levels (Higuera et al., 2009; Kelly et al., 2011). We used the 99th percentile of this background variability to calculate the thresholds that charcoal peaks were required to exceed in order to be identified as local fires occurring in the past. CharAnalysis requires the selection of a consistent sampling interval to interpolate the raw charcoal record (Higuera et al., 2009). We chose an 8-year interpolated window length because it identified the timing of significant charcoal peaks which correspond to fires from the tree-ring and historical records, and it also minimized the occurrence of false positives or peaks not observed in these records. The depths of charcoal peaks that corresponded to known wildfires were also used as temporal benchmarks for the radiometric age–depth model we compared with the varve record. We removed charcoal fractions that were embedded in turbidite deposits for each peak to minimize the potential for false positives, which occur when reworked charcoal is included in the analyses. If these vetted charcoal peaks still exceeded the threshold value, it was deemed a confirmed peak. Because charcoal deposition tends to continue for several years following a fire (Whitlock and Millspaugh, 1996), we considered two, nearly adjacent peaks to be one fire event when the sample point between these two peaks did not fall below the background charcoal estimated from the same level. We estimated post-AD 1902 FRIs using the fire dates derived from the fire scar and historical records. For the years prior to AD 1902, we calculated the intervals between fires as the time in varve years between significant charcoal peaks.
To test whether European settlement affected FRIs during the gold rush era, we used the modeled probability density of the preindustrial (AD 1520–1902) FRIs to compare with each FRI that occurred during European settlement (AD 1902–1940). A mean Weibull distribution with a 95% error was fitted to the prehistoric fire frequency (n = 6) using maximum likelihood techniques. Because the number of FRIs was low (n = 6), we also used bootstrap resampling techniques to generate 10,000 random FRIs that encompassed the range of prehistoric FRIs. Each FRI occurring after AD 1902 was then compared with the probability density of both the fitted preindustrial Weibull curves. Post-European fire-free intervals that had a probability of <0.05 in both Weibull curves and errors were considered to be significantly less than the preindustrial FRIs. We also calculated the probability of another fire occurring around Ace Lake in AD 2015 by calculating the probability of fire since the last event.
We used two approaches to assess how levels of fire activity have changed for the region around Ace Lake. (1) We smoothed the background levels of macroscopic charcoal using a 50-year LOWESS window and an 8-year sampling window. We did not use the Higuera et al. (2007) smoothing window recommendation of >10× the mean FRI (in this case, ~500 years) because our goal was to assess the decadal changes of fire activity before and after the European settlement of Fairbanks. (2) We also used the 50-year LOWESS smoothed microscopic charcoal counts (number of pieces <50 µm in diameter as viewed in thin sections) that had a 5-year interpolated sampling window. Although these microscopic pieces are viewed in cross-section and some small pieces could have axes much larger than measured, this index potentially incorporates additional local to regional fires around Ace Lake because smaller pieces are likely to travel further from fires (Clark, 1988b).
Land cover classification
Land cover in the Ace Lake watershed was derived from the National Land Cover Database 2011 (NLCD 2011, US Geological Survey, 2015). The NLCD 2011 data were clipped to the extent of the Ace Lake watershed and then summarized according to the eight cover types present in the study area.
Results
Limnology, sedimentology, and geochronology
Limnological observations support the idea that persistent anoxic bottom waters in Ace Lake preserve annual sedimentation. Seasonal changes in the physical and chemical characteristics of the water column in the deepest point (8.9 m) indicate that the lake failed to overturn in 2013 (Supplemental Figure 1, available online). The lake was not thermally stratified during the shoulder seasons of May and October; however, the hypoxic/anoxic hypolimnion was never replenished with oxygen. In spring, this was because of the persistence of an ice cover that protected the water column from wind disturbance. In October, the calm weather, a wind-protected lake basin, and a minor solute-driven density gradient in the water column (shown in the conductivity graph) resisted wind-driven overturn (Supplemental Figure 1, available online).
The core stratigraphy, where two different modes of deposition are evident, provides direct evidence that the fine laminations found throughout the upper 45 cm reflect annual sedimentation in Ace Lake. The first mode is the annual deposition of the varves, which consist of abundant laminae and occasional beds of sediment (0.9-mm mean; range of thicknesses: 0.1–30 mm) (Figure 2). Each varve consists of layered, organic-rich algal material, often capped by a layer of silt (Figure 2). Different layers within the algal material probably represent a succession of algae taxa blooms over the course of the open water season (Alexander and Barsdate, 1974). The silt units derive from the second sedimentological process in the Ace Lake basin involving thaw-driven debris flows from the nearshore into deeper areas. Five turbidites (>1 cm) distinguished by their silty sediment and fining upward structures were laid down in the laminated portion of the master core at Location C during episodes of lake expansion.

Close-up of a thin section from the laminated portion of the sediment record from Ace Lake pointing out some of the common features, including varves with silt layers (bottom left) and charcoal fragments (right). Top left: Scale bar is 1 cm for thin section overview. Bottom left: Scale bar is 1 mm.
A total of 493 algal-silt layers occur in the top 45 cm of the core from Location C (Figure 3). This varve chronology and its 10% error envelope overlap with the 210Pb, 137Cs, and a charcoal-peak chronology at depth levels of 5–16 cm (AD 1969–1900; Figure 3). In addition, the 137Cs spike corresponding to the peak of nuclear bomb testing in AD 1963 occurs at the depth of 7 cm, which has a varve age of AD 1962 ± 5 (Figure 3). Overall, the varve chronology is consistently younger than the 14C-dated portion of the radiometric age–depth model (17–25 cm) by an average of 122 years (ranging from 80 to 160 years younger; Figure 3; see Supplemental Table 1, available online for individual dating results). As discussed below, the varve chronology is more reliable and precise than 14C ages from a thermokarst lake. Therefore, we use the varve chronology as the age–depth model for ~493 years of fire history near Ace Lake.
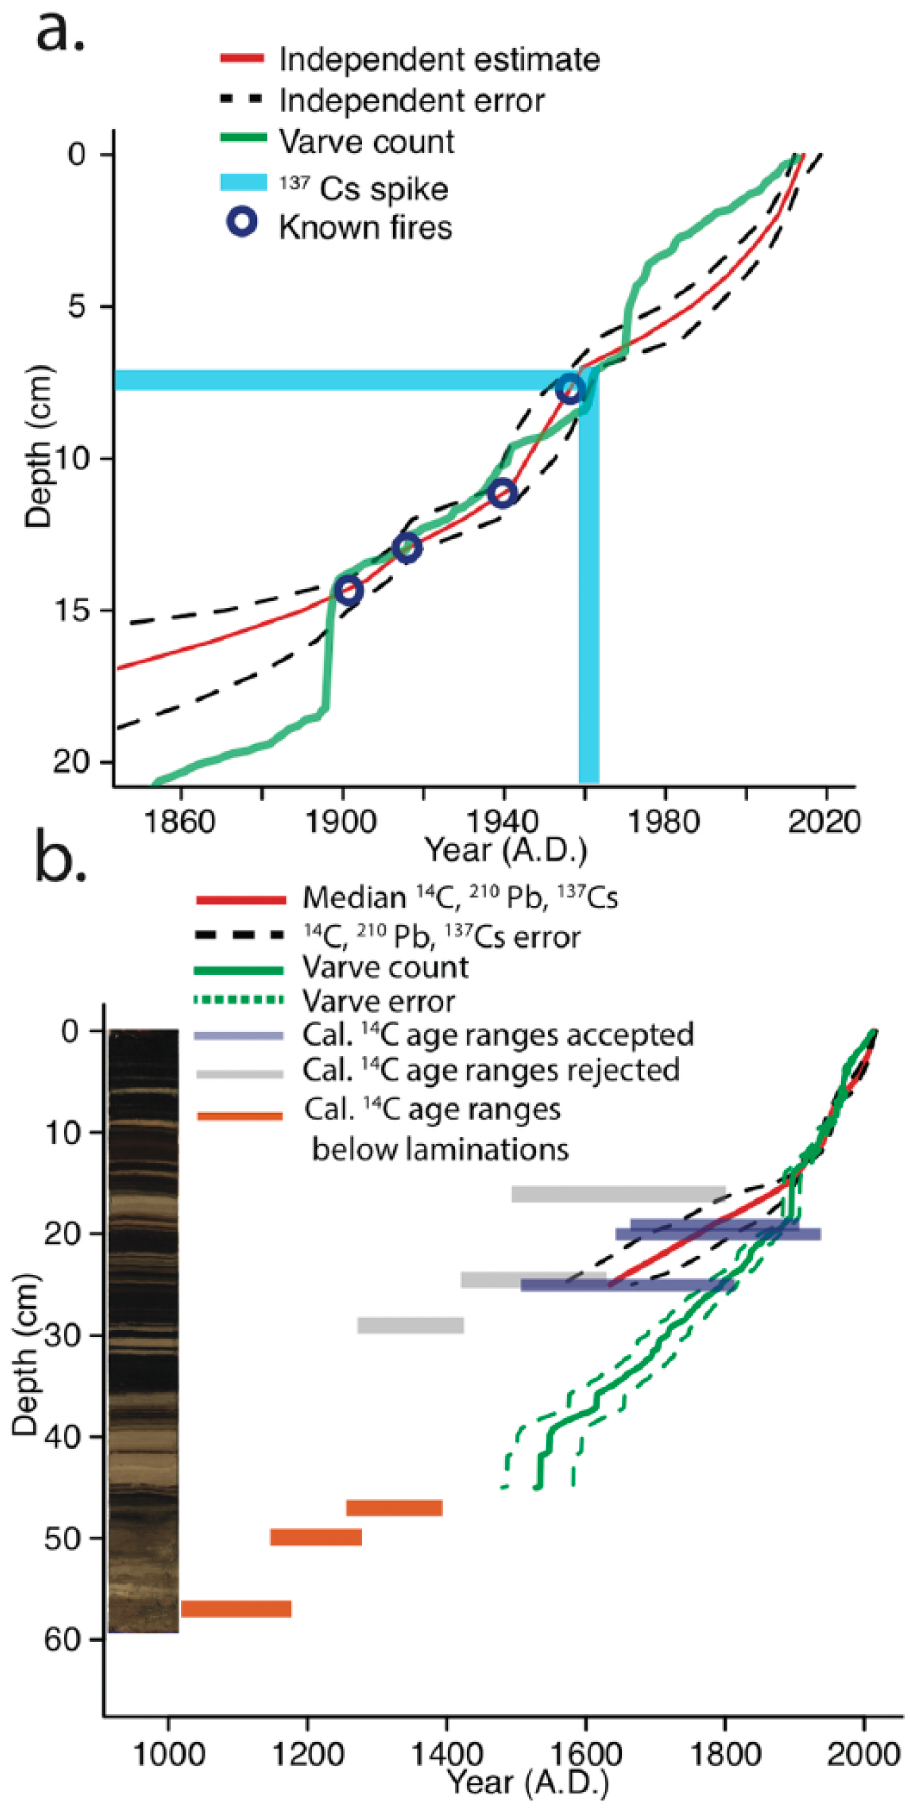
(a) Radiometric and varve age–depth model since AD 1850. (b) Core photo from core location C with age–depth modeling results since AD 1500.
20th-century fire records
Fire-scarred black spruce trees and historical records register three wildfires during the 20th century in the Ace Lake watershed. The fire-scar ages and number of trees scarred by each of these fires are AD 1903 (n = 5), AD 1914 (n = 6), and AD 1940 (n = 2) (Supplemental Figure 2, available online; Figure 4). The Fairbanks Newsminer (local newspaper) reported that on 25 June 1940, the Alaska Fire Control Service extinguished a wildfire of unknown origin ~3/4 mile southeast of the Grant Mine using a nearby lake as a water source (Figure 1; Newsminer Staff Writers, 1940). The lake involved was 1 km north of Ace Lake, and the reported fire probably is the same as the one that caused the scarring of two nearby black spruce trees that year (Figure 1, Supplemental Figure 2, available online). Three significant charcoal peaks occur in sediment layers corresponding to 8-year windows of varve years AD 1894–1901, 1910–1917, and 1925–1933 (Figure 4). Each charcoal peak is within an estimated 7 varve years of the fires registered by tree scars in the watershed. The only substantial wildfire within a 10-km radius of Ace Lake reported in the AICC wildfire history database was the human-caused ~1000-ha ‘Goldstream Fire’ that burned to within ~5.5 km northeast of Ace Lake between late-May and mid-June 1958 before it was suppressed. A significant charcoal peak was found in sediment layers that correspond to varve years AD 1965–1973. The timing of the AD 1973 peak also corresponds with local inhabitants building houses, clearing land, potentially starting brush fires, and heating with wood in the area surrounding Ace Lake. We omitted the post-1970 portion of the macroscopic charcoal record because of the likelihood of contributions from point source burning in addition to wildfires.
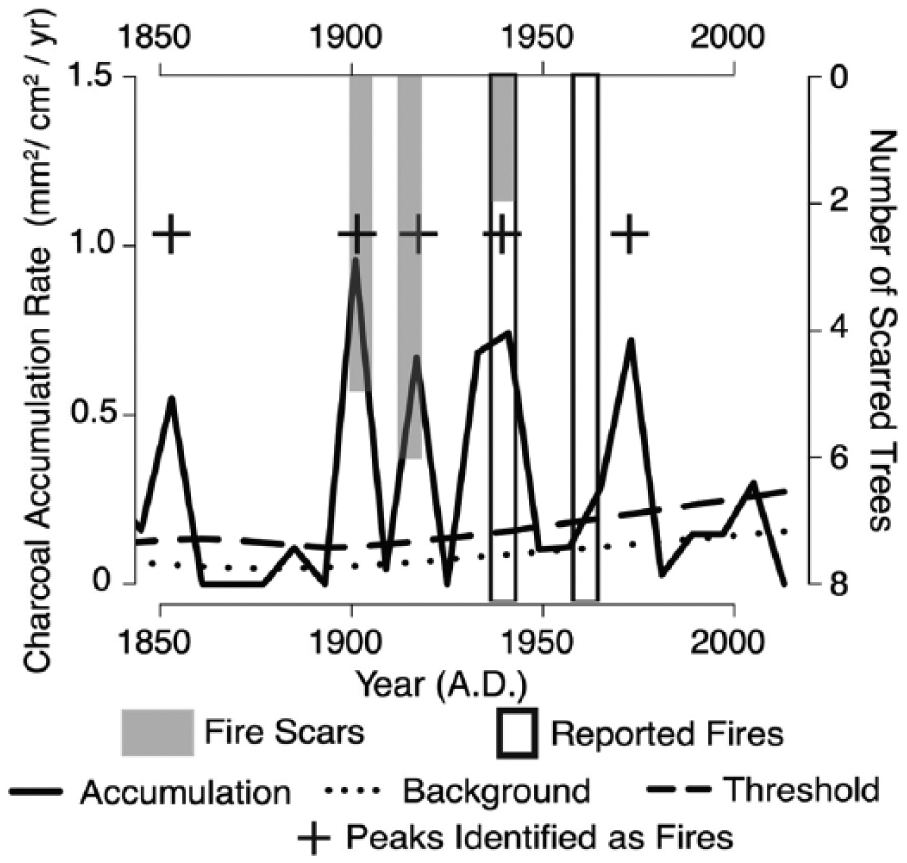
Histogram time series of fire-scarred spruce trees and timing of historical records of wildfires since AD 1850 (right y-axis). Left y-axis is time series of macroscopic charcoal since AD 1850 with smoothed charcoal components and inferred charcoal peaks.
Synthesis of fire history
Intervals between the seven preindustrial fires ranged from 33 to 80 years (58-year mean; 40- to 77-year 95% range; Figures 5 and 6). During the 20th century, intervals between the three fires were 11 and 26 years (18-year mean; Figures 5 and 6). The 11-year FRI representing the time between the 1903 and 1914 fires had a <0.05 probability of being within the preindustrial FRI-based Weibull distributions (Figure 6). The 26-year FRI representing the time between the 1914 and 1940 fires had a maximum possible probability of 0.21 to burn based on the preindustrial FRI Weibull curves. We conclude that FRIs during the gold rush era are outside the preindustrial range and one was outside the 95% confidence interval of the preindustrial FRI estimates.
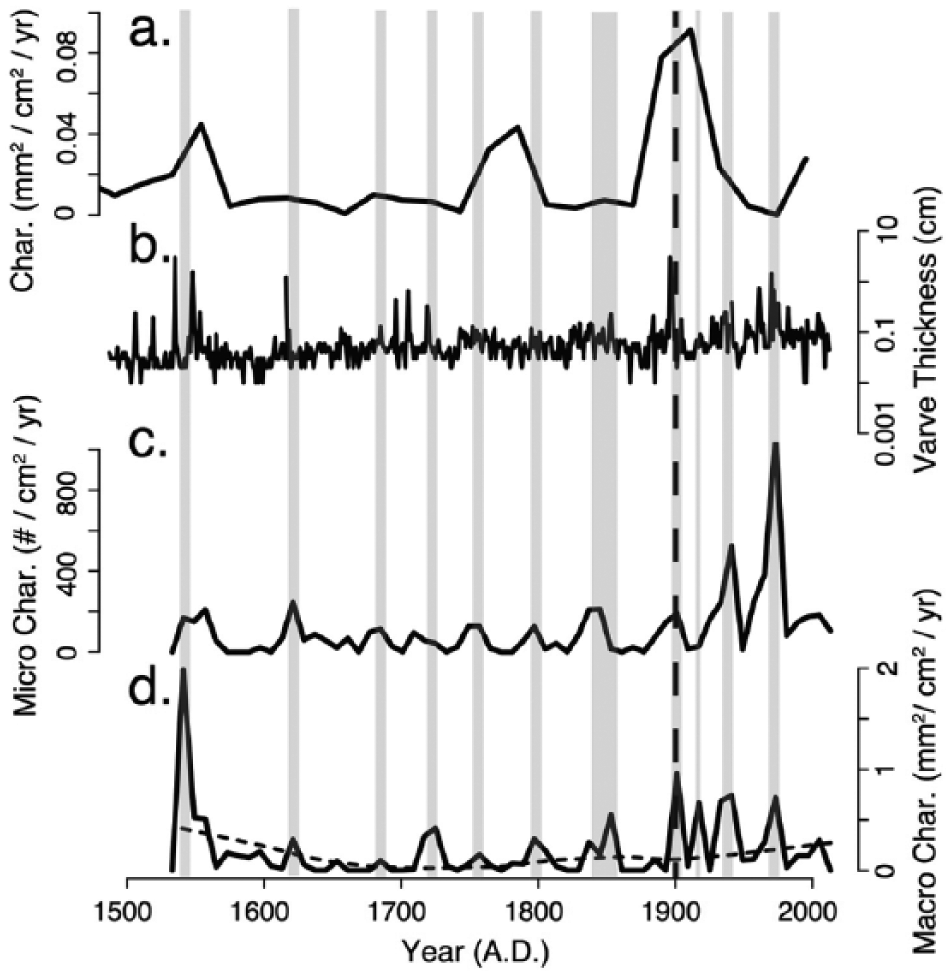
Wildfire record of the Ace Lake watershed over the last 493 varve years: (a) sedimentary charcoal record from nearby Deuce Lake sediment. Interpolated window size is 21 years (Lynch et al., 2002); (b) varve thickness on a log scale; (c) 8-year micro-charcoal record (
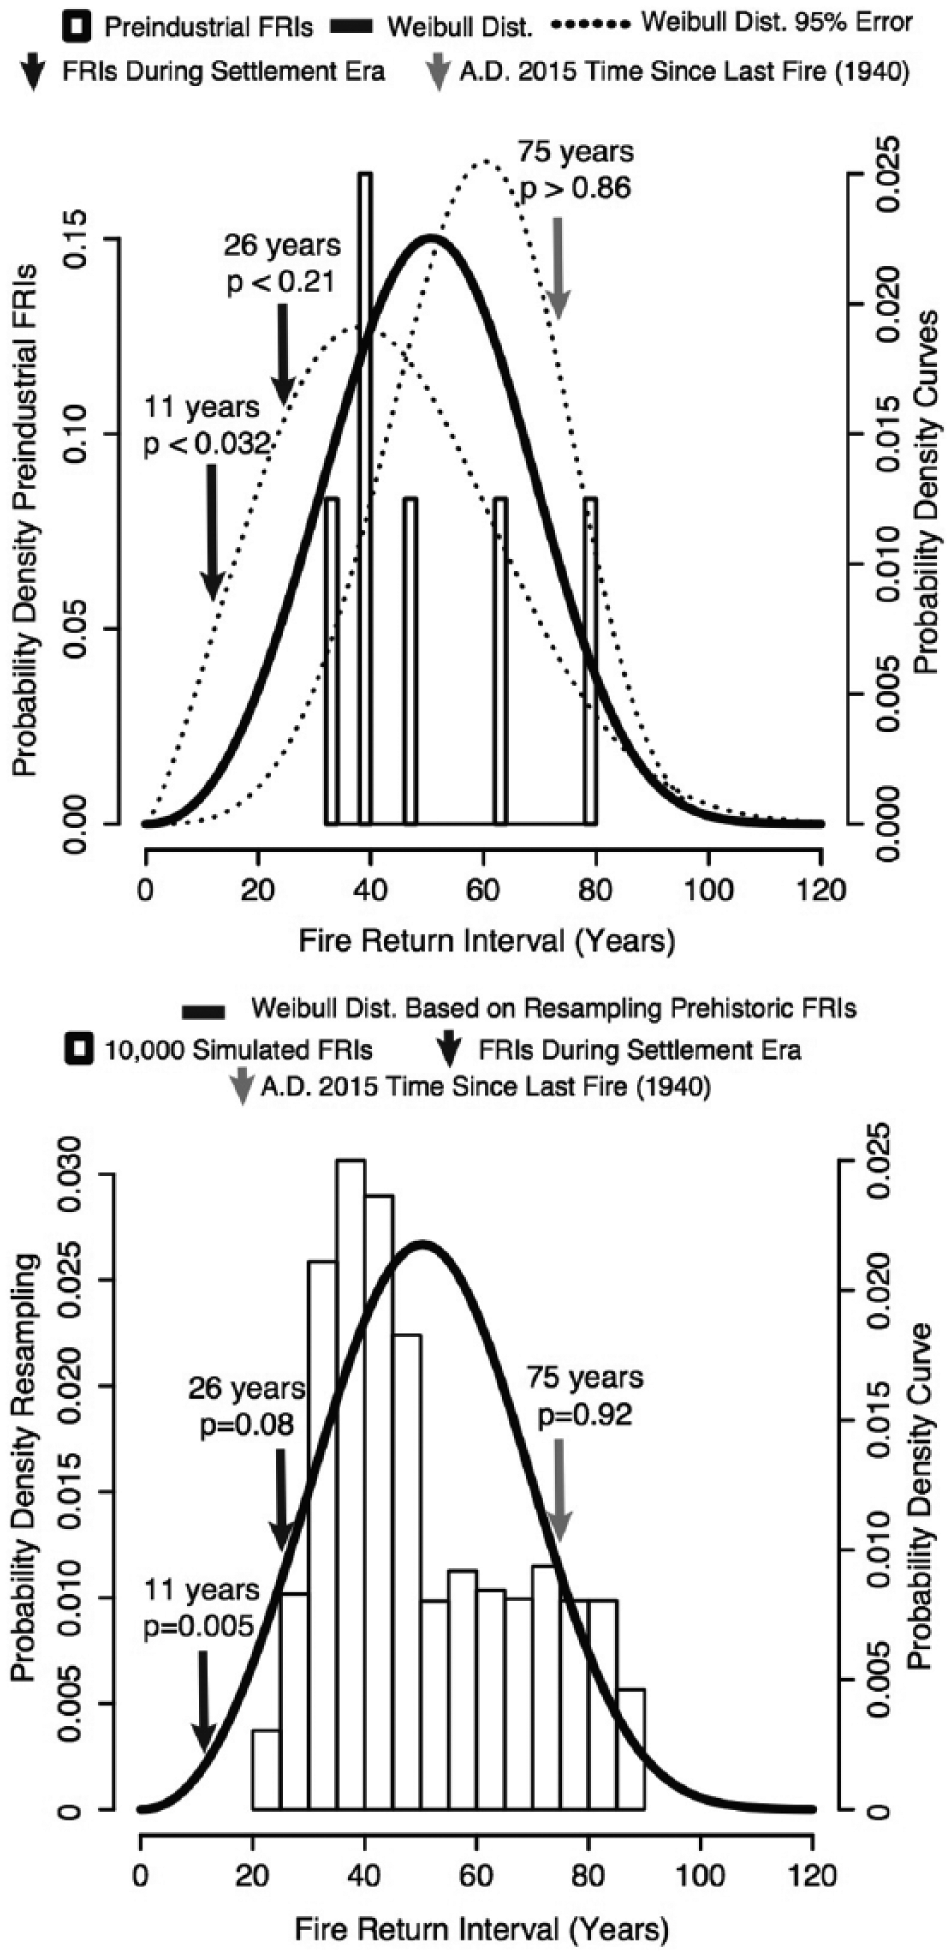
Observed and resampled preindustrial FRIs compared with 20th-century FRIs. p values are the probability of burning for each gold rush era FRI using the error on either end. p value for the gray arrow is the probability of another fire happening in the study area in AD 2015 if fire suppression was not enforced. Error for resampled Weibull curve overlaps with the mean curve.
Background accumulation rates of macroscopic and microscopic charcoal also show enhanced wildfire activity during the gold rush era. The smoothed background pattern of microscopic charcoal fluctuated between 7 and 65 pieces/cm2/yr with a mean of 36 pieces/cm2/yr between AD 1533 and 1878 (Figure 7). In contrast, the 20th-century mean is 139 pieces/cm2/yr or about 4× the prehistoric mean (Figure 7). After AD 1960, the accumulation of microscopic charcoal declines to around 3× that of the prehistoric mean. The background accumulation rates of macroscopic charcoal also show heightened post-settlement charcoal levels, but not without precedent (Figure 7). Comparable levels occurred in the AD 1500s, although these occurred in the early part of the record and are subject to edge effects of smoothing curves. However, the raw macroscopic charcoal levels also peak during this time, which could suggest an anomalously severe or large fire event near Ace Lake around that time. The peak and decline of background macroscopic charcoal levels preceded those of microscopic values by peaking in AD 1933 and then declining dramatically back to prehistoric levels (Figure 7).
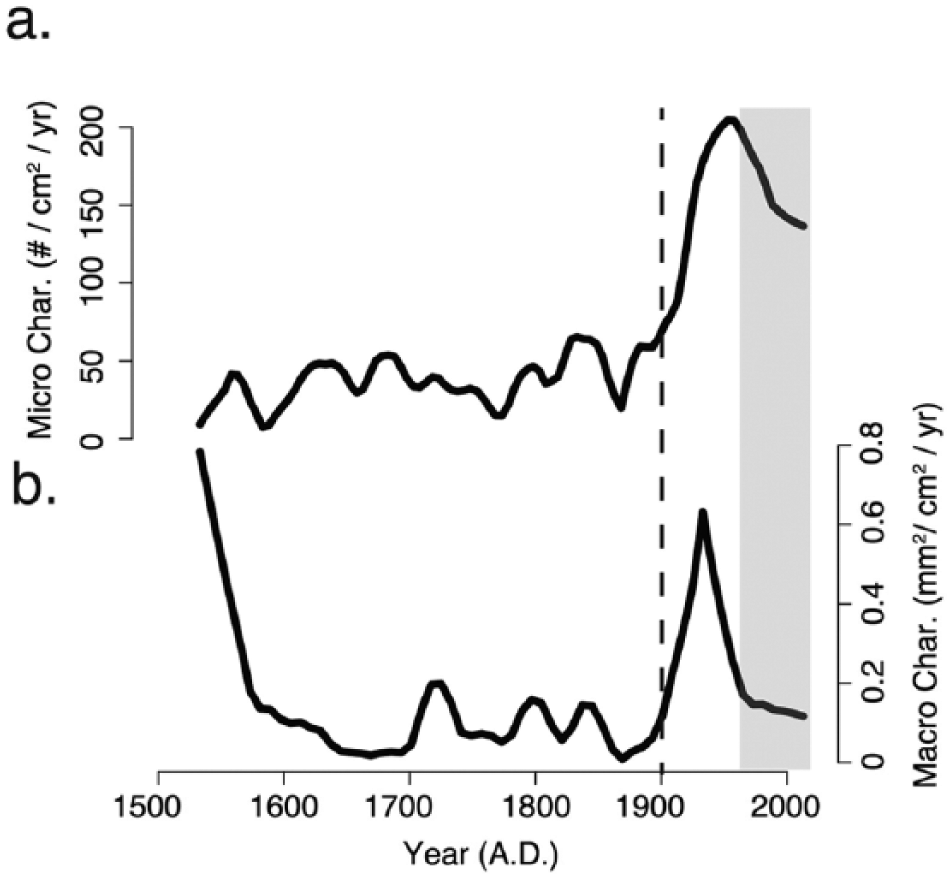
(a) Background micro-charcoal record using a 5-year interpolated window and a 50-year LOWESS smoothing method to infer regional intensity of wildfire activity. (b) Background macro-charcoal record using an 8-year interpolated window and a 50-year LOWESS smoothing method to infer extent of burning within ~10 km of Ace Lake based on (estimated extent based on Higuera et al., 2007; Kelly et al., 2013). Dashed line shows when Fairbanks was founded. Gray shading encompasses the period when fire suppression was greatly expanded.
Recent fires’ effects on land cover
The spatial distribution of fire scars suggest that the AD 1903 and 1914 fires encompassed the area around the lake, and that the AD 1940 fire was confined to the east and north of Ace Lake (Supplemental Figure 2, available online). Most of the Ace Lake watershed burned three times between AD 1903 and 1940, and the rest of the watershed burned twice. The dominant categories of vegetation cover of the areas known to have burned two and three times between AD 1902 and 1940 include evergreen forest (66%), woody wetlands (11%), and mixed forest (6%) (within 1 km of Ace Lake; Table 1; US Geological Survey, 2015). The vast majority of evergreen forest and woody wetlands are composed predominantly of black spruce stands in which heath shrubs (Ericaceae) and feather mosses (Hylocomiaceae and Hypnaceae) dominate the understory. Aspen (Populus tremuloides Michx.) is extremely rare in the watershed, and grass communities (Poaceae) are absent. These results suggest no lasting change in nearby vegetation despite higher fire frequency during the gold rush era.
Land cover classification of area within 1 km of lake center. Bold values are forest types dominated by black spruce. Bold values denote those land cover types that are primarily composed of black spruce forests, the inferred primeval forest type in the area around Ace Lake.

Based on the National Land Cover Database 2011 (US Geological Survey, 2015).
Is the current FRI significantly different than the preindustrial one?
As of 2015, it has been 75 years since a large fire (>10 ha) occurred near Ace Lake. Based on the prehistoric distribution of FRIs and the time since last fire (1940–2015), the area around Ace Lake is approaching a significantly longer FRI than the preindustrial FRI range (40–77 years) over the last 500 years (p of 0.86 in 2015; Figure 6).
Discussion
Reliability of the varve-count chronology
The varves in Ace Lake are of the biogenic/clastic type where a succession of algal blooms are laid down in early summer, followed by silt settling after late-summer rainstorms, nearshore erosion, and the establishment of homoisothermic conditions that allow fine particles to settle (Anderson, 1985; Ojala et al., 2012; O’Sullivan, 1983). The varve-count chronology agrees closely with both the 210Pb/137Cs-based chronologies and the timing of past wildfires reconstructed from fire scars and historical records. Further down-core, the varve-count ages may diverge from 14C ages for several reasons (Figure 3). One possibility is that varves were under-counted because of their removal by erosive debris flows (Allen, 1985), or because of our inability to detect all the algal laminae, which are faint in some parts of the core. We rule out the erosive effects because the size of cut-and-fill features on the basal contact of turbidite deposits are of millimeter scale and so likely only represent a few missing varves. Faint varves are also unlikely to be significant because they represent only a few small sections in the record. These were probably times when the lake experienced overturn and sediment mixing, but do not represent more than a few decades if missing varves are the same thickness as visible varves. The most likely cause for the 14C/varve-count offset relates to the fact that the 14C ages of plant macrofossils tend to overestimate the age of sediment layers because plant litter is often stored temporarily on land before deposition in a lake (Oswald et al., 2005). This is particularly likely at Ace Lake because of the low-angle, densely vegetated, organic soils covering the watershed. Also, the ongoing thermokarst occurring in this expanding lake basin continually mines older organic matter from nearshore deposits as well as from the surrounding permafrost. In several boreal lakes of Sweden, Zillén et al. (2013) also observed that 14C chronologies based on macrofossils were older than varve age estimates and were likely reworked. We do not think this reworking process affects the charcoal record because discreet peaks were correlated with local wildfires, and none of the significant peaks that we detected relied on charcoal that was embedded in reworked, turbidite units. If the varve-count chronology does in fact underestimate the sediment age, this would make us tend to underestimate FRIs in the older, preindustrial part of the record, but not the gold rush era when varve counts agree with independent age estimates. If this is the case then the contrast between fire regimes during pre-and post-European settlement is even greater than what we describe in the following sections.
Preindustrial FRIs
FRIs before European settlement span from 33 to 80 years, which is consistent with dendrochronology-based FRI estimates from interior Alaska, ranging from 40 to 200 years depending on region and vegetation type (Drury and Grissom, 2008; Mann et al., 1995, 1999; Viereck, 1973; Yarie, 1981). FRIs derived from lake charcoal records in comparable bioclimatic zones are also consistent with those found in Ace Lake during the preindustrial record. Kelly et al. (2013) estimated a mean FRI of ~50–200 years over the last 3000 years across a large area in the Yukon Flats region of Alaska. The Yukon Flats region north of Fairbanks is one of the most dry and flammable places in the boreal forest (Kelly et al., 2013), which suggests that local FRIs around Ace Lake are also on the low end for the entire biome. This is likely because of the post-fire self-replacement of flammable black spruce forests that commonly occurs in northeasterly facing areas of interior Alaska like the Ace Lake watershed (Kurkowski et al., 2008). Despite these trees being slow growing, their abundant ladder fuels (Viereck, 1973), dryable understory fuels (De Groot and Pritchard, 2009), and biophysical feedbacks to encourage lightning strikes (Krawchuk et al., 2006) contribute to relatively short FRIs, which is supported by modeling results (Rupp et al., 2002), and paleo-fire records (Higuera et al., 2009; Lynch et al., 2004), including our results.
The Ace Lake fire record also illustrates how sampling resolution affects FRI estimates in lake charcoal records. Sensitivity tests using our data show that as the interpolation window is widened, fewer fires and longer FRIs are identified from the same charcoal time series (Supplemental Figure 3, available online). An indicator of this is the relatively smoothed (window length of 21 years) wildfire record from Deuce Lake (adjacent to Ace Lake) reported by Lynch (2002) (Figures 1 and 5). There, CharAnalysis methods using the same parameters as the Ace record identifies no significant charcoal peaks in the last 500 years even though we know at least three fires occurred within 1 km of that lake since 1902. Thus, the fine temporal resolution in the fire record would be lost without high-resolution sampling, thereby limiting our understanding and quantification of the FRIs.
The causes and extent of 20th-century changes in wildfires
The discovery of gold in the Fairbanks area in AD 1902 triggered rapid changes in the size, ethnicity, and fire usage of its human population. Population estimates prior to European settlement are only around 500 people over what is now roughly the Fairbanks North Star Borough, an area of 19,280 km2 (Langdon, 1994). Natcher et al. (2007) reported that Athabascan groups relied heavily on terrestrial resources and used fire to clear land to promote favorable habitat for moose and caribou, but this was likely done on a minor scale. Human activity directly around Ace Lake in late-prehistoric times was probably minimal because it is well away and not easily accessible from the resource-rich Tanana River where pre-European human activity is abundantly documented (Potter, 2007).
Prospector, Felix Pedro discovered gold near Fairbanks in the summer of 1902 (Cole, 1984, 2008). The resultant gold rush was accompanied by an influx of Caucasians and Asians, increasing the population of the Fairbanks mining district to ~7700 by 1910 (US Census Bureau, n.d.). Miners are known to have used fire in a variety of ways. Fires were initially used to thaw vertical shafts through near-surface layers of frozen silt in order to reach the underlying gold-bearing gravels (Cole, 1984, 2008). Settlers also set wildfires around populated areas to ease firewood collection because burning helped to de-limb and dry spruce trees prior to harvesting for fuel (Lutz, 1959). Fires were also set to improve moose habitat, to clear land, and in vain attempts to reduce the mosquito population (Lutz, 1959). Ace Lake was located close to mining activity, and it is probable that humans started all of the 20th-century wildfires. For example, the timing of the AD 1903 fire coincides with the construction of the nearby Chena–Fairbanks trail when several hundred miners arrived in the Fairbanks area that summer from the Klondike (Supplemental Figure 4; Cole, 1984). The timing of the local AD 1914 and 1940 fires correspond to the initial lode mining activity in the Ace Lake area during the 1910s and the subsequent resurgence of activity from the late-1930s to 1941 (Warfield and Thomas, 1972). The increase in background charcoal beginning around AD 1900 and peaking in the mid-20th century at Ace Lake also coincides with human population growth and mining activity in the region (Cole, 1984, 2008; US Census Bureau, n.d.). Our fire record from Ace Lake supports the suggestion that the early 20th century saw enhanced wildfire activity in the Fairbanks area because of human activities (Duffy, 2006; Fastie et al., 2002; Kurkowski et al., 2008).
Human ignitions during exceptionally warm and dry years caused large areas around Fairbanks to burn multiple times in the years between AD 1900 and 1940. These burns reset post-fire succession and synchronized the fuel load that has accumulated up to today. Duffy (2006) observed the effects of this pattern in the near-absence of tree-stand age cohorts about 60 km north of Fairbanks dating to between AD 1882 and 1912. Similarly, both Fastie et al. (2002) and Kurkowski et al. (2008) observed that most forest stand ages within 40 km of Fairbanks were established shortly after AD 1930, which indicates widespread disturbance just prior. These observations support the interpretation of the charcoal rise in our background micro- and macroscopic charcoal records indicating that the gold rush impact on fires was regional and not limited to the Ace Lake watershed. Maps from AD 1911 indicate that people were actively mining and working in an ~2000-km2 area of interior Alaska, and observations indicate that most of this region was burned and/or logged over a 40-year period (Supplemental Figure 4, available online; Cole, 1984, 2008). To put the size of this impact in perspective, the Taylor Complex fire, the largest on record in Alaska, is estimated to have burned 5284 km2. After this period of widespread disturbance, background macroscopic and microscopic charcoal accumulation rates decline, coinciding with enhanced fire suppression efforts beginning around 1960 (Todd and Jewkes, 2006).
Testing the response of black spruce regime shifts to fire frequency changes
The frequent and large wildfires observed in the Ace Lake record during the early 20th century serve as a test for how Alaska’s boreal forest might respond to future warming. Many researchers predict that more frequent megafire seasons caused by warmer and drier summers could tip Alaska’s boreal forest into a new ecological regime (Beck et al., 2011; Mann et al., 2012). Today, much of interior Alaska is covered by black spruce forests underlain by thick, moist, organic soils, although recent observations and modeling have detected an increase in deciduous forests (Mann et al., 2012). Together this conifer vegetation and its soils have the tendency to undergo self-replacement after fire disturbances, which endows the current ecosystem with internal feedbacks maintaining its persistence (Johnstone et al., 2010; Kurkowski et al., 2008; Viereck, 1973).
Even after the surge in burning between AD 1902 and 1940, the black spruce regime, which is the inferred primeval forest type, is firmly in place at Ace Lake, as evidenced by abundant black spruce trees, thick organic soils, and thin active layers covering the watershed today. We currently do not have any evidence that other forest species like birch and white spruce regenerated directly after gold rush fires, and a number of observations suggest black spruce has been continuously dominant since the last fire occurred ca. 1940. These include (1) aerial photos from 1966 that show a forest structure very similar to today’s. (2) The fact that many black spruce trees in the watershed are mature trees with well-developed lichen communities on their branches, and growing on thick organic soils and moss layers. (3) In the black spruce forests today, there are very few dead snags of birch, whose presence would suggest that the present forest replaced an intermediate successional sere that no longer occurs. Based on this, we think the black spruce vegetation present today was likely present through most of the 20th century.
The predicted regime shift has not occurred around the Ace Lake watershed, even after the fire frequency increased by 3×. An ecological regime shift capable of overcoming the ecological inertia and replacing black spruce with deciduous trees at a site like the Ace Lake watershed will require even more radical or persistent changes in climate and fire regime than those experienced in areas intensely affected by European settlement. Although it should also be acknowledged that the frequent fires occurring during the gold rush may have been less severe than typical megafires because human-caused fires often occur on shoulder seasons when fuels are not fully dry (Ott and Jandt, 2005). Our results support those of Johnstone et al. (2010) and Kelly et al. (2013) that fire severity increases may be more important than frequency in removing the black spruce ecological regime.
Implications for trends in ecosystem dynamics
Because much of the area around Fairbanks was repeatedly burned during the relatively short gold rush era, the mosaic of stand ages whose borders would have otherwise acted to control fire spread has been largely homogenized. Continuous even-aged stands have the potential to ignite, burn intensely, and allow fires to spread over large areas that pose management problems for fire suppression in the wildland–urban interface (Ott and Jandt, 2005). This is especially true for fire-suppressed areas like those around Ace Lake, which have surpassed the preindustrial mean FRI of 58 years and will soon be overdue to re-burn (beyond the 0.95 probability of wildfire return intervals based on the prehistoric record).
Although climate likely mediated FRIs in the pre-industrial portion of the Ace Lake record, a late successional fuel load that is accumulating today may become increasingly important for fire occurrence and spread in the wildland–urban interface around Fairbanks. Calef et al. (2015) showed that area burned around Fairbanks has increased since the 1980s despite intense fire suppression in much of the area. We tested the hypothesis that this trend is because of the gold rush fuel legacy by assuming that the 100-km radius around Fairbanks was reset in AD 1940, and then estimated what percentage of the area should have burned between 1940 and 2014 using the probability to re-burn based on the Weibull curves of preindustrial FRIs. We do not take into account vegetation differences in the study area, which could change our predicted area burned. The results show that the actual area burned is greatly reduced compared with the preindustrial predictions, but has gained ground recently during the megafire years of 2004 and 2009 (Supplemental Figure 5, available online). The fact that percent area burned has not increased around fire-suppressed areas surrounding other Alaska communities over this same time period implies that climate warming is not solely to blame for the recent increases in area burned (Calef et al., 2015). This suggests that the Fairbanks fuel loads and stand ages are out of equilibrium with the natural fire regime and may be rapidly approaching normal as megafire years burn large areas.
The Ace Lake fire history applications to management are not limited to the Fairbanks community, and are germane to how the broader boreal forest region is likely to change in the future. Responses to the legacy of the gold rush era are applicable to other large fire events like the megafire seasons that are increasingly common today as the boreal forest warms (Adams, 2013). Increasing megafire events will similarly homogenize landscape level diversity, impact regional albedo and potentially climate trends, and alter subsequent fire regimes long after they occur.
Conclusion
Fire scars in spruce trees, historical records, and an annually resolved lake-sediment charcoal record define the timing of three wildfires near Ace Lake since AD 1902 following the settlement of Fairbanks by gold miners. During the preceding ~400 years, mean FRIs were 58 years (40- to 77-year 95% range). After European settlement, fires became significantly more frequent (mean = 18 years, 11- to 26-year range), suggesting an important human ignition role in the fire regime during the gold rush era. This human impact extended regionally to affect thousands of square kilometers in interior Alaska. Although fires were anomalously frequent between 1903 and 1940, the vegetation composition of the Ace Lake watershed today resembles that in topographically similar landscapes distant from human settlements. This testifies to the strong ecological inertia present in black spruce forests, even in the face of a 3× increase in FRIs. The frequent wildfires around Ace Lake followed by fire suppression have synchronized stand ages, and the fuel build-up around Fairbanks and may be causing recent increases in area burned.
Footnotes
Acknowledgements
We thank the Ace Lake landowners for their willingness to allow lake coring and other sampling on their property. We thank Carson Baughman, Taylor Maida, Dr Sean Brennan, and Joe Gaglioti for help in the field, and Dr Glenn Juday and Ryan Jess for assistance with aging fire scars. Dr John Pohlman Michael Casso are to thank for their work on the 210Pb dating results for this project. We thank two anonymous reviewers and Dr Zicheng Yu for their constructive reviews. We also thank Dr Jessica Young and Dr Phillip Higuera for thoughtful reviews. Any use of trade, product, or firm names is for descriptive purposes only and does not imply endorsement by the US Government.
Funding
This work was funded by the Joint Fire Science Program through a Graduate Research Grant (GRIN) (Project # 12-03-01-27).