
Abstract
The relationship between land-use and floristic diversity in the landscape, for the last millennia, is analysed from two small lakes in southern Sweden. Pollen analysis and the Local Vegetation Estimates (LOVE) model are used to quantify land-cover at local scales with 100-year time windows. Floristic richness is estimated using palynological richness, and we introduce LOVE-based evenness as a proxy for floristic evenness on a local scale based on the LOVE output. The results reveal a dynamic land-use pattern, with agricultural expansion during the 13th century, a partly abandoned landscape around AD 1400, re-establishment during the 15th–17th centuries and a transition from traditional to modern land-use during the 20th century. We suggest that the more heterogeneous landscape and the more dynamic land-use during the 13th–19th centuries were of substantial importance for achieving the high floristic diversity that characterises the traditional landscape. Pollen-based studies of this type are helpful in identifying landscape characteristics and land-use practices that are important for floristic diversity and may therefore guide the development of ecosystem management strategies aiming at mitigating the on-going loss of species seen in the landscape of southern Sweden and many other regions worldwide.
Keywords
Introduction
Anthropogenic influence during recent decades has resulted in declining biodiversity, mainly because of profound and rapid land-use changes (Anton et al., 2010; Barnosky et al., 2011; MacDonald et al., 2008). To mitigate further loss of species, the development of a land-use system capable of combining production targets with preservation of biodiversity is needed (Emanuelsson, 2009; Harrison et al., 2010). However, to be able to implement such a land-use system, we need to increase our understanding of anthropogenic ecosystems at various temporal and spatial scales and increase our knowledge about the historical land-use and its impact on biodiversity (Dawson et al., 2011; Haslett et al., 2010; Jackson and Hobbs, 2009; Redman, 1999; Willis and Bhagwat, 2010; Willis et al., 2010).
In north-western Europe, species-rich areas related to traditional land-use, such as meadows and pastures, have become fragmented and remain only as islands in the modern production landscape (Cousins et al., 2007; Poschlod et al., 2005). In the province of Småland, southern Sweden, several land-use changes have occurred during the last 1000 years, which makes it a suitable area for studying the effect of changing land-use on biodiversity (Lagerås, 2007). A general agricultural expansion occurred during the Middle Ages, c. AD 900–1200, followed by the late Medieval agrarian crisis with population decline and land abandonment (Berglund et al., 2002; Lagerås, 2007; Myrdal, 2012). Farms were re-established during the 16th century and the maximum extent of agricultural land-use was reached in the late 19th century (Myrdal and Morell, 2011). Since then, the transition to modern land-use has resulted in the polarised landscape of today, characterised by dense tree plantations and large open fields, with very little semi-open vegetation and few permanent grasslands (Antonsson and Jansson, 2011). This reorganisation of the spatial land-use structure could potentially have had large impacts on biodiversity, for example, by reducing the connectivity between areas for seed dispersal (Cousins et al., 2007).
To study past land-use and biodiversity dynamics, palaeoecological tools may be used to provide information on past vegetation composition, which is not possible to extract from historical data and maps alone (Berglund et al., 2008; Cousins, 2011; Dahlström, 2008). Palaeoecological methodologies have advanced in recent years, especially with regard to the ability to quantify past vegetation change (Broström et al., 1998; Davis, 2000; Hellman et al., 2009; Sugita, 1994, 2007a, 2007b; Sugita et al., 1999). Based on pollen extracted from sediments, the Landscape Reconstruction Algorithm (LRA) uses two models, REVEALS (Regional estimates of vegetation abundance from large sites) and LOVE (Local Vegetation Estimates), to quantify regional and local past vegetation abundance (Sugita, 2007a, 2007b).
Fredh et al. (2012, 2013) analysed the relationship between land-use and floristic diversity in the province of Småland between 600 BC and AD 2008, focussing on two different periods: one during the shift from agricultural expansion to regression recorded around AD 550 and one during the transition from traditional to modern land-use management at c. AD 1800–2008. These studies used a combination of the REVEALS model and palynological richness and introduced REVEALS-based evenness as a diversity measure of the regional vegetation abundances of the taxa reconstructed by the REVEALS model. The present study is carried out in the same area but focuses on vegetation at the local scale. The aims of this study are to
Quantify local-scale land-use change during the last thousand years by applying 100-year time windows and the LOVE model to pollen data;
Develop a method for reconstruction of past floristic diversity at the local scale, using a combination of palynological richness and an estimation of evenness based on the LOVE model;
Compare and analyse the relationship between land-use and floristic diversity;
Provide estimates of the degree of change in land-use required to promote floristic diversity.
Study area
We selected two lakes to reconstruct local vegetation changes (Åbodasjön, 57°05′08″N, 14°28′57″E, 50 ha, and Lindhultsgöl, 57°08′42″N, 14°28′04″E, 7 ha) and a third one needed for the REVEALS modelling (Fiolen, 57°04′56″N, 14°31′49″E, 160 ha). The two first lakes are situated in the parish of Slätthög, an elongated area covering 138 km2, in the central part of the province of Småland, southern Sweden (Figure 1). This area is part of the boreo-nemoral zone characterised by a mixture of coniferous and deciduous trees (Sjörs, 1963). Overall vegetation cover around the lakes is similar and dominated by managed coniferous woodland with patches of cultivated fields. However, in the vicinity of Åbodasjön, broadleaved trees and cultivated fields dominate, whereas managed coniferous woodlands and peat deposits constitute Lindhultsgöl’s immediate surroundings. The mean annual temperature is 6.4°C, the annual precipitation is 651 mm (1961–1990 reference normal) and the bedrock is dominated by granite and gneiss, dominantly covered by sandy till and glaciofluvial deposits (Alexandersson et al., 1991; Fredén, 1994).

Locations of Lakes Fiolen, Åbodasjön and Lindhultsgöl in southern Sweden. Red circles show the predicted relevant source area of pollen (predicted RSAP) around Åbodasjön and Lindhultsgöl, 1740 and 1440 m, respectively (Mazier et al., 2015). Parish boundaries (black dashed lines), catchments for the respective lakes (red dashed lines) and the modern land-cover are also shown.
Methods
Dating
Samples were extracted from sediments, retrieved using Russian, gravity and/or piston corers (Jowsey, 1966; Renberg and Hansson, 2008), to establish chronologies using a combination of 210Pb records, radiocarbon dates and Pb pollution marker horizons (Appendix 1; Bragée et al., 2013; Fredh et al., 2013). Based on the activity of 210Pb, 226Ra and 137Cs obtained, the constant rate of supply (CRS) model was used to establish a chronology for the upper c. 30–45 cm of the sediment cores (Appleby, 2001). Beyond the reach of 210Pb dating, macroscopic plant remains and bulk samples were radiocarbon dated using accelerator mass spectrometry (AMS) and 14C results were subsequently calibrated (Bronk Ramsey, 2009; Levin and Kromer, 2004; Levin et al., 2008; Reimer et al., 2009). Lead (Pb) concentration data and/or lead isotope ratios (206Pb/207Pb), obtained by XRF analysis (Boyle, 2000) and Quadrapole ICP-MS, were also included in the age models based on the regionally coherent pattern of airborne pollution Pb deposition across Sweden during recent millennia (Brännvall et al., 2001; Renberg et al., 2001). Using the combined data obtained, Bayesian analysis in the OxCal program (v. 4.1) was used to create age–depth models (Bronk Ramsey, 2008, 2009).
For Fiolen, the chronological data provided by the different methods were partly inconsistent, making it necessary to select the data points to be used in the final age–depth model (Fredh et al., 2013). The preferred age–depth model was based on six terrestrial plant macrofossil samples (three pre-treated), a CRS model (based on nine 210Pb samples) and four lead pollution markers. Eight small plant macrofossil samples (not pre-treated) were rejected as well as 17 210Pb-measured samples below 15 cm were considered unreliable. Clearly, establishing a chronology for the Lake Fiolen sediment sequence was not straightforward, and Fredh et al. (2013) considered several options before concluding that the above detailed age–depth model is the most probable one. Assuming this age model is correct, the maximum uncertainty (2σ) provided by OxCal is ±170 years.
For Åbodasjön and Lindhultsgöl, the age–depth models are based on fewer data points, but the chronological data are more consistent (Bragée et al., 2013). The radiocarbon dates obtained on terrestrial plant macrofossils fall along the trajectories defined by extrapolated 210Pb data and Pb pollution marker horizons. In contrast, all bulk sediment 14C dates display substantially higher calibrated ages as compared with these trends, and were thus not used for age modelling. The age–depth model for Åbodasjön was based on three terrestrial plant macrofossil 14C dates, a CRS model (based on 25 210Pb samples) and four pollution marker horizons. The age–depth model for Lindhultsgöl was based on two terrestrial macrofossil 14C dates, a CRS model (based on 20 210Pb samples) and five pollution marker horizons (Bragée et al., 2013). Four radiocarbon dates obtained on bulk sediment samples were rejected for Åbodasjön, and three bulk sediment dates were not used for the Lindhultsgöl age–depth model. The maximum uncertainty (2σ) provided by OxCal is c. ±80 years for Åbodasjön and c. ±100 years for Lindhultsgöl. An additional uncertainty, but of a different character, applies to the Lindhultsgöl record where relatively large (4 and 10 cm) depth intervals had to be used to obtain sufficient macroscopic plant remains for dating.
Pollen and charcoal analysis
Material for pollen and charcoal analysis was subsampled from the sediment cores at 0.5- to 10-cm intervals. The samples were prepared using standard methods for pollen analysis and mounted on slides for further counting of pollen and microscopic charcoal (10–200 µm) using a light microscope (Berglund and Ralska-Jasiewiczowa, 1986). Pollen grains were identified to species level, where possible, facilitated by keys (Beug, 1961, 2004; Moore et al., 1991; Punt, 2003 [1976]) and the reference collection at the Department of Geology, Lund University. For detailed examination, phase contrast microscopy under oil immersion at 1000× magnification was used, for example, for separation between different genera of Cerealia based on the structure of the pollen wall (Beug, 2004).
For the purpose of subsequent modelling and rarefaction analysis, several pollen levels were pooled together. Considering the uncertainty of the chronologies, we chose to use 100-year time windows for all sites, that is, 10 bins over the last 1000 years (Appendix 2). In total, 100 levels were pooled together for Fiolen (1687 –6469 pollen grains/time window), 112 levels for Åbodasjön (2050–11,769 pollen grains/time window) and 74 levels for Lindhultsgöl (2147– 7087 pollen grains/time window). Using this approach, we were able to quantify the magnitude of the majority of the land-use changes during the last 1000 years inferred from pollen data, although we cannot capture the exact timing of these events within each time window.
Charcoal fragments (10–200 µm) were counted simultaneously with pollen grains, and sample data were in the same way pooled together in 100-year time windows. Tablets containing a known number of Lycopodium clavatum spores (Stockmarr, 1971) were added to 1 cm3 sediment samples for estimation of charcoal concentrations based on the total charcoal abundance for each time window. Subsequently, charcoal accumulation rates (CHAR) were calculated for each time window using the Tilia software, v. 1.7.16 (Grimm, 1992). The CHAR estimates were used to infer regional changes in fire activity, which may reflect both human and natural processes (Conedera et al., 2009).
Modelling of vegetation cover
To be able to separate between regional and local pollen sources, Sugita (1994) defined the term relevant source area of pollen (RSAP), which is defined as the distance beyond which correlations between pollen loading and vegetation abundance do not continue to improve. The background pollen loading that originates from beyond this distance can be considered as a constant for similar-sized lakes within a region at a specific time. Within the RSAP, the pollen loading may vary between sites depending on local vegetation composition.
Based on this distinction, Sugita (2007a, 2007b) developed the LRA approach which comprises two steps. First, the REVEALS model uses pollen counts from large lakes (1–5 km2) to estimate regional vegetation composition (104–105 km2). Second, the LOVE model uses pollen counts from small lakes (0.01–1 km2) to reconstruct local vegetation within the RSAP (2–20 km2) by estimating the background pollen loading based on the regional plant abundances estimates obtained with REVEALS. The size of the RSAP depends mainly on lake size and spatial patterns and patchiness of plant communities in the region (Broström et al., 2005; Bunting et al., 2004; Sugita, 1994; Sugita et al., 2010).
In this study, we used the LOVE model to quantify vegetation proportions within the RSAP at Åbodasjön and Lindhultsgöl, separately (Sugita, 2007a, 2007b; Sugita et al., 2010). In the first step, we used the REVEALS model to estimate the regional vegetation based on two sites, as previous studies have suggested that pollen records from multiple sites increase the reliability of the REVEALS estimates (Hellman et al., 2008; Mazier et al., 2012; Sugita, 2007a; Sugita et al., 2010). The REVEALS model was applied to pollen counts from Fiolen and Åbodasjön, and subsequently, the LOVE model was applied to pollen counts from Lindhultsgöl. Similarly, the REVEALS model was applied to pollen counts from Fiolen and Lindhultsgöl, and subsequently, the LOVE model was applied to pollen counts from Åbodasjön.
The LOVE model includes an estimation of the RSAP at each site using an inverse modelling approach; this site-specific area is defined as the smallest radius at which all modelled taxa reach positive values between 0.0 and 1.0 (Sugita, 2007b; Sugita et al., 2010). In theory, the larger the number of sites studied, the more robust the estimate of the ‘LRA-based RSAP’. However, because we use pollen records from only one site for vegetation reconstruction around Åbodasjön and Lindhultsgöl, it is difficult to reliably estimate the RSAP. Instead a forward-modelling approach (Sugita, 1994; Sugita et al., 1999), based on modern landscapes, was applied to estimate the RSAP. These predicted RSAPs for Åbodasjön and Lindhultsgöl are within radii of 1740 and 1440 m from their lake centres, respectively (Mazier et al., 2015; Figure 1). These RSAPs are hereafter considered as the spatial units of vegetation reconstruction around the sites and are assumed to be constant through time for our reconstructions.
The LOVE model provides vegetation estimates expressed as distance-weighted plant abundance (DWPA) within the RSAP, which means that the LOVE model takes into consideration that plants closer to the sample point contribute more grains to the pollen assemblage than plants further away (Sugita, 2007b). Here, we assume that the DWPA for each taxon represents its spatial cover within the RSAP.
The REVEALS and LOVE models require raw pollen counts, various parameter inputs and assumptions. We used pollen productivity estimates (PPEs) and their standard errors (SEs) for 26 taxa as defined in southern Sweden and Denmark (Table 1) and fall speeds of pollen from the literature (Broström et al., 2004, 2008; Eisenhut, 1961; Mazier et al., 2012; Nielsen, 2004; Sugita et al., 1999). The LRA assumes pollen transport above the canopy, uniform wind in all directions and constant PPE through time (Prentice, 1985, 1988; Sugita, 1993, 1994, 2007a, 2007b). The lake radius was set to 714 m for Fiolen, 400 m for Åbodasjön and 150 m for Lindhultsgöl, and the Ring Source model of pollen dispersal and deposition for lakes was used (Sugita et al., 1999). The wind speed was set to 3 m s−1 and Zmax, maximum spatial extent of the regional vegetation, to 50 km as in Mazier et al. (2012). SEs for the estimates of regional and local vegetation abundance, respectively, were calculated in the REVEALS (v. 4.2.2) and LOVE (v. 3.2.0) programs using a variant of the delta method (Stuart and Ord, 1994; Sugita, 2007b).
Fall speed of pollen, relative pollen productivity estimates (PPEs) and associated standard errors (SEs) for 26 taxa obtained for southern Sweden (Broström et al., 2004; Hellman et al., 2008; Mazier et al., 2012; Sugita et al., 1999) and Denmark (numbers in bold; Nielsen, 2004) used in the REVEALS and LOVE model runs.
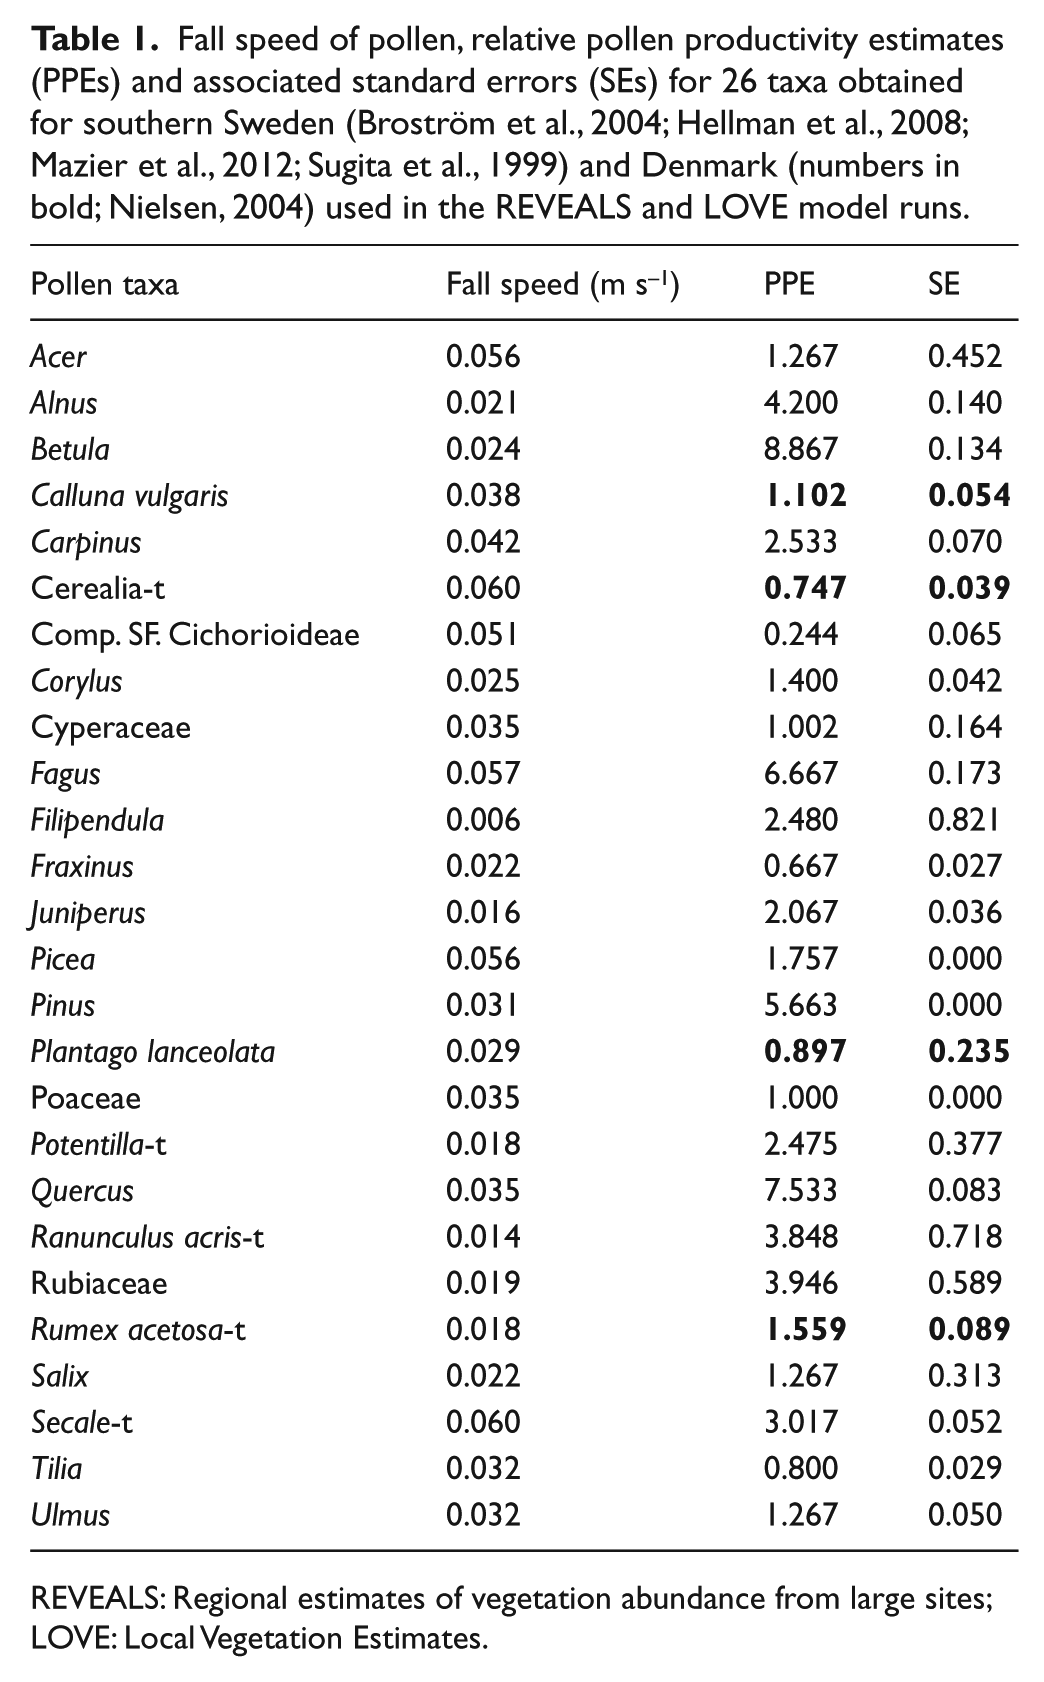
REVEALS: Regional estimates of vegetation abundance from large sites; LOVE: Local Vegetation Estimates.
Estimation of floristic diversity
Palynological richness
In this study, we used palynological richness, the number of different pollen and spore taxa identified in each sample, as a proxy for floristic diversity (Birks and Line, 1992; Birks et al., 2016). Due to differences in total pollen counts between time windows, palynological richness was recalculated using rarefaction analysis (Birks and Line, 1992). This measure is expressed as the expected number of pollen taxa for a constant pollen sum, the minimum pollen sum across all sites (N = 2075). The calculations were based on all terrestrial taxa, in total 124 and 79 for Åbodasjön and Lindhultsgöl, respectively. The palynological richness is based on raw pollen data and the pollen source area is therefore not defined. Consequently, this measure probably includes both a regional and a local component. Although this measure only represents a small fraction of all species in the surrounding vegetation, palynological richness has shown to be useful for estimation of floristic richness (Birks et al., 2016; Meltsov et al., 2011, 2012; Odgaard, 2007; Van der Knaap, 2009).
LOVE-based evenness
Fredh et al. (2012, 2013) used REVEALS-based evenness, which is the relative abundance of taxa reconstructed by the REVEALS model, as a proxy for floristic evenness at the regional scale. In this paper, we introduce LOVE-based evenness as a proxy for floristic evenness at the local scale. Based on the proportional abundances estimated by the LOVE model, we calculated the Shannon index, which combines the number of taxa and the relative abundance of taxa to estimate floristic diversity (Magurran, 2004; Odgaard, 2007; Van Dyke, 2008). Subsequently, we calculated floristic evenness using the ratio between Shannon index and maximum evenness for each time window, when all taxa are equally frequent, also known as the Pielou’s evenness index (Magurran, 2004; Odgaard, 2007; Pielou, 1966). Pielou’s evenness index (and in this case LOVE-based evenness) varies between 0 and 1, with an index of 1 when all taxa cover equal proportions of the reconstructed area. Lower values are attained when a few taxa cover large proportions and other taxa cover small proportion within an area. We estimated LOVE-based evenness for all 26 taxa used in the LOVE model within the RSAP, but also for trees and herbs separately. We assume that the LOVE output represents actual vegetation cover and not DWPA. Because this is not always the case, our values of LOVE-based evenness should be considered as tentative.
Results
Vegetation cover
Estimated vegetation cover within the predicted RSAPs of Åbodasjön and Lindhultsgöl (1740 and 1440 m, respectively) using the LOVE model for 26 taxa is shown in Figures 2 and 3. At both Åbodasjön and Lindhultsgöl, Picea, Corylus, Juniperus, Poaceae, Cerealia type (Hordeum + Avena + Triticum), Carpinus, Fraxinus, Salix, Tilia, Ulmus, Rumex acetosa type, Compositae SF. Cichorioideae, Cyperaceae, Acer, Filipendula, Plantago lanceolata and Secale type were underestimated in pollen percentages compared with LOVE-based vegetation cover, while Pinus, Betula, Fagus and Quercus were overestimated in pollen percentages compared with LOVE-based vegetation cover. Calluna vulgaris was underestimated in pollen percentages compared with LOVE-based vegetation cover at Lindhultsgöl.
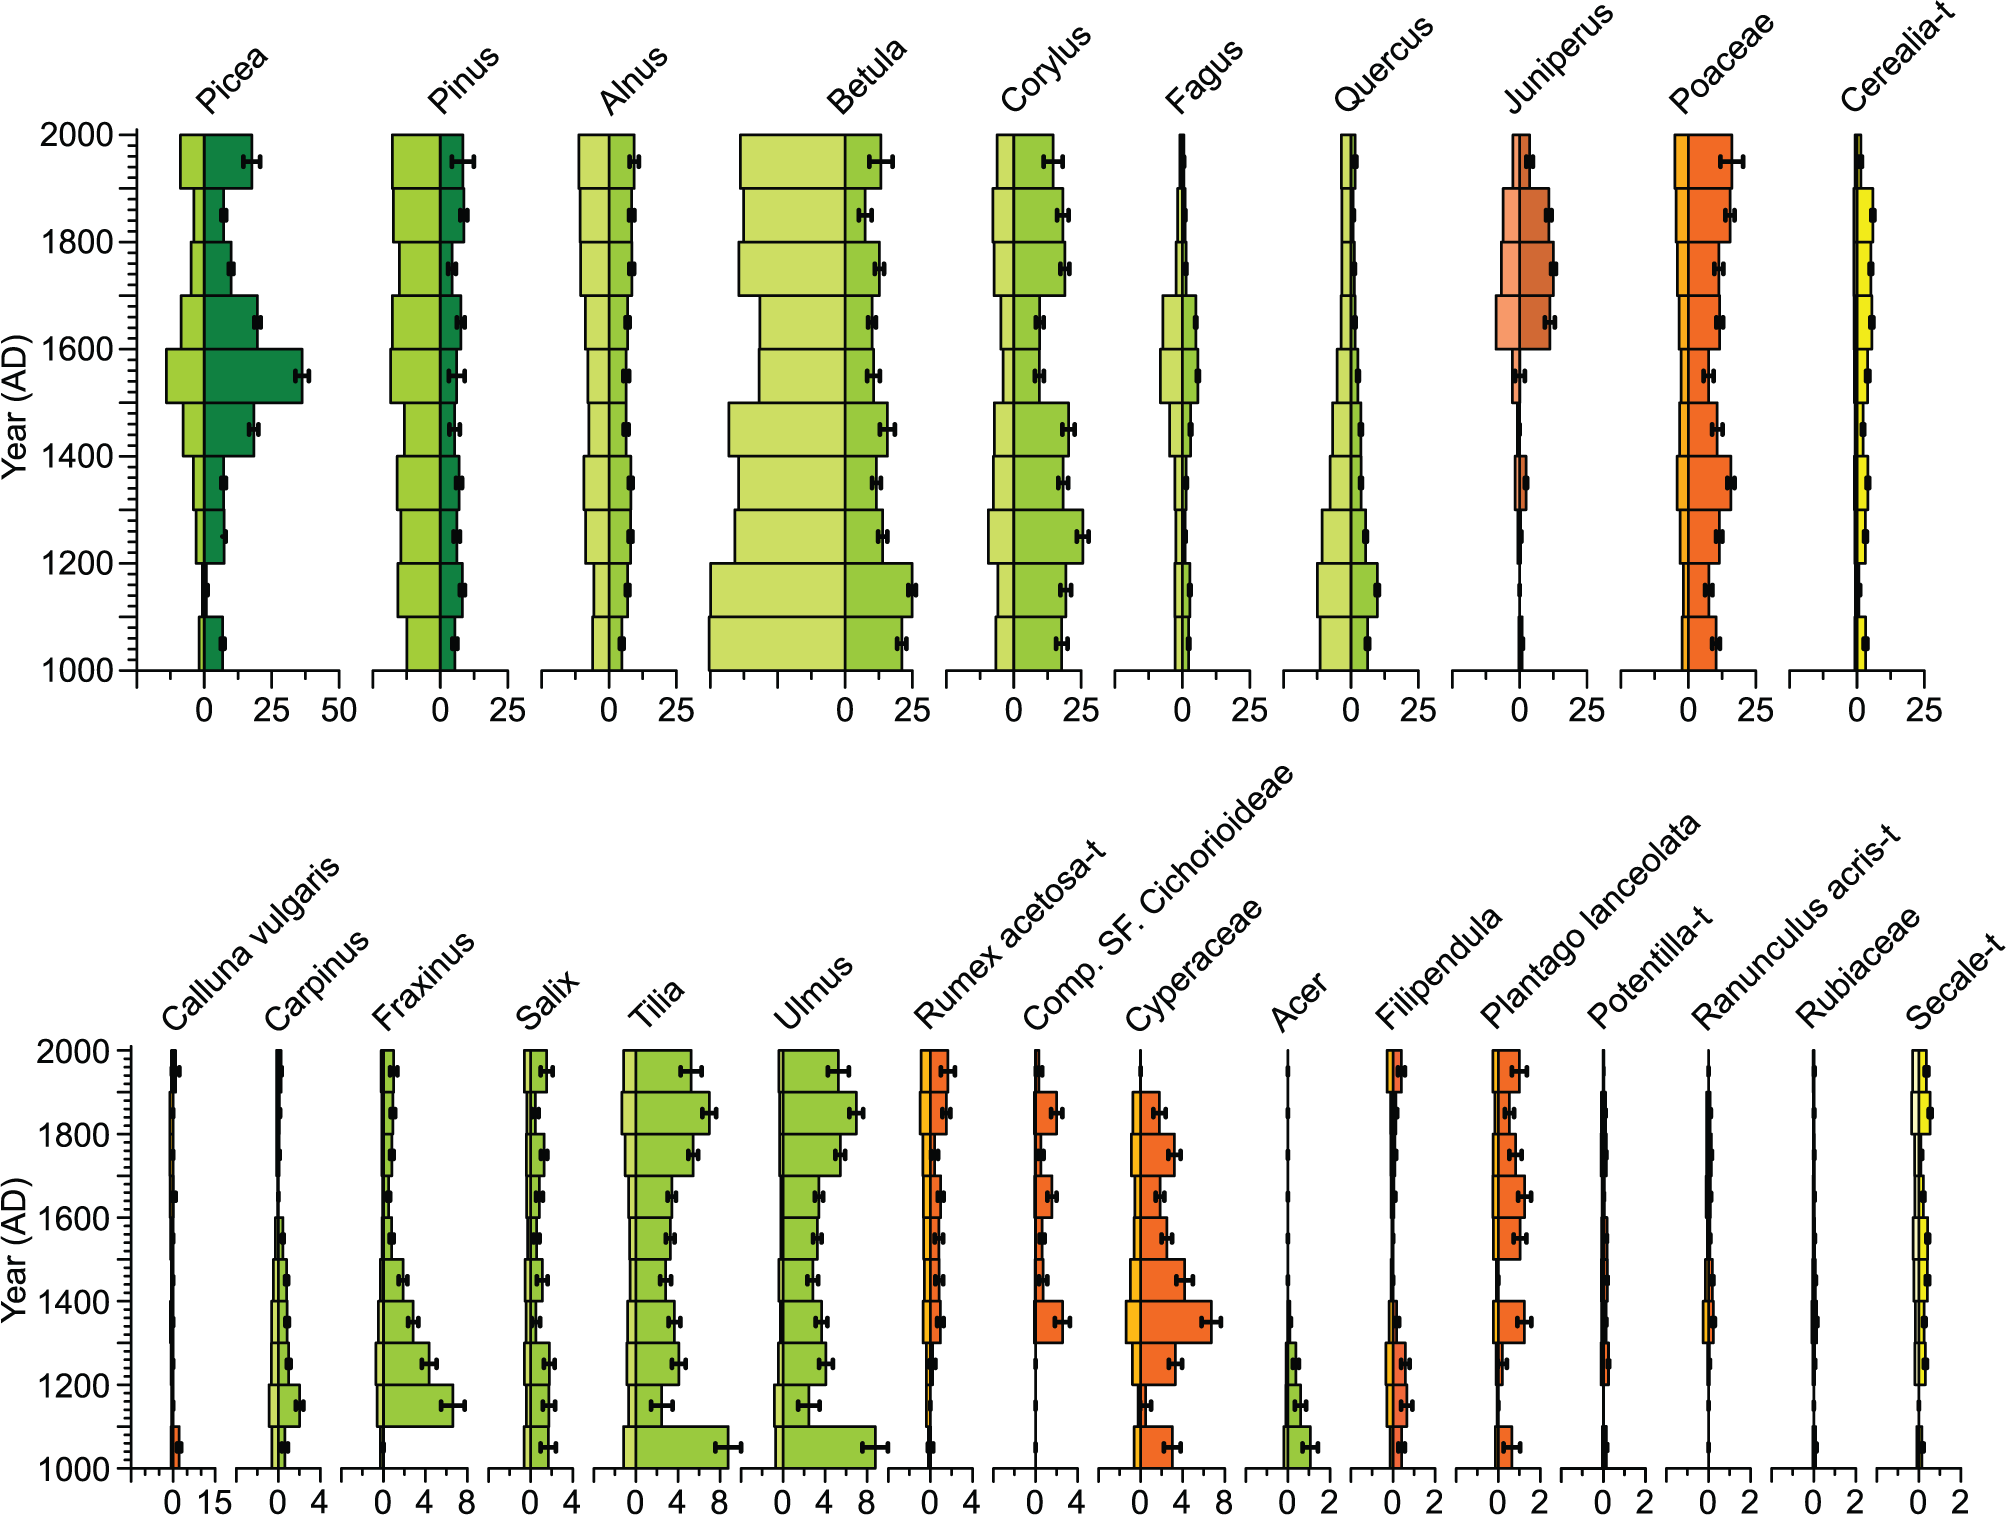
Lake Åbodasjön. Pollen percentage diagram (left side) and estimated local vegetation proportions within RSAP (right side) at 100-year time windows for 26 taxa, based on pollen analysis and the LOVE model. Note the different scales for the upper and lower parts of the figure, and within the lower figure.
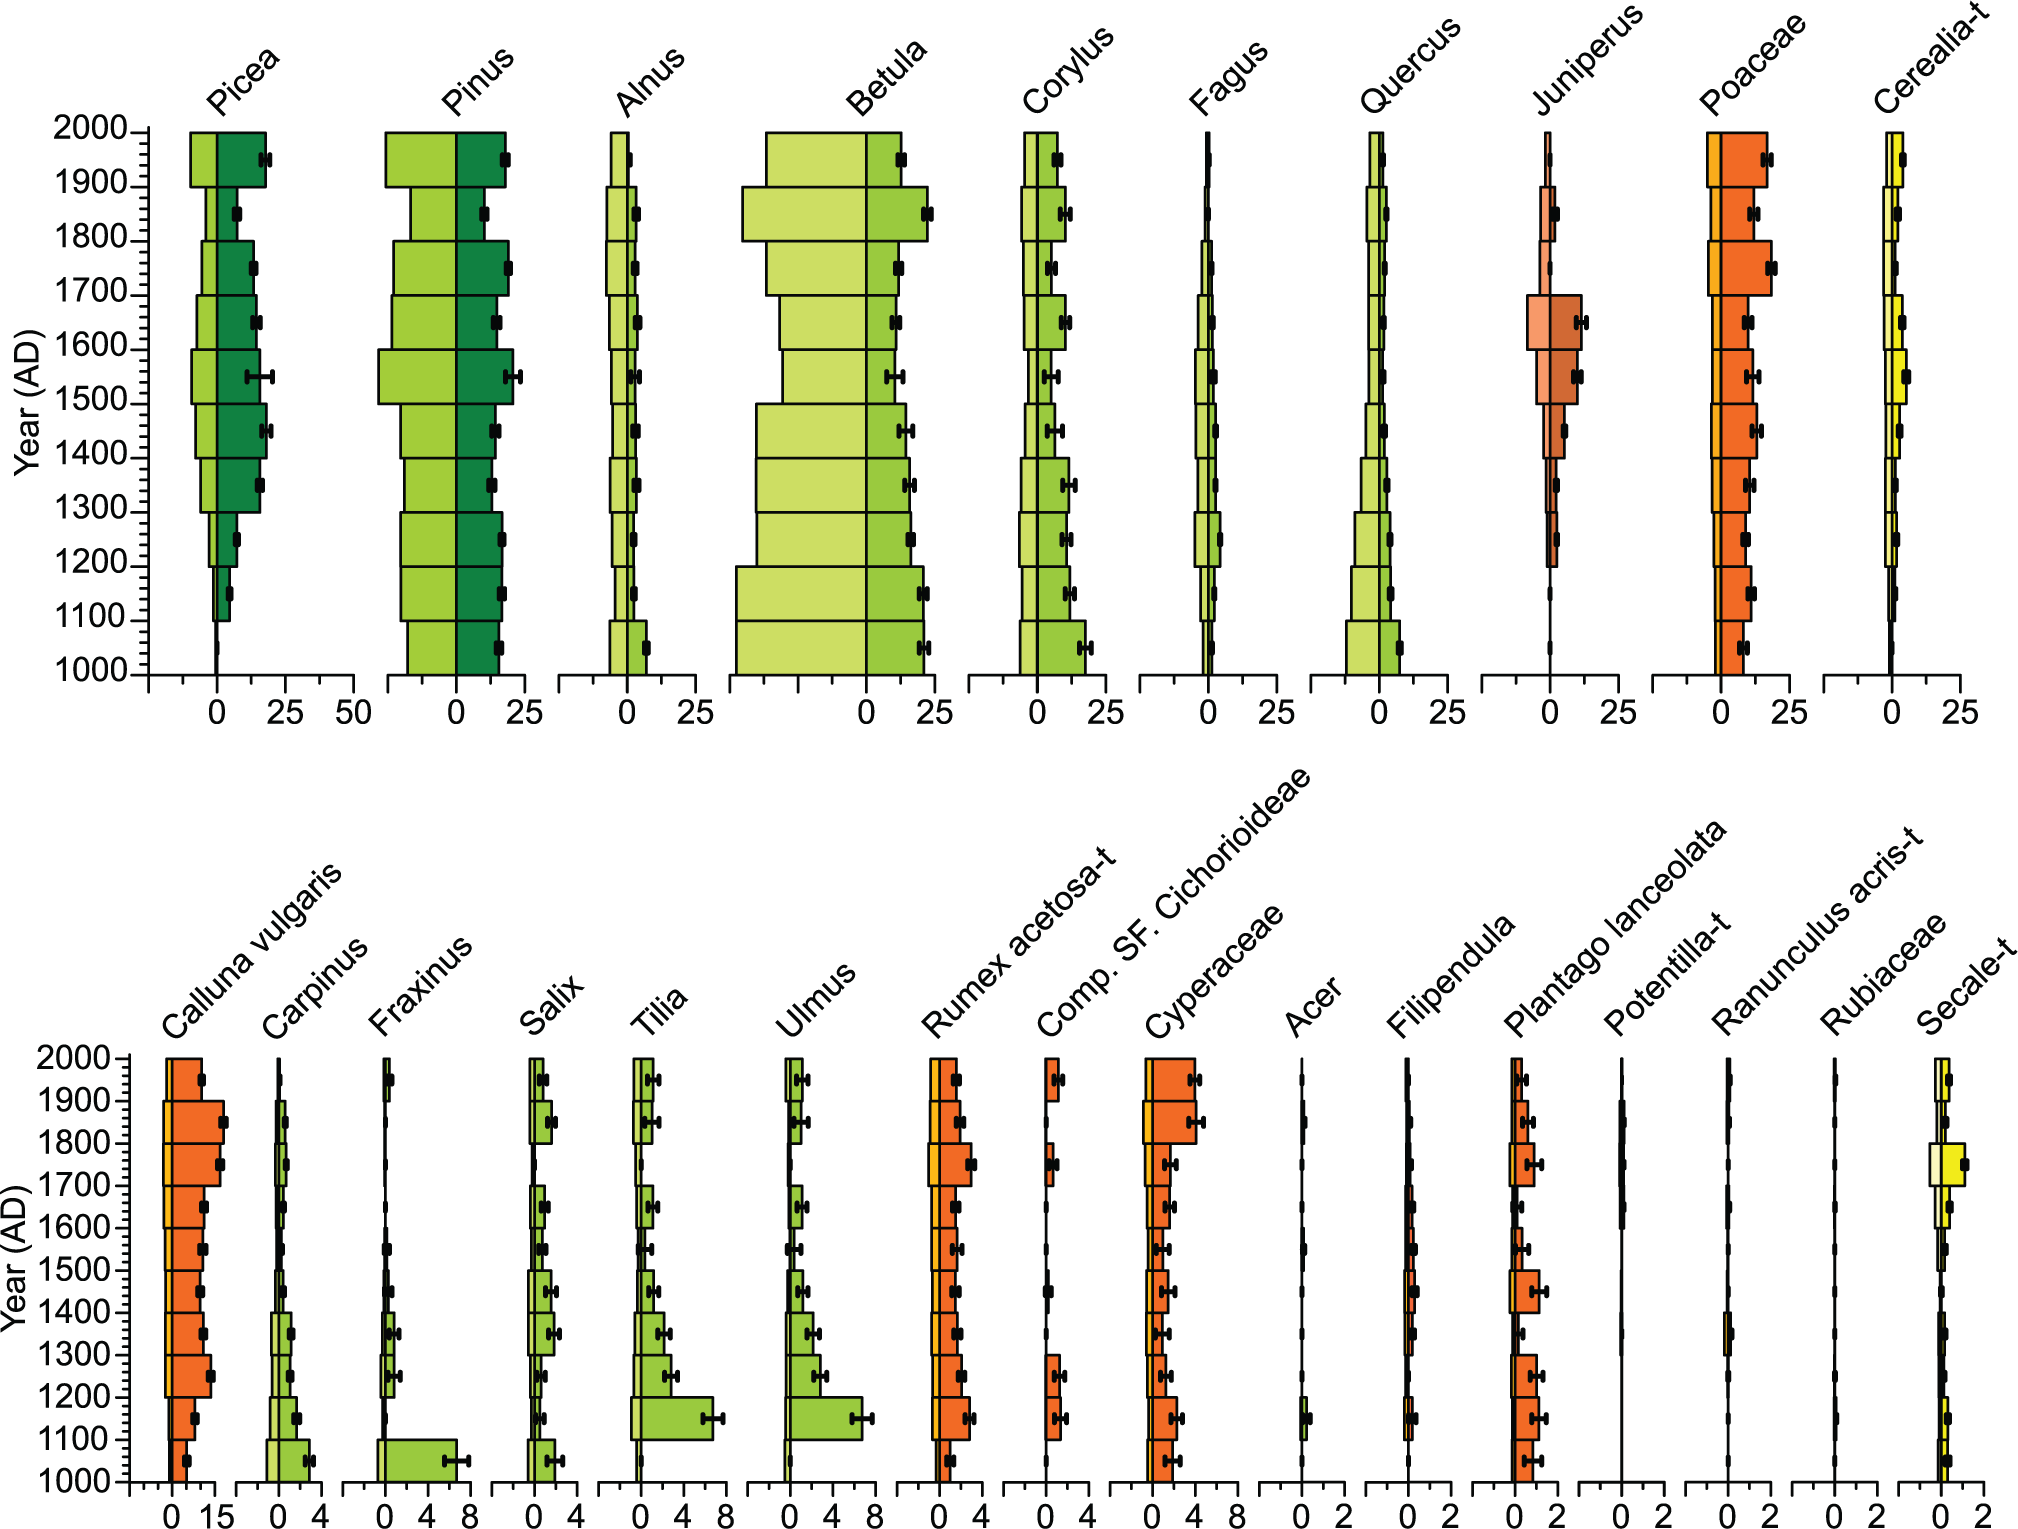
Lake Lindhultsgöl. Pollen percentage diagram (left side) and estimated local vegetation proportions within RSAP (right side) at 100-year time windows for 26 taxa, based on pollen analysis and the LOVE model. Note the different scales for the upper and lower parts of the figure, and within the lower figure.
At Åbodasjön, the dominant taxa were Picea, Betula, Corylus and Poaceae, and at Lindhultsgöl they were Picea, Pinus, Betula, Poaceae and Calluna vulgaris. The major differences in vegetation cover between the two lakes are that Calluna vulgaris had 3–18% higher cover at Lindhultsgöl than at Åboda-sjön, Pinus had 2–15% higher cover at Lindhultsgöl than at Åbodasjön, and Corylus had up to 15% higher cover at Åbodasjön than at Lindhultsgöl.
Some major vegetation changes during the past 1000 years were similarly recorded at Åbodasjön and Lindhultsgöl. Carpinus, Quercus and Fraxinus decreased from 18% to 2% at Åboda-sjön during the 13th–17th centuries and from 17% to 2% cover at Lindhultsgöl during the 12th–15th centuries and remained at lower levels throughout the sequences. In general, Picea showed two periods with higher cover at both lakes. At Åbodasjön, this occurred during the 15th–17th centuries and during the 20th century. At Lindhultsgöl, this occurred during the 14th–18th centuries and during the 20th century. During the first of these periods, Fagus followed largely the same development at both lakes.
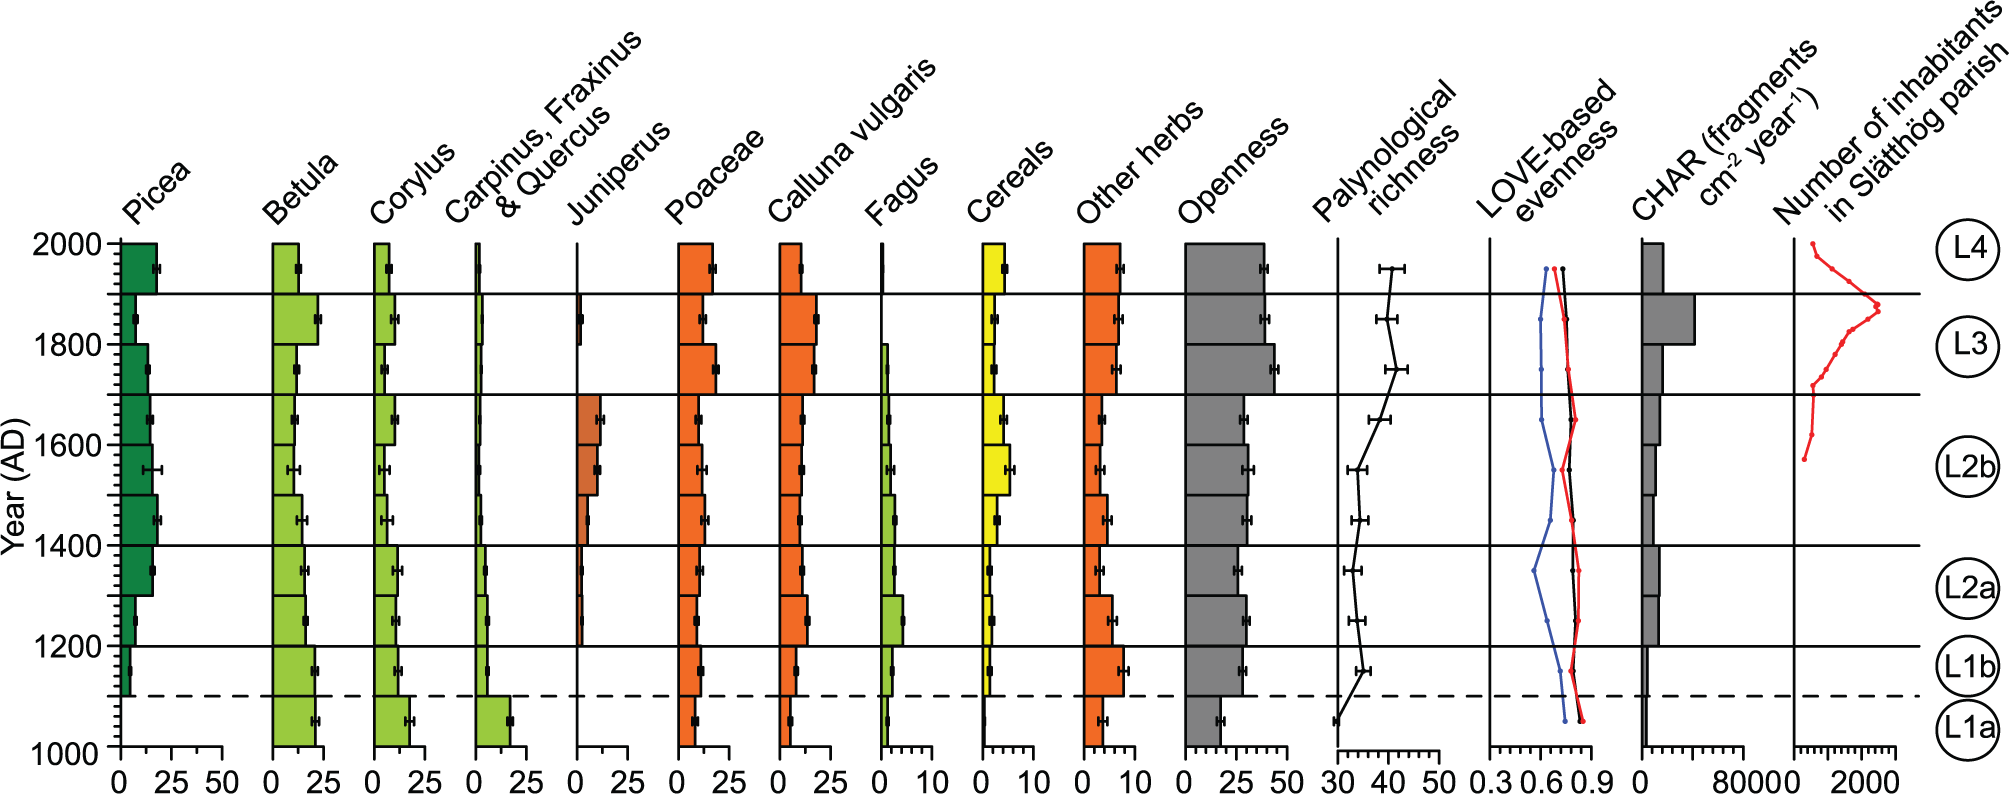
The degree of openness was estimated for each time window by amalgamating the cover for all 12 herb taxa (Figures 4 and 5). Openness varied between 9% and 32% at Åbodasjön and between 17% and 44% at Lindhultsgöl. The higher degree of openness at Lindhultsgöl is mainly due to the larger cover of Calluna vulgaris (5– 18% at Lindhultsgöl compared with 0–2% at Åbodasjön). Maximum openness was recorded during the 14th century and during the 17th–20th centuries at Lake Åbodasjön and during the 18th–20th centuries at Lake Lindhultsgöl.

Lake Åbodasjön. Estimates of local vegetation cover for selected taxa/taxa groups, openness, palynological richness, LOVE-based evenness, charcoal accumulation rate (CHAR) and population in Slätthög parish. Cereals include both Cerealia type and Secale type. Openness includes all herb taxa and Calluna vulgaris. LOVE-based evenness was calculated for all 26 reconstructed taxa (black line), trees (red line) and herbs (blue line) taxa. We divided the sequence into five major land-use periods (Å1–Å5).
Lake Lindhultsgöl. Estimates of local vegetation cover for selected taxa/taxa groups, openness, palynological richness, LOVE-based evenness, charcoal accumulation rate (CHAR) and population in Slätthög parish. Cereals include both Cerealia type and Secale type. Openness includes all herb taxa and Calluna vulgaris. LOVE-based evenness was calculated for all 26 reconstructed taxa (black line), trees (red line) and herbs (blue line) taxa. We divided the sequence into four major land-use periods (L1–L4).
Palynological richness and LOVE-based evenness
During the studied period, palynological richness varied between 37 and 49 at Åbodasjön and between 30 and 42 at Lindhultsgöl (Figures 4 and 5). The highest values were recorded during the 14th–19th centuries at Åbodasjön and during the 18th–20th centuries at Lindhultsgöl. The total LOVE-based evenness varied between 0.72 and 0.81 at Åbodasjön and between 0.73 and 0.83 at Lindhultsgöl (Figures 4 and 5). Both total and tree evenness were relatively high at Lindhultsgöl throughout the studied period, showing that tree evenness dominates the total evenness calculation. Total evenness and tree evenness were generally high at Åbodasjön with slightly lower values during the 16th century. Evenness for herbs was rather variable at both lakes.
Charcoal
The CHAR in the analysed sediment records from Åbodasjön and Lindhultsgöl vary between 600 and 7200 and between 300 and 4000 fragments cm−2 year−1, respectively (Figures 4 and 5). At both lakes, a rise in CHAR was recorded during the 13th century, followed by a minor decline at Lindhultsgöl during the 15th century. Thereafter, there was an increase from the 18th century at Åbodasjön and from the 17th century at Lindhultsgöl. The highest CHAR values were recorded during the 19th century, followed by lower values during the 20th century.
Discussion
Based on the vegetation changes inferred from the LOVE models, we identified four and five land-use periods for Lindhultsgöl and Åbodasjön, respectively (Figures 4 and 5). Land-use periods (Å1–Å5 and L1–L4) were defined visually based on changes in vegetation cover, mainly cereals (Cerealia type + Secale type) to estimate the extent of cultivated fields, and Poaceae and ‘other herbs’ to infer the extent of meadows, pastures and wetlands. Other herbs include Compositae SF. Cichorioideae, Cyperaceae, Filipendula, Plantago lanceolata, Potentilla type, Ranunculus acris type, Rubiaceae and Rumex acetosa type. To infer changes in agricultural land-use, we also used the cover of taxa that are favoured by open land, such as Juniperus and Corylus, as well as changes in woodland taxa considered as late successional trees, such as Carpinus, Fraxinus and Quercus.
Medieval expansion
The continuous presence of agricultural land-use indicators, such as cereals, grasses and other herbs, suggests that agricultural land, including cultivated fields and grasslands, was present within the RSAP of both lakes throughout the last 1000 years. Moreover, at both sites, there are indications of agricultural expansion during the 13th century (Å2 and L2). At Åbodasjön, this is shown by an increase in cereals, Poaceae, Juniperus, other herbs and CHAR (Figure 4), whereas at Lindhultsgöl this is indicated by an increase in Calluna vulgaris, Juniperus and CHAR (Figure 5). These differences indicate that crop cultivation was more extensive at Åbodasjön compared with Lindhultsgöl at this time and that the land management may have differed between the two areas. However, the expansion appears to have started slightly earlier at Lindhultsgöl, with an increase in cereals and other herbs during the 12th century (L1b), indicating that the agricultural expansion phase was more prolonged at this site. At Åbodasjön, several herb taxa related to meadows and pastures increased during this period, such as Apiaceae, Compositae SF. Cichorioideae, Ranunculus acris type, Trifolium type and Plantago lanceolata, while Filipendula declined (Appendix 2). Also taxa related to ruderal communities, such as Anthemis type and Plantago major, and a taxon related to forest, such as Anemone nemorosa, increased during this period (Appendix 2). The higher cover of Calluna vulgaris at Lindhultsgöl can partly be explained by the fact that more peat deposits are situated close to this lake, where some Calluna vulgaris grow today (Mazier et al., 2015). However, Calluna vulgaris may also grow in woodland understorey and may occur in grazed heathland (Cui et al., 2014). At both lakes, the increased cover of agricultural land occurred partly at the expense of Carpinus, Fraxinus and Quercus, which suggests that the areas where these taxa grew were suitable for agricultural land-use. Possibly this agricultural expansion represents the transition from shifting cultivation to farming based on permanent fields or simply that agriculture became more widespread. Shifting cultivation involved long-term fallow of 20–30 years to restore soil nutrients between cultivation periods (Emanuelsson, 2009). Permanent cultivation may also have had fallow periods, but they were much shorter, and productivity depended most of all on manuring. Permanent fields were situated close to settlements and were surrounded by meadows and pastures further away (Myrdal and Morell, 2011).
The agricultural expansion during the 13th century (Å2) at Åbodasjön and 12th century at Lindhultsgöl (L1b) was accompanied by increased palynological richness, which suggests that floristic richness was favoured by more widespread traditional agriculture. Possibly, the agricultural system with permanent fields contributed to the increased floristic richness (Emanuelsson, 2009). This new agricultural system resulted in a higher gradient in land-use intensity, which was most intense around the farms/villages with cultivated fields and meadows, and decreased towards the more distant pastures and woodlands (Emanuelsson, 2009; Myrdal and Morell, 2011). This heterogeneous landscape resulted in more widespread ecotones, that is, transitional areas between land-use types. Agricultural expansions during the Middle Ages comparable to the ones observed here have been recorded in numerous local pollen diagrams from the uplands of southern Sweden at c. AD 900–1200 (Berglund et al., 2002; Lagerås, 2007; Lagerås et al., 2016; Lindbladh, 1999).
Late-medieval decline
At Åbodasjön, a succession from open land to increased woodland cover was recorded in two phases (Figure 4). The first phase during the 15th century (Å3a) was characterised by increasing cover of Picea and Fagus, while Juniperus, Poaceae and other herbs declined, which suggests that parts of the agricultural landscape were abandoned and overgrown by trees. In the second phase during the 16th century (Å3b), Picea and Fagus expanded further at the expense of Betula and Corylus and reached their maxima. A slightly increased cover of Betula and Corylus during the first succession phase (Å3a) possibly suggests these taxa occurred sparsely in the pastures and could expand rapidly when these areas were abandoned, but were later outcompeted when Picea and Fagus expanded into these areas.
Openness decreased from 32% to 17% during the entire period (Å3), which indicates that almost half of the previously open land was abandoned. However, the cover of cereals was comparable to the previous period (Å2), which suggests that crop cultivation was maintained and pastures were overgrown. This change in openness suggests that the extent of meadows and pastures declined by about 40–50% and returned to the levels recorded before c. AD 1200 (Figure 4). This event may be correlated to the Black Death pandemic that first struck Sweden in AD 1350 and returned throughout the 14th and 15th centuries, although the local effect is not known in detail (Lagerås, 2007, 2013; Lagerås et al., 2016; Myrdal, 2012). Myrdal (2012) estimated that 60–70% of all farms in the uplands were abandoned.
The total LOVE-based evenness and tree evenness were lower during Å3b, which reflects the increased dominance of Picea. Despite relatively low openness during Å3b, evenness for herbs increased, which suggests the herb taxa present during this period covered more equal proportions of the landscape. The relationship between openness and estimates of floristic diversity indicates that many species can survive during periods of succession from open land to woodland. It is also possible that there was a shift from species favoured by open areas to species favoured by mixed woodland with Picea and Fagus.
At Lindhultsgöl, there is no clear indication of land-use abandonment after the Black Death, possibly because the extent of grasslands and cultivated fields was generally lower before the pandemic around this lake. However, the minor decrease in CHAR at c. AD 1400 may indicate a temporary abandonment also at Lindhultsgöl (Figure 5).
Re-expansion during the early modern period
From c. AD 1600 (Å4), the increased cover of cereals, Poaceae and Juniperus together with the decreased tree cover at Åboda-sjön indicates agricultural expansion (Figure 4). Picea and Fagus, which had expanded after c. AD 1400, now declined again, which suggests that the areas previously used for agriculture were reclaimed. Juniperus and Empetrum, which are associated with dry pastures, increased during this period (Appendix 2). Also Corylus, which is light-demanding, increased from c. AD 1700, suggesting that semi-open pastures were common. CHAR increased during the second half of Å4, which suggests that fires became more common in the area, probably as a result of land clearance. This inferred intensification of agricultural activity is in agreement with historical and palaeoecological records, suggesting an expansion phase during the 16th century in the upland areas of southern Sweden (Lagerås, 2007; Larsson, 1972). Farms situated around the study lakes are mentioned in preserved historical documents from AD 1545 (Larsson, 1980).
At Lindhultsgöl, Juniperus and cereals increased around AD 1400 (L2b), which indicates more widespread agricultural activity (Figure 5). Sinapis type, which represents species associated with fresh meadows and pastures, appeared in the pollen record at c. AD 1500 and is recorded until the present (Appendix 2).
A pronounced increase in openness at Lindhultsgöl occurred at c. AD 1700. The L3 period (c. AD 1700–1900) is characterised by higher cover of Poaceae, Calluna vulgaris and other herbs, and lower cover of cereals, which indicates that pastures expanded at the expense of arable land (Figure 5). At the same time, Juniperus decreased and CHAR increased, a relationship that is only clear during the L3 period, which suggests a different land management during this time at Lindhultsgöl. Juniperus is fire-sensitive and grazing areas may have been improved by the use of fire. Pastures can be maintained by regular burning to rejuvenate the heathland communities and to remove shrubs. This expansion in pastures coincides with a pronounced increase in palynological richness, which suggests that fire also played an important role in achieving high floristic diversity. In general, fire activity inferred from charcoal in southern Sweden shows a variable but increasing trend during the last 3000–4000 years (Lindbladh et al., 2003; Olsson et al., 2010). A large proportion of these fires is attributed to human-induced burning for forest clearance, temporary crop cultivation and improvement of the quality of grasslands (Cui et al., 2013; Olsson et al., 2010). The source area of the microscopic charcoal may be much larger than the predicted RSAP used in this study, that is, up to 20–100 km (Conedera et al., 2009).
The population in Slätthög Parish increased gradually and reached a maximum during the end of the 19th century, which represents a fourfold increase since c. AD 1700 (Andersson Palm, 2000; Figures 4 and 5). Despite this population increase, changes in agricultural land-use, as reflected by openness, were relatively limited between c. AD 1600 and 1900 at Åbodasjön and between c. AD 1700 and 2000 at Lindhultsgöl. This implies that a largely constant cover of agricultural land could feed more people, especially during the 19th century, probably as a result of more efficient nutrient supply to the arable land and other improvements of agricultural practices, including land divisions, more effective manuring, crop rotation, irrigation and marling (Emanuelsson, 2009; Myrdal and Morell, 2011).
Modern land-use
In general, small-scale agriculture gave way to modern land-use with a focus on commercial forestry and crop cultivation during the last c. 100 years, which led to a marked reduction in the rural population (Myrdal and Morell, 2011). At Åbodasjön, this transition is reflected by increased Picea cover and decreased cover of cereals, Juniperus and other herbs (Å5), whereas increased cover of Picea and cereals and decreased cover of Betula and Calluna vulgaris are recorded at Lindhultsgöl (L4). These changes suggest that woodlands expanded in areas previously used for grazing, and to some extent in areas used for crop cultivation at Åbodasjön. In addition, several herbs related to meadows, pastures and forest declined at Åbodasjön (Appendix 2). According to historical data, this landscape transformation became possible through the introduction of artificial fertilisers, which led to a manifold increase in food production. Thereby, it became unnecessary to keep animals for nutrient supply to the fields, and with the introduction of grass cultivation, this change led to a general reduction of meadows and pastures, which are generally associated with high floristic diversity (Cousins, 2011). However, the reduction of meadows and pastures during the 20th century is difficult to trace in the pollen record (e.g. openness remained largely unchanged and Poaceae increased slightly at Lindhultsgöl), probably because grass cultivation in the fields compensated for the reduction of permanent grasslands, at least during the first half of the 20th century. During the second half of the century, aerial photographs show that both cultivated fields and grasslands declined, while clear-cuts where grass may grow expanded dramatically (Mazier et al., 2015). A decrease in palynological richness related to this transition was only recorded at Åbodasjön. There was probably enough open land and woodland in different stages of succession for the floristic richness to remain at a generally high level, at least at Lindhultsgöl. At Åbodasjön, LOVE-based herb evenness decreased during the modern land-use period, which reflects a decline of many herb taxa. At the same time, Poaceae cover remains unchanged, probably because of increased grass cultivation and clear-cuts. CHAR decreased during the 20th century, which may be explained by less human-induced burning or more efficient fire suppression. The decreased fire activity during the modern land-use period is consistent with comparable declines all over Sweden from the 18th to 19th centuries and onwards (Lindbladh et al., 2003; Niklasson and Drakenberg, 2001).
Regional perspective and implications for ecosystem management
The LRA approach used in this study allowed us to quantify the degree of vegetation changes through time. The two study sites show several differences in land-use history that would not be possible to infer from pollen data alone. Mazier et al. (2015) tested the LRA performance, using the same pollen data as in this study covering the last 200 years, by comparing the LRA output with historical records. The comparison showed that the LRA estimates were in general agreement with historical maps and aerial photographs over the last 200 years, however, tended to overestimate grassland cover by 10–30% compared with historical maps from the 19th century (Mazier et al., 2015). These studies show that the LRA is a useful tool in combination with historical records and traditional pollen data.
Fredh et al. (2012, 2013) analysed the relationship between land-use and floristic diversity in the province of Småland at the regional scale. Agricultural land-use was most widespread at c. AD 350–1850, which correlates broadly with high values of palynological richness (Fredh et al., 2013). REVEALS-based evenness was highest at c. AD 500–1600 and showed much lower values during the last century compared with the previous c. 2600 years, which indicates that the present-day vegetation distribution is unusual in a millennial perspective (Fredh et al., 2013). Similarly, the present study at the local scale shows generally higher values of palynological richness during periods of more widespread agriculture, c. AD 1200–1900 at Åbodasjön and c. AD 1700–2000 at Lindhultsgöl. LOVE-based evenness for herbs shows the lowest values in the modern land-use period at Åboda-sjön, which suggests a relatively unusual vegetation composition during the modern land-use period.
Today the major part of the uplands of southern Sweden is mainly used for timber production and to less extent cereal cultivation (Antonsson and Jansson, 2011). Relatively few species dominate large areas and there is a distinct division between land-use types, which has led to a decline in areas with high floristic diversity, such as meadows and pastures (Cousins, 2011; Cui et al., 2014). With the purpose of mitigating the on-going loss of species, we may learn from historical landscapes and use past rates and degrees of vegetation change inferred from pollen records to identify more sustainable land-use strategies (Berglund et al., 2008; Cui et al., 2013).
In this study, the 13th–19th centuries represent a historical period of land-use with relatively high floristic diversity. Compared with modern land-use, this traditional agriculture was probably characterised by more gradual changes in intensity, from the cultivated fields close to the settlements towards meadows and common land in more peripheral areas, and fires were more frequent. This type of landscape therefore allowed more species to coexist (Emanuelsson, 2009; Montoya et al., 2012). As suggested by retained relatively high levels of palynological richness also during temporary phases of regression, this traditional agricultural landscape made it possible for many plants to survive through periods of succession and reforestation. Landscape elements typical for traditional agriculture and characterised by high floristic diversity, such as meadows and pastures, decreased in importance within our study area of southern Sweden during the last c. 100 years, while tree cover and areas used for crop cultivation increased. This increase in tree cover was largely an effect of the expansion of land area used for timber production and associated with a replacement of deciduous woodland and open land with less diverse coniferous forest.
Ecosystem management of selected areas within the landscape of modern land-use is an important strategy to mitigate the on-going loss of floristic diversity in southern Sweden and elsewhere (Harrison et al., 2010; Haslett et al., 2010). The results from this study suggest that the landscape elements in these selected areas should be diverse and include a significant part of open land. The land-use should vary from intensely managed meadows and pastures to areas in fallow and woodland regrowth. The landscape elements should be in different stages of succession and fire should be used to manage some of the grasslands.
Footnotes
Appendix 1
Appendix 2
Acknowledgements
We are grateful for Urban Emanuelsson’s inspiration and encouragement to work on this topic, and the members of the LANDCLIM project and the NordForsk network (co-ordinated by Marie-José Gaillard) are acknowledged for discussions and collaboration. We thank Shinya Sugita for providing the REVEALS and LOVE programs and theoretical support.
Funding
This work was funded by the Swedish Research Council Formas through grants 2007-1012 (Revealing the dynamics of discontinuous management and biodiversity at different spatial and temporal scales in the traditional cultural landscape), 2006-547 (Brownification of streams, lakes, and coastal waters – an effect of climate change or land-use?), the Swedish Research Council, Helge Ax:son Johnson Foundation, The Royal Physiographic Society in Lund, The Royal Swedish Academy of Sciences and The Swedish Foundation for International Cooperation in Research and Higher Education. FM was supported by funding made available by the French ANR 2010 JCJC 1804 01, MODE RESPYR.