
Abstract
The contemporary role of mires in carbon exchange with the atmosphere is intensely debated. Thus, understanding the variation in Holocene peat accumulation is particularly important. We investigated carbon (C) and nitrogen (N) accumulation rates and their potential controls during the Holocene at the oligotrophic fen Degerö Stormyr (64°11′N, 19°33′E, 270 m a.s.l.), Sweden. The peat stratigraphy was dominated by remains of Eriophorum spp. and oligotrophic–mesotrophic Sphagnum spp. The long-term rate of C accumulation (LORCA) was 13.7 ± 5.5 (SD) g C m−2 yr−1, while the long-term rate of N accumulation (LORNA) was 0.28 ± 0.14 (SD) g N m−2 yr−1. Carbon and N accumulation rates exhibited similar variations that coincided with major changes in botanical composition. The botanical composition of the peat also had a major impact on the percentage of amorphous peat (a proxy for degree of decomposition). Bulk δ13C values increased with decreasing C content, which probably reflected the relative increase of 13C depleted compounds in the peat during decomposition. Different plant groups exhibited different relationships, likely due to different δ13C signatures of initial litters from Eriophorum spp. and Sphagnum spp. The δ15N values increased significantly with decreasing C:N ratio in bulk peat, likely reflecting preferential uptake of 14N by plants concomitant with nitrogen mineralization. Here, we demonstrate the importance of botanical composition in affecting C and N accumulation rates under a changing climate and suggest that primary production drives the variation in rates of accumulation. Furthermore, we point out the importance of including 13C and 15N signatures in the analysis of peat stratigraphies to advance interpretation of Holocene peat growth and decay.
Introduction
Northern peatlands hold about a third of the global soil carbon pool (Loisel et al., 2014; Post et al., 1982). This C stock has accumulated mainly during the Holocene (since ca. 12,000 years ago), with a long-term apparent rate of C accumulation (LORCA; Tolonen and Turunen, 1996) of 18–23 g C m−2 yr−1 (Loisel et al., 2014; Turunen et al., 2002; Yu et al., 2009). LORCA is regulated by the difference between net primary production at the surface and the rate of decay throughout the peat column (Belyea and Malmer, 2004; Clymo, 1984; Clymo et al., 1998). In a study based on a data set of high-resolution peat C accumulation rates of the last millennium (Charman et al., 2013), the net primary production was found to take precedence over the importance of decomposition as the master controller of peat C accumulation rate.
For all peatland types, long-term temporal variability in apparent C accumulation is affected by both external (climate) and internal factors. Minerogenous fens, in contrast to ombrogenous bogs, are also affected by long-term changes in the surrounding catchment (Charman, 2002). Climatic conditions in combination with local topography and edaphic conditions provide the boundary conditions for mire initiation as well as vertical and lateral growth (Belyea and Baird, 2006; Ivanov, 1981; Korhola, 1994). Peatlands are resilient to environmental change, but may also undergo rapid changes when reaching threshold values under a shifting climate (Belyea and Baird, 2006; Belyea and Malmer, 2004).
Compared with our understanding of peat carbon accumulation, little is known about the connection between C accumulation and nitrogen (N), and the role of northern peatlands in the global N cycle during the Holocene (Loisel et al., 2014). Since nitrogen availability is one of the main determinants of peat C accumulation (Olid et al., 2014), understanding the relation between N and C accumulation (Wang et al., 2015) will help develop our understanding on the role of nitrogen in controlling peat C accumulation. The long-term apparent rate of N accumulation (LORNA) is controlled by a number of processes including N fixation, atmospheric deposition, export via discharge, and, for fens, import of N in water from the surrounding catchment (Limpens et al., 2006). Nitrogen can be growth-limiting in mires (Aerts et al., 1992; Limpens et al., 2011; Olid et al., 2014) and, at low N availability, Sphagnum spp. in general are strong competitors for N, but can be outcompeted by vascular plants at higher N concentrations (Granberg et al., 2001; Juutinen et al., 2010; Limpens et al., 2011; Olid et al., 2014; Wiedermann et al., 2007). Other nutrients, such as phosphorus (P), may also be limiting to plant growth (Eppinga et al., 2010). Changes in the plant species composition could alter the amount and quality of substrate incorporated into the peat and therefore affect the C accumulation rate (Limpens et al., 2006).
Past changes in internal and external drivers are reflected in the peat column. Such changes can be inferred from, for example, plant macrofossil remains (e.g. Mathijssen et al., 2014; Talbot et al., 2010), elemental concentration and ratios (e.g. Kuhry and Vitt, 1996; Mäkilä et al., 2001), degree of decomposition (e.g. Broder et al., 2012; Kuhry and Vitt, 1996), and isotopic natural abundance (e.g. Jones et al., 2010; Loisel et al., 2010). The isotopic natural abundances of C and N reflect the conditions at the time of assimilation of C and N, respectively, as well as turnover and decay processes (cf. Biester et al., 2014; Högberg, 1997; Rice and Giles, 1996). Heavier isotopes are associated with slower rates of reaction, and provided there is a surplus of an element, the product of a reaction will be depleted in the heavier isotope, that is, the heavier isotope will be discriminated against (Fry, 2006).
To increase the understanding of variations in C and N accumulation rates, the objectives of this study were to (1) estimate Holocene LORCA and LORNA in a boreal minerogenous mire, (2) investigate whether there have been any significant changes in C and N accumulation rates over time, and (3) explain any significant changes in C and N accumulation rates using variables including Loss On Ignition (LOI), 13C and 15N isotopes, macrofossil composition of the peat, and percentage of amorphous peat (proxy for degree of decomposition).
Materials and methods
Site description
The minerogenous Degerö Stormyr mire (1.9 km2, 64°11′N, 19°33′E, 270 m a.s.l.; Figure 1) is part of an oligotrophic mixed mire system that covers 6.5 km2. It is situated on top of a water divide between two major rivers approximately 70 km from the Gulf of Bothnia in the Kulbäcksliden research park, northern Sweden. The mire system consists of a number of interconnected mires with islands and ridges of till. The bedrock in the area is gneiss overlain by layers of till, peat, or gyttja (organic-rich lake sediments; Malmström, 1923). The climate at the site is defined as cold temperate humid (Dfc, Köppen, 1936), and the 30-year (1981–2010) climate normal mean annual temperature and July and January temperatures were +1.8°C, +14.7°C, and −9.5°C, respectively (Laudon et al., 2013). The mean annual precipitation during the same period was 614 mm (Löfvenius et al., 2003). The climate data were recorded 10 km from the mire at the Svartberget weather station.
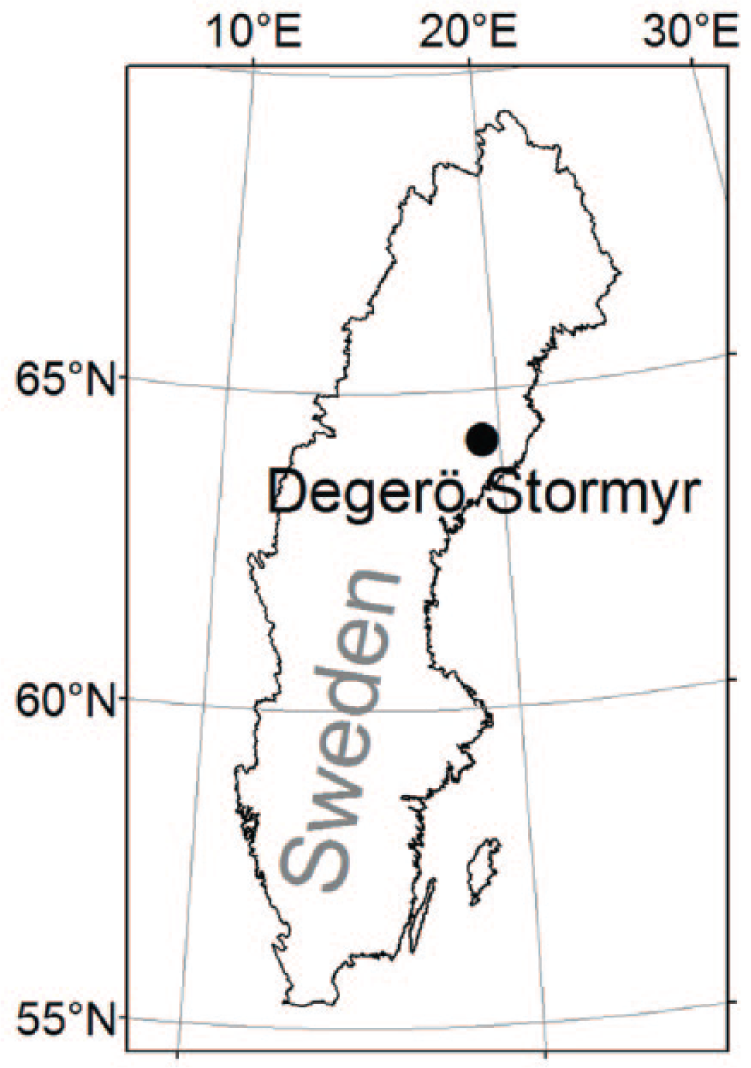
Map of Sweden showing the location of the Degerö Stormyr fen.
A peat core was collected from the center of a mire expanse, within the footprint of ongoing Eddy Covariance measurements (e.g. Peichl et al., 2014; Sagerfors et al., 2008). In general, the bottom layer in the hollows is dominated by Sphagnum majus C. Jens. and Sphagnum balticum C. Jens., with Sphagnum lindbergii Schimp. occurring more sparsely. The field layer in the hollows is very sparsely developed and dominated by Eriophorum vaginatum L., Andromeda polifolia L., and Vaccinium oxycoccus L., with Carex magellanica Lam., Scheuchzeria palustris L., and Trichoforum cespitosum L. Hartm. occurring even more sparsely. The bottom layer of the carpets is dominated by Sphagnum majus, while the lawns are dominated by Sphagnum balticum and Sphagnum lindbergii. On the hummocks, Sphagnum fuscum Schimp. Klinggr. and Sphagnum rubellum Wils. are the most common mosses.
Field core collections
The peat core was extracted in late March 2009, using a peat corer (Jowsey, 1966) with a 50-cm-long, 5-cm-diameter half-cylinder collector. The total length of the core was 314 cm, collected from 60 cm below the surface to a depth of 374 cm, and the individual 50 cm peat cores were extracted without overlap. Previous studies conducted on similar sites by the authors showed that no overlap between cores is needed when extra care is taken to insert the peat corer at the right depth. In the subsequent analysis (e.g. bulk density), no signs of major gaps were observed at the ends of the individual peat cores. The peat cores were wrapped in plastic film and placed on a wooden board. The board and samples were wrapped in aluminum foil and placed in a storage box for transport to a cold room. Due to the loose peat texture above 60 cm depth, surface peat was omitted from subsequent analysis and consequently only catotelm peat was sampled. The core was sampled from the winter ice surface of the mire, preventing compaction from trampling.
Laboratory analyses
The core was sliced into 2 cm subsamples. Bulk density was determined mostly at 2–4 cm intervals. In total, bulk density was determined for 94 slices, of which 10 slices were split into two parts allowing for 14C dating of one half. The samples were dried at 105°C overnight and cooled in a desiccator where they were kept until weighing. The bulk density is given as organic matter bulk density, calculated using LOI data. LOI was determined at 12 cm intervals, with a higher resolution at depths with variable LOI. The samples were combusted at 550°C for 4 h (cf. Heiri et al., 2001). They were removed from the muffle furnace when it had cooled to 350°C and were placed directly in a desiccator to cool to room temperature.
The total mass of C and N and the δ13C and δ15N signatures were determined on 25 bulk samples evenly spread along the peat core. The analysis was performed using Elemental Analyzer–Isotope Ratio Mass Spectrometry (EA-IRMS; EA: Carlo erba CHN1110; IRMS: Delta+, Thermo Fisher Scientific). The samples were dried overnight at 105°C, cooled in a desiccator, and ground for 10 min using a steel ball mill (Retsch MM2). Approximately 5 mg was used for the analysis. The C and N contents are given as fractions of organic material.
Plant macrofossils and percentage of amorphous peat were recorded in 26 subsamples from the peat cores by the Institute of Horticulture, Russian Academy of Agricultural Sciences (Vereya, Russia) using quantitative microscopic analysis. The peat was sieved through a 0.25-mm mesh and the remains were examined under a microscope at 56–80× magnification using the ‘point count’ method (see Heikurainen and Huikari, 1952). Between 200 and 300 remains were identified in each sample and the results are presented as relative occurrence. Based on the plant macrofossil composition and C and N accumulation rates, the profile was subdivided into five time periods. The degree of decomposition was estimated by assessment of the percentage of amorphous peat in the peat cores (cf. Bohlin et al., 1989; Persson et al., 1986). Assessment was performed using microscopic peat classification and 30 slides were inspected for every sample; the mean value was taken and rounded to the nearest 5%.
The 14C content was determined by Accelerator Mass Spectrometry (AMS) at the Ångström Laboratory at Uppsala University (Uppsala, Sweden) for 21 samples from 17 different depths (Table 1). Initially, samples were analyzed in 35 cm intervals (10 in total), and these were later complemented with 11 more samples, to increase the accuracy and precision in the subsequent 14C age–depth modeling (Figure 2). Most dated samples were made up of identifiable macrofossil remains (cf. Nilsson et al., 2001; Table 1). At four of the depths there was insufficient macrofossil material for 14C dating, and therefore, bulk samples with roots removed were analyzed. The bulk samples were analyzed in duplicates and the difference in 14C age of each duplicate pair was less than 85 years. For the samples of selected macrofossil, the peat was suspended in water and macrofossils were picked with forceps under a microscope, to be dried at 105°C. When needed, a drop of diluted sodium hydroxide was added to the suspension, which was later rinsed from the macrofossils. At least 2.5 mg dry weight per sample was used for the 14C analysis.
Depth, 14C age, calibrated age, δ13C, and macrofossil content of dated samples.
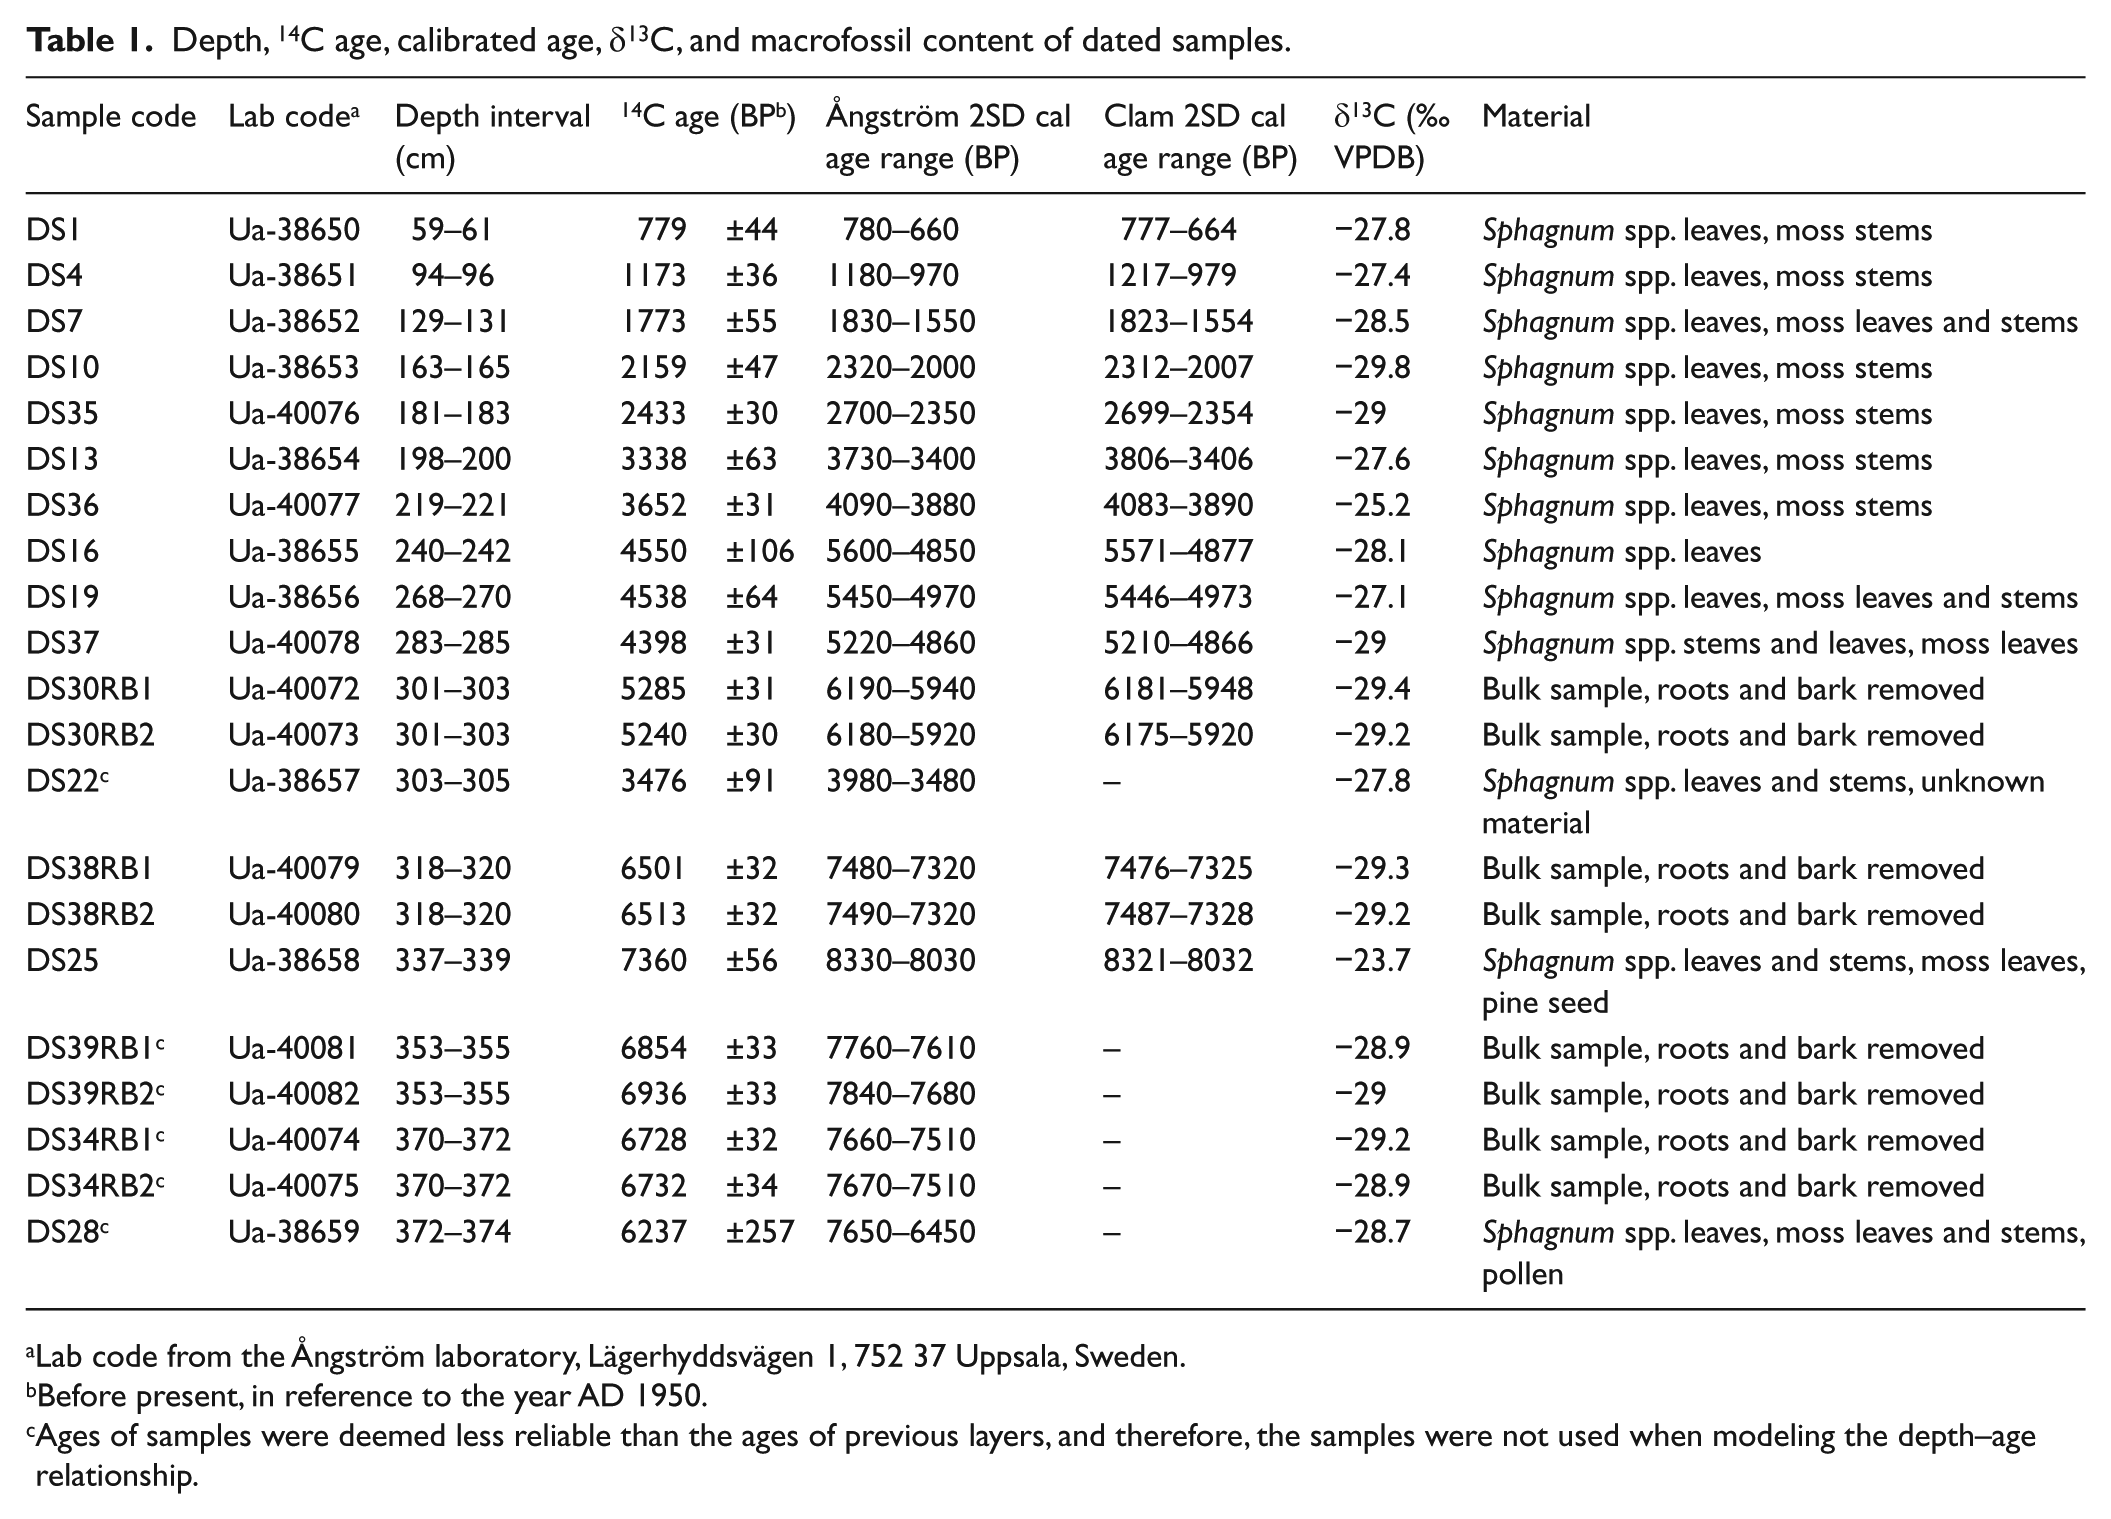
Lab code from the Ångström laboratory, Lägerhyddsvägen 1, 752 37 Uppsala, Sweden.
Before present, in reference to the year AD 1950.
Ages of samples were deemed less reliable than the ages of previous layers, and therefore, the samples were not used when modeling the depth–age relationship.
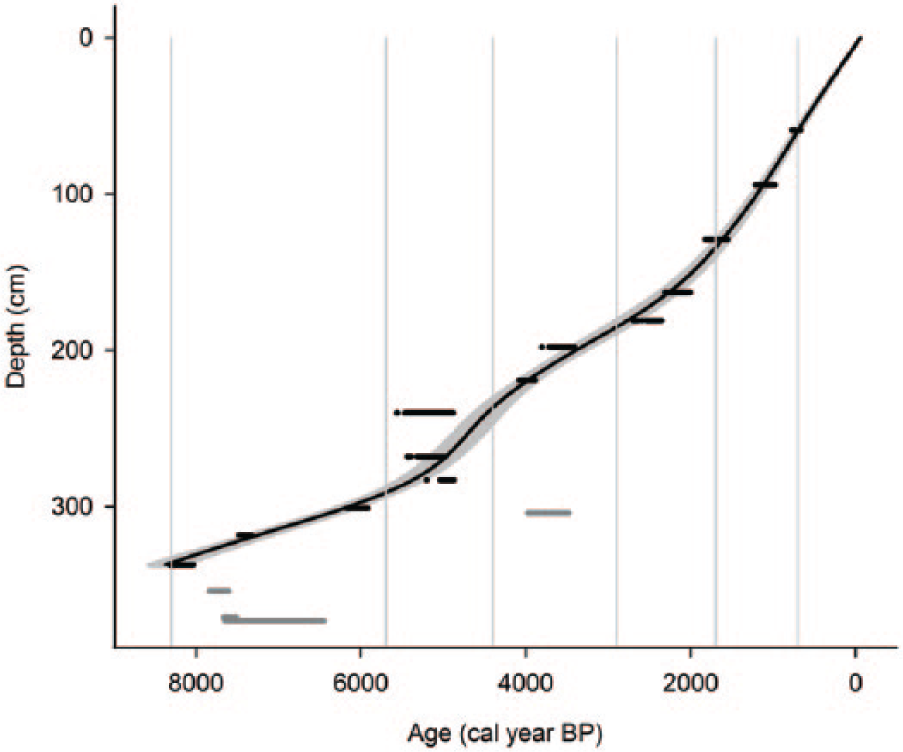
Calibrated age–depth relationship (Blaauw, 2010; calibration curve IntCal09, smooth spline with spar 0.4) with the shaded area indicating 2SD confidence interval. The black and gray horizontal blocks show highest posterior density ranges. The gray blocks are not included in the model. The ages of these samples were deemed less reliable than the ages of nearby layers, and therefore, the samples were not used when modeling the depth–age relationship. The vertical lines indicate the different time periods identified based on macrofossil remains and C and N accumulation rates.
Samples of inconsistent 14C ages were excluded when modeling the depth–age relationship (Figure 2), and consequently, 15 samples from 13 depths were included in the model. All excluded samples were in the depth interval representing a lake stage. The depth–age relationship was modeled using the software clam 1.0 (Blaauw, 2010; http://chrono.qub.ac.uk/blaauw/clam.html; calibration curve IntCal09) in the programming language R (version 3.0.2, R Development Core Team, 2010). Models that were tested were linear interpolation between neighboring levels, linear regression, higher polynomial regression, cubic spline, locally weighted spline, and smooth spline with spar 0.4. The last model had the best goodness-of-fit and was therefore selected for the modeling.
Together with depth, the modeled ages were used to calculate the vertical growth rate. The apparent C and N accumulation rates (AX; g C m−2 yr−1 and g N m−2 yr−1, respectively) were calculated according to the following equation:
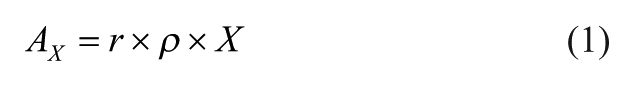
where r is the vertical growth rate (m yr−1), ρ is the (organic matter) bulk density dry mass (g m−3), and X denotes either C or N content as a proportion (0–1) of the bulk density dry mass. Averages over 5700 years were then calculated to obtain LORCA and LORNA.
Regression analysis was used to test the correlation between C content and δ13C, as well as between the C:N ratio and δ15N. The apparent C and N accumulation rates, bulk density, C and N content, and C:N ratio in adjacent time periods were compared using ANOVA with a post hoc Tukey test. Differences were considered significant when p < 0.05.
Results
Radiocarbon dates and chronology
Samples DS22 and DS28 were excluded in the age–depth model (Figure 2) because of ambiguities regarding the material picked out for the 14C analysis (Table 1). The remaining excluded samples were all bulk samples, and in accordance with Nilsson et al. (2001), they were deemed less reliable than the deepest sample that contained selected macrofossils (DS25). The calibrated ages overlapped between 2.4 and 2.8 m depth around 5000 cal. yr BP (calendar years Before Present) (Figure 2 and Table 1), making the uncertainties in the age–depth model higher during this period of time. These uncertainties could either be due to errors made during laboratory analysis or indicate rapid vertical peat growth. Since the material in the dated samples was made up of moss remains, and similar age–depth patterns have been recorded in two studies from the Store Mosse bog in southern Sweden (Klarqvist, 2001; Kylander et al., 2013), we conclude that it is likely that there was a high vertical peat growth rate during this period of time. Due to the oligotrophic conditions at the Degerö Stormyr fen and its placement in the landscape on top of a water divide, it is plausible that climatic changes may have a similar impact on growth patterns as in an ombrotrophic system, making the comparison with the Store Mosse bog relevant.
Mire development history
Accumulation of organic material started prior to 8300 cal. yr BP (age scale refers to AD 1950; Figure 3a). Based on apparent C and N accumulation rates and macrofossil remains, the entire stratigraphy was divided into five time periods (Figure 4a, b and d–l). The first time period analyzed lasted for about 2600 years (8300–5700 cal. yr BP) and, with respect to most of the variables examined, clearly differed from the younger time periods. This period was identified as a lake stage, which was followed by four time periods all representing mire conditions. The lake stage was characterized by low LOI, a constant vertical growth rate, scarcity of macroscopic remains, and low apparent C accumulation (Figures 3a, g and 4a, d–l). Furthermore, the N content, C/N ratio, and δ15N and δ13C natural abundance deviated during the lake stage compared with the subsequent time periods (Figure 3c–f). Since this paper focuses on mire peat C accumulation, the lake stage will not be discussed further.
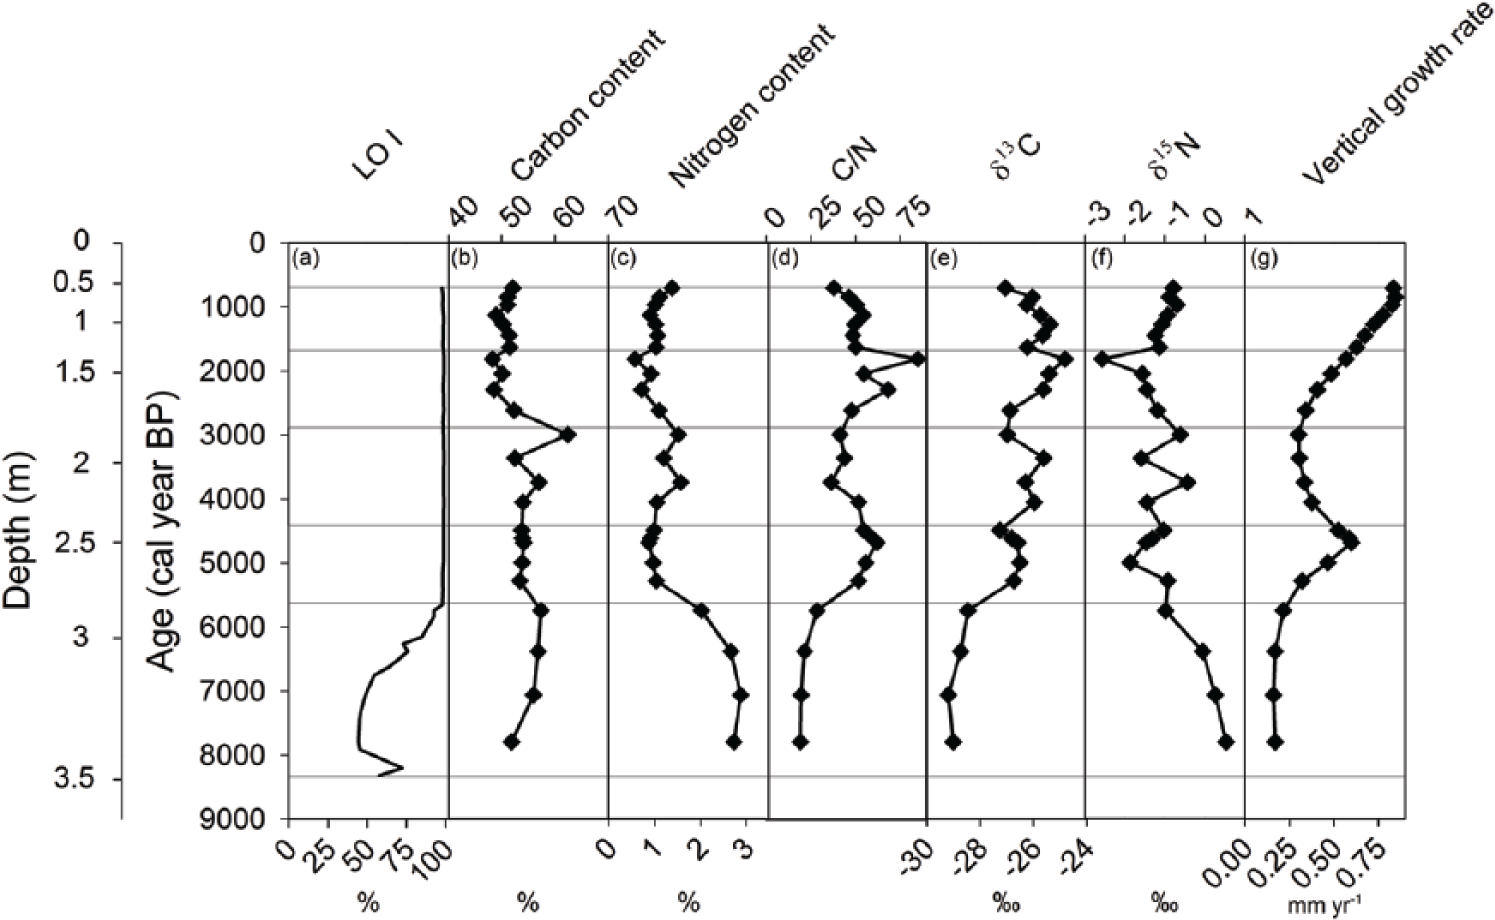
(a) LOI as a percentage, (b) C content as a percentage of organic matter, (c) N content as a percentage of organic matter, (d) C:N ratio, (e) δ13C isotopic signature in permille, (f) δ15N isotopic signature in permille, and (g) vertical growth rate in mm yr−1. The diagram is divided into five time periods based on the variations in C and N accumulation rates and macroscopic plant remains (Figure 4), indicated by the horizontal lines. The age scale BP refers to AD 1950.
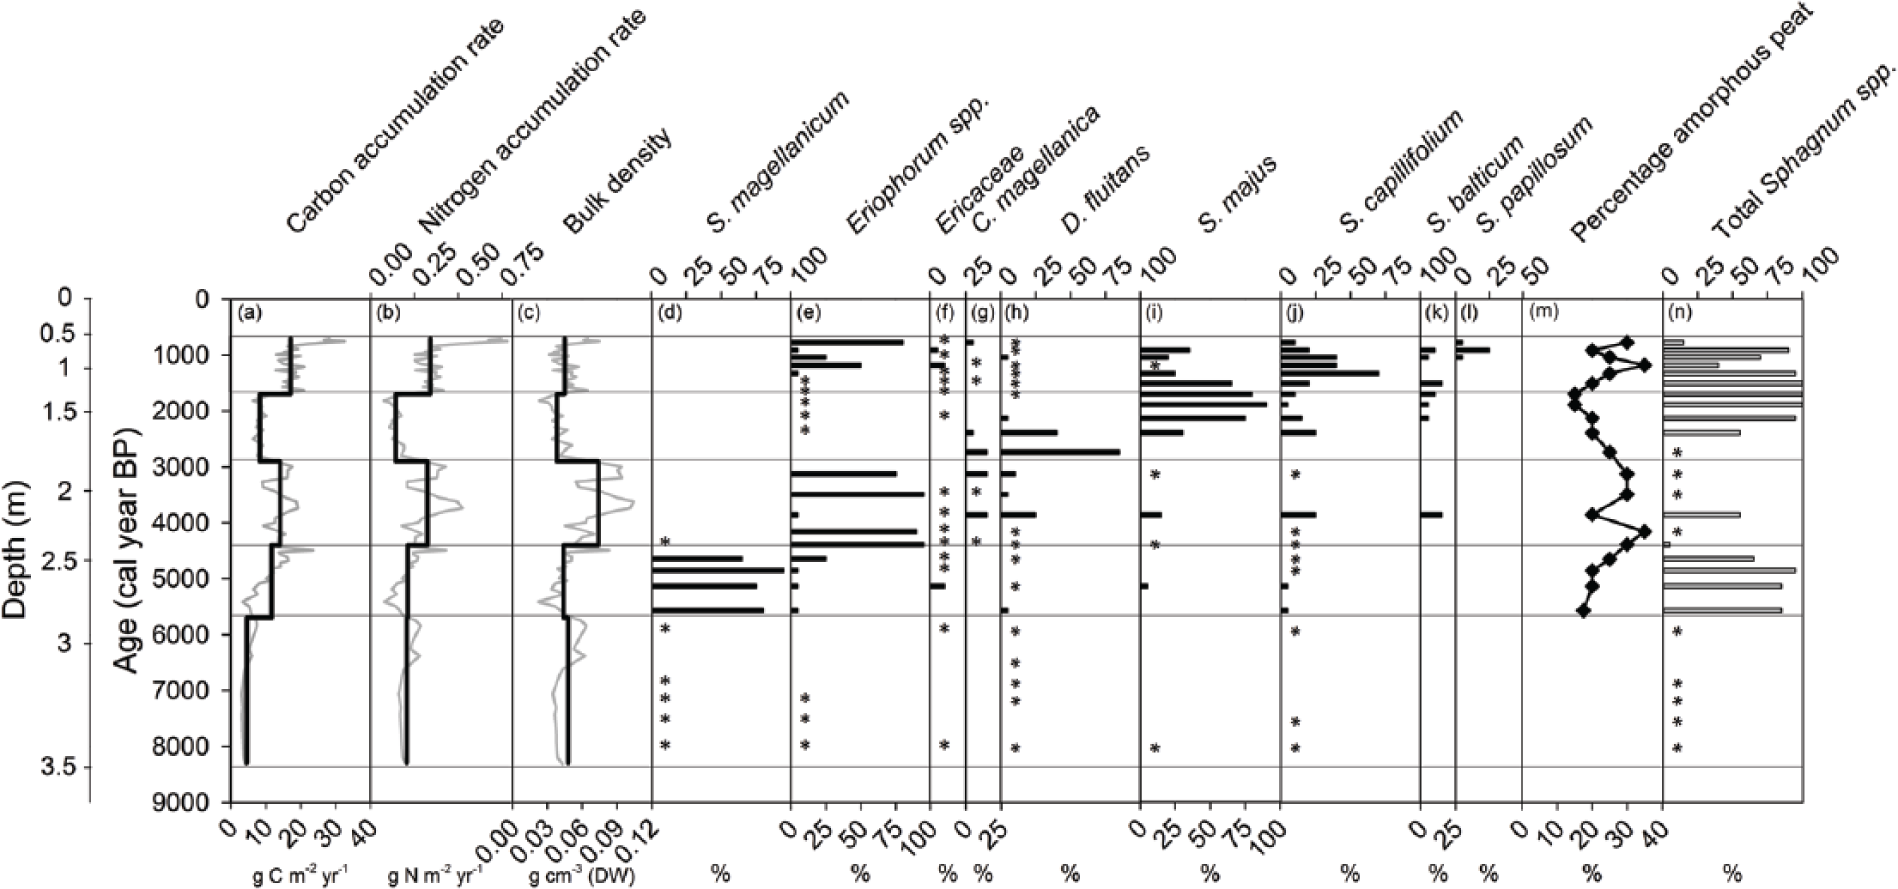
(a) Carbon accumulation rate in g C m−2 yr−1, (b) N accumulation rate in g N m−2 yr−1, (c) organic matter bulk density in g cm−3, (d)–(l) relative occurrence of plant macrofossils as percentages, (m) percentage of amorphous peat, and (n) relative occurrence of total Sphagnum spp. macrofossils as a percentage. The black lines in panes a–c represent the average over the periods, and the gray lines represent the data used to calculate these averages. The diagram is divided into five time periods based on the variations in C and N accumulation rates and macroscopic plant remains, indicated by the horizontal lines.
Since the transition from lake to mire at 5700 cal. yr BP, the average LORCA and LORNA were 13.7 ± 5.5 (SD) and 0.28 ± 0.14 (SD) g m−2 yr−1, respectively, and the average bulk density was 0.050 ± 0.018 (SD) g cm−3. Both the apparent C and N accumulation rates and the bulk density varied following mire initiation. The LOI remained constant at 99 ± 0.3% (SD) (Figure 3a). The average C and N contents over the entire peat profile were 52 ± 3.2% (SD) and 1.0 ± 0.24% (SD), respectively. The C and N contents of Eriophorum spp. dominated peat layers (56 ± 4.4% (SD) and 1.3 ± 0.3% (SD), respectively) were significantly higher (p = 0.003 and p = 0.004, respectively) than for Sphagnum spp. dominated peat layers (52 ± 2.0% (SD) and 1.0 ± 0.2% (SD), respectively). The average δ13C value over the entire peat profile was −26.2 ± 0.7‰ (SD) and the average δ15N was −1.2 ± 0.49‰ (SD). The macrofossil composition indicated oligotrophic–mesotrophic conditions and was dominated by a limited number of species. The moss remains were characterized by Sphagnum magellanicum, Sphagnum majus, Sphagnum capillifolium Ehrh. Hedw., and Drepanocladus fluitans Warnst. (Figure 4). Macrofossil remains of vascular plants were dominated by Eriophorum spp. and Carex magellanica. Botanical remains of a number of other species of both mosses and vascular plants occurring at abundances below 5% or in fewer than four layers are not reported here. Overall, high occurrences of Eriophorum spp. were concomitant with high percentages of amorphous peat, as opposed to high abundances of Sphagnum spp. (Figure 4e, m and n). There were no signs of peatland fires throughout the stratigraphy.
Peat samples were significantly more depleted in the heavier isotope 13C with increasing C content during the Eriophorum spp. dominated period 4400–2900 cal. yr BP (p = 0.007, R2 = 0.98) and the Sphagnum spp. dominated periods 5700–4400, 2900–1700, and 1700–700 cal. yr BP (p < 0.001, R2 = 0.69) (Figure 5). Furthermore, peat samples became increasingly enriched in the heavier isotope 15N with decreasing C:N ratio (p < 0.001, R2 = 0.60; Figure 6).

Relationships between δ13C (‰) and C content (%). The Sphagnum spp. and Eriophorum spp. dominated periods are described by the equations δ13CSph = −10.7 − 0.30 × C (p < 0.001, R2 = 0.69) and δ13CEri = −18.8 − 0.13 × C (p = 0.007 and R2 = 0.98), respectively. The solid regression line represents Sphagnum spp. dominated periods, with the following key to the symbols – filled circles: 5700–4400 cal. yr BP (S. magellanicum dominated); diamonds: 2900–1700 cal. yr BP (Sphagnum majus dominated); and triangles: 1700–700 cal. yr BP (Sphagnum capillifolium and Sphagnum majus dominated). The dashed regression line and squares represent the Eriophorum spp. dominated period 4400–2900 cal. yr BP.

The relationship between δ15N (‰) and C:N ratio is described by the equation δ15N = 0.64 – 0.035 × C/N (p < 0.001, R2 = 0.60). Filled circles represent the period 5700–4400 cal. yr BP (S. magellanicum dominated), squares represent 4400–2900 cal. yr BP (Eriophorum spp. dominated), diamonds represent 2900–1700 cal. yr BP (Sphagnum majus dominated), and triangles represent 1700–700 cal. yr BP (Sphagnum capillifolium and Sphagnum majus dominated). Removing the point with the largest influence results in δ15N = 0.32 – 0.029 × C/N (p = 0.006 and R2 = 0.33).
5700–4400 cal. yr BP (290–250 cm)
The first period after the transition from lake to mire lasted for 1300 years until around 4400 cal. yr BP. The average C and N accumulation rates were 11.6 ± 4.9 (SD) g C m−2 yr−1, 0.2 ± 0.08 (SD) g N m−2 yr−1, and 0.044 ± 0.01 (SD) g m−3 (Figure 4a–c and Table 2). The average C and N contents and C:N ratio were 54 ± 0.3% (SD), 1.0 ± 0.1% (SD), and 57 ± 4 (SD), respectively (Figure 3b–d and Table 2). The average δ13C and δ15N values were −26.8 ± 0.3‰ (SD) and −1.3 ± 0.4‰ (SD), respectively (Figure 3e and f and Table 2). The vertical peat growth rate tripled from 0.2 to 0.6 mm yr−1 (Figure 3g). The onset of peat formation was characterized by high abundances of Sphagnum magellanicum (Figure 4d). The percentage of amorphous peat was low, ranging between 18% and 25% (Figure 4m).
Summary table of mean, SD, and SE for all measured and derived variables, other than plant remains, estimated for each identified time period.
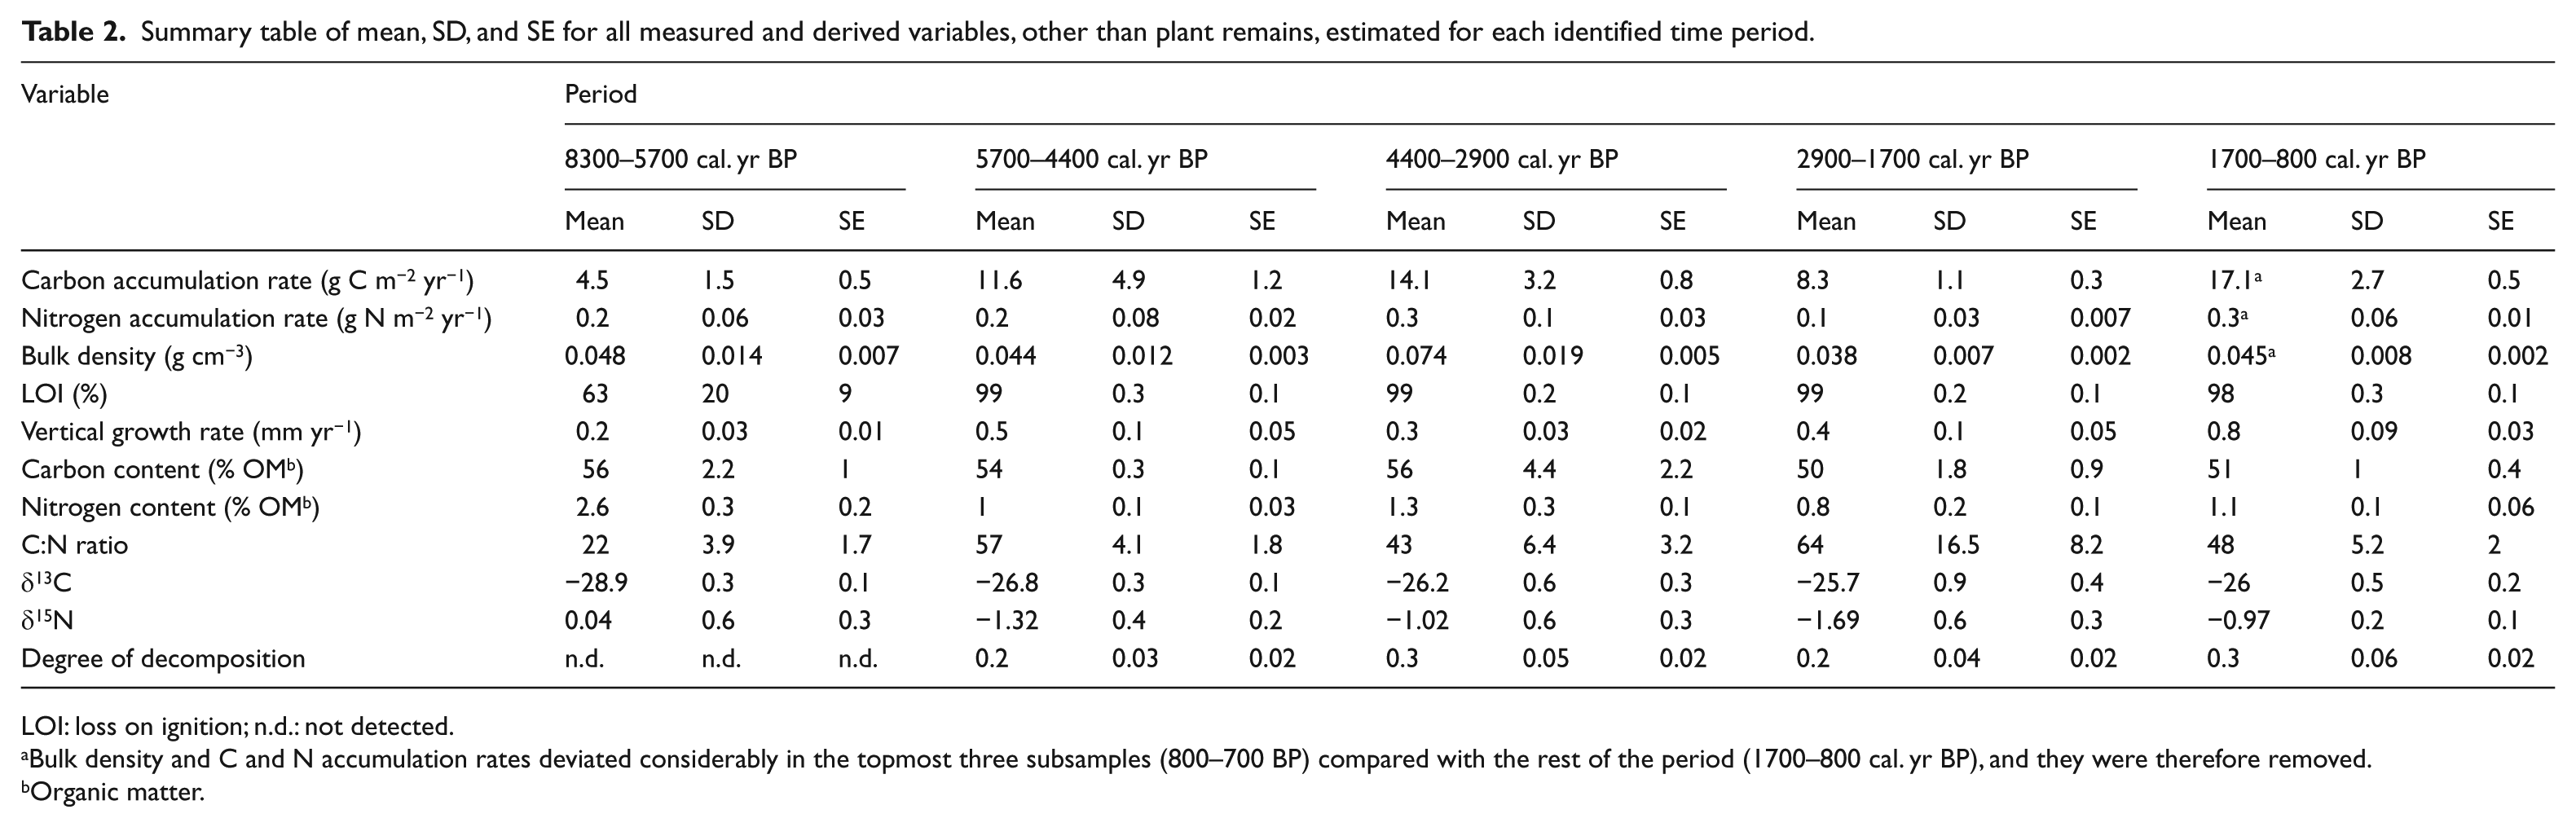
LOI: loss on ignition; n.d.: not detected.
Bulk density and C and N accumulation rates deviated considerably in the topmost three subsamples (800–700 BP) compared with the rest of the period (1700–800 cal. yr BP), and they were therefore removed.
Organic matter.
4400–2900 cal. yr BP (250–190 cm)
During the time period 4400–2900 cal. yr BP, the C and N accumulation rates and bulk density were 14.1 ± 3.2 (SD) g C m−2 yr−1, 0.3 ± 0.1 (SD) g N m−2 yr−1, and 0.074 ± 0.02 (SD) g cm−3, respectively (Figure 4a–c and Table 2). The average N accumulation rate was significantly higher compared with the previous time period (5700–4400 cal. yr BP; p < 0.001). The average C and N contents and C:N ratio were 56 ± 4.4% (SD), 1.3 ± 0.3% (SD), and 43 ± 6 (SD), respectively (Figure 3b–d and Table 2). The average δ13C and δ15N signatures were −26.2 ± 0.6‰ (SD) and −1.0 ± 0.6‰ (SD), respectively (Figure 3e and f and Table 2). The vertical peat growth rate continuously declined (Figure 3g). The composition of macrofossil remains changed over time (Figure 4d–l) with dominance of Eriophorum spp. during most of the period, except around 3900 cal. yr BP. Around this time, Carex magellanica, Drepanocladus fluitans, Sphagnum majus, Sphagnum capillifolium, and Sphagnum balticum were present as well. The percentage of amorphous peat varied between 20% and 35%, with higher degrees in the layers with large amounts of Eriophorum spp. (Figure 4e and m).
2900–1700 cal. yr BP (190–140 cm)
Between 2900 and 1700 cal. yr BP, apparent C and N accumulation rates were significantly lower than during the previous time period (4400–2900 cal. yr BP; p < 0.001), with mean values of 8.3 ± 1.1 (SD) and 0.1 ± 0.03 (SD) g m−2 yr−1, respectively (Figure 4a and b and Table 2). The average bulk density was 0.038 ± 0.01 (SD) g dm−3 (Figure 4c and Table 2). The C and N contents were 50 ± 1.8% (SD) and 0.8 ± 0.2% (SD), respectively, and the C:N ratio increased from 48 to 85 (Figure 3b–d and Table 2). The average δ13C signature was −25.7 ± 0.9‰ (SD) and the δ15N samples became slightly more depleted in the heavier isotope 15N, the value of δ15N decreasing from −1.2‰ to −2.6‰ (Figure 3e and f and Table 2). The vertical peat growth rate doubled over the same period, from 0.3 to 0.6 mm yr−1 (Figure 3g). The period was dominated by Drepanocladus fluitans and Sphagnum majus with some Sphagnum capillifolium. The percentage of amorphous peat decreased during the period, with the lowest values of the entire peat stratigraphy occurring around 1900–1700 cal. yr BP, which is concomitant with total dominance of Sphagnum majus (Figure 4i and m).
1700–700 cal. yr BP (140–60 cm)
The most recent time period in our study stretches between 1700 and 700 cal. yr BP. The final 100 years (800–700 cal. yr BP), represented by 3 of the 24 samples, exhibit considerable deviation in bulk density and in C and N accumulation rates compared with the earlier part of the period and are therefore not included in the discussion below. During the time period 1700–800 cal. yr BP, the average accumulation rates of C and N were 17.1 ± 2.7 (SD) g C m−2 yr−1 and 0.3 ± 0.06 (SD) g N m−2 yr−1, respectively. These averages were significantly higher than during the previous time period (2900–1700 cal. yr BP) and represented the highest values within the stratigraphy (Figure 4a and b and Table 2). However, the bulk density of 0.045 ± 0.01 (SD) g dm−3 (Figure 4c and Table 2) was lower than the Holocene average of 0.050 ± 0.02 (SD) g dm−3. The average C and N contents were 51 ± 1.0% (SD) and 1.1 ± 0.1% (SD), and the C:N ratio decreased from 50 to 38 (Figure 3c and d and Table 2). The δ13C became more negative with an average of −26.0 ± 0.5‰ (SD), and there was a tendency toward enrichment in the 15N isotope with values of δ15N increasing from −1.1‰ to −0.8‰ (Figure 3e and f). The vertical peat growth rate increased to 0.84 mm yr−1 (Figure 3g), being the highest value in the whole peat stratigraphy. Among the macrofossils, Sphagnum majus and Sphagnum capillifolium were most frequent together with Eriophorum spp. Some Sphagnum balticum and low abundances of Ericaceae spp. were present as well. The percentage of amorphous peat varied greatly, with the lowest degree in layers with high abundances of Sphagnum spp. (Figure 4m and n).
Discussion
LORCA
The LORCA of 13.7 ± 5.5 (SD) g m−2 yr−1 at Degerö Stormyr is lower than the average of 22.0 ± 1.9 (SE) g C m−2 yr−1 for northern peatlands in general (7500–0 cal. yr BP; Loisel et al., 2014). It is close to the LORCA values of 15.1 ± 4.1 (SE) and 17.0 ± 8.4 (SE) g C m−2 yr−1 for similar fens in two regions in Finland (Turunen et al., 2002), and within the range of 2–30 g C m−2 yr−1 in a number of fens in northern Finland (Juutinen et al., 2013; Mäkilä and Moisanen, 2007; Mäkilä et al., 2001; Mathijssen et al., 2014). The LORCA of Degerö Stormyr is lower than the average of 20.5 g C m−2 yr−1 for eight raised bogs in southern Sweden (Franzén et al., 2012). The low value at Degerö Stormyr could be the consequence of geographical location. Degerö Stormyr is situated in the north of Sweden, where a lower LORCA would be expected than in the south (Turunen et al., 2002). The low LORCA could also partly be a consequence of comparing fens and bogs. In Finland, fens generally have lower LORCA than bogs (Turunen et al., 2002). If this applies to all northern peatlands, an average which represents both bogs and fens could be expected to be higher than an average for fens only, and thus, our comparably low result is not unexpected. There are several studies reporting apparent C accumulation rates as low as, or lower than, this study (Juutinen et al., 2013; Klarqvist, 2001; Mäkilä and Moisanen, 2007; Mäkilä et al., 2001; Mathijssen et al., 2014; Robinson and Moore, 2000; Turunen et al., 2001). Thus, the apparent C accumulation rate at Degerö Stormyr is within the lower range of the distribution for northern peatlands in general and similar to similar types of fens during the latter part of the Holocene.
The average apparent peat C accumulation rate of 17.1 ± 2.7 (SD) g m−2 yr−1 for the most recent time period (1700–800 cal. yr BP) at Degerö Stormyr is within the range of the carbon accumulation rates of 12–33 g C m−2 yr−1 during the late-Holocene in the bog Stor Åmyran, which is close by (ca. 700–100 cal. yr BP; Oldfield et al., 1997). It is, however, lower than the late-Holocene carbon accumulation rate of approximately 23 C m−2 yr−1 in the oligotrophic fen Lappmyran (ca. 350–50 cal. yr BP; Van der Linden et al., 2014) within the same mire complex as Degerö Stormyr.
The contemporary net ecosystem C balance (NECB) includes all C fluxes. In mires, this means the vertical exchange of methane and carbon dioxide (CO2) and the discharge export of organic carbon, CO2, and methane. At Degerö Stormyr, the average NECB 2004–2005 was 24 ± 4.9 g C m−2 yr−1 (Nilsson et al., 2008), roughly twice as high as the LORCA from this study. However, since the NECB is an average from only 2 years the estimate is most uncertain. For comparison, the average land–atmosphere CO2 flux (net ecosystem exchange, NEE) from 12 years of measurements (Peichl et al., 2014) did not differ from the average NEE in 2004–2005. Thus, there is potential for a contemporary NECB of about 24 g C m−2 yr−1 also for the 12-year period. However, since NECB and LORCA measure C accumulation rates at different time scales (annual vs millennial) and in different compartments (whole peat column and living plants vs catotelm), the comparison is not straightforward. For further discussion on the issue see, for example, Frolking et al. (2014) and Yu (2012). Even though there are uncertainties in the comparison, we note that our results indicate that LORCA is lower than current NECB at Degerö Stormyr.
LORNA
The LORNA of 0.28 ± 0.14 (SD) g m−2 yr−1 at Degerö Stormyr (5700–700 cal. yr BP) is close to the average of 0.34 g N m−2 yr−1 for northern peatlands estimated by Loisel et al. (2014). However, it is considerably lower than the LORNA of 0.85 g N m−2 yr−1 estimated for northern peatlands by Wang et al. (2015). The major difference between the two studies (Loisel et al., 2014; Wang et al., 2015) may be partly due to the use of different time periods: 6000–0 cal. yr BP and 10,000–0 cal. yr BP, respectively. Loisel et al. (2014) also attributed their low value to overrepresentation of Sphagnum spp. sites. Hence, LORNA at Degerö Stormyr is probably lower than the Holocene average for northern peatlands, but closer to the average for Sphagnum spp. sites. LORNA at Degerö Stormyr is close to the lower end of the range of 0.32–0.80 g N m−2 yr−1 reported from a bog in southern Sweden (Malmer et al., 1997) and within the range of 0.19–0.57 g C m−2 yr−1 estimated by Limpens et al. (2006) in a conceptual budget for a boreal bog.
Variations in apparent C and N accumulation rates
The variations in average C and N accumulation rates between periods at Degerö Stormyr largely coincide with major changes in the botanical composition of the peat (Figures 4a, b, d–l). The periods with high apparent C and N accumulation rates also seem to be periods with relatively high N availability (Figure 6), which is reasonable since primary production may be partly controlled by N supply (Aerts et al., 1992; Limpens et al., 2011; Olid et al., 2014).
Our results indicate a higher production during 4400–2900 cal. yr BP than 5700–4400 cal. yr BP since there is no significant difference between the apparent C accumulation rates during the periods although the percentage of amorphous peat is higher during 4400–2900 cal. yr BP (Figure 4m). This inference is also supported by the significantly higher N accumulation rate during the latter period. The lacking difference in C accumulation rates between the periods and significantly higher N accumulation rate during the latter period probably reflect the fact that C is respired during decomposition near the peat surface, while N is retained in the peat (Kuhry and Vitt, 1996; Post et al., 1985). There is a high proportion of highly decomposed Eriophorum spp. and an absence of Sphagnum spp. for the period 4400–2900 cal. yr BP (Figure 4e, m and n), which may explain the low vertical peat growth rate (Malmer et al., 1994) and high bulk density (Figures 3g and 4c and Table 2).
The marked drop in apparent C accumulation around 2900 cal. yr BP, followed by the low stable apparent C accumulation rate until 1700 cal. yr BP, coincides with the shift in vegetation from Eriophorum spp. to Sphagnum spp. as the dominant species. Despite the substantial increase in vertical peat growth and tendency toward a lower percentage of amorphous peat (Figures 3g and 4m), the apparent C accumulation rate was lower during the later period dominated by Sphagnum spp. We hypothesize that the reason for this is that the productivity was lower, and crucial for the resulting decrease in apparent C accumulation rate, which is in line with Charman et al. (2013), who concluded that primary productivity is the master controller of variation in peat C accumulation rate.
The decrease in the apparent C accumulation rate during 2900–1700 cal. yr BP also approximately coincides with a widespread decrease in apparent C accumulation rates due to climatic cooling in high northern latitudes (Yu, 2006 and references therein). The change in dominant species to high proportions of Drepanocladus fluitans and Sphagnum majus indicates wetter conditions than during the previous period. Wetter conditions may also result in a higher apparent C accumulation rate, as reported for two Canadian peat bogs where high apparent C accumulation rates were correlated with wet conditions (Loisel and Garneau, 2010). This higher apparent C accumulation rate was attributed to the shorter residence time of the biomass in the acrotelm. However, in our study, the apparent C accumulation rate decreased, most likely due to wet conditions over a longer time period, allowing a shift in the dominant plant species and probably lower production. The presumed wetter conditions likely caused shorter time for the biomass in the acrotelm limiting aerobic decay, which is indicated by the slightly lower percentage of amorphous peat. The shorter residence time in itself would be likely to cause a higher C accumulation rate, as opposed to our findings, which further implies the importance of production for the resulting C accumulation rate.
The significantly higher apparent C accumulation rate in the period 1700–800 cal. yr BP could be partially the result of the change in dominant Sphagnum species, from the typical hollow species Sphagnum majus, to alternation between Sphagnum majus and the typical hummock species Sphagnum capillifolium. The higher proportion of Sphagnum capillifolium indicates an increase in acrotelm thickness, which could contribute to the increasing vertical growth rate through higher productivity (Belyea and Clymo, 2001), which in turn could contribute to the higher apparent C accumulation rate. Furthermore, it seems like there was a greater production during the latter period since the apparent C accumulation rate was higher despite a higher percentage of amorphous peat. One factor contributing to the likely higher productivity might be the co-occurrence of Sphagnum spp. and Eriophorum spp. during this period. Vascular plants may act as a supporting structure for Sphagnum, thus facilitating greater moss productivity (Malmer et al., 1994), and may also contribute more litter because of enhanced production by vascular plants with a thicker acrotelm (Moore et al., 2002; Wallén and Malmer, 1992).
Botanical composition and degree of decomposition
There is a clear link between the botanical composition and percentage of amorphous peat in bulk peat. Samples dominated by Sphagnum spp. have a low percentage of amorphous peat in contrast to samples dominated by Eriophorum spp. (Figure 4e, m and n), in accordance with a number of other studies comparing Sphagnum spp. peat with vascular plant peat (cf. Bohlin et al., 1989; Broder et al., 2012).
A high degree of decomposition (i.e. equivalent to high percentage of amorphous peat) normally yields increased C content (Benner et al., 1987), resulting from a higher carbon content in the compounds more recalcitrant to decomposition that preferentially accumulate in the peat, such as phenols, lipids, and waxes (Bohlin et al., 1989; Nordén et al., 1992). With increasing decomposition, the lipid content increases, while the carbohydrate content decreases (Nordén et al., 1992; Preston et al., 1987). An increase in the relative amount of lipids can be expected to result in 13C depletion since lipids are 13C depleted compared with carbohydrates (Schulten and Gleixner, 1999). This is noticeable in our correlations between δ13C and C content, in which more negative δ13C values are correlated with higher C content (Figure 5).
Furthermore, the different slopes of the regressions between δ13C and C content within Eriophorum spp. and Sphagnum spp. peat, respectively (Figure 5), could suggest different intrinsic properties of the decomposing material, as well as different δ13C signatures of the original litter. The narrower range of C content among the Sphagnum spp. samples, as well as the significantly lower C content, could be indicative of the high recalcitrance of the organic matter, showing only a small change in C content as the easily degradable compounds are decomposed. Average δ13C during periods dominated by different Sphagnum species revealed increasingly negative δ13C values in the following order: 2900–1700 cal. yr BP (Sphagnum majus), 1700–700 cal. yr BP (Sphagnum capillifolium and Sphagnum majus), and 5700–4400 cal. yr BP (Sphagnum magellanicum) (Figure 5, significant difference between 2900–700 and 5700–4400 cal. yr BP at p = 0.015). This difference could either be due to different surface wetness during growth (Rice, 2000; Rice and Giles, 1996; Williams and Flanagan, 1996) and/or the 13C depletion during decomposition mentioned above. Fresh litter from Sphagnum majus, typical in hollows (Laine et al., 2009), would be expected to have a low degree of discrimination due to the wet growth habitat (Loisel et al., 2009; Rice, 2000; Rice and Giles, 1996), in contrast to Sphagnum magellanicum that is common at drier microsites (Laine et al., 2009). Since the peat formed during the period 1700–700 cal. yr BP was a mix of Sphagnum capillifolium (hummock species; Laine et al., 2009) and Sphagnum majus, the resulting δ13C signature of the fresh plant material would be expected to be a mix of the two, with higher 13C depletion than during the period dominated by Sphagnum majus (2900–1700 cal. yr BP). Hence, fresh Sphagnum spp. litter could give rise to the same order in δ13C values as in Figure 5. The steeper slope of the Sphagnum spp. regression compared with the Eriophorum spp. regression could be due to this initial difference in δ13C of different Sphagnum species, and decomposition processes further enhancing differences as the C content increases. The shallower slope of the Eriophorum spp. regression could reflect a more pure effect of decomposition on δ13C and C content, assuming that the δ13C signature in the litter was more similar at the start of decomposition. This assumption is plausible since vascular plants, in which 13C fractionation is governed by stomatal conductance (i.e. water availability), should not exhibit any significant variability in degree of fractionation in the moist environment of a peatland. In Bryophytes, however, the fractionation is significantly controlled by the water film thickness on the leaves (Rice and Giles, 1996), and hence the litter should experience more diverse δ13C values. The order of the samples along the regressions (Figure 5) does not reflect peat age, which indicates that the conditions and processes in the acrotelm are the main determinants of the C content and δ13C, respectively.
Enrichment of 15N with soil depth, and thereby age and degree of decomposition, has been found in surface soil in arctic tundra (Nadelhoffer et al., 1996) and boreal forest (Högberg et al., 1996; Lindahl et al., 2007). The enrichment was coupled to mycorrhizal preference (forest) or possibly plant preference (tundra) with respect to uptake of 14N over 15N, and soil N transformations (tundra). We found no 15N enrichment with depth in the deep peat of Degerö Stormyr; however, similar mechanisms may have affected the peat. This is manifested in the significant negative correlation between C:N ratio and δ15N (Figure 6) that indicates decomposition with co-occurring loss of 14N isotopes from the bulk peat. This is in agreement with Andersson et al. (2012), who also found a similar correlation (r2 = 0.54, calculated from Andersson et al., 2012) in fen peat. A possible explanation for our correlation is discrimination against 15N during plant N uptake, causing an enrichment of 15N in the peat. The litter from the isotopically light plants would then be deposited on or close to the peat surface where a cycle of mineralization–plant uptake may take place (Högberg et al., 1996). The lighter isotopes could then be assimilated into living plants to a higher degree as opposed to the heavier isotope that remains in the peat. The significance of this process should be dependent on plant availability of N, since fractionation due to plant uptake should be non-existent under strong N limitation (Nadelhoffer and Fry, 1994). Hence, the periods with the heaviest isotopic content (i.e. less negative signature) should be periods with higher N availability. The N:P ratios of vascular plants at Degerö Stormyr indicate that P is limiting for contemporary plant growth (Eppinga et al., 2010), and thus, N fractionation during plant uptake could be possible. During times of high decomposition rates, more N could be available to plants, causing more pronounced fractionation and 15N enrichment in the peat. For plants with mycorrhizal associations, an even stronger fractionation would be expected (e.g. Högberg et al., 1999); however, a concomitant increase in the C:N ratio in soil has been observed resulting from N uptake by mycorrhizal fungi (Lindahl et al., 2007). Denitrification with concurrent loss of the lighter isotopes could also cause a similar relationship between δ15N and C/N ratio. However, the high probability of plants or microorganisms using any nitrate produced, or deposited on the peat surface, would inhibit any build-up of nitrate concentrations (Limpens et al., 2006; Urban et al., 1988). Since fractionation is non-existent under limited substrate availability, denitrification should not be responsible for the loss of the lighter N isotope. A lack of influence of age on the correlation indicates the major importance of acrotelm processes.
Conclusion
We conclude that both LORCA and LORNA at Degerö Stormyr were close to values of similar fens during the latter part of the Holocene. Variations in C and N accumulation rates over time coincided with major changes in botanical composition and were likely mostly controlled by primary production. This is concluded from the variations in the percentage of amorphous peat, which generally displayed similar changes between periods as the accumulation rates, for example, an increased percentage of amorphous peat as the accumulation rates increased. Hence, the production likely overruled the importance of decomposition for the resulting accumulation rates. Furthermore, the percentage of amorphous peat was correlated to the botanical composition of the peat, with Eriophorum spp. dominated peat exhibiting high percentages of amorphous peat as opposed to peat dominated by Sphagnum spp.
Our study shows the importance of including C and N isotopes in the analysis of peat stratigraphies to advance interpretation of Holocene peat growth and decay. We found a correlation between δ13C and C content in the peat, likely reflecting the relative increase of 13C depleted compounds in Sphagnum spp. and Eriophorum spp. peat during decomposition, as well as differences in the original δ13C signature of Sphagnum spp. litter. A correlation between the δ15N signature and C:N ratio likely indicated fractionation due to preferential uptake of 14N by plants from the peat.
Footnotes
Acknowledgements
We thank Elisabet Bohlin for her valuable knowledge in botany enabling the completion of this article.
Funding
Funding was provided by FORMAS, Swedish Infrastructure for Ecosystem Science (SITES), and Swedish Research Council for Environment, Agricultural Sciences and Spatial Planning (Grant/Award Number: ‘2007-666’).