
Abstract
A nested July–June precipitation reconstruction for the period AD 1777–2012 was developed from multi-century tree-ring records of Pinus sylvestris L. (Scots pine) for the Republic of Khakassia in Siberia, Russia. Calibration and verification statistics for the period 1948–2012 show a high level of skill and account for a significant portion of the observed variance (>50%) irrespective of which period is used to develop or verify the regression model. Split-sample validation supports our use of a reconstruction model based on the full period of reliable observational data (1948–2012). Thresholds (25th and 75th percentiles) based on the empirical cumulative distribution of 1948–2012 observed precipitation were used to delineate dry years and wet years of the long-term reconstruction. The longest reconstructed dry period, defined as consecutive years with less than 25th percentile of observed July–June precipitation, was 3 years (1861–1863). There was no significant difference in the number dry and wet periods during the 236 years of the reconstructed precipitation. Maps of geopotential height anomalies indicate that dry years differ from wet years primarily in the location of an anomalous 500-mb ridge approximately over the study area.
Introduction
Dendroclimatology is the science of estimating past climate from trees using various tree-ring properties, such as tree-ring width, cell size, wood density, trace element composition, and radioactive and stable isotope ratios. In this paper, we are reconstructing aspects of climate using the tree-ring widths. Different environmental factors influence the physiological progressions that control the width of annual tree-ring formation. The dominant factor limiting tree-ring width is often climate. In these cases, comparisons of mean time series of tree-ring widths and climate data, such as local meteorological data and gridded climate data sets, allow mathematical relationships to be determined, which can then be applied to estimate the same parameters for years prior to the availability of the instrumental climate data.
Strong relationships between tree-ring width time series and time series of various climate parameters indicate that climate is the primary limiting factor to tree-ring formation at our study sites in Khakassia, a Republic located in the southwestern part of Eastern Siberia on the left bank of the Yenisei River, in the territories of the Altai-Sayan region and Minusinsk Hollow (Figure 1). Given the agricultural importance of the region, it is important to understand modern climate variability of this region, such as extreme dry and wet events and to evaluate the potential for future spatiotemporal patterns. It is vital to characterize the range of potential natural climate variability over the past few centuries and develop an improved understanding of the links between large-scale climate forcing and regional extreme events. Most of the high quality and continuous instrumental climate records in the region are short, with most records covering only the latter half of the 20th century. Consequently, tree-ring records are particularly important as a powerful tool for developing qualitative and quantitative reconstructions of climate on seasonal to century or longer time scales.
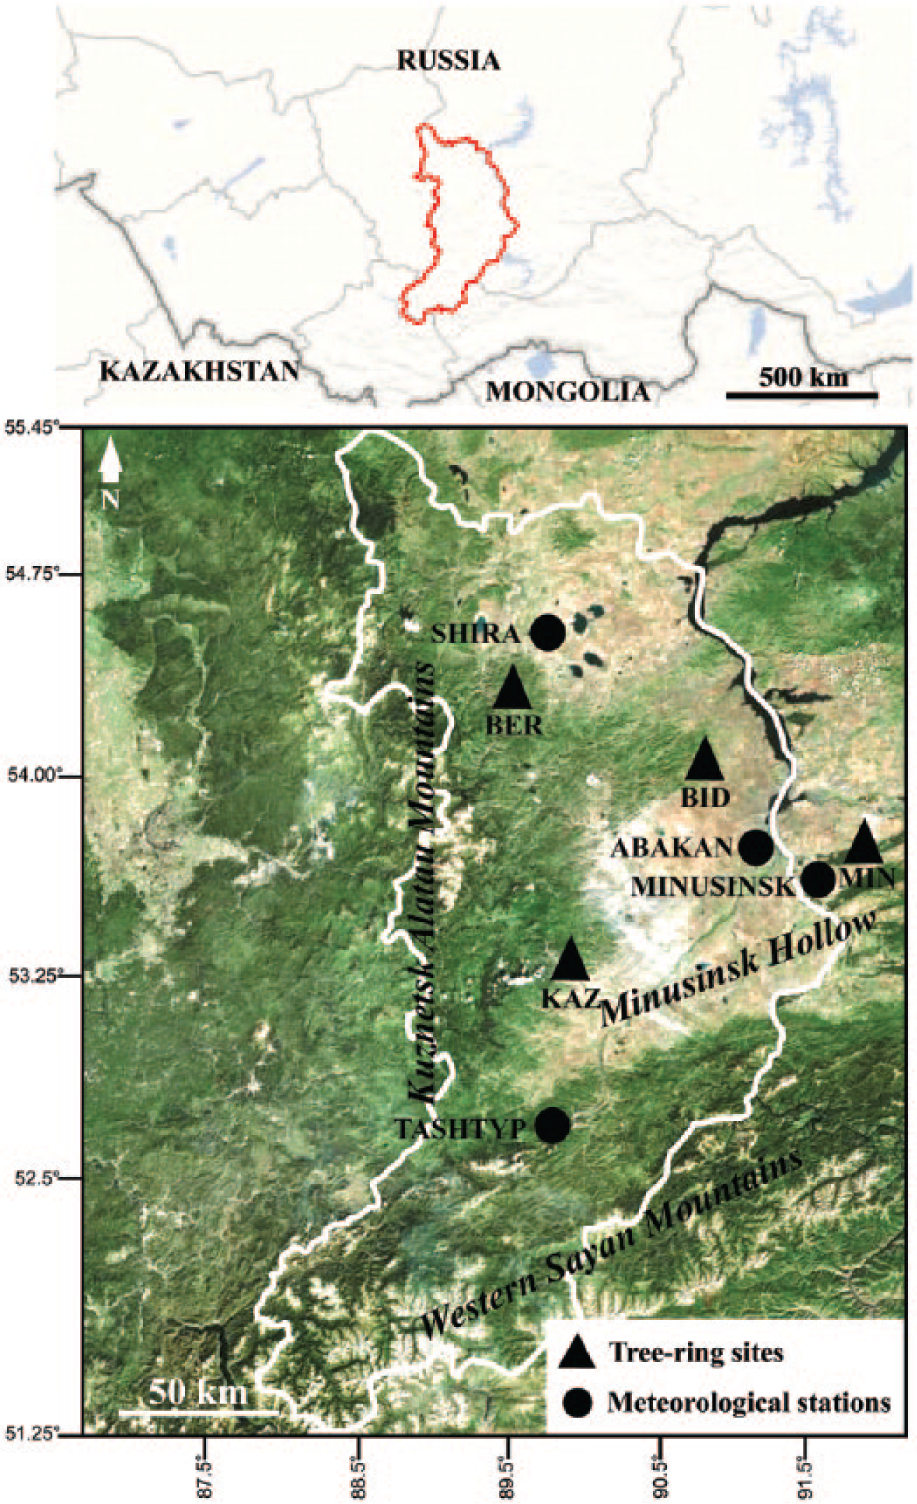
Location of tree-ring sites and climate stations.
Relatively few studies using tree rings as records of past climate (dendroclimatology) have been done in the Khakassia region when compared with many other regions of the world. Vaganov et al. (1985) investigated a wide range of ecological factors and climatic factors influencing tree-ring growth and formation. This work was followed by other dendroclimatological and ecological studies (Block et al., 2003; Magda et al., 2004, 2011; Magda and Zelenova, 2002; Knorre et al., 2010; Vaganov et al., 2006), culminating in a reconstruction of June temperature in the forest steppe of the Republic of Khakassia by Babushkina et al. (2011). Shah et al. (2015) developed a 138-year August–July Precipitation (P) reconstruction for the Abakan region as an outcome of the Fouth International Summer Course ‘Tree Rings, Climate, Natural Resources and Human Interaction’ held in Abakan, Siberia, in 2013.
The objectives of this study were to develop the first regional nested July–June P reconstruction for the Republic of Khakassia; to offer new perspectives on the level, variability, and duration of past climatic trends and extreme events in the region; and to diagnose the association between extreme dry and wet years and anomalies in atmospheric circulation using anomaly patterns of 500-mb geopotential height.
Site description
The Republic of Khakassia is part of the Altai-Sayan region and is characterized by a wide variety of physical and geographical structures and high diversity in the composition of vegetation. The western part of Khakassia is located on the eastern megaslope of the Kuznetsk Alatau and the southern part of the northern West Sayan megaslope: these two megaslopes account for more than half of the megaslopes throughout the republic. These mountain systems are clearly distinguished high mountain-forest belts.
The climate is continental, characterized by short summers and long cold winters. The average annual temperature (T) is +0.8°C (Figure 2). January is the coldest month with a mean average of −18.6°C, while July is the warmest month with a mean average of +18.7°C. Most of the annual precipitation (P) (75–90%) falls in the summer. The highest annual P is observed in the mountains (up to 2000 mm), with only 250 mm of P on the leeward slopes and interior hollows. The wettest month is July with average amount of precipitation 67–82 mm, and the driest months are February and March with 4–8 mm. The precipitation pattern is dominated by the westerlies, which transport water from the Atlantic into the Siberian interior.
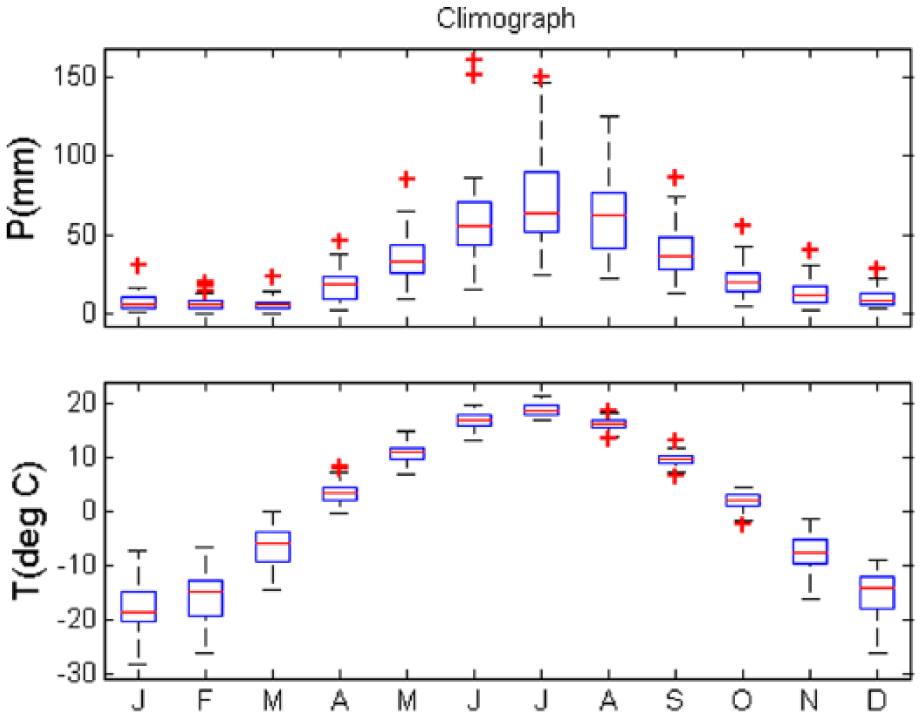
Climogram of regional monthly mean P and T for the Khakassia region, 1948–2012. P and T series of four stations developed by standardized anomaly method.
The study area is characterized by Pinus sylvestris L. (PISY) and larch forests (Larix sibirica Ledeb.). The lower part of the belt is steppe characterized by forb–grass–sedge meadows: Festuca pratensis Huds., Alopecurus pratensis L., Bromus inermis Leyss., Agropyron repens (L.) P. Beauv., Agrostis alba auct., Poa pratensis L., Deschampsia cespitosa (L.) P. Beauv., Sanguisorba officinalis L., Filipendula ulmaria (L.) Maxim., Carex sp., Vaccinium vitis-idaea L., Pyrola rotundifolia L., Calamagrostis arundinacea (L.) Roth., Poa sibirica Roshev., Aquilegia sibirica Lam., and Anemone crinite Juz.
Three PISY tree-ring sites were sampled in the forest steppe zones in Khakassia (Figure 1 and Table 1). They are Berenzhak (BER) (Babushkina et al., 2011), Bidzha (BID), and Kazanovka (KAZ). One PISY tree-ring site was sampled in Minusinsk (MIN), located in a belt of conifer forests close to the border of Khakassia in the southern part of the Krasnoyarsk Territory.
Site information for the four tree-ring sites.
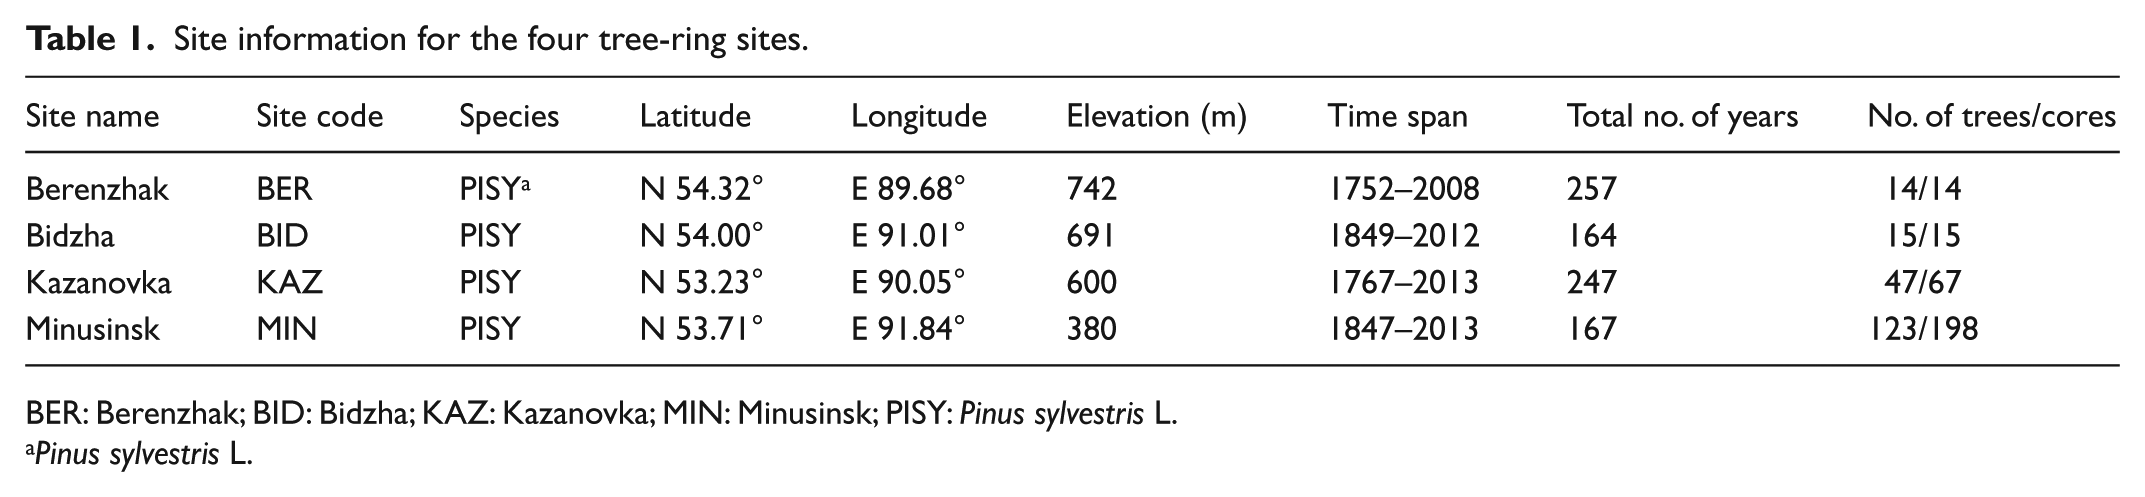
BER: Berenzhak; BID: Bidzha; KAZ: Kazanovka; MIN: Minusinsk; PISY: Pinus sylvestris L.
Pinus sylvestris L.
The subtaiga zone includes BER and KAZ sites and occupies a narrow strip adjacent to the mountainous part of Khakassia. Soils in this zone are dark gray and alfisol. The driest zone is located in central Minusinsk Hollow steppe areas on chestnut and dark chestnut soils, which includes the BID research site. The MIN site is located on sandy soils with a 15- to 20-cm-deep humus layer (Okisheva et al., 1974).
Methods and data processing
Chronology development
Samples were taken from four sites including cores taken from living trees using increment borers and full cross sections taken from stumps (Table 1). Samples were sanded to a high polish and crossdated using standard dendrochronological techniques (e.g. Stokes and Smiley, 1968; Swetnam, 1985). The width of each annual ring was measured to the nearest 0.01 mm using TSAP-LINTAB (Rinntech, 2011). Crossdating and measurement accuracy were verified using COFECHA (Grissino-Mayer, 2001; Holmes, 1983).
Each series of measured ring width was fit with a cubic smoothing spline with a frequency response of 0.50 at 67% of the series length to remove biological trends, trends potentially caused by age, size, or stand dynamics (Cook and Kairiukstis, 1990). The detrended series were then prewhitened with low-order autoregressive models to remove persistence, which was observed to be higher in the tree-ring series than in seasonal and annual precipitation. The resulting series is called a ‘residual’ index, consisting of only the interannual changes in each time series. The individual indices were combined into single averaged chronologies for each combination of site and species using a bi-weight robust estimate of the mean (Cook and Holmes, 1999; Cook and Krusic, 2005). The expressed population signal or EPS (Cook and Kairiukstis, 1990; Wigley et al., 1984) was used to identify the period over which the available data from the tree-ring time series have a signal that is strong enough to capture a large percentage of the common population tree-ring signal at a site (Table 2).
Summary statistics for the four chronologies from program ARSTAN (Cook and Holmes, 1999; Cook and Krusic, 2005).
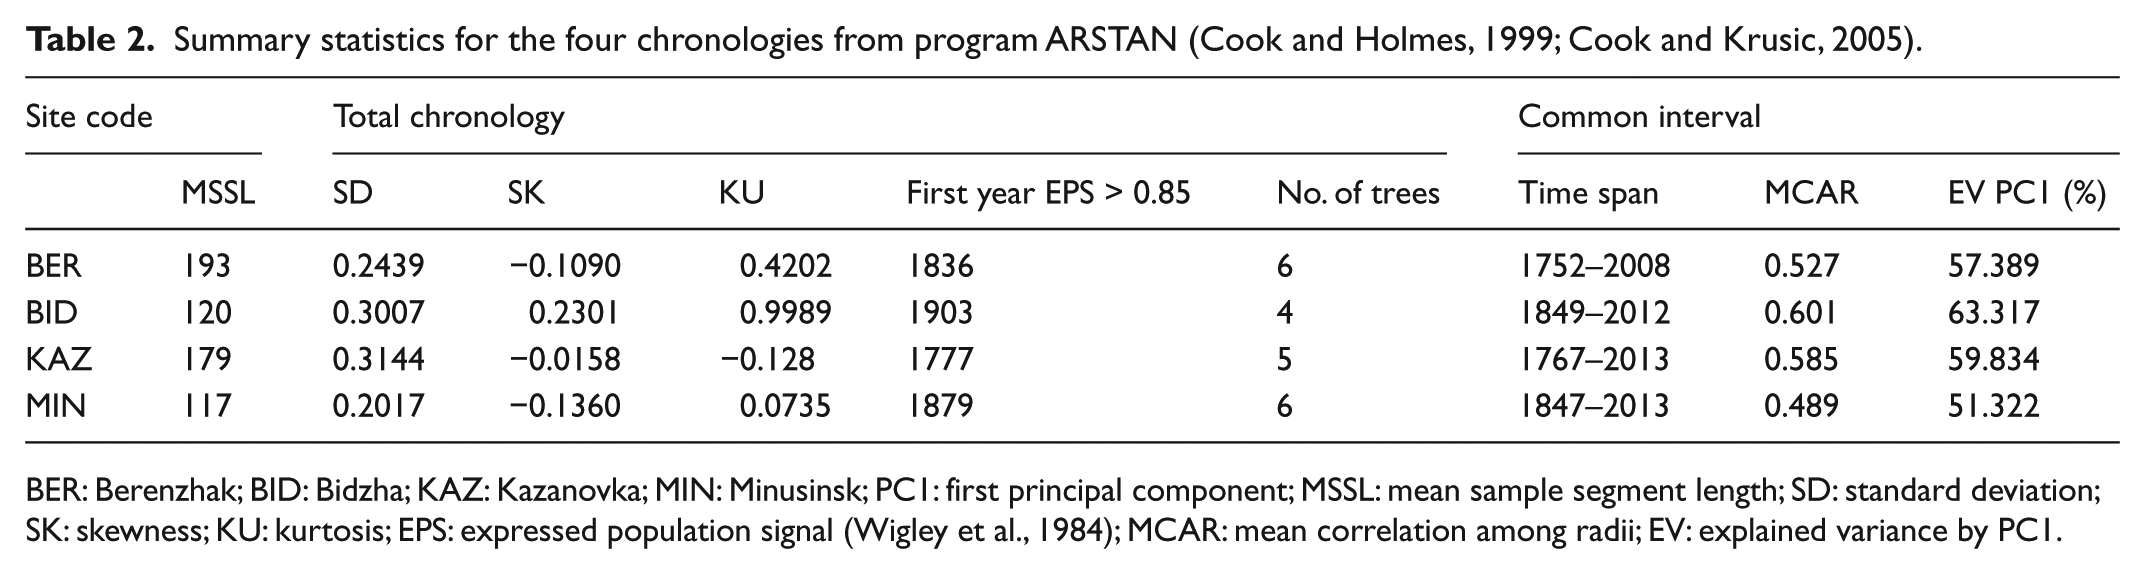
BER: Berenzhak; BID: Bidzha; KAZ: Kazanovka; MIN: Minusinsk; PC1: first principal component; MSSL: mean sample segment length; SD: standard deviation; SK: skewness; KU: kurtosis; EPS: expressed population signal (Wigley et al., 1984); MCAR: mean correlation among radii; EV: explained variance by PC1.
Climate data analysis
Monthly P and T data from four stations were obtained from the Russian Institute for Hydrometeorological Information – World Data Center (Bulygina et al., 2017a, 2017b) (Figure 1). They are Shira (N 54.50°, E 89.93°, 477 m a.s.l.), Abakan (N 53.77°, E 91.32°, 254 m a.s.l.), Minusinsk (N 53.70°, E 91.70°, 254 m a.s.l.), and Tashtyp (N 52.72°, E 89.88°, 449 m a.s.l.) (Figure 1). A regional monthly P and T series, 1948–2012, for use in calibration of tree-ring reconstruction models, was computed from the four stations by the method of averaged standardized anomalies (Jones and Hulme, 1996).
Precipitation reconstruction
The relationships between the tree-ring chronologies and the regional monthly P and T were investigated with the program Seascorr, which computes correlations and partial correlations between tree-ring data and monthly precipitation and temperature data integrated over seasons of variable length (Meko et al., 2011).
Two July–June reconstruction models were developed. The first reconstruction (AD 1777–2008) was developed using two residual chronologies (KAZ and BER). The second reconstruction (AD 1849–2012) was developed by principal component analysis (PCA), using linear regression of the climate variable on the principal components (PCs) of three tree-ring chronologies (MIN, BID, and KAZ). Scores of the three PCs were retained for use as predictors in the second reconstruction. Regression equations were calibrated on the period 1948–2012.
Nested reconstruction models (Touchan et al., 2008b, 2011, 2016) were estimated to generate a long-term reconstruction. Such nested models allow use of long chronologies for early parts of the reconstruction, while taking advantage of dense chronology coverage for later parts. While the earliest part of the reconstruction may have lower accuracy because of low site coverage, the procedure allows for a maximum length reconstruction.
Predictors for models were selected by stepwise regression. The predictor pool for stepwise comprised the full pool of available PCs. Adjusted R2 and Mallows’ Cp statistic (Mallows, 1973) were used as guides to guard against overfitting. Mallows’ Cp is a statistic used to assist in choosing between competing multiple regression models. Mallows’ Cp compares the precision and bias of the full model to models with the best subsets of predictors.
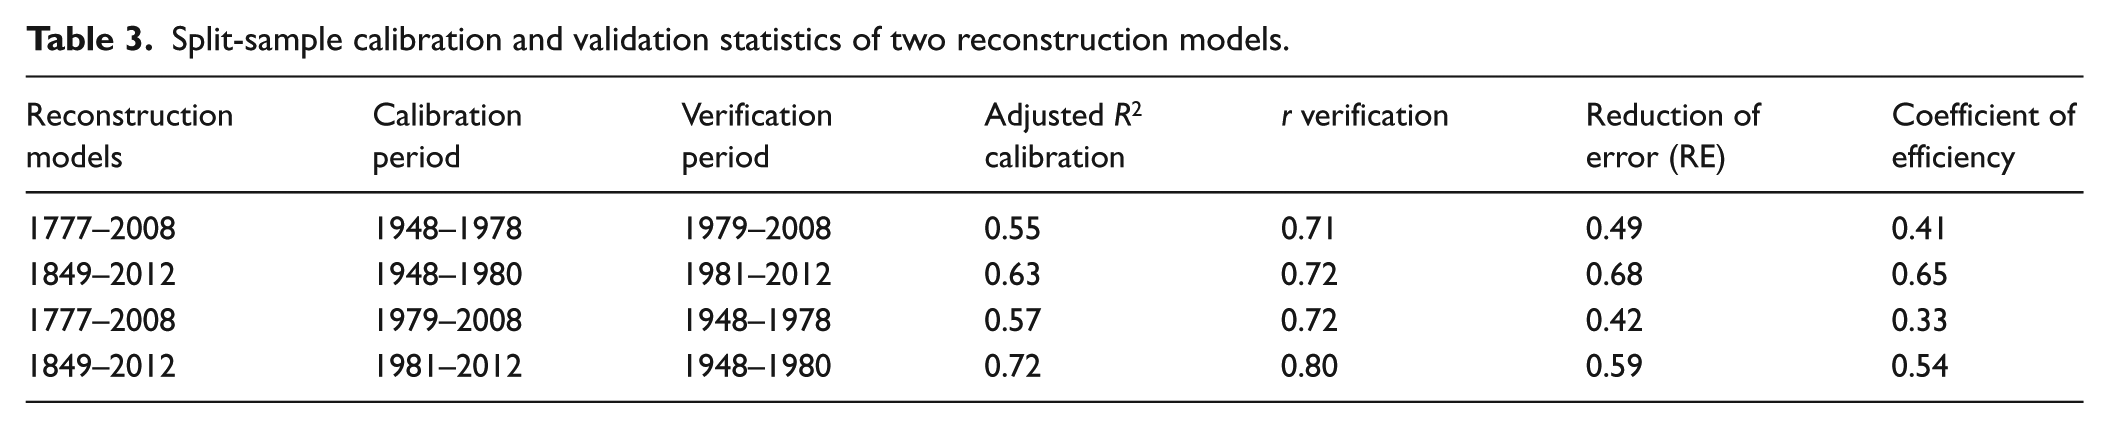
Models for the two reconstructions were validated with a split-sample procedure (Meko and Graybill, 1995; Snee, 1977; Touchan et al., 2014) that divides the full period (1948–2012) into two subsets to verify the stability of the model. Calibration accuracy was measured by the adjusted R2, and validation skill by the Pearson correlation coefficient (r), the reduction of error (RE), and the coefficient of efficiency (CE) (Cook et al., 1994). The strength of the model for the final reconstructions was calibrated on the full period (1948–2012) and further validated using the predicted residual sums of squares (PRESS) procedure (Fritts et al., 1990; Meko, 1997; Touchan et al., 2011, 2014, 2016; Weisberg, 1985). The PRESS method is a form of leave-one-out cross-validation, where a model is validated by repeated calibration and validation, each time leaving one observation out of the calibration set and applying the model to predict the omitted observation.
Analysis of extreme events
Runs analysis (Dracup et al., 1980) was used on the reconstructions to study extreme dry and wet events. Empirical thresholds for the dry and wet events were defined as 25th and 75th percentiles of instrumental measurements of precipitation for the period 1932–2012. Low-frequency time series variations in reconstructed precipitation were summarized with moving averages (5-year). Composites of April–July 500-hPa geopotential height anomalies from the 1948–2012 mean were created using National Centers for Environmental Prediction (NCEP)–National Center for Atmospheric Research (NCAR) reanalysis data (Kalnay et al., 1996) to illustrate atmospheric circulation contrasts between extremely dry years and extremely wet years in the period 1948–2012.
Atmospheric circulation analysis
The relationship between extremely dry or wet years in the region and atmospheric circulation anomalies from April–July season was studied using composite maps of 500-mb geopotential height anomalies (departures from the long-term mean of the height of a pressure surface, e.g. 850 mb, 700 mb, and 500 mb above mean sea level) using NCEP/NCAR reanalysis data (Kalnay et al., 1996) and drawn with the mapping tool provided by National Oceanic and Atmospheric Administration (NOAA)/Earth System Research Laboratory (ESRL) Physical Sciences Division (http://www.esrl.noaa.gov/psd/).
Results and discussion
Chronology development
The length of the four chronologies ranges from 257 (BER) to 164 years (BID) (Table 1). Statistical analyses of each chronology are summarized in Table 2. The mean correlation among individual radii at each site represents the strength of their common signal and ranges from 0.48 (MIN) to 0.60 (BID). The mean sample segment length (MSSL) of the four chronologies ranges from 117 to 193 years and is adequate to investigate multidecadal climate variability (Cook and Peters, 1997).
PCA applied to the three chronologies showed a strong common statistical growth signal for their overlapping years. Principal component 1 for the three chronologies accounts for 65% of the tree-ring variance.
Precipitation reconstruction
Seascorr identified July to June total P as the most appropriate seasonal predictand for reconstruction (Figure 3). T influence, summarized by partial correlations in Seascorr, is significant for the single month of July. The negative sign of partial correlations for this month indicates that high T during the growing season has a negative effect on the radial growth. High T is associated with increased evapotranspiration from the soil surface and drought stress on the trees (Babushkina et al., 2011; Shah et al., 2015).
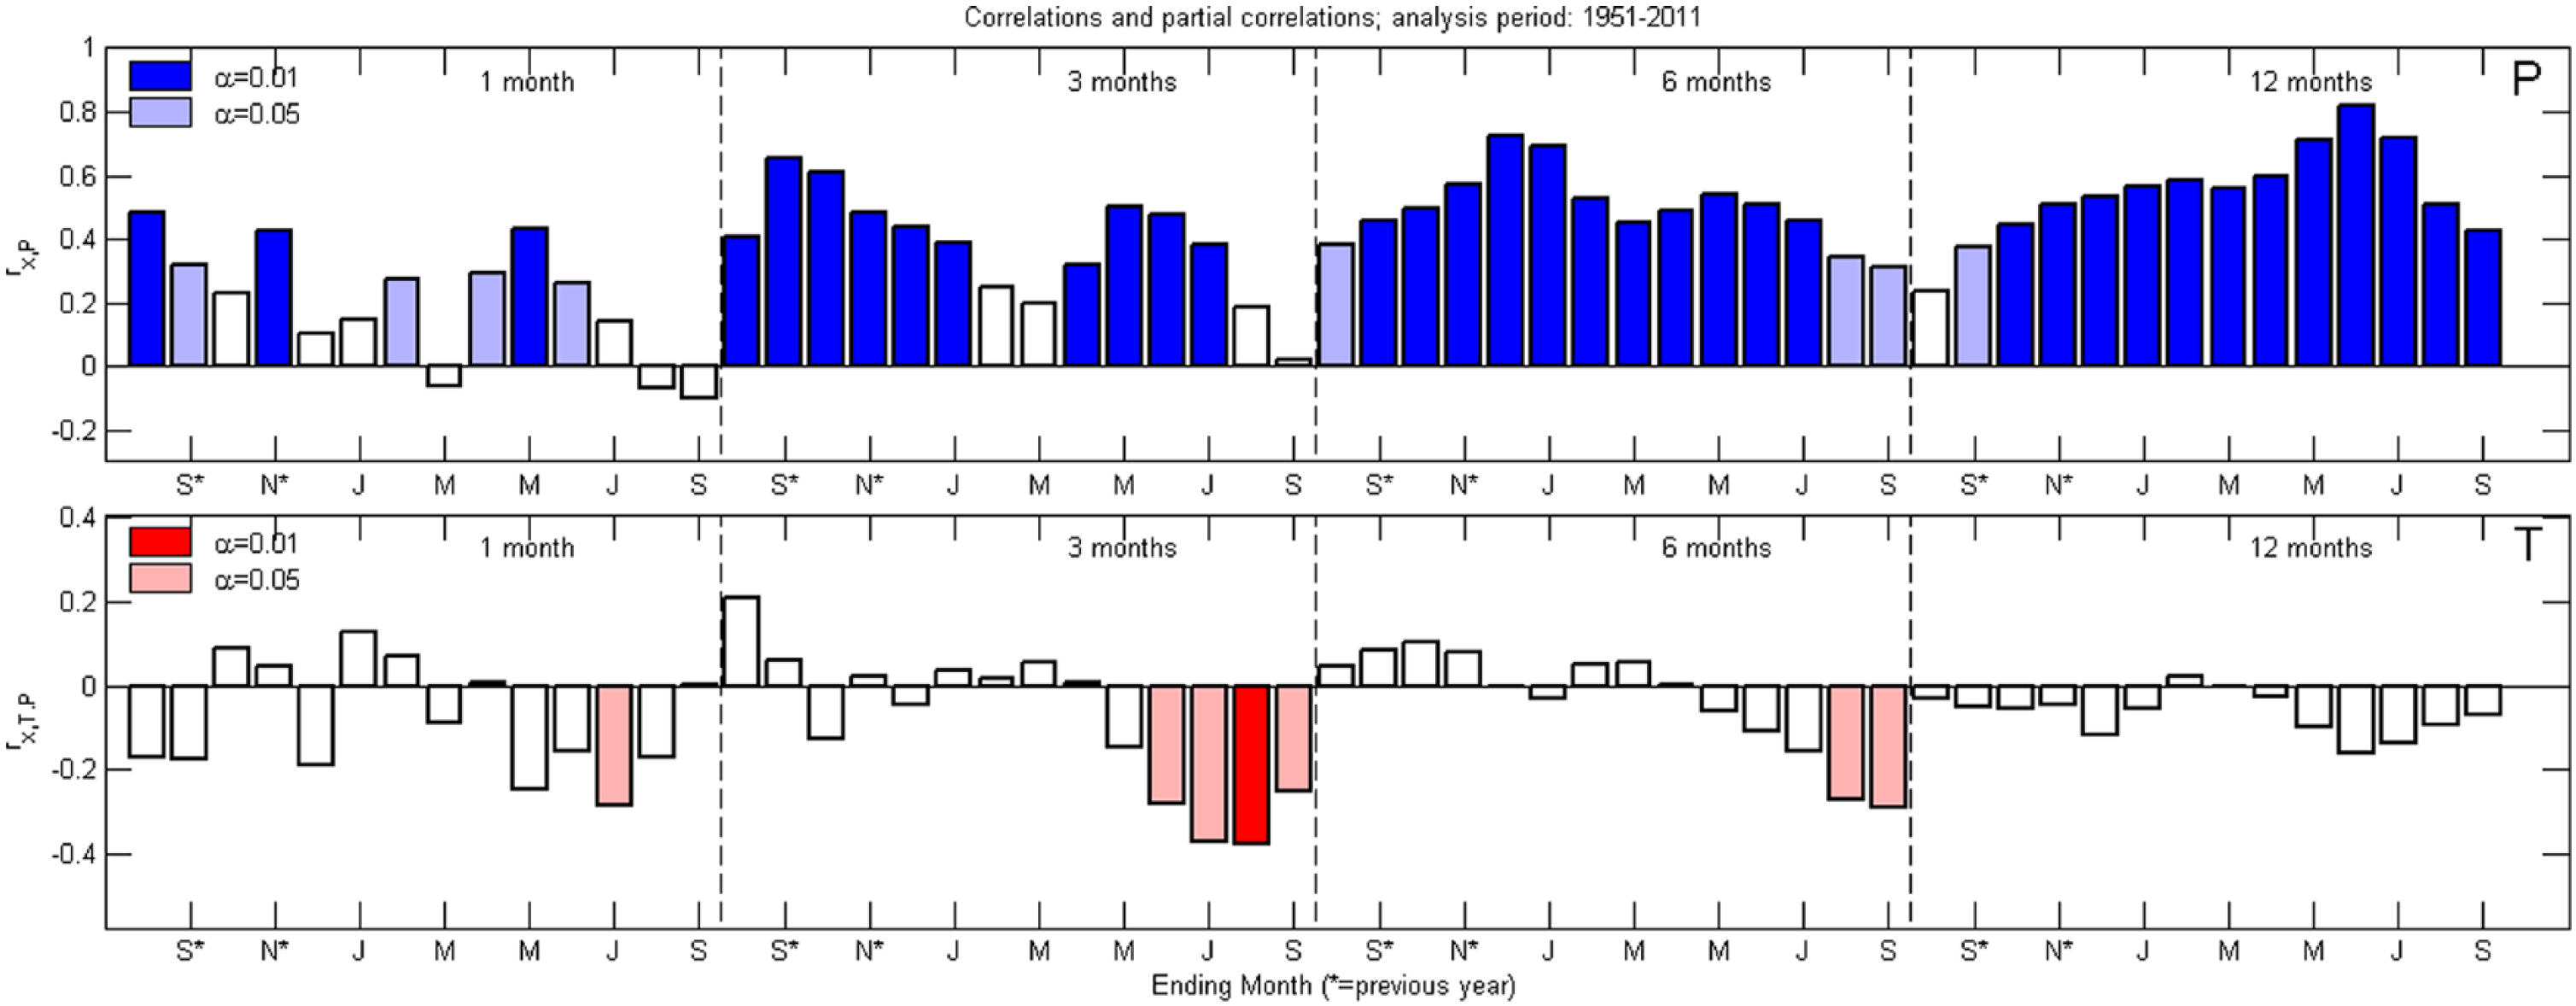
Program Seascorr summary of seasonal climatic signal in Pinus sylvestris residual chronology data. The tree-ring variable is the score time series of the first principal component (PC1) of four residual tree-ring chronologies (PC analysis described in text). Climatic variables are regional monthly anomalies for P and temperature of four meteorological stations. (Top figure) Correlations for precipitation. (Bottom figure) Partial correlations for T. Colors indicate Monte Carlo–derived significance of correlation or partial correlation (Meko et al., 2011) for α levels 0.01 and 0.05. Analysis period is years 1948–2012.
Two nested reconstruction models, with total P as a predictand, were estimated. Time coverage by these models is 1777–2012 and 1849–2012. The 1777–2012 model relies on just two chronologies. The year 1777 was identified by the EPS statistic (Wigley et al., 1984). The stepwise regression process, with adjusted R2 and Mallows’ Cp (Mallows, 1973) as selection cutoff criteria, resulted in selection of a simple model with just PC1 as a predictor for the 1849–2012 model. The same statistics applied to the earliest model (1777–2012) allowed both available chronologies to enter as predictors. Nested models calibrated on 1948–2012 explain 54–67% of the calibration-period variance, according to the regression adjusted R2 (Figure 3).
Time plots of reconstructed and observed P for the calibration periods of the two models are included in Figure 4. The split-sample validation supports use of the reconstructions based on the full period of reliable observational data (1948–2012). The nested reconstruction utilized the two models to take advantage of the robustness derived from the models that incorporated a greater number of chronologies. The beginning years of the nested reconstructions are 1777 and 1849; the number of chronologies contributing to those models is 2 and 3, respectively. Cross-validation using the PRESS procedure (Weisberg, 1985) indicated that the two models can adequately estimate P data not used to fit the model (Figure 4 and Table 3). Split-sample validation likewise supported temporal stability of the relationship between P and the tree-ring data and application of reconstruction models calibrated over the full climate overlap 1948–2012.
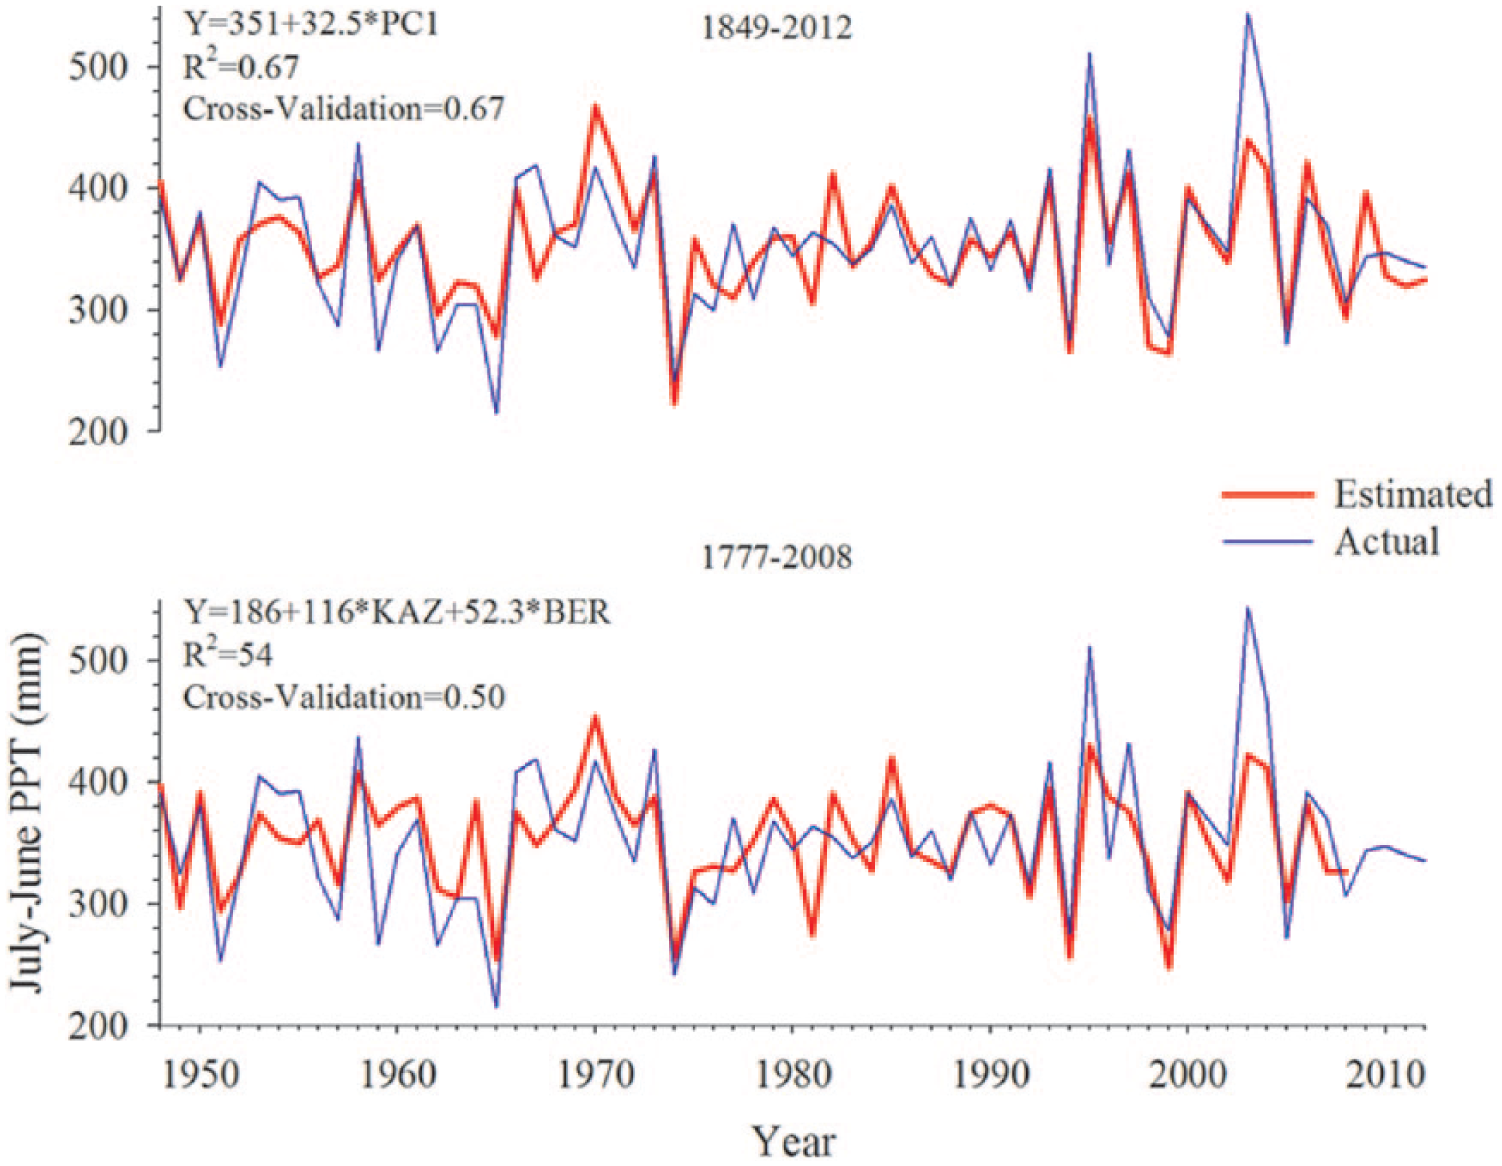
Time plots of reconstructed and instrumental P for the calibration periods of the two models. The start years of the nested reconstructions are 1777 and 1849; the number of chronologies contributing to those models is 2 and 3.
Split-sample calibration and validation statistics of two reconstruction models.
Analysis of extreme events
The July–June reconstruction time series is plotted in Figure 5. The long-term reconstruction contains 48 drought events with a mean interval of 6 years. The number of events classified by duration is as follows: durations of 1, 2, and 3 years have 27, 9, and 1 events, respectively. The maximum interval between events is 15 years (1918–1932). The longest drought is a 3-year event in 1861–1863. The driest year in the reconstruction is 1974 (224 mm), while the driest year in the instrumental P data is 1965 (215 mm). The frequency of dry years is higher in the 19th century, the same century with the extreme 3-year event.
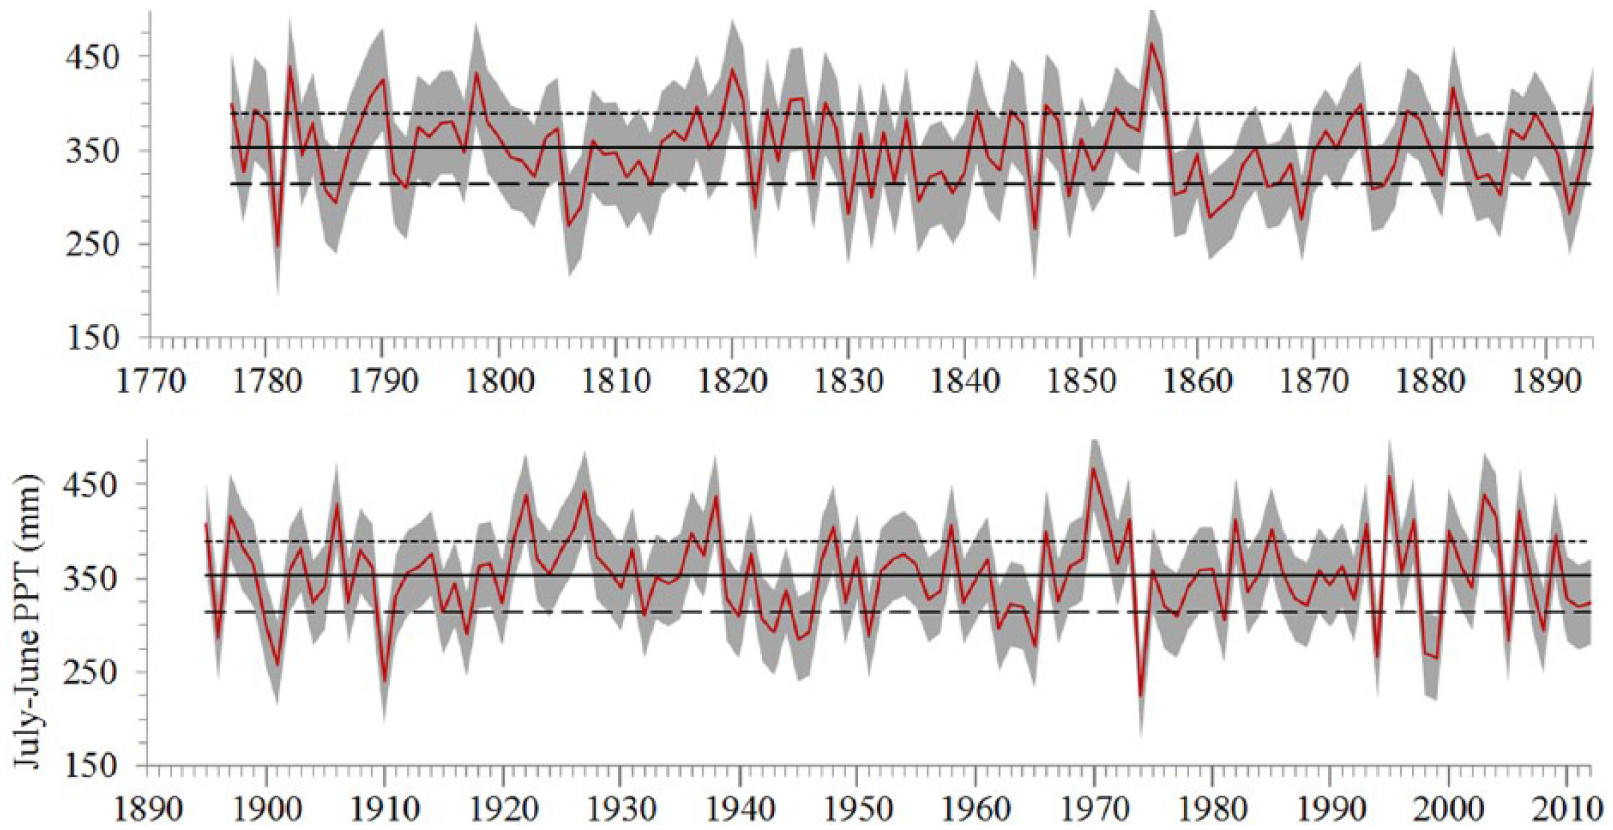
Time series plot of reconstructed July–June precipitation, AD 1777–2012. Horizontal solid line is the mean of the instrumental P data. Horizontal dotted line is the empirical threshold of 75th percentile of the regional July–June P of 1948–2012. Horizontal short-dashed line is the empirical threshold of 25th percentile of the regional July–June P of 1948–2012.
The July–June reconstruction contained 49 wet events with a mean interval of 5.7 years. The number of events classified by duration 1 and 2 years is 31 and 9 events, respectively. The maximum interval between wet events is 19 years (1799–1817). The wettest year in the reconstruction is 1970 (467 mm), while the wettest year in the observed P data is 2003 (544 mm). The frequency of wet years is similar in the 19th and 20th centuries.
Our July–June precipitation reconstruction is significantly correlated (r = 0.85, n = 138, p ≤ 0.0001) with the August–June P reconstruction (AD 1875–2012) developed by Shah et al. (2015) for Minusinsk Hollow. The two reconstructions correlate highly in part because Shah et al. (2015) used a subset of the chronologies used in this new reconstruction. Our addition of new chronology KAZ, developed in 2013, and chronology BER, developed in 2008, strengthens the tree-ring signal for P and allows extension of P reconstruction for the region to AD 1777.
A 5-year moving average of the reconstruction demonstrates multi-annual to decadal variation in July–June P and suggests several prolonged wet and dry events (Figure 6). The driest 5-year reconstructed period is 1942–1946 (303 mm). The wettest 5-year reconstructed period is 1969–1973 (408 mm), a period of exceptionally high tree growth.
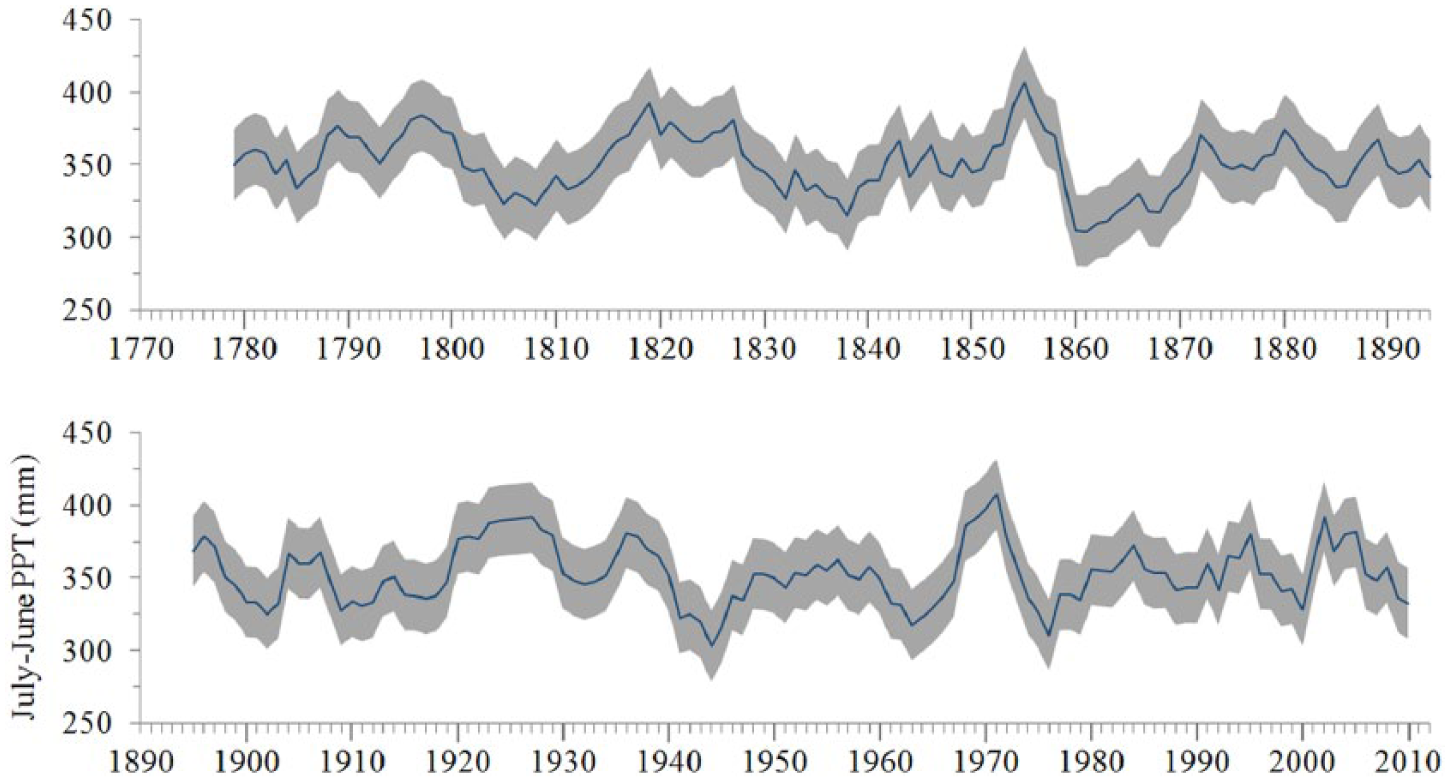
A 5-year moving average. Values are plotted at the center year of each 5-year period for the 1777–2017 reconstruction. Uncertainty in reconstructed values is shown by an 80% confidence interval (shaded).
Several major historical events coincide with extreme dry periods seen in the July–June precipitation reconstruction. Vatin (1916–1922) reported that the dry period from 1836–1837 reduced the summer crop production. Kostrov (1858) stated that the dry years of 1830 and 1849 affected crop production caused a decline in the export of agricultural products to the Krasnoyarsk district and caused negative impact on the economy of the region. Butanaev (2002) reported that the dry period from 1900 to 1902 caused shortage in forage production and forced the Abakan and Askiz regions to cut in half the size of their herds of horses.
Atmospheric circulation analysis
The composite April–July mean difference (dry–wet) 500-mb anomaly map based on three of the driest and wettest years shows a strong anomalous ridge centered at about 90° W, at the approximate longitude of the study area (Figure 7). The pattern is consistent with increased stability and low storm activity and precipitation. The pattern, with the core of the anomalous ridge to the south over western China and southwestern Mongolia, suggests strengthening of the westerlies and anticyclonic curvature over the study region as a signature during dry years.
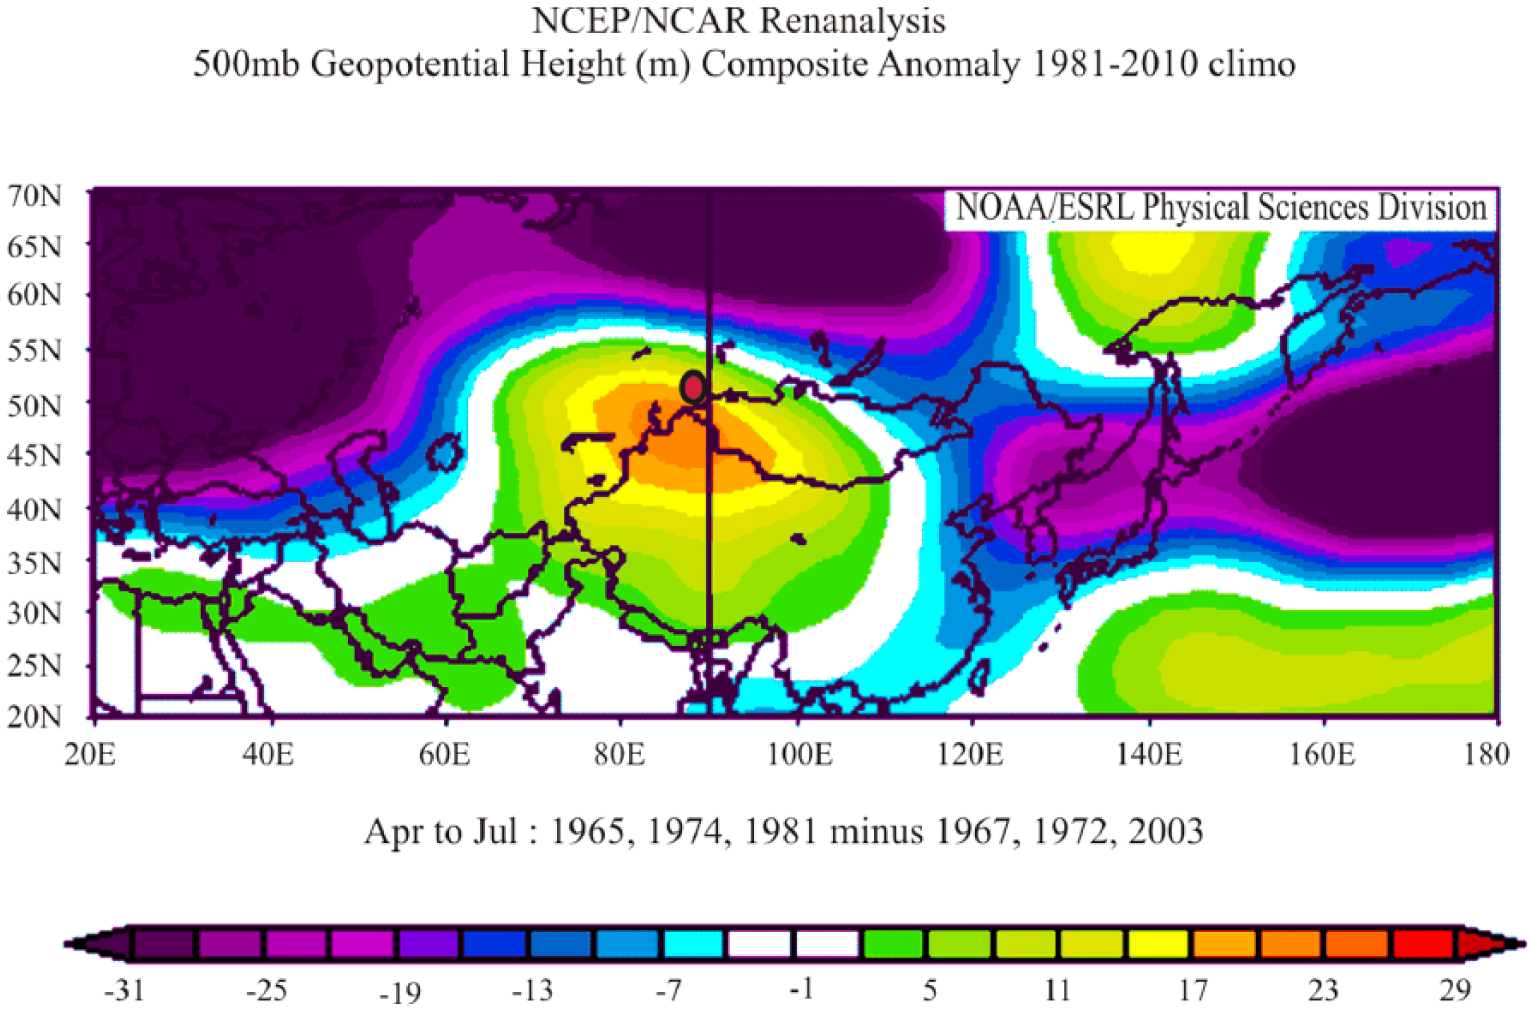
Composite map of difference in April–July 500-mb height anomalies in dry years and wet years. Years represented in the composites are among the driest (or wettest) 10 years in April–July observed precipitation in the Khakassia region. Dry years are 1965, 1974, and 1981. Wet years are 1967, 1972, and 2003. Anomalies (color bar) are departures (m) from 1981 to 2010 climatology. Circle indicates approximate location of tree-ring sites. Map drawn with online mapping tool from the NOAA Earth System Research Laboratory (http://www.esrl.noaa.gov/psd/cgi-bin/data/getpage.pl).
A spatial correlation map was developed between 0.5° gridded P data from the Climatic Research Unit (CRU) TS3.23 data set (Harris et al., 2014) and July–June reconstructed P, 1901–2012 (Figure 8). The broad spatial extent (N 48°–55°, E 79°–98°) of significant correlation coefficients attests to the regional signal in the tree-ring reconstruction and is consistent with the large-scale atmospheric circulation anomalies suggested by the composite April–July mean difference (dry–wet) 500-mb anomaly map (Figure 7).
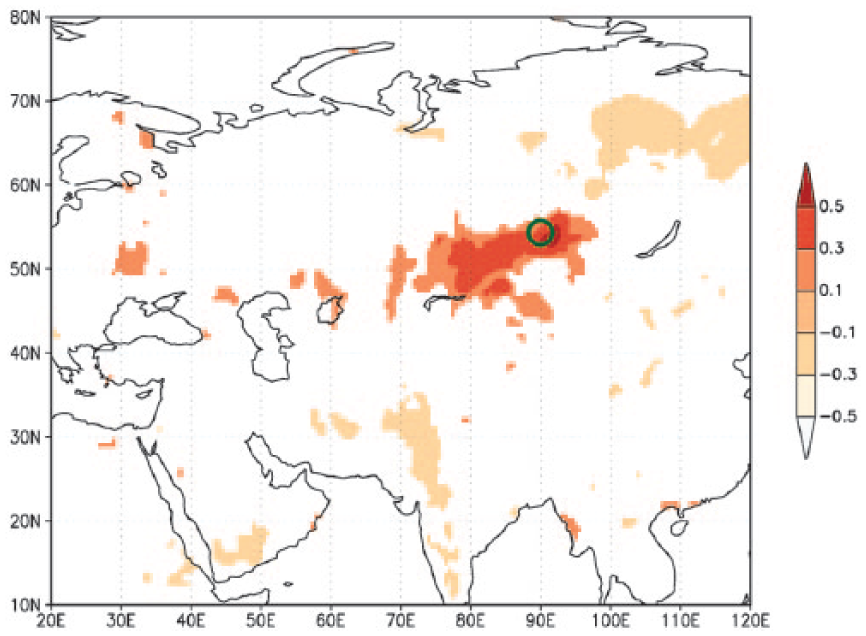
Spatial correlation pattern of gridded P with the reconstructed July–June P from tree rings using Climate Explorer website (http://climexp.knmi.nl). The study area is marked with a circle. Analysis period is 1902–2012 (see text).
Conclusion
The July–June P reconstruction for the period AD 1777–2012 developed from multi-century tree-ring records for the Republic of Khakassia in Siberia, Russia. This P reconstruction provides a baseline for studying past climate variability in the region and should be useful for more precise interpretation of the social and environmental history of the region. Calibration and verification of the statistical analyses indicate high accuracy for this tree-ring reconstruction of P. The longest period of reconstructed drought during the last century is 3 years, defined in this study as consecutive years below the 25th percentile. There was no significant difference in the number of dry and wet periods during the 236 years of the reconstructed precipitation.
The strong association of dry and wet years with distinct patterns of 500-mb geopotential height anomaly suggests that expanded tree-ring coverage could yield several centuries of reliable information on variations in trough and ridge behavior over southern Siberia for the important spring to early summer precipitation season.
Footnotes
Acknowledgements
The authors wish to thank Professor Vladimir Shishov and David M Meko for their valuable help in the field and David M Meko and William E Wright for their useful comments on the manuscript.
Funding
This study was supported by the funding provided by the Russian Foundation for Basic Research (15-44-04309) and the partial funding provided by US National Science Foundation US National Science Foundation under grant ATM-GEO/ATM-Paleoclimate Program 0758486 and AGS-Paleo-Perspectives on Climate Change Program 1103314.