



Abstract
The eastern Lesotho highlands are of considerable hydrological importance to southern Africa as a so-called ‘water tower’ for the surrounding region. Here, we contribute proxy-data inferring climate and vegetation changes over the past 1600 years, assessing in parallel inorganic and organic chemical analyses on a sediment core from Ladybird wetland, eastern Lesotho. Several proxies were used to determine changes in local vegetation dynamics, productivity, hydrology (δ13 C, δ15 N, C/N, TOC) and the input and source of the detrital components (Ca/Ti, CIA). The first part of the multi-proxy record (AD 400–800) shows stable terrestrial conditions and low detrital input, followed by higher variability in almost all proxies between ca. AD 900 and 1200. The δ13 C record infers a higher proportion of C4 vegetation, tentatively associated with higher temperatures during this phase, coeval with the Medieval Climate Anomaly (MCA). After AD 1200, local conditions change gradually from purely terrestrial, towards the typical wetland environment prevailing today. A higher proportion of C3 plants and possibly an increase in aquatic organisms within the organic matrix corresponds with decreasing detrital input, suggesting locally high available moisture in this part of Lesotho during the Little Ice Age (LIA). Although age-model constraints impedes a robust regional comparison, the inferred climate variability is discussed as a tentative response to enhanced mid-latitude cyclonic activity during LIA, and the variable MCA climate conditions as indirectly dictated by changes in solar activity.
Keywords
Introduction
The wetlands of the Lesotho highlands are of considerable hydrological importance to southern Africa as they act to store and regulate large reservoirs of water (Grab, 2010). Today, these wetland ecosystems are subject to major anthropogenic impacts in the form of water extraction, mining and road construction (Grundling et al., 2014). The often water-logged conditions at these sites, in combination with low temperatures throughout the year, enable preservation of organic material and prevents decomposition (Fitchett et al., 2016b; Grundling et al., 2014). Consequently, changes in key environmental parameters are preserved within such organic sequences, providing evidence for past climate and environmental change through time (e.g. Finch and Hill, 2008; Fitchett et al., 2016b; Humphries et al., 2016; Neumann et al., 2014; Norström et al., 2014; Scott et al., 2012).
The palaeoenvironmental contexts of eastern Lesotho’s wetlands have received attention over several decades, but have only recently been examined in detail (e.g. Fitchett et al., 2016b, 2017b; Marker, 1994; Olaleye et al., 2014; Van Zinderen Bakker, 1955). These studies primarily confirm fluctuations in moisture availability in the eastern Lesotho highlands in cycles of ~2000 years (Fitchett et al., 2016b; Marker, 1994; Van Zinderen Bakker, 1955). Findings also suggest changes in the seasonality of precipitation through time (Fitchett and Bamford, 2017; Fitchett et al., 2016b; Mills et al., 2012). Temperature reconstructions for the region are less robust, but include evidence for cold conditions during the late Pleistocene (Fitchett et al., 2016b) and brief cold periods coinciding with the Younger Dryas (Loftus et al., 2015), 8.2 kyr event (Fitchett et al., 2017b) and the Little Ice Age (LIA, ca. AD 1250–1850) (Fitchett et al., 2016a). Although the exact timing and duration remains unclear, warmer than present conditions, such as the global Holocene Altithermal, have been confirmed for eastern Lesotho and the South African Drakensberg (Fitchett et al., 2016b; Neumann et al., 2014). The late-Holocene (last ca. 2 millennia) has not been adequately studied in Lesotho (Fitchett et al., 2016a; Parker et al., 2011), and particularly multi-proxy approaches are lacking for the periods associated with the LIA and the Medieval Climatic Anomaly (MCA, ca. AD 900–1250). Although southern African evidence for these climatic events is available (Nash et al., 2016), data from eastern Lesotho have been too coarse in resolution to confirm the timing or relative temperature departures associated with these globally coherent events (Fitchett et al., 2017a).
Our aim is to provide a relatively detailed temporal analysis of late-Holocene climate, vegetation, mineral matter origin and hydrology, as recorded from the Ladybird wetland, eastern Lesotho Highlands (Figure 1). This is achieved by analysing the inorganic component (elemental variations) in combination with chemical analysis of the organic fraction (δ13 C, δ15 N, C/N), thereby presenting a suite of proxies providing new paleo-environmental information that is indirectly related to regional climate conditions in eastern Lesotho since ca. AD 400.
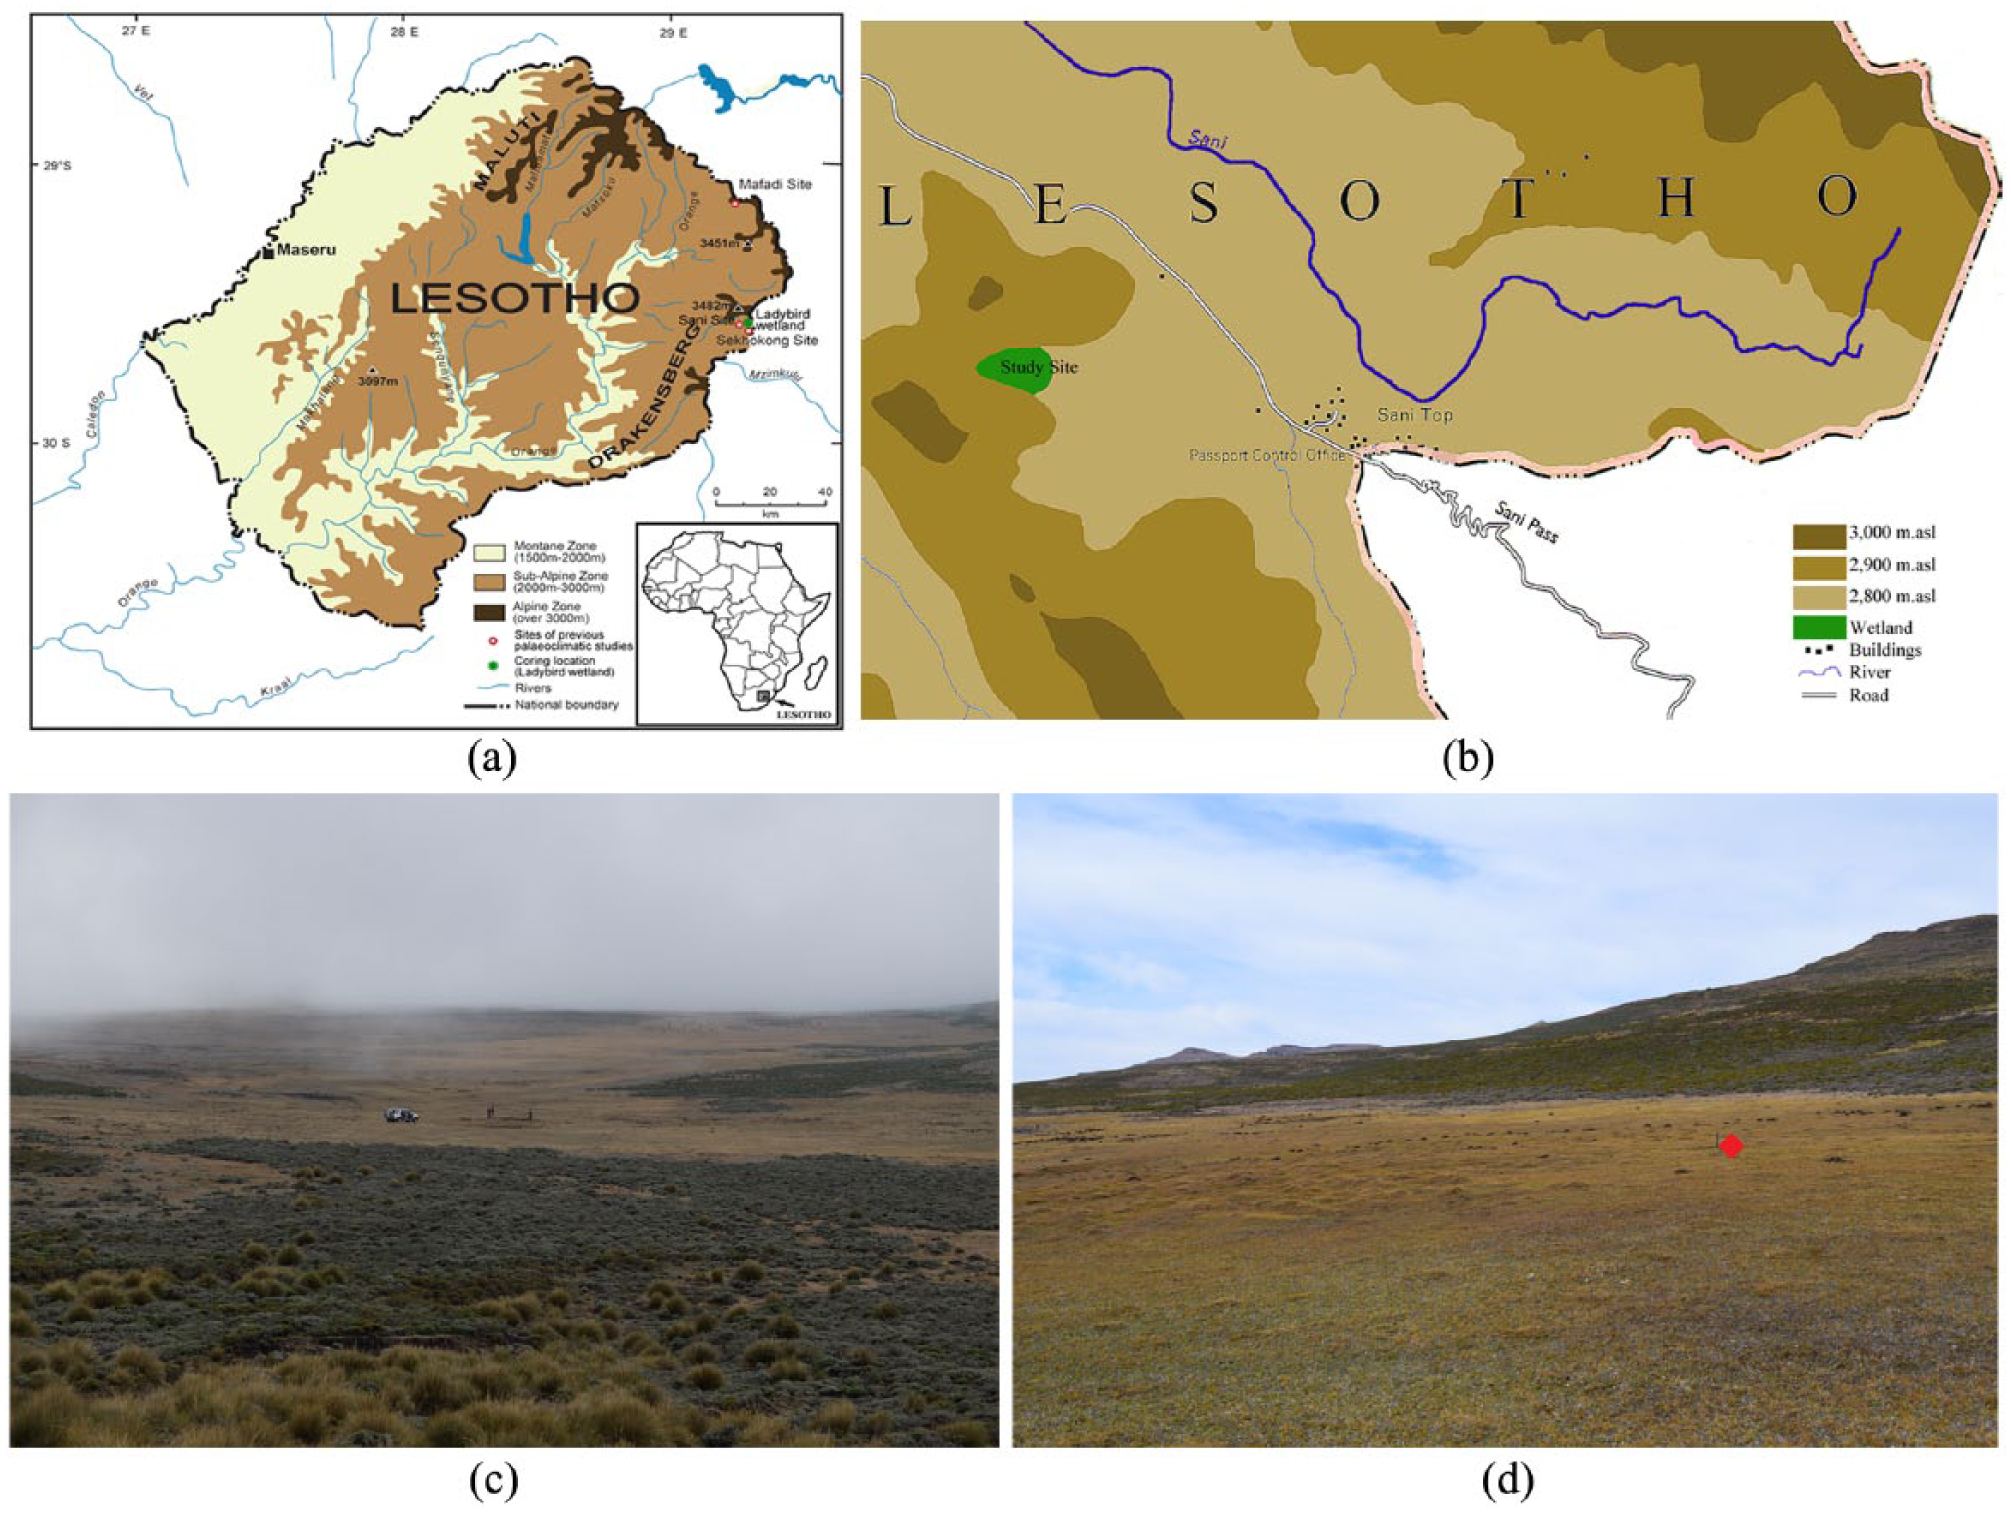
Orientation maps and photos. (a) Topographical map over Lesotho indicating the location of the Ladybird wetland and its relation to other study sites in eastern Lesotho highlands, (b) local setting of Ladybird wetland, (c) photo of Ladybird wetland taken from valley slope looking east-northeast. The mound is located near the base of the valley. (d) Photo of the site facing south-east. The core was taken slightly upslope from the mound avoiding the thúfur (coring site indicated by red square).
Regional setting
The study area is located in the eastern Lesotho highlands, in the Drakensberg, ca. 1–2 km west of the Great Escarpment edge (Knight and Grab, 2015) (Figure 1). Bedrock at this altitude comprises entirely of Jurassic-age amygdaloidal tholeiitic basalt of the Drakensberg group (Grab et al., 2005; Ramluckan, 1992).
Lesotho is located in the summer rainfall region of southern Africa with ca. 80% of the annual precipitation falling between October and March. Mean annual precipitation at Sani Top is estimated between 800 and 1600 mm (Grab, 2010; Sene et al., 1998), which is somewhat higher than the 768 mm measured at Sani Pass between 2001 and 2005 (Nel and Sumner, 2008). Most contemporary summer precipitation has its origin as moisture transported from the Indian Ocean and orographic uplift along the Great Escarpment (Sene et al., 1998). Snowfalls occur about 11–12 times per annum between March and November, but are usually light (<5 cm) (Grab et al., 2017). Mean annual air temperatures are estimated at ca. 6°C above 3000 m a.s.l. (Grab, 1997; Nel and Sumner, 2008), with mean summer temperatures of ca. 10°C and mean winter temperatures of ca. 0°C (Grab, 2002).
Contemporary vegetation at relatively high altitudes (2300–2900 m a.s.l.) mainly consists of grasslands dominated by Themeda triandra and Festuca caprina, while the alpine zone above 2900 m a.s.l. is characterised by grasslands and heath vegetation (Grundling et al., 2014). While the surrounding high-altitude grassland biome is clearly dominated by C3 grasses (Mucina and Rutherford, 2006; Vogel et al., 1978), both C3 and C4 types are represented within the Lesotho mires (AZf5). Among the most common local Graminae species are Agrostis bergiana var. bergiana, Agrostis lachnanatha, Koeleria capensis (C3 Poaceae), Bulbostylis densa (C4 Poaceae), Carex congnata, Isolepis costata, Scirpus ficinioides (C3 Cyperaceae), Bulbostylis densa, Kyllinga erecta (C4 Cyperaceae) (Mucina and Rutherford, 2006).
Local environment
The Ladybird wetland is located at 2890 m a.s.l. (29°35’8.08”S 29°15’56.71”E), where it formed near the bottom of a moderately sloping valley (ca. 12–16%) (Figure 1). Morphological characteristic are in line with the typical mires of Lesotho mountains, with peat formation sustained by positive water balance all year round supported by groundwater from artesian springs in particular, as well as rainwater, and surface runoff (Grundling et al., 2014). A raised dome ca. 9 m across has formed around the spring, which sits near the centre of the ca. 3 ha wetland. The dome itself is covered with cryogenic earth hummocks (thúfur), ca. 15 cm high and 50–70 cm in diameter, formed as a product of differential frost heave (see Grab, 2005a, 2005b). The area surrounding the wetland is dry, with indications of gully erosion and alpine turf exfoliation pans (Grab, 2010). The site is located at the transition between the Lesotho Highland Basalt grassland (LHBG; Gd 8; 1900–2900 m a.s.l.) and the Drakensberg Afroalpine Heathland (DAH; Gd 10; 2900–3400 m a.s.l.) (Mucina and Rutherford, 2006). The area is classified by Acocks (1953) as Themeda-Festuca Alpine Veld, with Themeda triandra being important in the lower and middle elevations, while Festuca caprina is more common at higher altitudes (within Gd 8).
Materials and methods
Fieldwork
Coring was performed slightly up slope from the dome (Figure 1d), avoiding any obvious microtopography (i.e. thúfur), in May 2015 using a Russian corer (50 cm long, Ø 4.75 cm). A preliminary stratigraphic description was made in the field after core retrieval. Overlapping core sections were taken to a depth of 120 cm depth, after which it became impossible to core deeper owing to a gravel horizon. Cores were wrapped in plastic film and stored in a cold room at 4ºC until analysis.
Radiocarbon dating
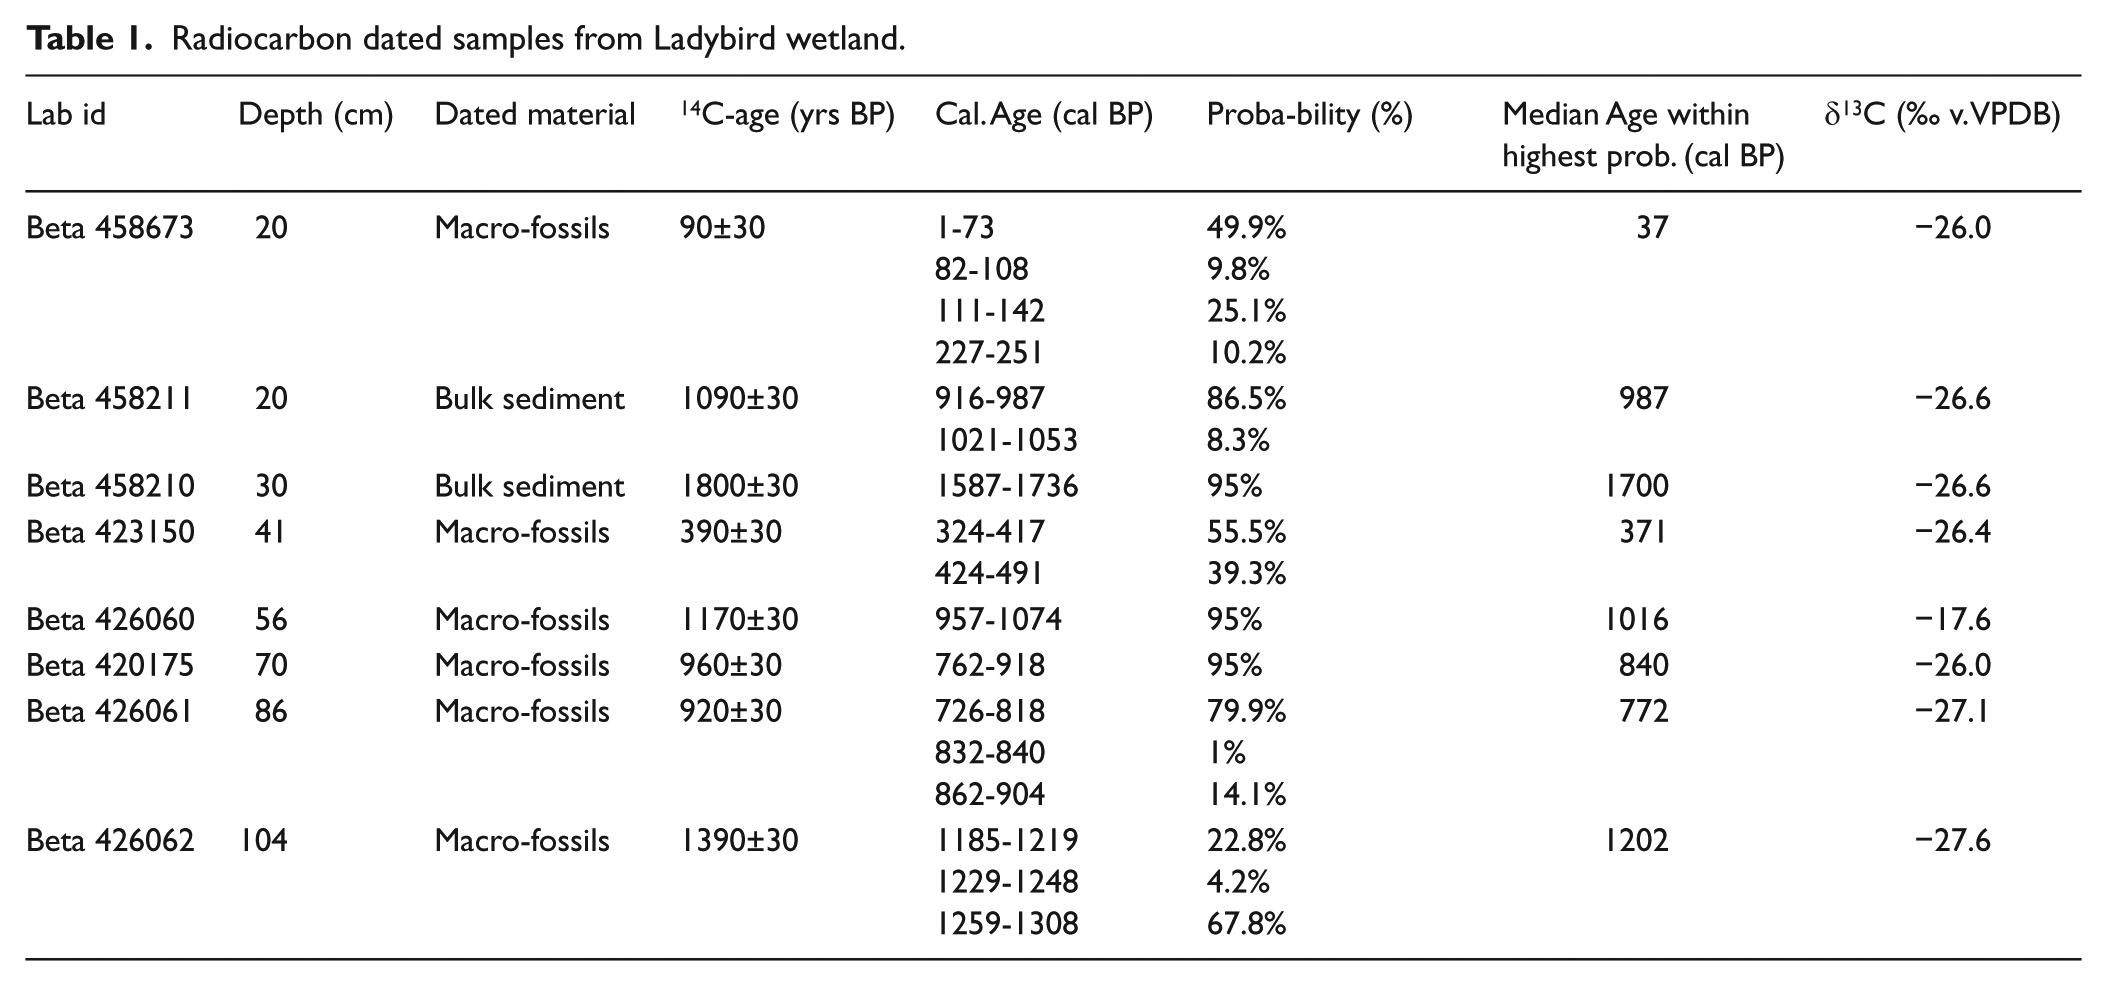
Macrofossil plant remains were identified and selected under microscope and sent to Beta Analytic Radiocarbon Dating Laboratory (London, UK) for accelerator mass spectrometry (AMS) 14C dating. A total of eight samples were dated: six using macrofossils and two using bulk organic sediment (Table 1). Radiocarbon dates were calibrated using the southern hemisphere calibration curve (SHCal13) (Hogg et al., 2013).
Radiocarbon dated samples from Ladybird wetland.
Organic and inorganic geochemistry
Samples were scanned at the S: Lab at the Department of Geological Sciences, Stockholm University using an Itrax XRF core scanner (XRF-CS) using a Mo tube set to 30 kV and 40 mA at a step size of 2 mm and an exposure time of 20 seconds. Based on counting statistics (i.e. signal above background), reliable data were acquired for Si, K, Ca, Ti, Fe, Br, Rb, Sr, Y and Zr. Presented profiles are smoothed using a five point running mean. Thereafter, the cores were carefully sub-sampled in 1 cm increments using a stainless steel knife, freeze-dried and milled using a ball mill. Based on the XRF-CS results, a sub-set of samples (with 3- to 5-cm intervals) were selected for quantitative analysis using a Bruker S8-Tiger WD-XRF (wavelength dispersive x-ray fluorescence) (XRF-WD) analyser equipped with a Rh-anticathode X-ray tube, at the Department of Ecology and Environmental Sciences, Umeå University, Sweden, following the protocol for lake sediments as described by Rydberg (2014). The accuracy and precision of this method is ± 10% for the suite of elements studied (Na, Mg, Al, Si, K, Ca, Sc, Ti, Mn, Fe, Br, Rb, Sr, Y and Zr). In contrast to the XRF-CS, the XRF-WD gives elemental concentrations in percent or parts per million (and not signal intensities as the XRF-CS). The calibration method used takes into account variations in organic content and corrects for inter elemental matrix effects. For further details, please refer to Rydberg (2014). The elemental concentrations are given as percent of the total sample weight and have not been recalculated to elemental concentrations of the minerogenic fraction (i.e. no normalisation to organic matter content has been made). This has an influence on the absolute values for the calculated SiO2, Na2O and K2O, but has no effect on the elemental ratios or the chemical index of alteration (CIA).
Total organic carbon and nitrogen content (TOC, %N) together with their stable isotopes (δ13C, δ15N) was measured at every 2–5 cm using a Finnigan DeltaV mass spectrometer coupled with a CarloErba NC2500 elemental analyser at the Stable Isotope Laboratory (SIL), Stockholm University. Reproducibility was calculated to be better than 0.15‰ for δ13C and δ15N, and the relative error for TOC and %N was <1%.
Results
Age–depth modelling and stratigraphy
The AMS analysis indicates that age dates of the sample sequence are not chronological (Table 1). For dates obtained from plant macrofossils, contamination by roots may be discarded, suggesting that at age-reversals it is more likely to be associated with processes acting towards an old-age effect. This suggests two major age-reversals at 20 and 30 cm, and one minor at 56 cm depth (Table 1). Two of those are based on bulk sediments (20 and 30 cm). As carbonates are not present in the area, the most likely reason for such age-reversals is thus re-deposition of older material from the surrounding slopes. Such processes are active today, both in the form of slope processes, resulting in erosion and re-deposition of large amounts of material from the surrounding area (Marker, 1994), as well as the collapse or disintegration of earth hummocks within the wetland itself (Backéus and Grab, 1995; Grab, 2005a; Van Zinderen Bakker and Werger, 1974). Alternatively, cryoturbation (differential frost heave) is likely to have been an active process during recent times, whereby older material is heaved above overlying younger material. The 20 and 30 cm bulk samples were thus excluded from the age–depth model. The macrofossil sample at 56 cm depth also suggests a certain age-reversal, although less significant than the bulk samples (Table 1). The δ13C-value (–17‰) of this sample is anomalous, suggesting a C4 plant origin, or influences of algae or bacteria (Cloern et al., 2002; Lamb et al., 2006). To be consistent, we have included this date together with all the other macrofossil dates for the final age–-depth model.
The age–depth model (Figure 2) was obtained using the Bacon software (Blaauw and Christen, 2011) and indicates a basal age of ca. AD 400. Dates were extrapolated to the bottom of the sequence using the extrapolation function in the Bacon software. Overall sedimentation and accumulation rates are low, with an average of 0.8 mm yr-1, varying between ca. 0.5 and 1.6 mm yr-1. The base of the core is composed of blue-grey clayey sandy layers with an increasing occurrence of orange tinged laminations moving upwards. Between 104 and 96 cm, the sediment is darker and more organic rich. The sediment shifts to a mixture of orange, grey and organic rich laminations until 87 cm when black, well-decomposed organic rich accumulation commences. There is a slight return to more mineral-rich accumulation at 74 cm but from this depth upwards the sediment becomes increasingly organic rich. The material shifts in colour from grey to brown around 60 cm of depth, while between 40 and 30 cm of depth the material becomes increasingly fibrous with larger and larger visible macrofossils. There is also some darker banding in this upper section of the sequence. All litho-stratigraphic boundaries are gradational over several centimetres. Although hiatuses in the sequence cannot be discarded, the absence of sharp stratigraphic boundaries suggests continuous accumulation over time. The weakness in age–depth control, however, urges for humble temporal treatment of paleo-data. This particularly concerns the record covering the extrapolated time period (before AD 700).
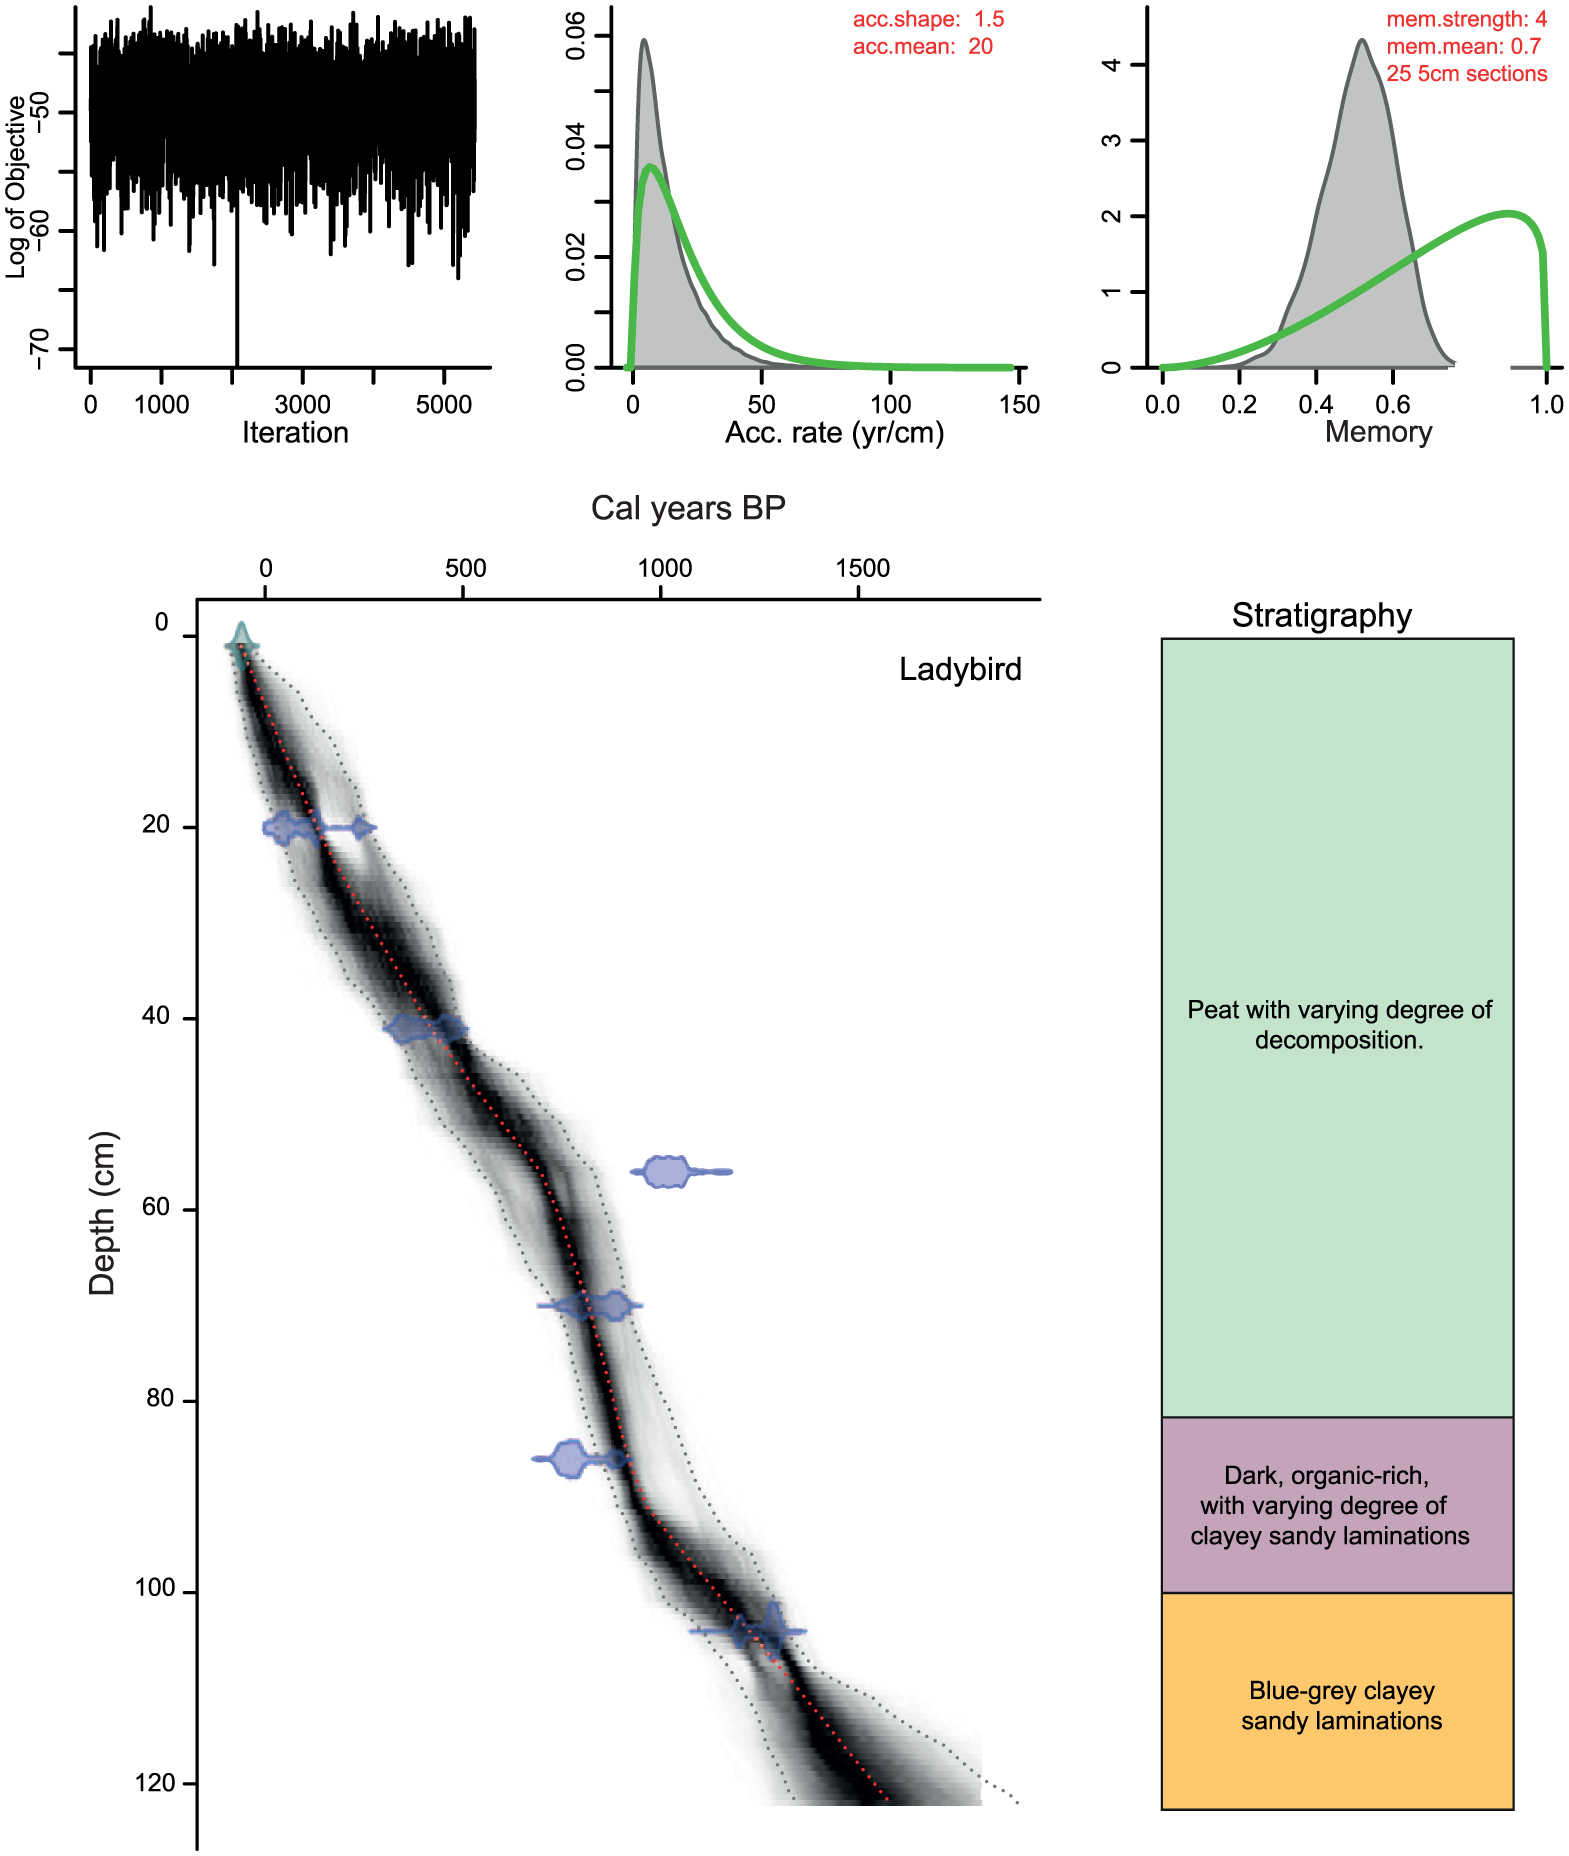
Age–depth model of the Ladybird sediment core yielded though Bacon software (Blaauw and Christen, 2011), with major litho-stratigrapical units indicated (see text for details). All boundaries between stratigraphic units were gradational.
Organic geochemistry
TOC increases steadily throughout the section, varying from 1.2% in the early part of the record, and eventually reaching above 20% after AD 1800 (Figure 3). Nitrogen content follows the trends of TOC, with minimum values of <0.2% between AD 400 and 700, and maximum values of 2% after ca. AD 1800. An occasional peak in both TOC and N is reported between AD 1000 and 1100. The C/N ratio declines steadily from values >25 around AD 400, towards lower values (14–15) between AD 700 and 800, followed by relatively high values (19–20) until AD 1200, only interrupted by a sharp decline centred after AD 1200; around AD 1050, C/N stabilises at around 12.
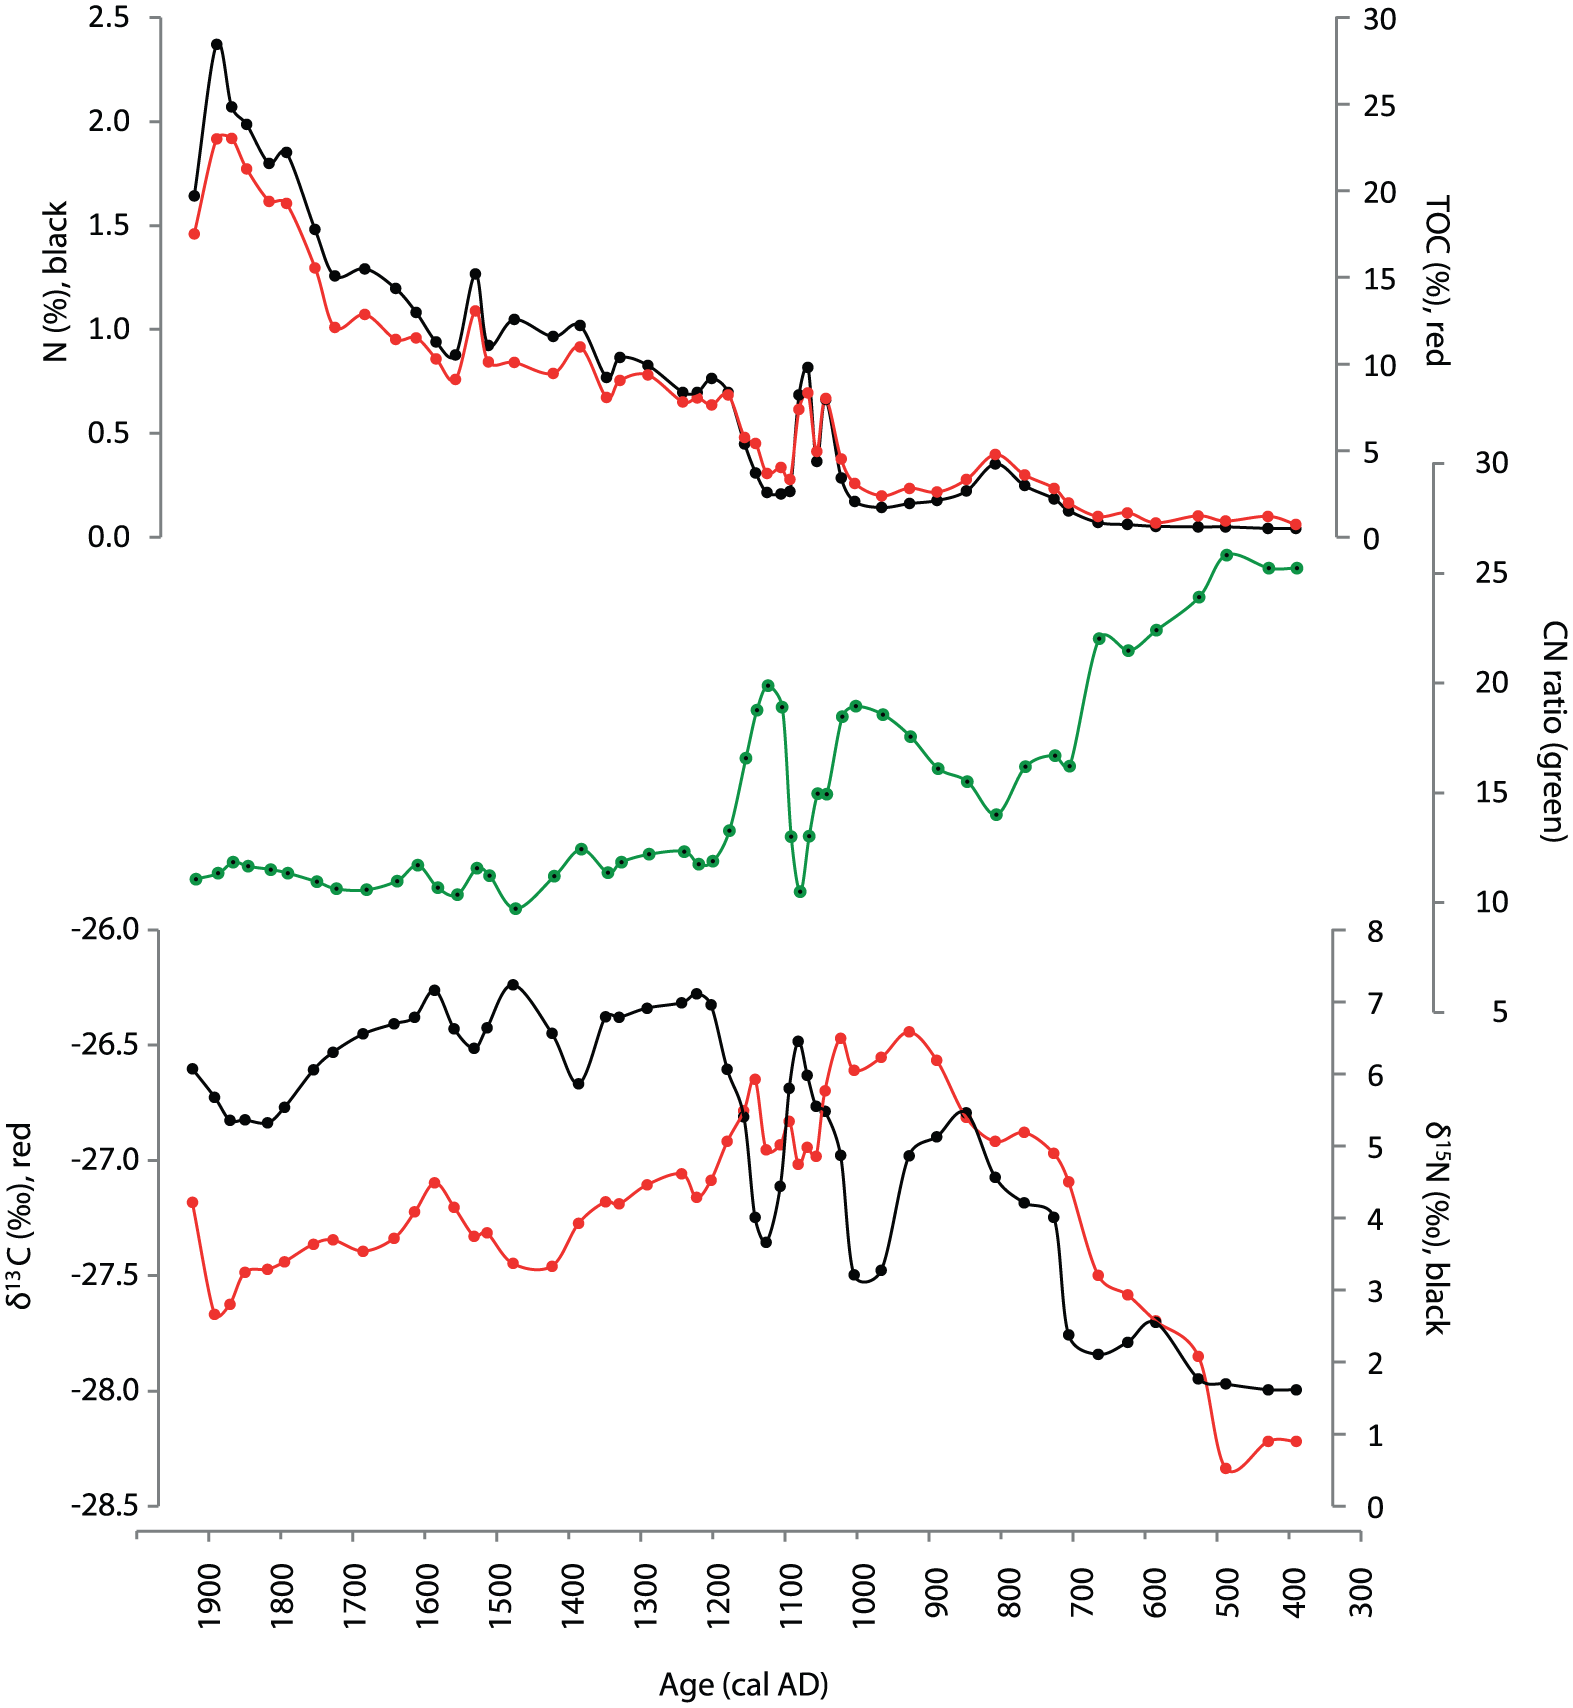
Organic geochemistry. From top: total organic carbon (TOC, red) and nitrogen content (%N, black), C/N ratio (green), carbon isotope composition (δ13C, red) and nitrogen isotope composition (δ15N, black).
The δ13C record reports lowest values in the oldest parts of the sequence, with minimum values around −28.3‰ between AD 400 and 500. The δ13C-values then increase, reaching maximum values of –-26.4‰ between AD 900 and 1050, followed by a decline centred at AD 1100. The δ13C values then indicate a minor increase around AD 1150, followed by a gradual decline throughout the remaining sequence. The δ15N values show a minimum of ca. 2.5‰ between AD 400 and 500, followed by a gradual increase until a maximum δ15N value of 7‰ is reached around AD 1200. The increasing trend is interrupted by two sharp troughs centred at AD 1000 and AD 1120. Between AD 1200 and 1600, δ15N values stay relatively stable at ca. 7‰, while slightly lower values are recorded during the 19th century (Figure 3).
Inorganic geochemistry
In order to distinguish different sources elemental concentrations were converted to the most common oxides and Na2O + K2O were plotted against SiO2 values (Figure 4). This produced three distinct source fields, which are typical of basalts, picrobasalts and fiodites. All three sources are depleted in Na2O, K2O and SiO2 in relation to Sani Pass Basalts (average value of 67 samples shown) (Ramluckan, 1992). The Chemical Index of Alteration (CIA) was calculated based on the elemental concentrations from the XRF-WD analysis (CIA = (Al2O3/(Al2O3 + CaO + K2O + Na2O))*100). This index remains around values of 74–80 in the basal part of the record up to AD 1125, with the main exception of the sample at AD 975 (Figure 4 and 5). Higher values (80–83) are observed in the middle section up to AD 1770 when a decrease to profile lows is observed at AD 1915 (68). The Ti XRF-CS data are presented as z-scores, which deals with the scaling effects incurred by closed-sum data (Eriksson et al., 1999). The XRF-CS and XRF-WD data largely show the same trend with higher values in the basal portion with again the main exception of the decrease observed at AD 975, and an abrupt decrease at AD 1105 followed by a long-term decline to the top of the profile, with the lowest values observed at AD 1865–1915 (Figure 5). The XRF-CS data show more variability than the XRF-WD data, particularly in the basal portion of the record. Examination of the sample matrix in this part of the sequence reveals the presence of distinct, potentially organic bands of sediment, as well as gravel. The latter were not included in the samples analysed by XRF-WD. Matrix changes such as these would produce a variable profile like that seen for Ti. Ca/Ti ratios based on XRF-CS and XRF-WD show the same general long-term pattern with low values between AD 400 and 1105, but with more significant peaks around AD 470, 810 and 1065. Generally increasing values occur between AD 1125 and 1725, with a more exceptional increase between AD 1440 and 1545, and more rapidly increasing values at the top of the profile from AD 1725 to AD 1865–1915.

Inorganic geochemistry. Na2O + K2O plotted against SiO2 for identification of shifts in source areas.
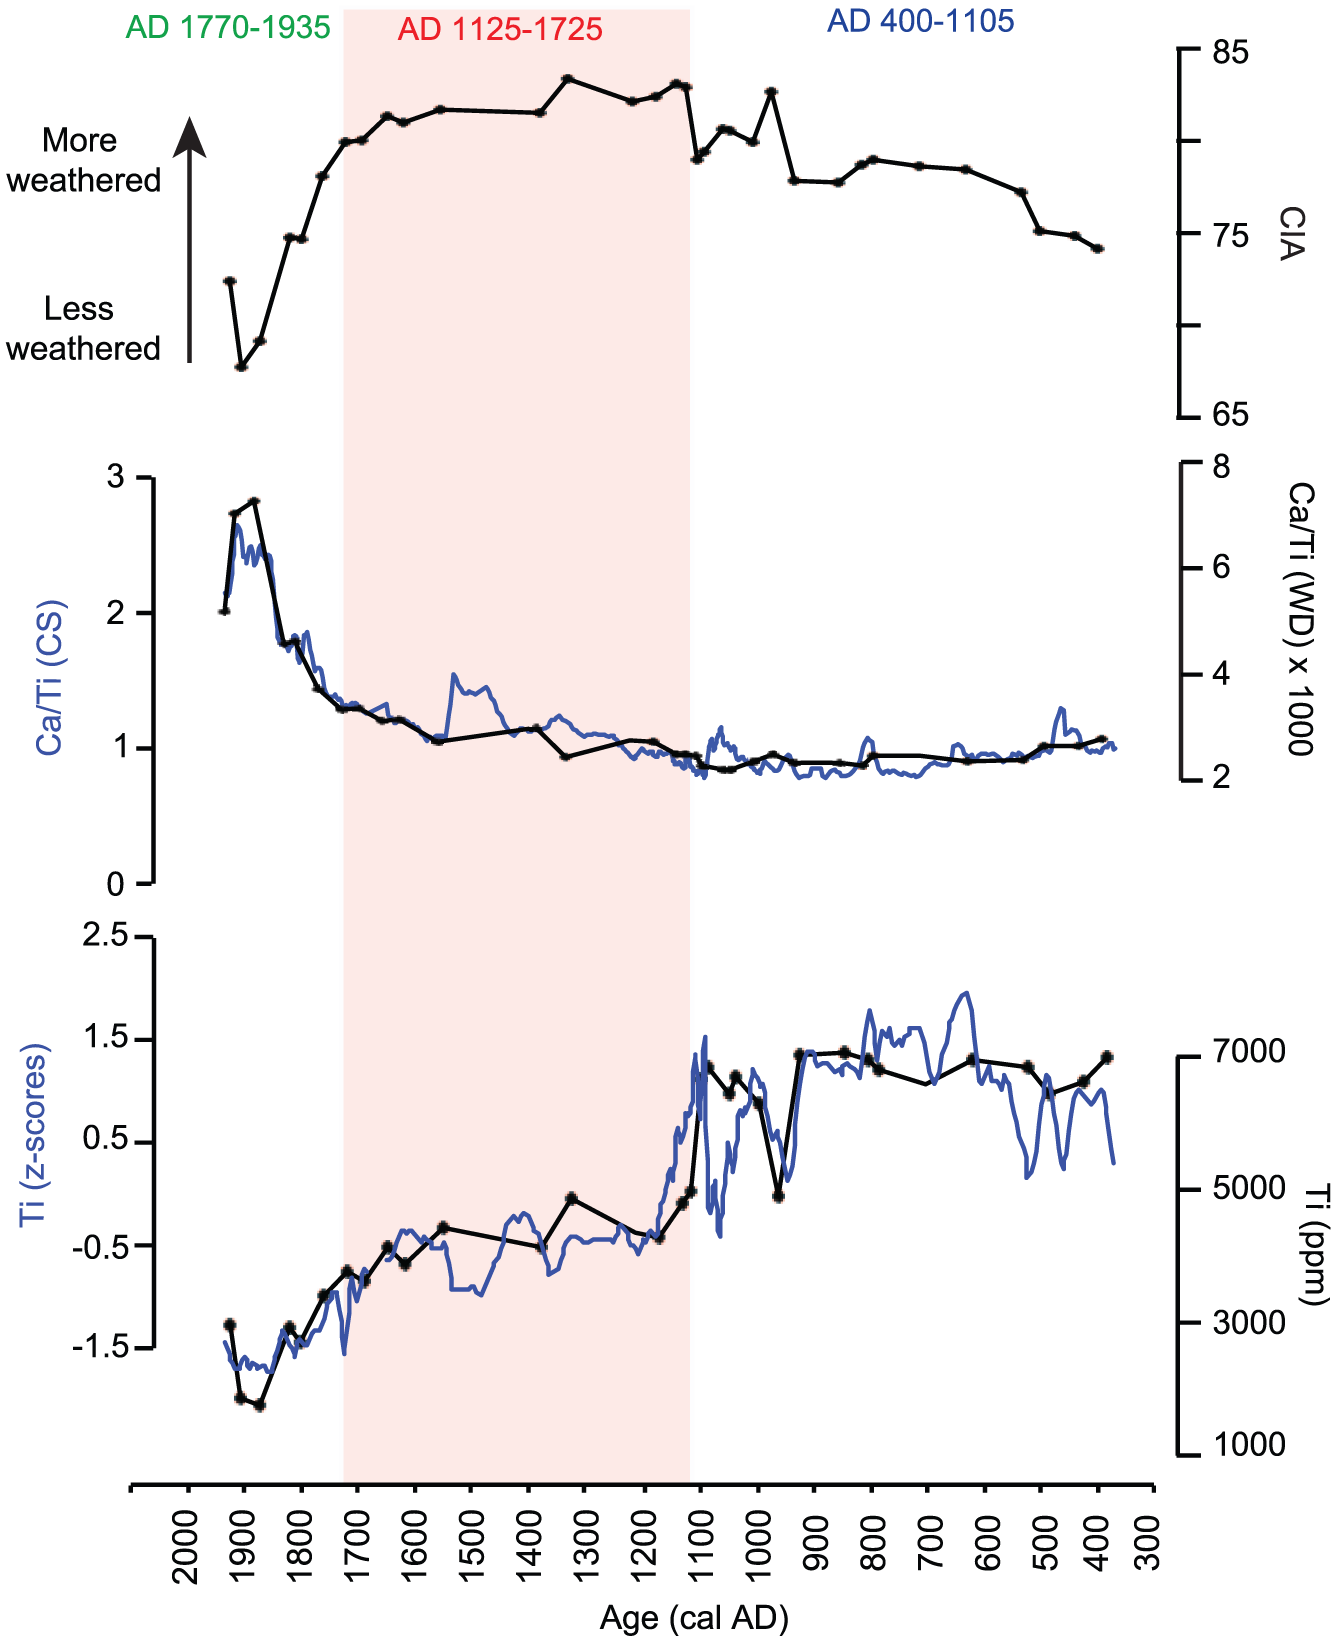
Inorganic geochemistry. From top; CIA and Ca/Ti (indicators of weathering and source areas) and Ti (inferring detrital input).
Discussion
Organic geochemistry as a proxy for vegetation change
Southern African grasslands are characterized by their mixture of C4 and C3 grasses, contributing to a varying degree, depending on bio-geographical and climatic conditions (Vogel et al., 1978). C3 and C4 plants use different photosynthetic pathways, resulting in different carbon isotope compositions in their photosynthate (e.g. Ehleringer et al., 1997). South African C3-grasses show δ13C-values lower than −20‰, while the δ13C signal in C4-grasses is generally higher than −16‰ (Table 2) (Vogel et al., 1978). C4 plants are favoured by warm and sometimes dry conditions, which in South Africa are manifested by C3-grasses generally dominating in areas where daily maximum temperature is below 25°C, while C4-grasses are rare in areas with a daily minimum temperature below 5°C during the growing season (Table 2) (Vogel et al., 1978). This relation to temperature is relatively strong for South African C3 and C4 grasses (Poaceae) (Vogel et al., 1978), but is less clear for C3 and C4 sedges (Cyperaceae) (Stock et al., 2004).
δ13C-values and cross over temperatures (Tc) for South African grasses (Vogel et al., 1978) and sedges (Stock et al., 2004). Tc is expressed as daily mean maximum and minimum temperatures during growth season (after Norström, 2008).
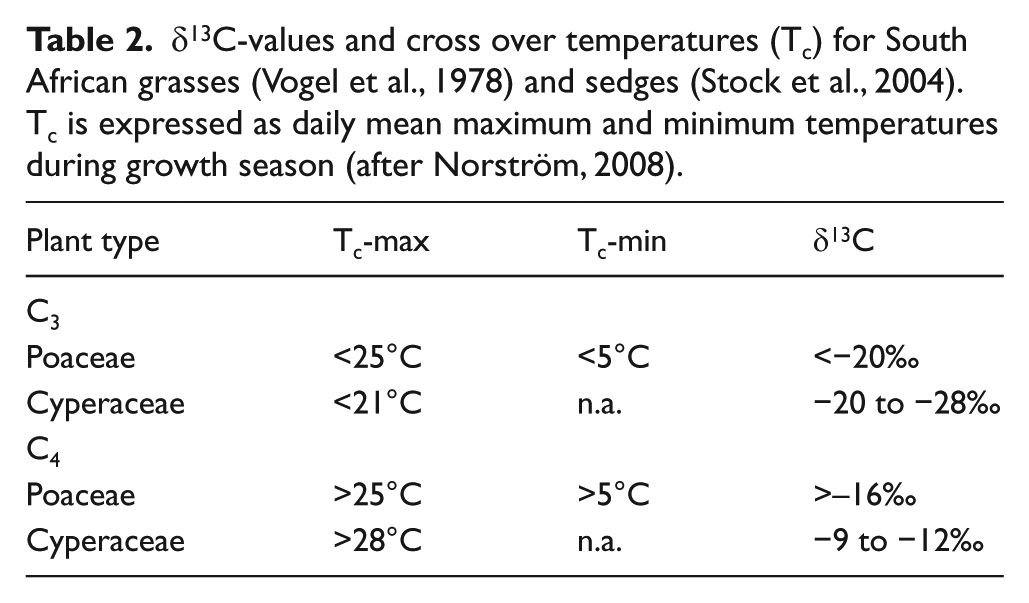
Present day climate conditions at the Ladybird site are close to the limits of what C4 grasses generally tolerate. In accordance with this, Ladybird δ13C measures a distinct C3 signal, averaging −27‰, suggesting C3 dominance throughout the studied period. Although rare, C4 grasses do occur in the area, at lower altitudes, and at a local scale within the wetland ecosystems (Mucina and Rutherford, 2006). The exclusivity of the C4 components, together with the limiting conditions for their existence, suggests that a proportional increase in C4 into the ecosystem would impact the temporal variability of δ13C in the fossil sediments. The sensitivity of C3/C4 dynamics to deviations in climate (Vogel et al., 1978) suggests that increases in summer temperatures, and/or shifts towards longer growing seasons, could tentatively lead to an expansion of C4 vegetation.
The δ13C can also be affected by large-scale shifts between major terrestrial vegetation groups (grasses, shrubs, herbs); however, previous pollen studies suggest a relatively stable representation between these functional types during the late-Holocene (Fitchett et al., 2016a, 2016b; Norström et al., 2014, 2009; Lodder et al., 2017), with grasses and sedges together representing 60–80% of all recorded taxa since 8000 cal. yrs BP (Fitchett et al., 2016b). Similarly, at Ladybird, grasses and sedges are the major source of total organic accumulations and their internal C3–C4 distribution should be the major driver of δ13C. The δ13C-values, as well as δ15N and the C/N-ratio, may also be modulated by aquatic influences (e.g. Cloern et al., 2002; Doi et al., 2010; Lamb et al., 2004, 2006; Talbot, 2001). At Ladybird, aquatic input is probably restricted to the lowermost sequence, while in the peaty sections, δ15N and C/N are more likely to be related to biological productivity (Meyers and Teranes, 2001) and C4 and C3 shifts, as C4 grasses contain less nitrogen, and therefore also yield higher C/N ratios (e.g. Lamb et al., 2006).
This interpretative rationale suggests low δ13C and δ15N-values during the AD 400–700 period infer high input of terrestrial C3 plants and possibly some freshwater phytoplankton, although the high C/N ratio (22–26) supports a terrestrial signal. From AD 700–1200, high δ13C and δ15N, combined with a C/N-ratio between ca. 10 and 20, suggest a pure terrestrial phase. Both δ13C and C/N infer a higher proportion of C4 plants compared to earlier, particularly at AD 850–1150. Between AD 1200 and 1922, the C/N ratio declines, tentatively inferring a wetland environment with some aquatic influence. This is supported by the relatively lower δ13C, which may also suggest a continuous return towards higher proportion of C3 vegetation.
Inorganic geochemistry as a proxy for detrial input and source shifts
Considering the purposes of this work, a sub-set of elemental data were chosen from both the XRF-CS (Ca and Ti), and conventional XRF-WD (Si, Al, Ca, Na, K, and Ti) datasets for presentation. The XRF-CS data are high resolution (2 mm) and provide continuous information on changes in the studied sequence. XRF core scanning measurements are, however, impacted by changes in the matrix (e.g. OM content, grain size, water content), like those observed in the Ladybird sequence. One way to reduce the importance of such matrix effects is to work with elemental ratios (Kylander et al., 2013; Löwemark et al., 2011). It is also possible to independently confirm the changes in the XRF-CS based ratios using the XRD-WD data. Unlike the XRF-CS analysis, the XRF-WD is conducted on samples that have been homogenised and dried, and the raw intensities have been recalculated into absolute elemental concentrations using a calibration method that takes into account variations in organic content and corrects for inter elemental matrix effects (Rydberg, 2014). Slight differences between these two datasets are expected due to (1) differences in elemental attenuation during XRF-CS, (2) non-linear responses during XRF-CS analyses, (3) sample heterogeneity where XRF-CS is analysing an 8 mm wide strip on the core surface while XRF-WD is performed on a bulk sample, and (4) differences in sample resolution between XRF-CS and XRF-WD (2 mm vs 1 cm) and offsets in data alignment.
Not surprisingly, given the geological setting, the sediments preserved at the site are basaltic in nature (Figure 4). The local source rock, as defined by the average composition of 67 rock samples collected at Sani Pass by Ramluckan (1992), plots in basalt/basalt andesite fields in Na2O + K2O vs SiO2 space. There is a clear grouping in chemical signatures of the sediment sequence with the basal portion (AD 400–1105) falling into the field for picrobasalt, the middle portion of the profile (AD 1125–1725) being basaltic in nature, and foiditic signatures found at the top of the profile (AD 1770–1935). While the bottom of the profile shows slightly higher alkali (Na2O + K2O) contents (ca 2% vs 1%), the main difference between these three groups is the Si content. When comparing the sediment samples with the Sani Pass basalts, they clearly differ. This stems from the fact that there is likely local catchment source rock heterogeneity that is not captured by the abovementioned Sani Pass basalt samples. In addition, the source rocks in the catchment will be differentially weathered depending on their mineralogical composition, climatic settings (precipitation, temperature), microbial activity, surface area (linked to processes like freeze/thaw cycles and physical erosion) and the presence of fresh material, soil cover, organic matter, and vegetation (West et al., 2005; White and Blum, 1995). A way to express the degree of chemical weathering is through the CIA. This index was introduced by Nesbitt and Young (1982) and expresses the degree of leaching and cation loss of Na+, K+, Ca2+ relative to Al, which assumes that feldspar degradation dominates chemical weathering. In general, highly weathered materials dominated by secondary minerals (i.e. clay rich) have higher CIA (70–100) than those rich in primary minerals (e.g. fresh feldspars = 50 or pyroxene = 0-10) (Nesbitt and Young, 1982). The applicability of the CIA to paleoclimate has been discussed, partly due to the fact that the starting rock material will affect the original proportion of the different cations (Goldberg and Humayun, 2010). In this case, the average CIA for the Sani Pass basalts, our best descriptor of the source rock, is 44. Considering the timescale under study, we do not expect to capture real-time changes in weathering, but rather use the CIA as an indicator of temporal changes in source. Changes in the CIA over time agree with the shifts in sediment source indicated by the alkali vs SiO2 diagram, with lower values observed between AD 400 and 1105, with the exception of the sample from AD 975. A more weathered source controls sedimentation between AD 1125 and 1725, while a less weathered source dominates AD 1770–1935 when the CIA drops considerably, back towards the local rock CIA of 44.
The biplots as well as the CIA are based on the XRF-WD data, that is, elemental concentrations corrected for inter elemental matrix effects and variations in organic content. As a complement to this low resolution data, we have used the Ca/Ti-ratios calculated using the high-resolution XRF-CS data to confirm the change in source suggested by the XRD-WD data. Correlation analyses show a high degree of agreement between Ti, Ca, Si and K (0.87 < r < 0.97, n = 1114, p = 0.001), which, giving their potential hosting in conservative minerals, is interpreted to be linked to minerogenic inputs to the catchment. The main primary minerals composing the local basalts include plagioclase feldspars, pyroxene, olivine and a small percentage of opaque minerals (magnetite and ilmentite). In terms of primary minerals, we expect Ca to be hosted in the alkali feldspars that dominate the local basalts, while Ti is likely hosted in conservative minerals such as rutile and ilmenite (Ramluckan, 1992). It is possible that these elements are also hosted in or absorbed onto clays, but we note that rutile and ilmenite are generally resistant to chemical weathering. Thus, at Ladybird Ca/Ti is related to the relative input of different host minerals, and variations in Ca/Ti are driven by changes in the source of the mineral material. Titanium is used here as a proxy for detrital input at the Ladybird site.
Synthesis of Ladybird proxy data
By collectively investigating proxies of source change (CIA, Ca/Ti) and detrital input (Ti), it is possible to reconstruct the hydrology of the catchment. The basal portion of the record shows stable conditions from AD 400 to AD 800 when a small increase in productivity occurs; this may have driven the small shift in sediment source indicated by Ca/Ti (i.e. shifting water margins). The low productivity and high detrital input would suggest a dominantly terrestrial system. This is supported by the organic geochemistry, suggesting a terrestrial source of the organic fraction, followed by a purely terrestrial ecosystem after ca. AD 700. Although C3 plants dominate, a higher proportion of C4 vegetation is inferred by the dramatic increase in δ13C and C/N between AD 850 and AD 1150. δ13C reaches its maximum value between AD 900 and 1000, while peaks in C/N imply maximum C4 influence around AD 950 and just after AD 1100. The C4 increase may be in response to relatively drier conditions and higher temperatures; the latter favouring terrestrial growth in general, and C4 vegetation in particular. Alternatively, the signal could be a response to altered local conditions favouring sedges over grasses, including sedges of C4 affinity that would enrich δ13C. The strong terrestrial signal reported by both organic and inorganic proxies during this phase, however, argues against such a scenario, suggesting a grass over sedge dominance rather than the opposite. This is supported by an exploratory diatom study, where diatom taxa from three Ladybird samples were identified (at AD 760, 960 and 1050; Fitchett unpublished data). Absence of planktonic diatoms in all samples support a dry environmental situation at Ladybird over this phase. Around the same time, at ca. AD 975, the inorganic proxies indicate that a significant source change (CIA, Ca/Ti) occurred while there was a decrease in detrital input (Ti) to the basin. This source is shut off abruptly and not active again until later in the profile. Furthermore, the period AD 1050 and 1085 is most remarkable due to the peak in Ca/Ti, its distinct positioning on the Na2O + K2O vs SiO2 plot, and the concurrent decrease in detrital input. Together, the change in sedimentation and concurrent shift in vegetation likely driven by the warmer conditions, work together to alter the basin hydrology.
The middle portion of the profile at AD 1125 sees rather quick changes in source and a decrease in detrital inputs, followed by more gradual changes in these parameters over time. This is parallel to a regime shift in the organic proxies, where lower C/N, continuously increasing TOC and declining δ13C suggest a change from a terrestrial site towards a wetland ecosystem, with increasingly higher aquatic influence and productivity and a return to C3 dominance within the terrestrial biome. The gradual shift in both organic and inorganic chemistry, inferring a transition from a purely terrestrial site towards a wetland ecosystem, may be a response to higher available moisture associated, at least in part, by lower evaporation rates during a cooler climatic situation, compared to the tentatively warmer ca. AD 900–1100 phase. The vegetation proxies seem slightly delayed (AD 1200) compared to the inorganic proxies (AD 1125), suggesting a certain response time required for ecosystem balance to be reached after a climate shift. A possible small shift in hydrology (Ca/Ti) occurs at AD 1440–1545, which is matched by a decrease in detrital inputs and increase in TOC. A more rapid shift in sources (Ca/Ti) is seen around AD 1725, in combination with a substantial increase in TOC.
Ladybird paleoclimate indications in a regional context
The period encompassing the so-called Medieval Climate Anomaly (MCA; AD 900–1250) is generally associated with a highly variable, sometimes relatively wet, hydro-climate in southern Africa (Holmgren et al., 1999, 2003; Lee-Thorp et al., 2001; Sjöström et al., 2017; Woodborne et al., 2016). Although the weakness in Ladybird chronology impedes a robust regional comparison, proxies suggest unstable MCA hydroclimate and tentatively warmer conditions, particularly over the AD 900–1100 phase (Figure 6). Temperature proxy records from southern Africa are rare, but speleothem δ18O from Cold Air Cave in northern Interior of South Africa similarly infer variable, but generally warmer conditions (Holmgren et al., 2003). Moisture proxies report dramatic MCA variability (e.g. Holmgren et al., 2003; Woodborne et al., 2016), notably, both tree ring δ13C and speleothem δ13C suggest an abrupt shift towards increased rainfall around AD 1000, at the same time as Ladybird report an occasional reversal in climate conditions towards cooler and wetter (Figure 6).

Regional comparison. Proxy data from Ladybird (Ti, C/N, δ13C, δ15N) (this study), potted together with Pafuri/Mapungubwe Baobab tree ring isotopes (Woodborne et al., 2016) and Cold Air Cave speleothem isotopes (Holmgren et al., 2003). Baobab δ13C residuals inferring Indian Ocean SSTs (Woodborne et al., 2016). The approximate timing of the MCA (Medieval Climate Anomaly) and LIA (Little Ice Age) is indicated (Nash et al., 2016). The light grey vertical band indicates the period when Ladybird proxies infer maximum C4 signal (warm, dry). Dark grey vertical shading indicates an occasional climate reversal inferred by Ladybird and other proxies during MCA (cooler, wetter). Orange bars at bottom indicates major solar minima (e.g. Stuiver et al., 1998). Age control of Ladybird data within the gridded box (AD 400–700) are based on extrapolated dates, and should be interpreted with care.
Temperature and hydro-climatic processes in eastern southern Africa are known to be associated with sea surface temperatures (SSTs) of the Indian Ocean (Reason and Mulenga, 1999), which in turn is coupled to latitudinal and longitudinal dynamics of oceanic and atmospheric circulation systems. An identified co-variability between the high-resolution records representing air temperatures in the summer rainfall region of South Africa (Sundqvist et al., 2013) and Agulhas SST (Zinke et al., 2014), support the link between continental and ocean conditions on decadal to centennial time scales over the late-Holocene. The Agulhas current SST in turn, is suggested to influence SST across the subtropical to mid-latitude Indian and Atlantic Ocean by ocean driven teleconnections (Rayner et al., 2003; Zinke et al., 2014). The AD 900–1100 MCA warming at Ladybird coincides with a stronger Asian monsoon and higher SSTs in the eastern Indian Ocean (e.g. Liu et al., 2014). However, a number of records adjacent to the eastern Indian-western Pacific Ocean region suggest that the MCA was interrupted by an anomalous phase around AD 1100–1000 (Liu et al., 2014), when monsoon intensity, as well as SSTs, declined (Oppo et al., 2009; Stott et al., 2004). Notably, the Ladybird record reveals a concurrent deviation from the otherwise warm MCA signal within this specific time window (Figure 6). This abrupt climate shift is also reported in tree ring and speleothem δ13C (Holmgren et al., 2003; Woodborne et al., 2016). The MCA phase is generally associated with high solar activity (Bard et al., 2000), but during the AD 1100–1000 phase, diminishing solar magnetic activity has been reported (Bard et al., 2000; Stuiver et al 1998), concurrent with occasional lowering of the otherwise warm Indian Ocean SSTs (Oppo et al., 2009; Stott et al., 2004). Although age model constraints should be kept in mind, the co-occurring signals in the Ladybird multi-proxy record, with reconstructions of both eastern-Indian Ocean conditions as well as solar activity, suggest a tentative solar-ocean-linkage for southern African climate over the MCA period.
Following the MCA, the so-called LIA (AD 1250–1850) was generally associated with cooler and drier conditions in southern Africa, but inter-site comparisons indicate considerable variability in the temporal framing of this phase (Nash et al., 2016). Some records along the Mozambique coast, based on direct hydroclimate proxies (Ekblom and Stabell, 2008; Holmgren et al., 2012; Sitoe et al., 2015, 2017), and indirect response in vegetation proxies (Ekblom, 2008; Ekblom et al., 2012, 2014; Norström et al., 2018), infer a relatively early initiation of LIA dryness. To this end, SSTs between AD 1300 and 1800 declined by as much as 2°C lower than today in the Ross Sea, Antarctica (Berter et al., 2011). Carbon isotope residuals from tree rings also suggest a decline in SSTs over this phase (Woodborne et al., 2016). The Ladybird sequence infers increasing effective available moisture already from around AD 1200, leading up to maximum moisture access at the local scale during the 20th century. This may tentatively be associated with enhanced mid-latitude cyclonic activity over LIA, leading to increased precipitation during the cooler seasons (autumn-winter-spring). The inferred conditions may also be a response to regionally lower temperatures with an associated reduction in evaporative processes across the Lesotho highlands, thus favouring the development of wetland ecosystems and a dominance of C3 functionality among the grasses.
Again, we lift the awareness of weaknesses within the Ladybird age–depth model, and stress the importance of improved age control in future studies for better inter-data comparison and for optimising the possibility to identify potential leads and lags in the system.
Conclusion
A paleo environmental proxy record from the Lesotho Highlands was constructed by applying multi-proxy analyses on a wetland sediment sequence involving the assessments of both the inorganic and organic fractions. The synthesised signal from Ladybird proxies suggests stable terrestrial and hydrological conditions between AD 400 and 800, although age-model limitations urges for modest temporal constraints, particularly for this period. This was followed by a phase between AD 900 and AD 1200 characterised by a more variable environment, higher temperatures and increased aridity. This period, covering the MCA, was interrupted by a return to cooler and wetter conditions during a few centuries centred around AD 1050. The LIA is less pronounced in the Ladybird proxy record, which rather suggests a gradual development from purely terrestrial conditions towards a wetland environment from around AD 1200 until the 20th century. Proxies suggest relatively higher available moisture during LIA, tentatively as a result of less evaporative water loss under a regionally cooler climate situation and/or a shift in rainfall seasonality resulting in more precipitation during winters. Variability in the Ladybird proxy data is to some extent co-varying with Indian Ocean SSTs and solar activity over the MCA, suggesting that these may have been important mechanisms controlling the late-Holocene climate of southern Africa. Direct comparison and validation of the outcome of this study is hampered by age model weaknesses, and the lack of other higher resolution records from Lesotho (Fitchett et al., 2016a). Identification of such records – combined with a generous dating approach – should be targeted in future projects aiming for advancements in the understanding of late-Holocene climate variability in this high mountain region of southern Africa.
Footnotes
Acknowledgements

Funding
Project was funded by the Swedish Secretariat for Environmental Earth System Sciences Research Links Programme 2015 (Malin Kylander), DST-NRF Centre of Excellence in Palaeosciences (Stefan Grab, Jennifer Fitchett), the Swedish Research Council (project 48-2013-6241, Elin Norström) and the Bolin Centre for Climate Research, Stockholm University.