



Abstract
Large marine-terminating glaciers around the margins of the Greenland Ice Sheet have retreated, accelerated and thinned over the last two decades. Relatively little is known about the longer term behaviour of the Greenland Ice Sheet, yet this information is valuable for assessing the significance of modern changes. We address this by reporting 11 new beryllium-10 (10Be) exposure ages from previously uninvestigated coastal areas across southeast Greenland. The new ages are combined with existing data from the region to assess the timing of glacier retreat after the Last Glacial Maximum. The results show that deglaciation occurred first in the north of the region (~68°N) and progressed southwards. This north–south progression is attributed to the influence of the warm Irminger Current on the ice margin. Areas in the south of the region were isolated from the warm waters by the shallow bathymetry of the continental shelf. This demonstrates that oceanographic forcing paced the deglaciation of southeast Greenland through the Younger Dryas and early Holocene. In most areas of southeast Greenland bedrock ages are systematically older than their counterpart boulder samples; this offset is likely the result of inherited 10Be content in bedrock surfaces. This suggests that subglacial erosion during the last glacial cycle was insufficient to completely remove pre-existing 10Be content. Alternatively, this pattern may be the signature of a substantial retreat and advance cycle prior to final Holocene deglaciation.
Introduction
The southeast region of Greenland has experienced large glaciological changes in the last two decades. In the mid-2000s, dynamic ice loss from the region dominated the mass budget of the wider Greenland Ice Sheet; this occurred as outlet glaciers across southeast Greenland synchronously retreated, accelerated and thinned (Enderlin et al., 2014; Howat et al., 2008; Moon et al., 2012; Murray et al., 2010). Despite its obvious importance, relatively little is known about the glacial history of this region beyond the 20th century (Bjørk et al., 2012; Khan et al., 2014; Kjeldsen et al., 2015). Reconstructing past glacier behaviour provides a baseline against which to assess the significance of modern changes.
Cosmogenic isotope dating has been used to reconstruct the glacial history in many areas around the periphery of Greenland (Sinclair et al., 2016). In southeast Greenland, investigations have focussed on the major fjord systems (Dyke et al., 2014; Hughes et al., 2012; Roberts et al., 2008). Areas away from these fjords remain entirely uninvestigated. Reconstructing the glacial history of these areas makes it possible to resolve differences in the timing, pattern and style of deglaciation across the southeast region. This information is useful for assessing the performance of numerical models and for improving future predictions of ice sheet behaviour (e.g. Lecavalier et al., 2014).
We present 11 new beryllium-10 (10Be) exposure ages that were collected opportunistically from four outer-coast locations in southeast Greenland (Figure 1). These extend the spatial extent of data on the timing of regional deglaciation beyond the major fjord systems. The data are presented together with photos, descriptions and maps of the study areas to allow thorough interpretation of the 10Be exposure ages from each site.
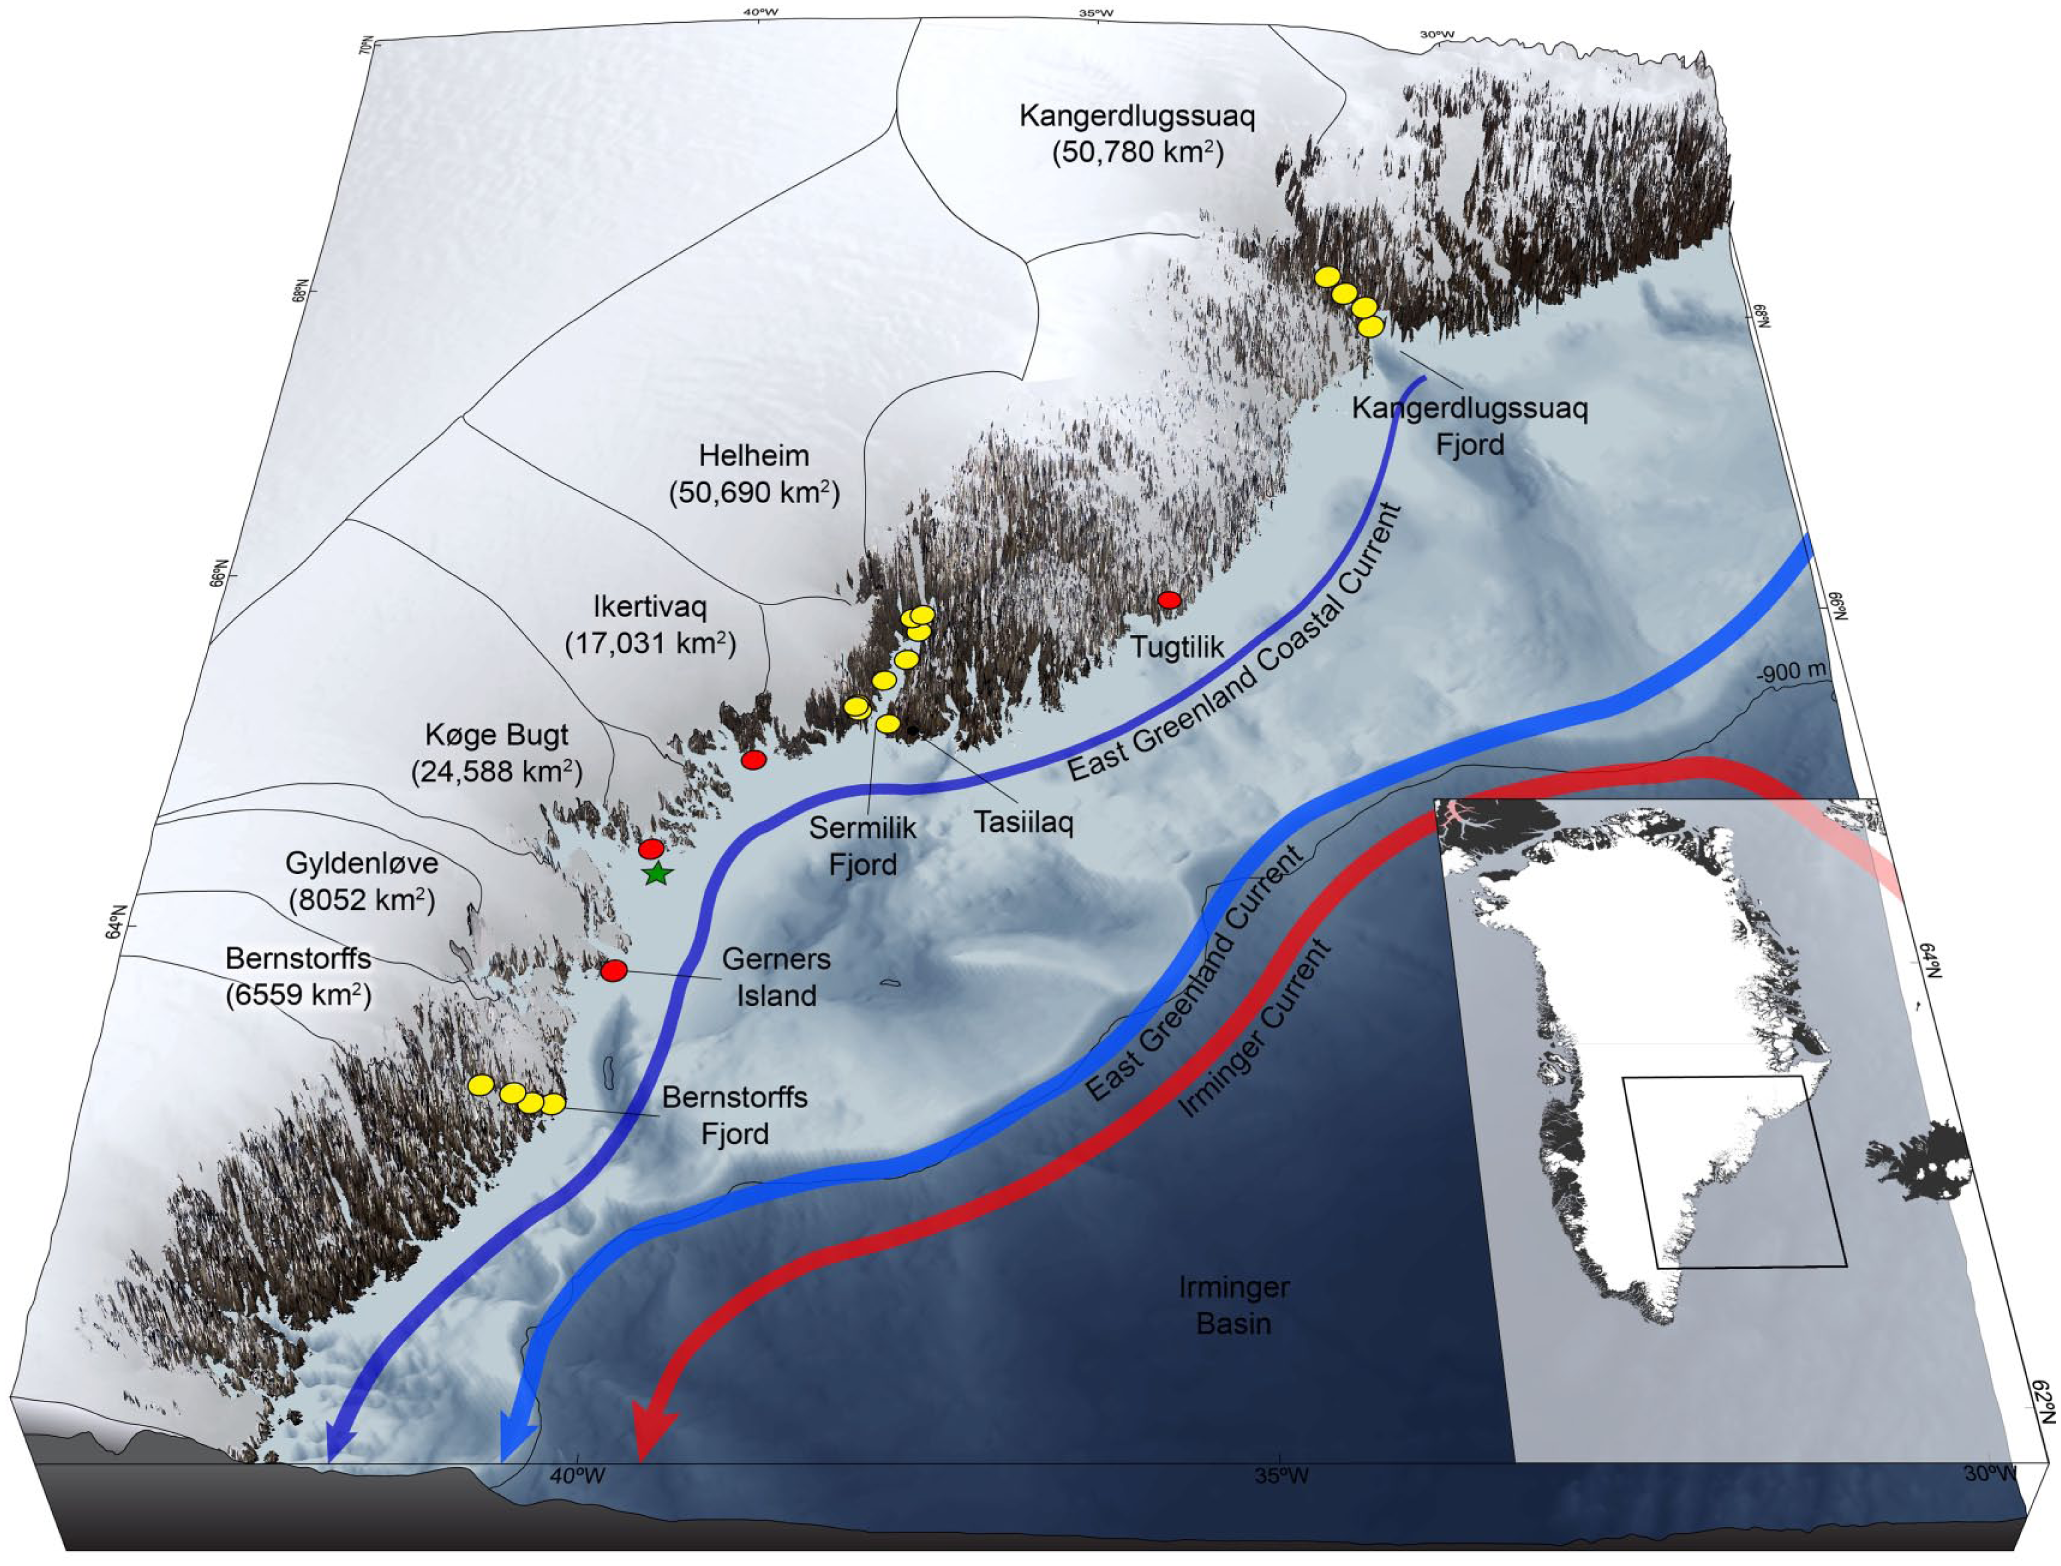
Map of southeast Greenland showing the location of sites in this study (20× vertical exaggeration). The inset map shows the extent of the main figure. Red circles denote 10Be sampling sites in this study, the green star marks the location of sediment core ER1116 (Dyke et al., 2017). The location of previously published 10Be and 26Al exposure ages are shown by the yellow circles (Dyke et al., 2014; Hughes et al., 2012; Roberts et al., 2008). Bathymetric data are from Jakobsson et al. (2012). Surface ocean currents are adapted from Sutherland and Pickart (2008). Individual present-day drainage basins are shown for Kangerdlugssuaq and Helheim Glaciers. Composite basins are shown for the glaciers draining into Ikertivaq, Køge Bugt, Gyldenløve Fjord and Bernstorffs Fjord (Millan et al., 2018). Terrestrial imagery is a composite mosaic of Landsat 8 scenes draped onto elevation data from Howat et al. (2014).
Study area: Southeast Greenland
Southeast Greenland is a heavily glaciated, mountainous region containing many of the largest and fastest glaciers in Greenland. Cumulatively these marine-terminating glaciers drain ~173,000 km2 of the Greenland Ice Sheet (Rignot and Kanagaratnam, 2006).
The oceanography of southeast Greenland is dominated by southerly flowing boundary currents (Figure 1). Coastal surface waters, <300 m below sea level (b.s.l.), are characterised by cold, low-salinity currents that originate in the Arctic Ocean. These polar water masses flow southwards in the East Greenland Current and the East Greenland Coastal Current (Bacon et al., 2002; Sutherland and Pickart, 2008). Warmer and more saline water, sourced from the subtropical Atlantic, is delivered to southeast Greenland by the Irminger Current (Brearley et al., 2012; Straneo et al., 2010). The Irminger Current circulates along the shelf-edge at depth (>300 m b.s.l.) and invades the largest fjords through deep glacial troughs in the continental shelf (Inall et al., 2014; Straneo et al., 2010; Sutherland et al., 2013).
The southeast region experiences a polar maritime climate. This is characterised by frequent low-pressure systems in autumn and winter months, and extended periods of high-pressure in the spring and summer (Cappelen et al., 2013; Hastings, 1960). The mean (1961–1990) annual surface air temperature at Tasiilaq, in the centre of the region, is −1.7°C (Cappelen et al., 2001). Southeast Greenland experiences the highest precipitation rates in Greenland. Coastal areas in the centre of the sector receive more than 100 g cm−2 of precipitation annually (Bales et al., 2009).
Unravelling the palaeoglaciological significance of each 10Be sample requires a comprehensive understanding of each site. Geomorphological mapping of the study areas was undertaken using a combination of field observations, field photographs, satellite imagery (Landsat 8) and high-resolution, orthorectified aerial photos (Korsgaard et al., 2016). Four sites were investigated, and these are described individually in detail below.
Sampling site: Tugtilik
Tugtilik is a small fjord in the centre of the southeast region (Figure 1). The fjord is surrounded by mountainous terrain and the entrance is partially obstructed by Ailsa Ø (Similaq), a rocky island approximately 1.5 km long (Figure 3a). Small, land-terminating cirque glaciers (<2 km2) occupy favourable locations around the embayment (Figure 2a). A larger tidewater glacier (Tugtilip Kagtilersapia) lies 3 km to the northeast of the sampling site (Schjøtt, 2007b). The geomorphology of the area is relatively varied (Figure S1, available online). High terrain is predominantly characterised by periglacial weathering features and shows little evidence of subglacial erosion (Figure 2a). At lower elevations (below around 800 m a.s.l.), the landscape is imprinted with landforms produced by mass-wasting, fluvial, lacustrine and littoral processes (Figure S1, available online).
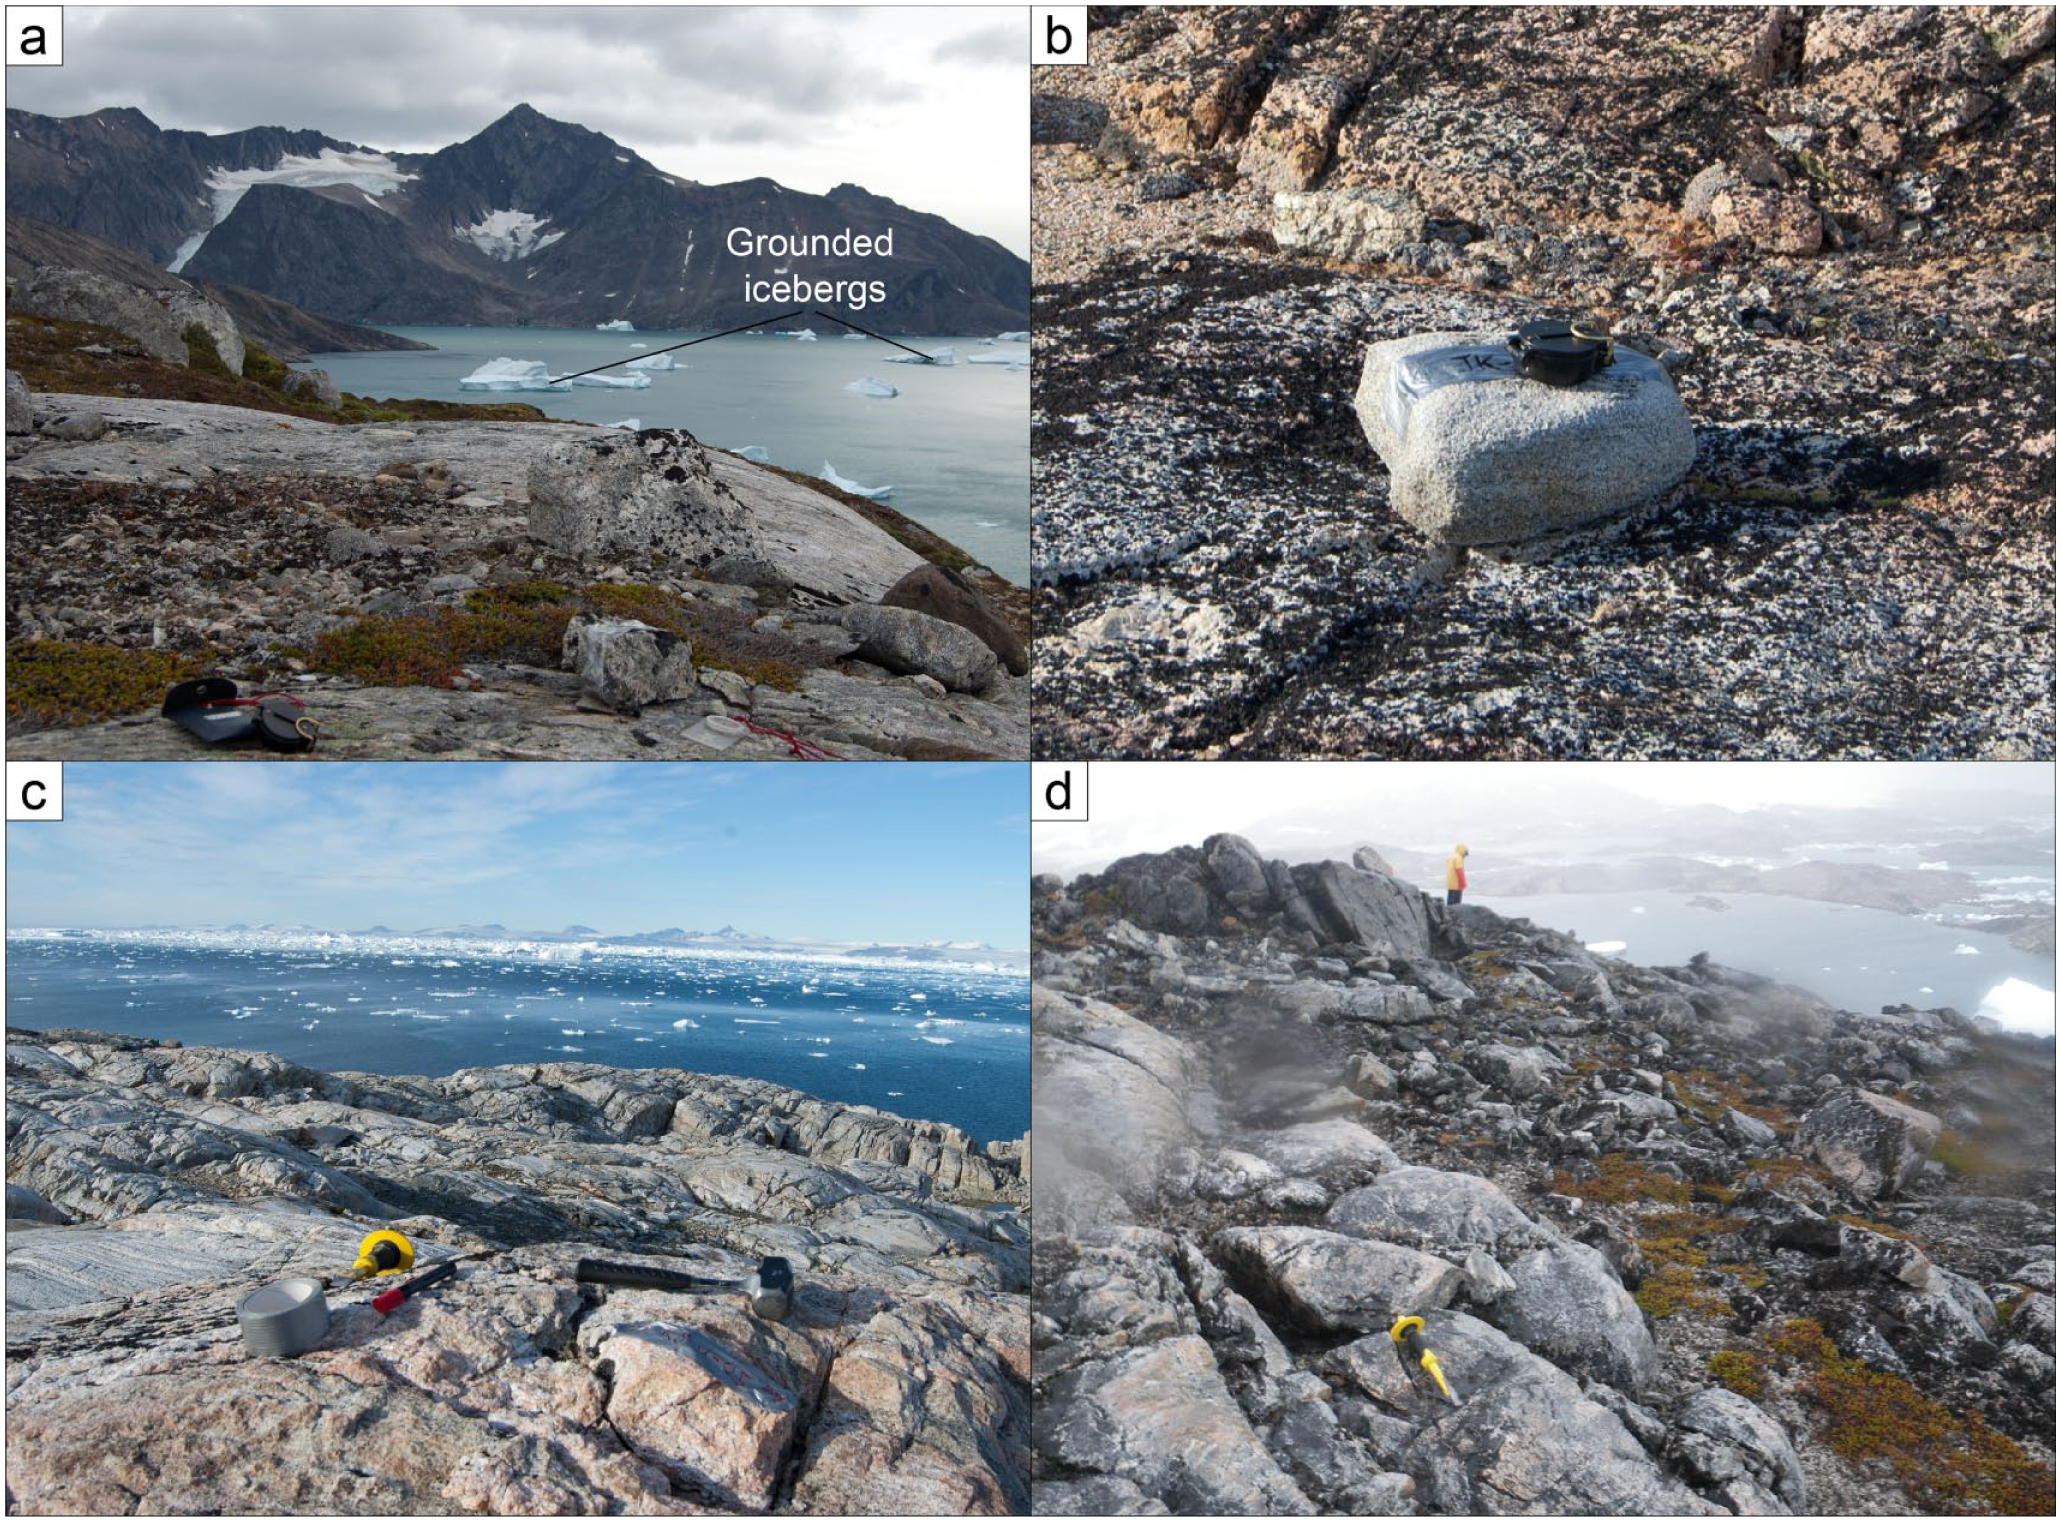
Field area photos: (a) Sampling site at Tugtilik; (b) erratic sample from Sûnikajik, a small island in Ikertivaq. Compass, for scale, is 10 cm across; (c) Aqitseq, Køge Bugt, bedrock sampling site in foreground (lump hammer for scale, ~30 cm long) and (d) Gerners Island (Kulusuk), near Gyldenløve Fjord, sampled bedrock in foreground (the chisel, for scale, is 31 cm long). Focal aberrations are caused by water on the camera lens; the samples were collected during storm conditions. The location and approximate field-of-view (where appropriate) of each photo is shown in Figure 3.
Two erratic cobbles and an accompanying bedrock sample were collected from a prominent bedrock spur above a tributary of the main fjord (Figure 3a). Echo soundings and the occurrence of numerous small grounded icebergs (Figure 2a) demonstrate that this embayment is shallow (<100 m deep, unpublished GLIMPSE Project data, 2011). Several small cirque glaciers are situated above the sampling site; these have single, unvegetated moraine complexes at their margins that are assumed to have formed during the ‘Little Ice Age’ (e.g. Bjørk et al., 2012, 2018). Samples were collected from several hundred metres outboard of the closest moraine (Figure S1, available online).
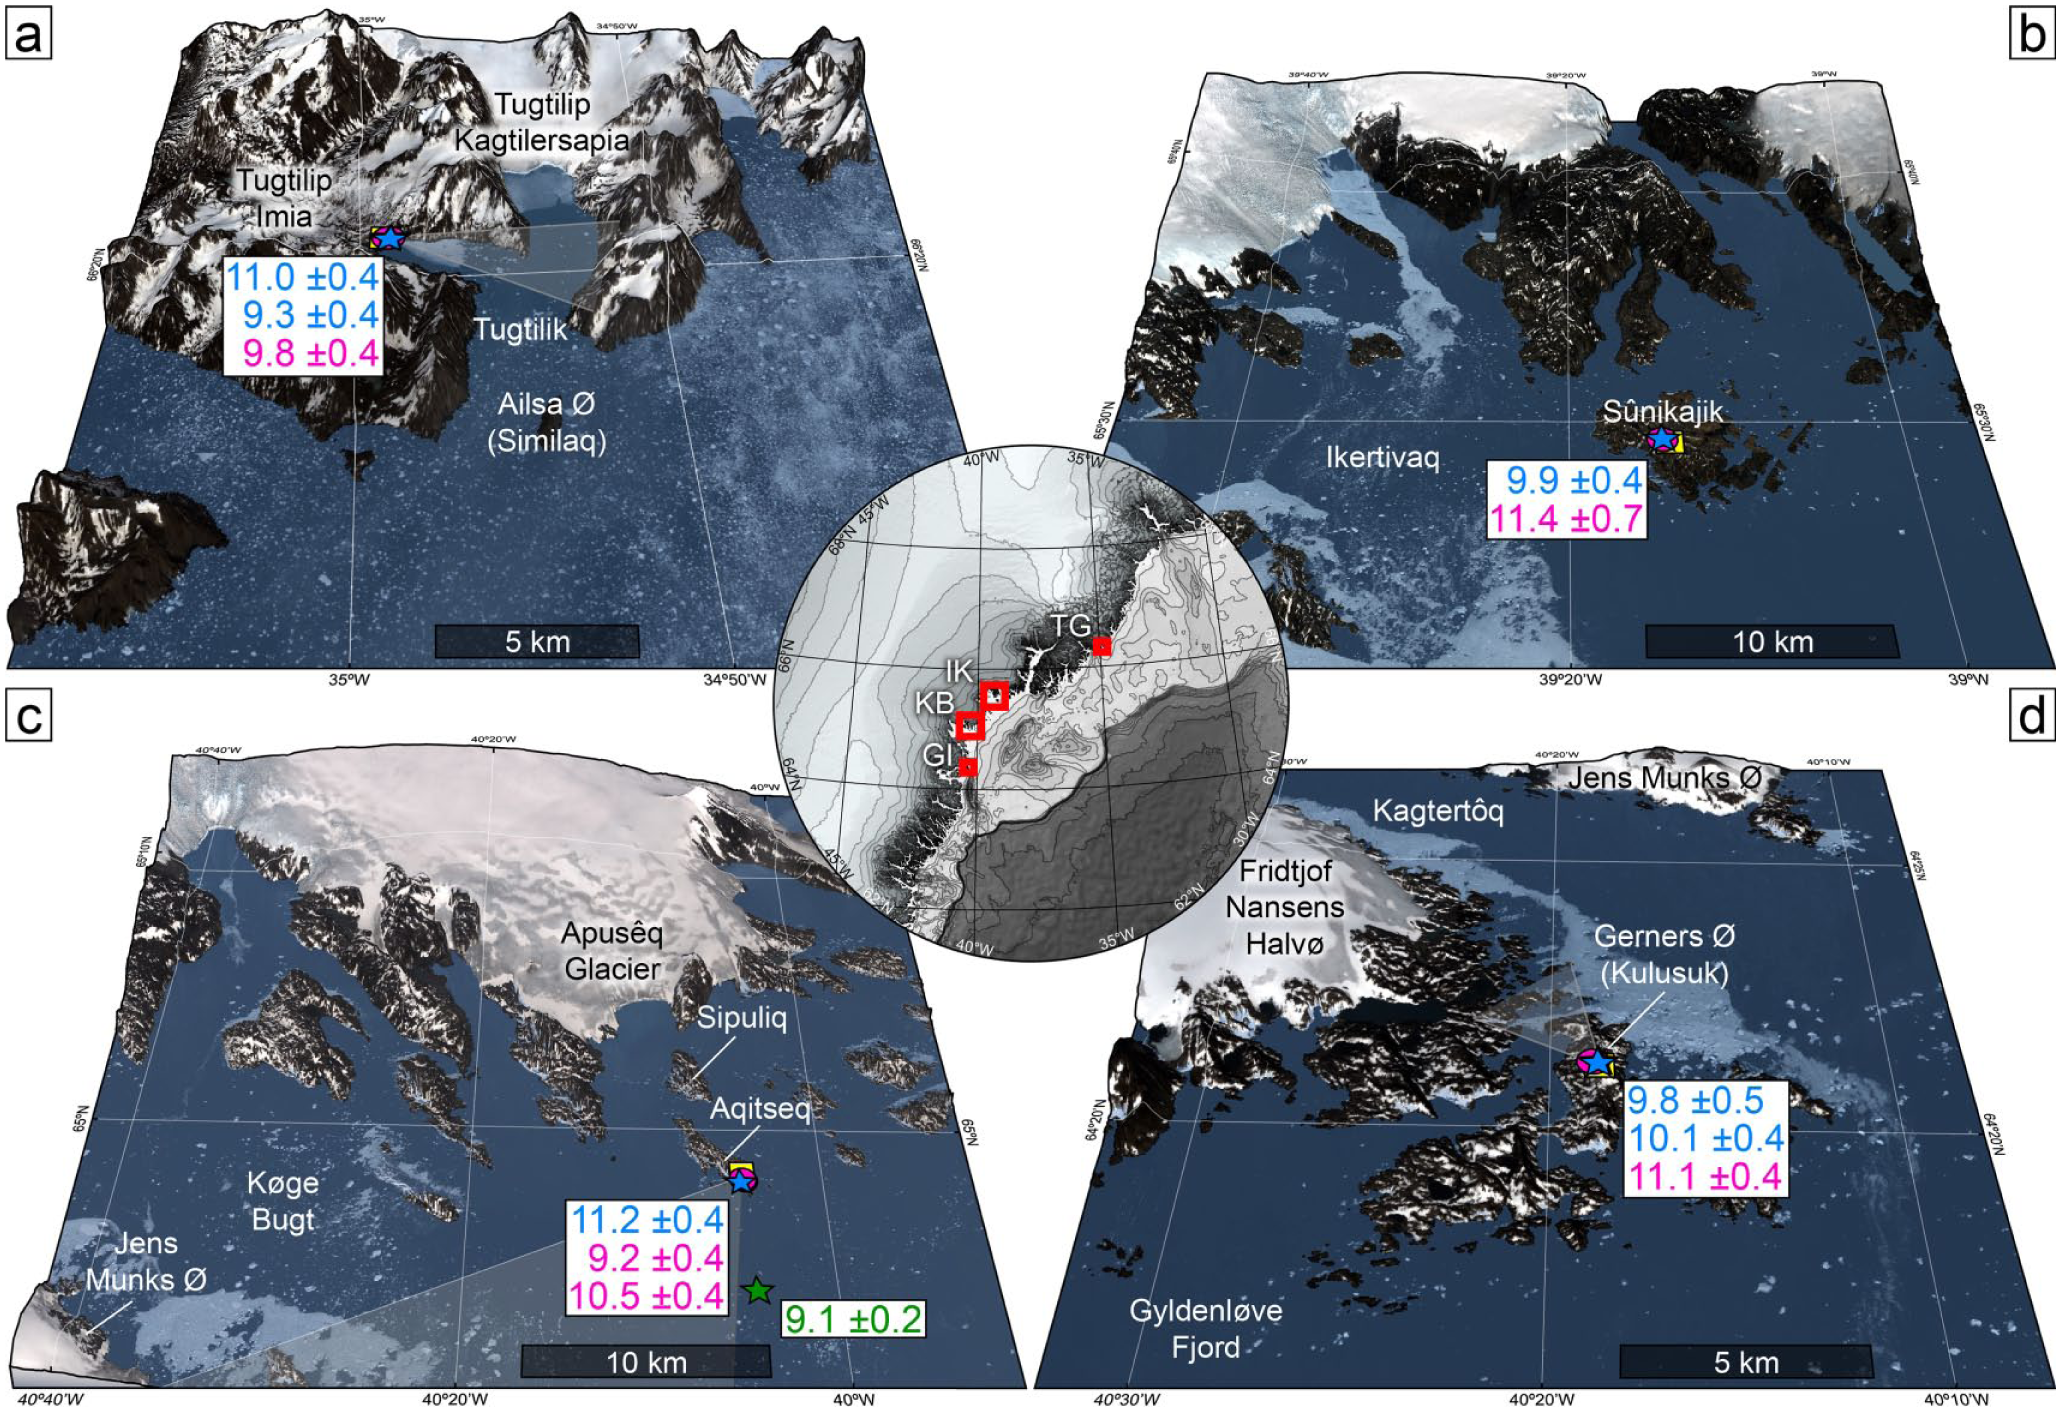
Bedrock and erratic 10Be exposure ages from southeast Greenland: (a) Tugtilik (TG), 2× vertical exaggeration; (b) Ikertivaq (IK), 4× vertical exaggeration; (c) Køge Bugt (KB), 4× vertical exaggeration and (d) Gerners Island (GI), 2× vertical exaggeration. Background images are Landsat 8 scenes draped on elevation data from Howat et al. (2014). The inset map shows the location and extent of maps a–d (red boxes). Erratic samples are shown in blue. Bedrock samples are shown in magenta. Yellow squares show the location of photos in Figure 2; the field-of-view is shown by the grey shading.
Sampling site: Ikertivaq
Ikertivaq is a heavily glaciated embayment in the centre of the southeast region (Figure 1). The bay is 40 km long, 20 km wide and is the drainage portal for several large marine-terminating glaciers that drain ~10,300 km2 of the Greenland Ice Sheet (Rignot and Kanagaratnam, 2006). These glaciers flow at speeds in excess of 2 km a−1 and discharge around 23 Gt of ice annually (Enderlin et al., 2014; Rignot and Kanagaratnam, 2006). Multibeam echo sounder data and gravimeter measurements show that a deep trough feature runs through the centre of Ikertivaq; this is more than 900 m b.s.l. in places (Fenty et al., 2016; Millan et al., 2018). The topography of the ice-free areas is subdued (<500 m a.s.l., Schjøtt, 2007b) and has been heavily modified by glacial erosion. Depositional features are generally absent from Ikertivaq, except in a few land-terminating areas of the ice sheet. In these areas moraines are located within a few hundred metres of the present-day ice margin (Figure S2, available online). These moraines are undated, but likely represent the position of the ice margin during the ‘Little Ice Age’ (e.g. Bjørk et al., 2012, 2018).
Samples for 10Be dating were collected from an exposed bedrock ridge on Sûnikajik Island (Figures 2b and 3b). One erratic and one bedrock sample were collected from a glacially smoothed gneiss bedrock surface.
Sampling site: Køge Bugt
Køge Bugt is a large embayment in the centre of the southeast region (Figure 1). The bay is 40 km long and more than 20 km wide. The bathymetry of Køge Bugt has been partially mapped; multibeam echo sounder data demonstrate the presence of a central trough feature that is more than 700 m deep (Fenty et al., 2016; Millan et al., 2018). Køge Bugt is the drainage portal for several large marine-terminating outlet glaciers that drain approximately 30,000 km2 of the Greenland Ice Sheet (Lewis and Smith, 2009, Figure 1). These glaciers flow at speeds of up to 5 km a−1 and discharge more than 40 Gt of ice annually (Enderlin et al., 2014; Rignot and Kanagaratnam, 2006).
The ice-free areas are low lying and characterised by erosional landforms; striated, streamlined gneiss bedrock dominates the landscape (Figure 2c). Field observations, Landsat 8 imagery and aerial photographs (Korsgaard et al., 2016) show that there are very few depositional features in the area. Minor moraines exist near the present-day ice margin (Figure S3, available online). A small moraine also extends over the northern tip of Sipuliq Island (Figure 3c).
Rock samples for 10Be dating were collected from Aqitseq Island (Figures 2c and 3c). A lack of suitable cobbles and boulders resulted in the collection of only one erratic rock sample. This was accompanied by a pair of bedrock samples that were obtained from a streamlined and striated gneiss surface nearby (Figure 2c).
Sampling site: Gerners Island
Gerners Island (Kulusuk) is part of a coastal archipelago approximately 30 km north of Gyldenløve Fjord (Figure 3d). Gerners Island covers an area of 17 km2 and is 369 m a.s.l. at its highest point (Schjøtt, 2007a). The geomorphology of the island is characterised by glacially scoured gneiss bedrock, small perennial snow patches, numerous lakes and ponds, and limited sediment cover (Figures 2d and S4, available online). Gerners Island lies several kilometres offshore from Fridtjof Nansens Halvø, a mountainous, glaciated peninsula (Figure 3d). The peninsula hosts a small icefield (79.2 km2) that is contiguous with the main body of the Greenland Ice Sheet (Rastner et al., 2012). Kagtertôq, a 9 km wide channel, separates the sampling site from Jens Munks Island and Køge Bugt to the north (Figure 3d). Gyldenløve Fjord, to the south of Gerners Island, is a large fjord system and the drainage portal for several major tidewater glaciers (Figure 1).
Samples were collected from an exposed ridge on Gerners Island. Two erratic cobbles and a single bedrock sample were collected for 10Be analysis from this site.
Sampling design and methods
10Be sampling design and procedure
Rock samples for 10Be exposure dating were collected in 2011 from four outer-coast locations across central southeast Greenland (Figures 1–3). Samples were collected opportunistically during several research cruises along the coast. Samples were collected exclusively from low-elevation areas situated above the local marine limit. This was identified in the field by the occurrence of perched boulders (e.g. Long et al., 2008). Samples were collected from bedrock that was free from vegetation and debris cover, and away from overshadowing terrain. Sampling sites were carefully located on prominent ridges; these are windswept and have experienced pronounced subglacial erosion. This approach mitigates shielding of rock samples by snow and minimises the potential for cosmogenic nuclide inheritance. Bedrock samples were collected from ice-scoured surfaces using a hammer and chisel (Figure 2c). Erratic samples consisted of whole, perched, rounded cobbles. Relatively heavy cobbles were chosen as these are unlikely to have been remobilised by the extreme katabatic winds that sporadically occur in the region (van As et al., 2014). All samples were collected from quartz-rich lithologies that are suitable for 10Be analysis.
Sample location and elevation were determined using a hand-held Garmin eTrex GPS unit with horizontal and vertical uncertainties of ~5 and ~10 m, respectively. Measurements of topographic shielding were taken at 30° intervals using a Suunto sighting clinometer. Additional measurements were undertaken, where necessary, to accurately characterise the horizon (Dunne et al., 1999).
Sample preparation and 10Be measurement
The surface of each rock sample was prepared for 10Be analysis using standard mechanical and chemical procedures (Child et al., 2000; Kohl and Nishiizumi, 1992; Wilson et al., 2008). Samples were spiked with c. 200 mg of 9Be carrier during quartz dissolution. The carrier used at the Cosmogenic Isotope Analysis Facility yields a long-term average concentration of c. 1 × 10⁻¹⁵ 10Be/9Be. Measurements of 10Be content were undertaken as part of a routine 10Be run on the 5 Mv Pelletron tandem accelerator at the Scottish Universities Environmental Research Centre (Freeman et al., 2007). Measured 10Be/9Be ratios were normalised to NIST SRM4325 material with an assumed ratio of 2.79 × 10⁻¹¹; this is equivalent to the 07KNSTD standard (Nishiizumi et al., 2007). Samples yielded 10Be/9Be ratios between 61.5 and 784.1 × 10⁻¹⁵. The procedural blank yielded a concentration of 4.9 ± 0.6 × 10⁻¹⁵ 10Be/9Be; this reflects minor 10Be contamination from the reagents used during the chemical processing of rock samples.
10Be exposure age calculation
Exposure ages were calculated from 10Be measurements using the online CRONUS-Earth calculator (version 2.2, http://hess.ess.washington.edu/math/). Exposure ages were calculated using the Arctic production rate (Young et al., 2013) and Lal/Stone time-independent scaling (Lal, 1991; Stone, 2000). Exposure ages were calculated using individual correction factors for sample thickness, density and topographic shielding (Table 1). No correction was applied to account for elevation changes caused by isostatic rebound. This is assumed to be relatively minor as the majority of uplift occurred quickly during the Lateglacial and early Holocene (Bennike et al., 2002; Long et al., 2008). Exposure ages were calculated without applying a correction for erosion. Samples were collected exclusively from crystalline gneisses that are extremely resistant to weathering. The preservation of millimetre-scale glacial striations on gneiss surfaces up to ~11.8 ka BP old demonstrates that subaerial erosion rates in southeast Greenland are negligible over Holocene timescales (Dyke et al., 2014).
Sample details and 10Be age determinations.
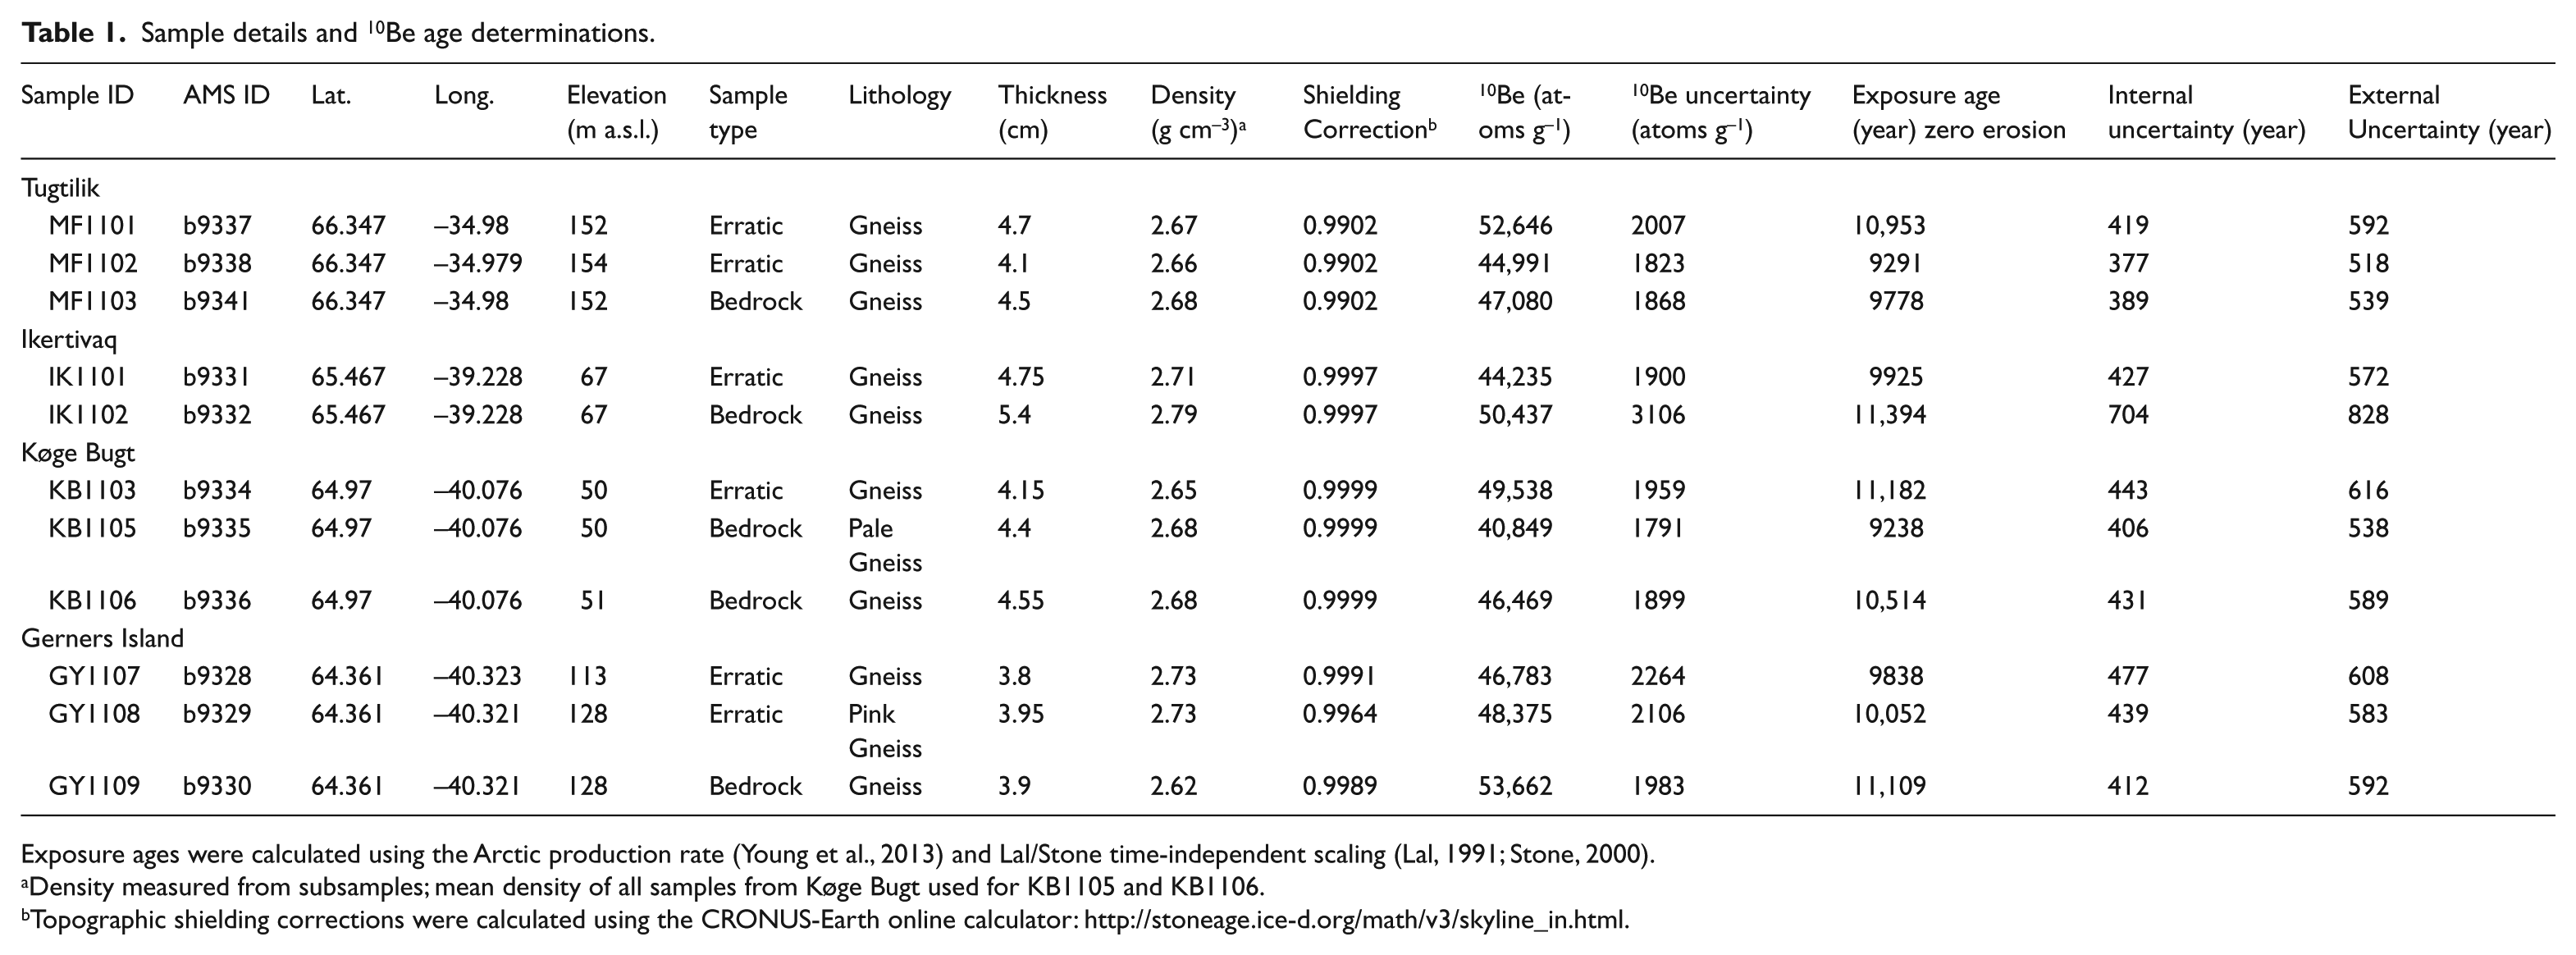
Exposure ages were calculated using the Arctic production rate (Young et al., 2013) and Lal/Stone time-independent scaling (Lal, 1991; Stone, 2000).
Density measured from subsamples; mean density of all samples from Køge Bugt used for KB1105 and KB1106.
Topographic shielding corrections were calculated using the CRONUS-Earth online calculator: http://stoneage.ice-d.org/math/v3/skyline_in.html.
Exposure ages are presented in thousands of years before sample collection (ka BP) and are accompanied by internal uncertainties. The standard deviation is given as the measure of uncertainty where the mean of several samples has been calculated (Dunai, 2010).
Results
We present 11 new 10Be exposure ages from coastal locations across southeast Greenland (Figures 3 and 4). Sample details and accelerator mass spectrometry results are presented in Table 1.
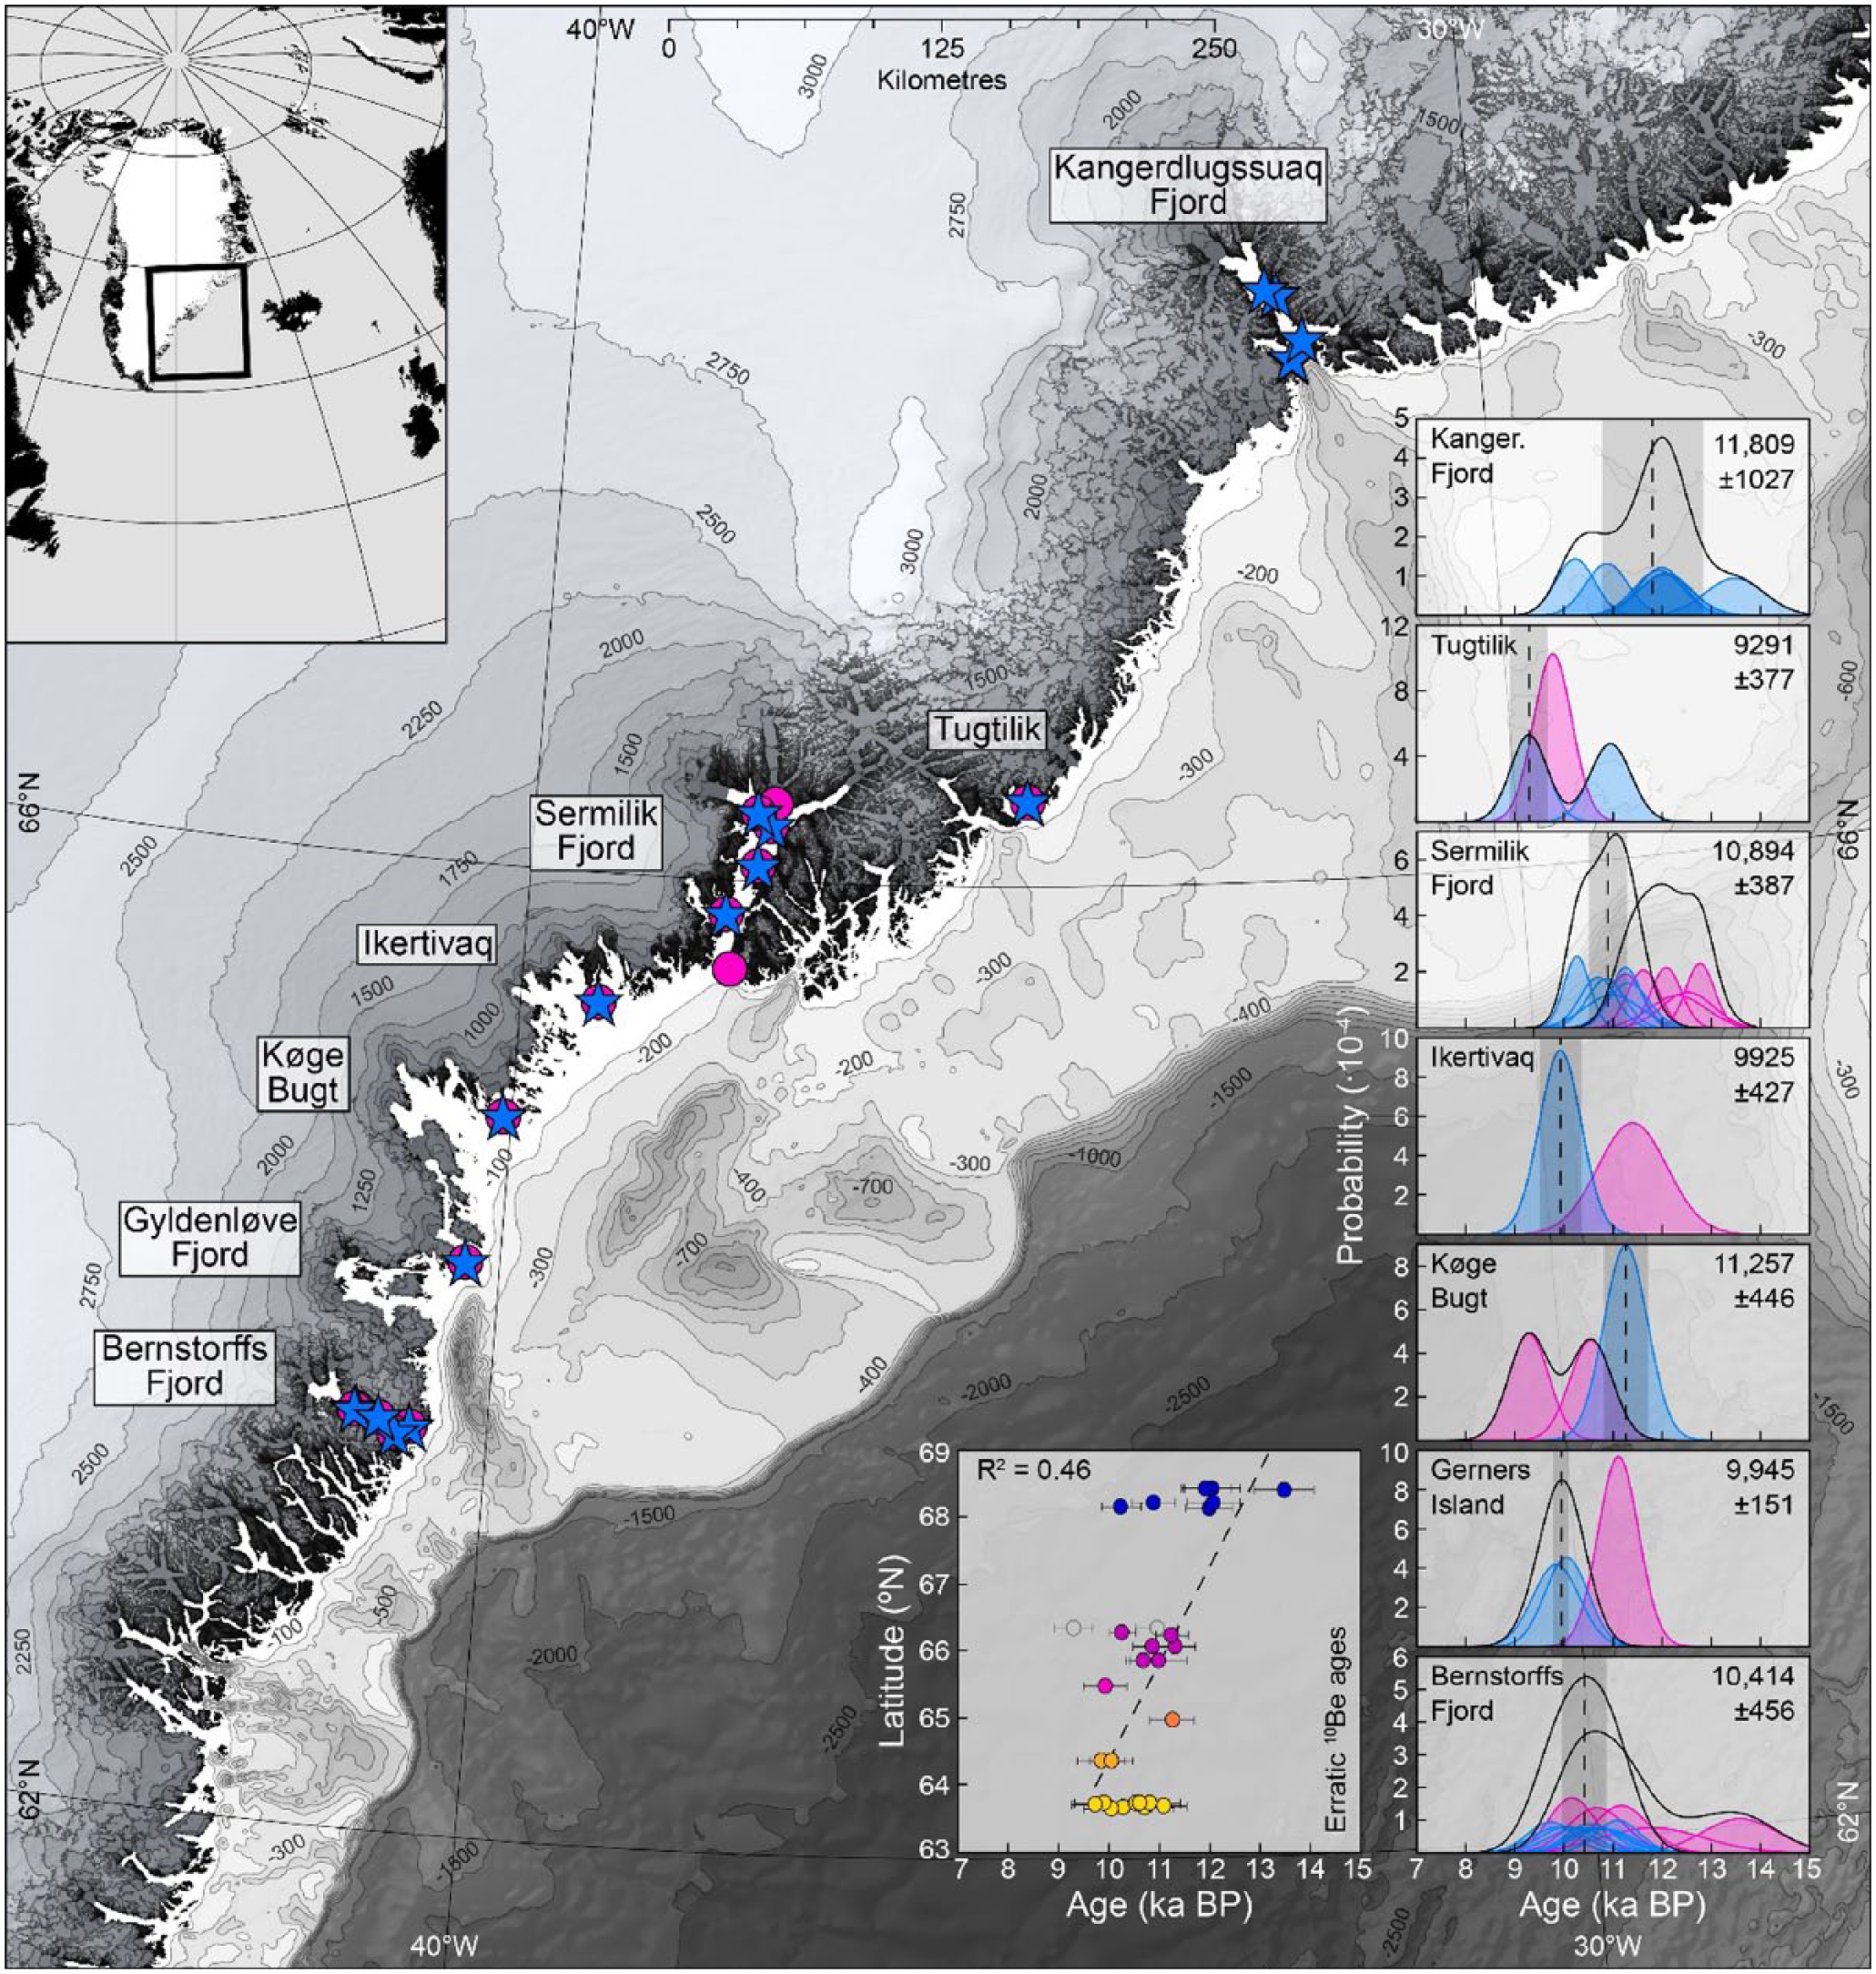
Map of 10Be exposure dates from southeast Greenland (Dyke et al., 2014; Hughes et al., 2012; and this study). Terrestrial elevation data are from Howat et al. (2014). Bathymetric data are from Jakobsson et al. (2012). Camel plots generated using MATLAB after Balco (2011). Erratic 10Be exposure ages are shown in blue. Bedrock 10Be exposure ages are shown in magenta. The timing of deglaciation at each site is shown by the dashed line, errors are shown by the grey shaded area. The latitudinal trend in the deglaciation of high-discharge glacier systems is shown in the inset plot. The linear regression excludes samples from Tugtilik (hollow circles). Samples are coloured by sampling site and show their individual internal uncertainties.
Tugtilik
Two erratic cobbles from Tugtilik are dated to 11.0 ± 0.4 and 9.3 ± 0.4 ka BP, the accompanying bedrock sample yields an exposure age of 9.8 ± 0.4 ka BP (Figure 3a). The sample site is characterised by a low-discharge glaciological regime and is surrounded by small, land-terminating cirque glaciers (Section ‘10Be sampling design and procedure’). Geomorphological mapping (Figure S1, available online) and field observations indicate that glacial erosion has been limited in this setting. It is plausible that both bedrock and erratic samples contain inherited 10Be as slow-moving, polythermal cirque glaciers are inefficient at both eroding bedrock and removing pre-existing subglacial erratics from their catchments. In comparable settings in central East Greenland, the youngest boulder samples have been used to determine the timing of deglaciation (Hall et al., 2008a, 2008b; Kelly et al., 2008). This approach is adopted for the samples from Tugtilik. The older erratic and bedrock 10Be ages probably reflect substantial quantities of inherited 10Be. The youngest erratic 10Be age best represents the final deglaciation of Tugtilik, which occurred at 9.3 ± 0.4 ka BP.
Ikertivaq
The erratic cobble from Sûnikajik Island is dated to 9.9 ± 0.4 ka BP, the accompanying bedrock sample yields an exposure age of 11.4 ± 0.7 ka BP (Figure 3b). Ikertivaq is characterised by glacially scoured, streamlined bedrock (Figure S2, available online). This suggests that the area was completely overrun by fast-flowing ice during the last glaciation. Intense ice streaming would have removed all pre-existing erratics from the landscape. Consequently, boulder samples from this area are unlikely to contain inherited 10Be and we use the erratic exposure age (9.9 ± 0.4 ka BP) to constrain the timing of deglaciation in this area. The bedrock sample is almost 2 ka older and probably contains inherited 10Be. We consider this sample to be anomalously old.
Køge Bugt
The single erratic sample from Aqitseq Island, in Køge Bugt, yields an exposure age of 11.2 ± 0.4 ka BP. The accompanying bedrock samples have exposure ages of 9.2 ± 0.4 and 10.5 ± 0.4 ka BP (Figure 3c). The erratic sample is substantially older than its bedrock counterparts; this is uncommon in high-discharge glacial systems in southeast Greenland, based on our previous work in the region (Dyke et al., 2014; Hughes et al., 2012). There are several explanations that may account for this. The erratic could be anomalously old as a result of inherited 10Be content. We consider this implausible as Køge Bugt experienced intense glacial erosion during the last glaciation (Figure S3, available online) and it is very unlikely that pre-existing erratics remained on the landscape through glacial inundation. Alternatively, the bedrock samples may have been shielded by sediment or snow cover after deglaciation; this would result in anomalously young ages. However, there is no geomorphological evidence that the sample site has been covered by sediment during the Holocene. Snow cover is also considered unlikely. The samples were collected from an exposed, windswept ridge where snow cover is intrinsically limited. Furthermore, all samples were taken from the same surface and sediment or snow cover would affect all samples similarly. The difference between erratic and bedrock 10Be exposure ages at this location remains unexplained.
Cosmogenic isotope dates from Køge Bugt are complimented by recently reported 14C dates from a marine sediment core obtained from the centre of the bay (Figures 1 and 3c, Dyke et al., 2017). Results from the core demonstrate that Køge Bugt has been characterised by open glaciomarine conditions from at least 9.1 ± 0.2 thousand calibrated years before present (cal. ka BP). The basal 14C date provides an absolute minimum constraint on the timing of deglaciation for this fjord, and we infer that the sampling site on Aqitseq Island had deglaciated substantially before this time. The overlap between the 14C date (9.1 ± 0.2 cal. ka BP) and the youngest 10Be exposure age (9.2 ± 0.4 ka BP) suggests that this 10Be age is anomalously young. In addition, the exposure age of this sample does not overlap within errors with either of the other samples from this site. Consequently, we exclude the youngest bedrock 10Be age from further analysis. For consistency with other sites across southeast Greenland, we use the erratic exposure age (11.2 ± 0.4 ka BP) to track the timing of deglaciation in Køge Bugt. However, it is important to note that we use this age tentatively.
Gerners Island
Erratic samples from Gerners Island, to the north of Gyldenløve Fjord, yield exposure ages of 9.8 ± 0.5 and 10.1 ± 0.4 ka BP. These ages are concordant and overlap within uncertainties (Figure 3d). The accompanying bedrock sample is significantly older (11.4 ± 0.7 ka BP) and does not overlap within error with the erratic exposure ages from this locality. The bedrock sample likely contains inherited 10Be. The erratic samples are considered to accurately constrain the timing of deglaciation at this site. The mean and standard deviation of the erratic samples (9.9 ± 0.2 ka BP) are used for further analysis and discussion. The sampling site is located between Gyldenløve Fjord and Kagtertôq (Figure 3d). These large channel features would have hosted substantial ice streams during the LGM, and the timing of deglaciation at Gerners Island probably reflects the retreat and separation of these glacier systems.
Discussion
Using 10Be dates to determine the timing of deglaciation
We present new 10Be exposure ages from outer-coast areas of southeast Greenland. The results indicate that deglaciation occurred in these areas between 11.2 and 9.3 ka BP (Figures 3 and 4). The geomorphology of Ikertivaq, Køge Bugt and Gerners Island is characterised by features formed through intense glacial erosion (Figures S1–S4, available online). A wide range of geomorphological features at macro-, meso- and micro-scales suggest that these areas experienced intense glacial erosion beneath high-discharge ice streams during the last glaciation. Erratic samples from high-discharge settings generally provide a reliable record of the timing of deglaciation (e.g. Hughes et al., 2012; Roberts et al., 2009; Winsor et al., 2015). Consequently, we use the mean 10Be exposure age of erratics to determine the timing of deglaciation at each of these sites.
The sampling site at Tugtilik is fundamentally different to the areas further south. The site is sheltered from the main body of the Greenland Ice Sheet by high coastal mountains and is located away from major outlet glaciers (Figure 3a). Geomorphological mapping further highlights the differences between Tugtilik and the other sampling sites (Figures S1–S4, available online). The sampling sites at Ikertivaq, Køge Bugt and Gerners Island are all characterised by glacially scoured bedrock and the absence of depositional features (Figure 2). In contrast, Tugtilik has varied geomorphology that includes both depositional and periglacial features (Figure S1, available online). We interpret this as evidence that Tugtilik experienced a low-discharge regime during glacial inundation (Glasser and Bennett, 2004). Consequently, we treat the 10Be exposure ages from Tugtilik differently, the youngest erratic age from this site is used to determine the timing of deglaciation (e.g. Hall et al., 2008b; Kelly et al., 2008).
The timing of deglaciation in southeast Greenland
New 10Be dates from outer-coast areas of southeast Greenland complement existing data from the large fjords in the region (Dyke et al., 2014; Hughes et al., 2012). When compiled, the 10Be data indicate that the deglaciation of the coast occurred first in the north of the sector, and progressed southwards during the early Holocene (Figure 4). Adjacent glacier systems in southeast Greenland largely deglaciated in synchronicity (i.e. within error). However, there is a more substantial difference in the timing of deglaciation between Kangerdlugssuaq Fjord (11.8 ± 1.0 ka BP), in the north of the sector, and Bernstorffs Fjord (10.4 ± 0.5 ka BP) and Gerners Island (9.9 ± 0.2 ka BP), in the south of the region (Figure 4). It is important to note that this trend is not particularly robust (R2 = 0.46), but there is an obvious pattern of deglaciation occurring first in the north, before progressing southwards.
We build on the hypothesis of Dyke et al. (2014) and suggest that the deglaciation of the coast in southeast Greenland was initially driven by the incursion of warm water from the Irminger Current. However, the impact of the Irminger Current on individual glacier systems was moderated by the local coastal bathymetry. Incursion of warm Atlantic water into Kangerdlugssuaq Trough triggered the deglaciation of Kangerdlugssuaq Fjord at around 11.8 ka BP (Figure 4). This occurred during cold climatic conditions at the end of the Younger Dryas stadial (Dyke et al., 2014; Jennings et al., 2006). Kangerdlugssuaq Glacier is particularly susceptible to oceanographic forcing as it is closest to the source of warm Atlantic Water and the deep, straight canyon of Kangerdlugssuaq Trough allows the Irminger Current to easily penetrate the continental shelf (Figures 1 and 4). The large glacier systems further south deglaciated later, between approximately 11.2 and 9.9 ka BP (Figure 4). These systems have sinuous troughs and areas of shallow bathymetry offshore, and this limited the incursion of the Irminger Current to these glaciers during the Younger Dryas (Figure 4; Fenty et al., 2016; Sutherland et al., 2013). The retreat of glaciers in the centre and south of southeast Greenland occurred during the early Holocene and appears to have been driven primarily by the pronounced atmospheric warming during this interval (Dyke et al., 2014; Hughes et al., 2012).
The latitudinal trend in the timing of deglaciation may have been accentuated by the discharge of meltwater and icebergs during the deglaciation of Kangerdlugssuaq Fjord. This would have cooled and freshened the Irminger Current and reduced its capacity to melt the marine-terminating glaciers downstream. Modern oceanographic measurements provide an analogue for this hypothesis. The freshwater content in surface currents off southeast Greenland increases by 60% from 68°N to 60°N due to the combined input of glacier runoff, iceberg melt and sea-ice melt (Sutherland and Pickart, 2008). Glacier retreat and ice discharge during the late Younger Dryas and early Holocene was at least as fast as the present-day (Dyke et al., 2014; Hughes et al., 2012), and it is likely that this effect was more pronounced during the extensive deglaciation that occurred in this interval.
Inheritance of 10Be in bedrock samples
Bedrock samples from Ikertivaq and Gerners Island are substantially older than their erratic counterparts. We note that this pattern is not universal in the data presented here. Bedrock samples from Køge Bugt are younger than the accompanying erratic and the bedrock exposure age from Tugtilik is bracketed by the erratic exposure ages (Figure 4). However, the offset between erratic and bedrock ages is clearer when the data from across the region are compiled (Dyke et al., 2014; Hughes et al., 2012). The compiled data show a reasonably consistent and more systematic offset, of around 1 ka, between erratic and boulder exposure ages (Figure 4).
The excess 10Be content in bedrock surfaces across much of the region suggests that glacial erosion was not sufficient to completely remove 10Be from previous periods of exposure. The origin of the inherited 10Be in bedrock samples is unclear. It may simply reflect erosion of less than 3 m through the last glacial cycle (Gosse and Phillips, 2001). Alternatively, the pattern of young erratics on bedrock with minor 10Be inheritance could be the signature of a short-lived glacial readvance event that occurred after initial deglaciation. This ‘scrubbed’ existing erratics from the landscape, but was insufficient to remove 10Be that accumulated during the ice-free conditions before the subsequent readvance. We speculate that this retreat and readvance event may have occurred during the Bølling–Allerød and Younger Dryas. The evidence for this scenario is, at best, circumstantial. However, it is possible to test with additional targeted investigation. High-resolution numerical glacier modelling, multiple nuclide exposure dating and exposure ages from vertical ‘dipstick’ transects within the major fjord systems all offer the opportunity to resolve this hypothesis. Further investigation is required.
Conclusion
The compilation of new and existing 10Be age determinations from coastal locations across southeast Greenland confirm that deglaciation occurred first in the north of the sector and progressed southwards. This pattern of deglaciation is attributed to the varying influence of the Irminger Current on the ice margin that, in turn, was moderated by the bathymetry of the continental shelf. This demonstrates that oceanographic forcing was important in pacing glacier retreat in southeast Greenland through the Younger Dryas and early Holocene along the entire length of the coast.
In most areas of southeast Greenland, bedrock ages are systematically older than their counterpart boulder samples. The offset reflects the presence of excess 10Be in bedrock surfaces, inherited from previous periods of exposure. This may indicate that subglacial erosion during the last glacial cycle was insufficient to completely remove pre-existing 10Be content. Alternatively, this pattern may be the signature of a substantial glacial retreat and advance cycle prior to final Holocene deglaciation.
Supplemental Material
Supplementary_material – Supplemental material for The deglaciation of coastal areas of southeast Greenland
Supplemental material, Supplementary_material for The deglaciation of coastal areas of southeast Greenland by Laurence M Dyke, Anna LC Hughes, Camilla S Andresen, Tavi Murray, John F Hiemstra, Anders A Bjørk and Ángel Rodés in The Holocene
Footnotes
Acknowledgements
We thank the captain (Sigurður Petturson) and crew of M/V Þytur for their assistance during fieldwork.
Funding
This manuscript is a contribution to the ‘Past and Future Dynamics of the Greenland Ice Sheet: What Is the Ocean Hiding?’ Project (Camilla Andresen; VILLUM Foundation, 10100). This project was conceived and samples were collected while Laurence Dyke was in receipt of a NERC CASE doctoral scholarship (NE/I528126/1). Samples were processed and analysed with support from a NERC CIAF grant (Laurence Dyke; 9123.0412). Fieldwork was supported by the Leverhulme Trust (Tavi Murray; GLIMPSE Project, F/00391/J) and National Geographic (Tavi Murray; 111741). Additional fieldwork was funded by the Danish Independent Research Council (FNU), the Danish Centre for Sea Research (DCH) and Geocenter Denmark (Camilla S Andresen; SEDIMICE Project).
References
Supplementary Material
Please find the following supplemental material available below.
For Open Access articles published under a Creative Commons License, all supplemental material carries the same license as the article it is associated with.
For non-Open Access articles published, all supplemental material carries a non-exclusive license, and permission requests for re-use of supplemental material or any part of supplemental material shall be sent directly to the copyright owner as specified in the copyright notice associated with the article.
