
Abstract
Aeolian sand sheets and active dunefields preserve an ancient Holocene land surface represented by palaeosols that occur around the present ice margin in the Kangerlussuaq area, West Greenland. To determine the relation between Holocene aeolian activities and periods of soil formation, both substantially dependent on the deglaciation history, palaeosols, aeolian sand sheets and dunefields were analysed using field data, grain size analyses, optically stimulated luminescence dating and AMS 14C data in an area of about 15 km2 of the Umimmalissuaq valley. Palaeosols are developed close to the ice margin (<2 km) in fine-grained aeolian sediment (silt loam) and covered by sandy aeolian layers. Silt contents of palaeosols (partly >60 wt%) are comparable with aeolian sand sheets currently formed at greater distances (4–5 km) from the present ice margin. We propose a transport distance for fine aeolian sediments, in which the palaeosols are formed, of at least 4 km from inboard of the present ice margin. Soil formation of the palaeosols started around 2700 cal. yr b2k. Ages from the youngest parts of the palaeosols suggest a stable period of around 2400 years, allowing for pedogenesis. This period was characterised by low but constant aeolian activity. Since aeolian activity intensified after around 300 cal. yr b2k and is still resulting in active dunefields with coarse and medium sand accumulation, the ice margin must have reached its present position at that time.
Keywords
Introduction
In general, areas close to the margins of ice sheets are strongly affected by aeolian activity (e.g. Brookfield, 2011; Dijkmans and Törnqvist, 1991; French, 2007; Willemse et al., 2003). This is mainly because of strong katabatic winds associated with steep pressure gradients that develop at the margins of ice sheets (Brookfield, 2011), where they reach their highest speeds (Dijkmans and Törnqvist, 1991).
The controls on most aeolian systems and particularly on sand sheet environments like those in West Greenland are the source area, the availability of the source material and wind speed. The outwash-source zone for aeolian sand and silt is commonly controlled by variable discharge. In general, meltwater valleys near the margins of ice sheets are filled with silt-rich discharge in summer and become dry and unprotected to aeolian erosion predominantly in winter (e.g. Bullard and Austin, 2011; Dijkmans, 1990; Dijkmans and Törnqvist, 1991). In addition, during winter with saltating snow and ice, aeolian mobility of sand is enhanced. The formation of a sand sheet either reflects adhesion to a wetted surface or with vegetation (e.g. Koster and Dijkmans, 1988; Ruz and Allard, 1995). Often, the presence of snow and interstitial ice binds aeolian particles to surfaces necessitating higher threshold shear velocities for transport (Ollerhead et al., 2013), although the sublimation rate may be an important factor in grain release (Van Dijk and Law, 1995). The presence of snow ramparts and interstitial layers mostly composed of snow can enhance aeolian accretion and dune movement (Dijkmans and Mücher, 1989; Koster and Dijkmans, 1988; Ruz and Allard, 1995). Furthermore, aeolian transport and deposition of sand and silt are suggested to be affected and limited by topographical barriers (e.g. Mason, 2001; Mason et al., 1999).
Previous studies have shown a correlation between the distribution of wind-blown sediments and grain size, and the former extent of the ice sheet in West Greenland (e.g. Dijkmans and Törnqvist, 1991; Scholz and Grottenthaler, 1988; Willemse et al., 2003). Driven by Holocene climatic fluctuations, alternating phases of both soil formation and aeolian activity occurred with different intensities (e.g. Dijkmans and Törnqvist, 1991; Forman et al., 2007; Ozols, 2003; Scholz and Grottenthaler, 1988; Stäblein, 1975; Ten Brink, 1975; Van Tatenhove et al., 1996; Weidick, 1985; Willemse et al., 2003). The forefield of the inland ice margin was affected by permanent modifications of the palaeoenvironment because of changing glacial dynamics and alternating glaciofluvial and aeolian processes. These processes may be linked in complex ways; however, the intensity of glaciofluvial and aeolian processes decreases with increasing distance from the ice margin (Dijkmans and Törnqvist, 1991; Scholz and Grottenthaler, 1988; Van den Broeke and Gallée, 1996), and correspondingly the influence of wind on erosion and sedimentation. Therefore, the changing distance from the ice margin to the outwash-source zone affected the variability in discharge, and thus the supply of aeolian sand and silt, which had impacts on the formation of soils, aeolian sand sheets and dunefields in the Holocene (cf. Willemse et al., 2003). Palaeosols developed in the aeolian sediments around Kangerlussuaq indicate an interruption or decrease in aeolian activity (e.g. Dijkmans and Törnqvist, 1991; Scholz and Grottenthaler, 1988; Willemse et al., 2003). They can be taken as proxies for stable environmental conditions. For the timing of soil formation, different data exist. According to Van Tatenhove et al. (1996), soil formation in Sandflugtdalen (Figure 1a) north of the study area started around 4560 cal. yr b2k. Willemse et al. (2003) assume an onset of soil formation prior to 3450 cal. yr b2k and a halt in soil formation 600 cal. yr b2k in Sandflugtdalen and Ørkendalen (Figure 1a). Similarly, Dijkmans and Törnqvist (1991) suggest soil formation between 3350 cal. yr b2k and 650 cal. yr b2k. Likewise, Forman et al. (2007) propose the beginning of soil formation after 3 ka, whereas Ozols (2003, 1600 cal. yr b2k) and Scholz and Grottenthaler (1988, 1.5 ka) assume a distinctly later start. In general, soil formation around Kangerlussuaq has been strongly connected to dynamics of the inland ice: During a retreat of the ice, changing environmental conditions favoured soil formation in the study area because of lower discharge or more distal location from the source area, and thus lower intensity of katabatic winds and less supply of aeolian sediment, whereas an advance led to an interruption of soil formation caused by opposite conditions. However, knowledge regarding the exact timing of soil formation in the Kangerlussuaq area is still insufficient, and more data are needed.
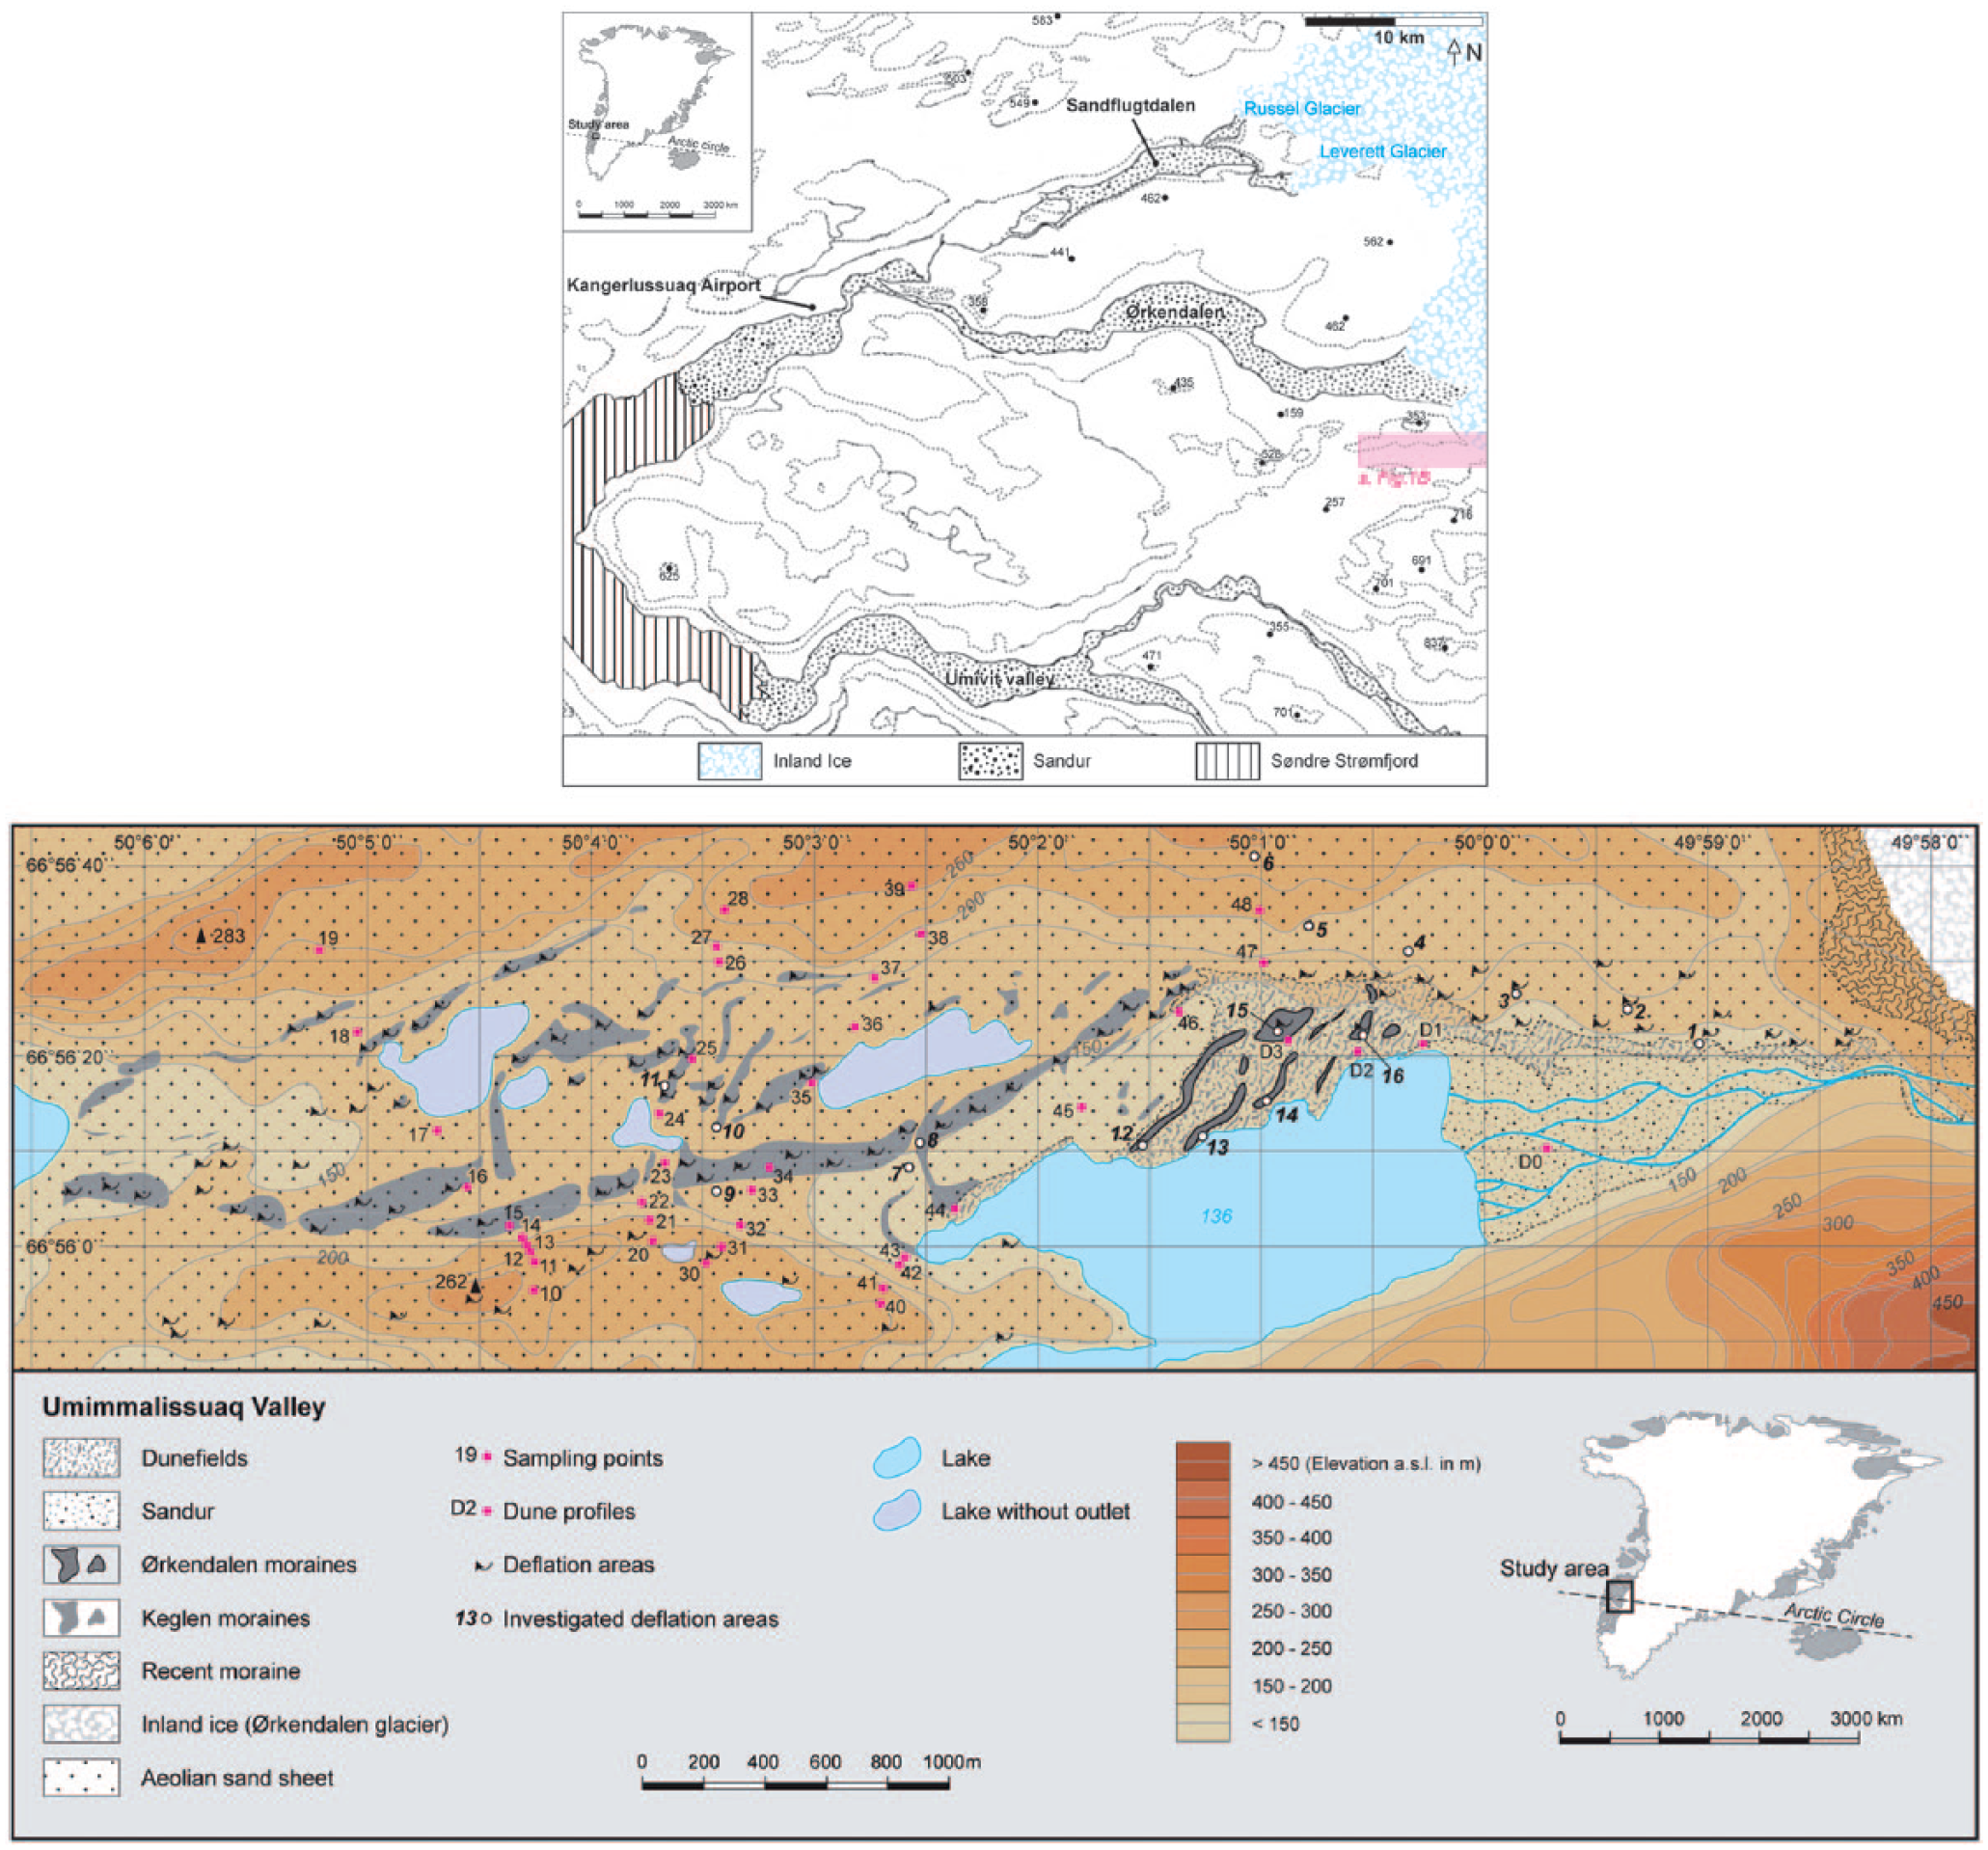
(a) Map of the area around Kangerlussuaq, West Greenland, showing the study area and the adjacent valleys Sandflugtdalen and Ørkendalen; modified after Storms et al., 2012. (b) Geomorphological map of the Umimmalissuaq valley based upon air-photo interpretation, field evidence and additional information in Ten Brink (1975).
In this study, we aim to characterise the results of interaction of both aeolian-geomorphic processes and pedogenic processes across an E-W oriented valley in West Greenland. We further aim to understand how the intensity of these processes changed in response to middle and late Holocene glacial retreat and readvance. The lines of evidence include (1) the spatial patterns of modern landforms, surface sediments and soils and (2) the stratigraphy observed along sampling transects, which allows for temporal reconstruction of these spatial patterns.
Study area
The Kangerlussuaq area is characterised by an E-W and ENE-WSW oriented valley system that leads the meltwater to the sea (Scholz and Grottenthaler, 1988). The E-W oriented Umimmalissuaq valley is located in West Greenland, around 30 km southeast of Kangerlussuaq (Figure 1a and b).
The bedrock in the study area is mainly Precambrian gneiss (e.g. Henriksen, 2008; Ozols and Broll, 2003; Scholz and Grottenthaler, 1988); therefore, the aeolian transported material consists of non-calcareous and non-basaltic material. Based on the authors’ field observations, the Ørkendalen glacier (Figure 1b) at the eastern side of the study area forms an active moraine system, which is overrunning current vegetation (Figure 2a). We observed the meltwater to drain predominantly northward in the Ørken-dalen valley, but also in the direction of the Umimmalissuaq valley. Forming a glacial outwash plain or sandur, and a delta, meltwater drains more or less directly into a lake system towards southwest and west, not using the Umimmalissuaq valley (Figures 1b and 2b). Compared with Sandflugtdalen and Ørkendalen, the outwash plain is small (ca. 0.2 km2). The entire outwash plain generally acts as source for aeolian sediments. Our field observations indicated aeolian sand and silt to be mainly blown out from northwestern parts of the outwash plain (ca. 200–300 m southeast of profile D1, cf. Figure 1b), which are barely affected by meltwater channels in summer. Most parts of the valley itself are higher in elevation than the outwash plain (up to 50 m). The study area further includes the hills north and south of the valley, which rise up to 150 m higher than the outwash plain (Figures 1b and 2b).
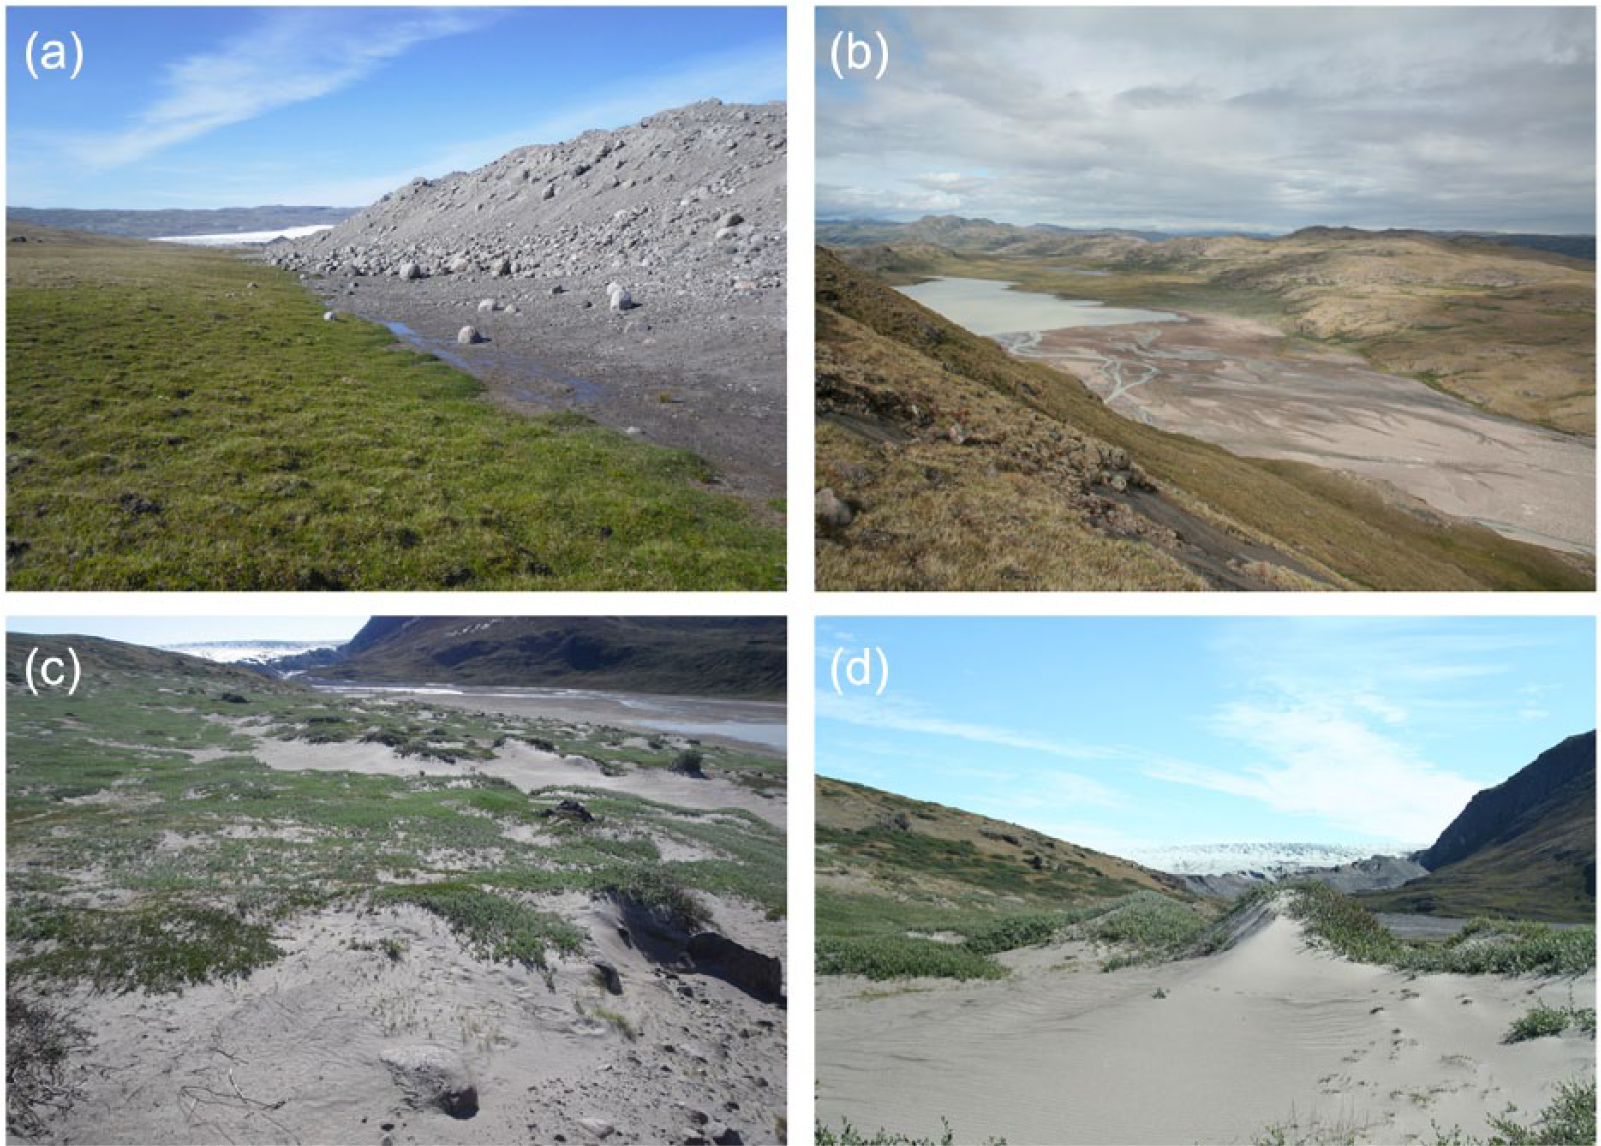
(a) Recent moraine of Ørkendalen glacier overrunning current vegetation. Photo (2014) was taken towards northwest. (b) Umimmalissuaq valley with the glacial outwash plain and the large dunefield west/northwest of the outwash plain (for locations, see Figure 1b) – taken towards west/northwest. (c) and (d) Large dunefield, glacial outwash plain and Ørkendalen glacier – (c) taken from profile D3 towards east and (d) taken from profile D2 towards east.
The valley is covered by glacial deposits of the Keglen and Ørkendalen moraine systems as a result of the middle and late Holocene readvances of the ice sheet (Stäblein, 1975; Ten Brink, 1975; Weidick, 1985). Moreover, glaciofluvial sediments are widespread in the valley. The glacial and glaciofluvial deposits, and most of the valley bottom and slopes, are covered by a fine-grained aeolian sand sheet (ca. 60% coverage, Figure 1b), except areas close to the ice margin (sandur, recent moraine, dunefields). North, northwest and west of the glacial outwash plain, there are still active coarse-grained dunefields (ca. 5% coverage; Figures 1b and 2b–d). Numerous distinct deflation areas cut into the aeolian sand sheet and are present predominantly on top of moraines and slopes facing the ice margin (Figure 1b).
The weather station closest to the study area is Kangerlussuaq Airport (Figure 1a). The present-day climate of Kangerlussuaq is Low Arctic continental: mean annual air temperature is −4.8°C and mean annual precipitation is 257 mm (1979–2008; according to data from Boas and Wang, 2011). Low precipitation in winter (Cappelen et al., 2001) indicates a thin snow cover in the study area during winter months (Ozols and Broll, 2003). In Kangerlussuaq, mean wind speed at 2 m above ground level is 3.6 m/s (1985–1999; Cappelen et al., 2001). Mean maximum wind speed at the same height is 19.6 m/s (1985–1999; Cappelen et al., 2001), and the most frequent wind direction is NE (Cappelen et al., 2001), indicating the effect of thermally induced katabatic winds and airflow channelling in the valleys (Van den Broeke and Gallée, 1996). The Umimmalissuaq valley is strongly affected by these katabatic winds which are stronger in winter because of a negative surface radiation and therefore a temperature deficiency above the snow-covered ablation zone (Willemse, 2000). Compared with Kangerlussuaq, the study area is linked directly to the inland ice (Figure 1a and b). Thus, it is most probably drier and colder and more affected by high wind speeds because of a stronger influence of katabatic winds from the inland ice; these katabatic winds will have been active throughout the Holocene.
The topographic position, the distance from the ice margin and the aspect seem to be mainly responsible for the type of vegetative cover, the soil distribution and the thickness of the active layer of the permafrost in the study area. Permafrost exists at depths <20–30 cm at north-facing slopes, where organic-rich permafrost is common. On south-facing slopes, permafrost has not been detected <1 m. North-facing (moist) slopes have dense vegetation and organic-rich soil horizons within the active layer, whereas south-facing (dry) slopes or ridges have little or no vegetation and are thus subject to deflation.
Materials and methods
Mapping and sedimentary analysis
The geomorphological map (Figure 1b) is based on aerial photographs of the Danish Geodetic Institute (scale 1:40,000; Kort and Matrikelstyrelsen, 1968), publications from Scholz and Grottenthaler (1988) and Ten Brink (1975) and our field surveys in 2009 and 2011.
In total, 187 samples for grain size analysis (Supplementary material Table S1, available online) were taken in dunefields north, northwest and west to the glacial outwash plain (Figures 1b and 2b–d), and in four cross-sections through the valley with different distances from the recent ice margin. Each cross-section comprises 9–10 sampling points; section 1 (sampling points 10–19) is distal (ca. 4–5 km) and section 4 (sampling points 40–48) proximal (ca. 2–3 km) to the ice margin (Figure 1b). From each sampling point (10–48; Figure 1b) horizons at different depths were described according to the Food and Agriculture Organisation of the United Nations (FAO, 2006) guideline for soil description and subsequently sampled. At the cross-sections, we refer to the upper 30 cm (maximum depth of active layer at north-facing slopes) as the upper layer and to the horizons below 30 cm as the lower layer of the aeolian sand sheet, respectively.
Additional buried humic palaeosols (lower layer) – found under still active dunes (soil profiles D0–D3, Figure 1b) – were sampled. For the upper layer (layer above the palaeosol as described more detailed in ‘Results’ section), a field soil texture hand test was used to determine bands of different grain sizes. The grain size distribution of all samples was determined in the laboratory after Blume et al. (2011) according to DIN ISO 11 277. Furthermore, depth, width, length, inclination and aspect of 16 selected deflation areas (Supplementary material Table S2, available online) were measured to get an overview where deflation is active and which kind of material is subject to wind erosion. Statistical analyses for grain size distribution patterns were implemented with the free programming language R, version 3.1.2 (R Development Core Team, 2014) by applying R-packages car (Fox and Weisberg, 2011) and RCMDR (Fox, 2005).
Radiocarbon dating
Soil organic matter from the palaeosols was dated by AMS 14C dating in the laboratory of Erlangen/Germany (abbr. Erl-; see Table 2). Calibration of 14C data was done with OxCal 4.2 (Bronk Ramsey, 2009). Radiocarbon dating was performed on 14 samples after pre-treatment according to the acid–alkali–acid method: the samples were heated at 80°C in 1M HCl to remove carbonates. Then, the samples were heated at 80°C in 1M NaOH to remove humic acids and fulvic acids, respectively. Afterwards, the samples were heated at 80°C again in 1M HCl to remove remaining carbonates. Finally, the samples were dried at 100°C and stored in closed glasses to avoid contamination. Six samples were taken from varying depths in profile D1 and five samples from varying depths in profile D2 in the active dunefields (Figure 1b). Additionally, the soil organic matter of three palaeosols of transects 1–3 were dated (profiles 17, 24, 33 in Figure 1b).
Optically stimulated luminescence dating
Four samples from profile D2 (sampling depths given in Table 3) were dated using both quartz and feldspar optically stimulated luminescence (OSL). Sand grains ranging from 90 to 180 µm were obtained through wet-sieving of the bulk sample (taken in opaque tubes), followed by treatment with 10% HCl and 10% H2O2 and subsequent density separation using fast float (LST; potassium-rich feldspar ρ < 2.58 g/cm3, quartz ρ > 2.62 g/cm3). The mineral extracts were etched with 10% hydrofluoric acid (HF) for 30 min in case of feldspar and with 40% HF for 1 h in case of quartz. After etching, the samples were treated with 30% HCl in order to remove any fluorides which might have formed during the treatment. Finally, the samples were washed with distilled water and dried at 50°C prior to re-sieving.
The purity of the quartz extracts was tested following Duller (2003). All samples were contaminated by feldspar, so the extracts were re-etched in 40% HF for 40 min, washed and re-sieved. The subsequent purity test showed that the aggressive treatment would not entirely remove the feldspar contribution to the OSL signal; thus, this had to be done instrumentally.
The samples were measured using Risø TL/OSL readers (model DA-20; Bøtter-Jensen et al., 2010) equipped with a calibrated 90Sr/90Y beta source and with both blue (470 nm) and infra-red (IR; 870 nm) emitting diodes. The luminescence signals of the quartz extracts were detected through a Hoya U-340 filter. Because of the feldspar contamination, the quartz was measured using a double single-aliquot regenerative (dSAR) protocol (Banerjee et al., 2001). To find suitable measurement settings, both a preheat plateau and thermal transfer were measured on sample 143080 (cf. Table 3) with preheat temperatures ranging from 160°C to 300°C. The cut-heat temperature following a test dose of ~ 5 Gy was 20°C below the preheat temperature. For each setting, three aliquots were used, and the mean equivalent dose (De) was calculated. Based on the results (Supplementary material Figure S1, available online), a preheat of 200°C (cut-heat 180°C) was chosen. The preheat was followed by IR stimulation at 50°C (100 s) and a subsequent blue stimulation at 125°C (40 s). Each measurement cycle ended with a high temperature clean-out (280°C) using blue LEDs (40 s). For each sample, >30 small aliquots (few tens of grains) were measured. The initial 0.2 s of the decay curve minus a background from the subsequent 1 s was used for calculation. The OSL signals are dominated by the fast component (Supplementary material Figure S2, available online); however, less than 1% of the aliquots passed the rejection criteria (recycling ratio within 10%, test dose error within 20%, signal more than 3σ above background). It was therefore decided to not continue the quartz measurements but to test the feldspar extracts instead.
For equivalent dose measurements of the potassium-rich feldspar extracts, a single-aliquot regenerative (SAR) procedure was employed (Wallinga et al., 2000) on small aliquots (few tens of grains). IR stimulation was carried out at 50°C for 100 s after preheating at 250°C (60 s); the response to the test dose of 2.5 Gy was measured in the same matter, followed by an IR clean-out at 280°C. The luminescence signal was detected through a Schott BG39/Corning 7–59 filter combination. For each sample, 12 aliquots were measured, and the mean De was calculated. The signal collected during the initial 1.6 s of stimulation minus a background from the last 40 s was used for calculation. All aliquots passed the rejection criteria (recycling ratio within 10%, test dose error within 10%, signal more than 3σ above background). Dose recovery tests were conducted in order to test whether a given dose (prior to any heating) can be accurately recovered. Three aliquots per sample were bleached for 4 h in a Hönle SOL2 and then given a dose of 16 Gy (test dose 2.5 Gy) prior to measurement. For all samples except 143080, given doses were recovered within 10% of unity, while for sample 143080, the recovery was only within 20% of unity.
As feldspar may suffer from anomalous fading (Wintle, 1973), which would result in an age underestimate, the fading rate (g-value) was measured on six aliquots per sample following Auclair et al. (2003). The same settings as for De determinations were used, and both several prompt measurements and delays up to 10 h were included. The fading correction is based on Huntley and Lamothe (2001).
In order to determine the dose rate, the radionuclides (Table 3) were measured using high-resolution gamma-spectrometry (Murray et al., 1987). The radionuclide concentrations were converted into dose rates following Guérin et al. (2011), and the cosmic dose contribution was added (Prescott and Hutton, 1994). An internal potassium concentration of 12 ± 0.5% was assumed.
Results
Aeolian deposits and landforms
Both small (<50 cm height) and large (up to 2 m height) longitudinal dunes are particularly common in the transition zone from the glacial outwash plain to the dunefields (next to profile D1, Figure 1b). The areas between these vegetated longitudinal dunes have no vegetative cover. In addition, dome-shaped and barchan-like dunes are present in the dunefields (Figure 2d); these become higher (>2 m) and larger with increasing distance from the glacial outwash plain. Aeolian sand ripples (e.g. Anderson, 1987; Yizhaq et al., 2004) are common both between and leeward of dunes, where steep sand ridges of several metres length and width were found: These sand ridges are characterised by the absence of vegetation (Figure 2c and d).
The depths of the aeolian sand sheet (Figure 1b) strongly depend on topographical features and the distance from the ice margin. Greater depths of 50 cm or even >100 cm (Table S1, available online) are found on wind-protected sites, for example, in depressions and on leeward sides of moraines.
Deflation areas (Figure 1b) are widespread in the entire Umimmalissuaq valley and are mainly present on S-SE facing slopes or on crests and S-SE facing parts of moraines (Table S2, available online). These often oval-shaped aeolian blow-outs are characterised by sparse or absent vegetative cover and cut deep into the aeolian sand sheet. Often, the underlying moraine material or bedrock is exposed by wind erosion. The size of deflation areas ranges from a few to hundreds of metres in width and length, as well as their depth ranges from around 1 m next to the present dunefields (e.g. deflation area 13; Table S2, available online; Figure 1b) to around 30 cm with increasing distance from the ice margin (e.g. 7, 9; Table S2, available online; Figure 1b).
Sedimentary units and grain size distribution
All soil profiles in the large dunefield (represented by D1–D3, Figure 1b) show alternating sedimentary units of humus-free and humus-rich sediments. Buried humic palaeosols (Figure 3a: 1e–1g; Figure 3b: 2e–2h) can be taken as marker horizons dividing the profiles into an upper and a lower layer. The palaeosols are developed in the lower layer consisting mainly of fine sand and coarse silt (Figure 3a and b; for definition and contents of grain size fractions, see Table S1, available online). According to FAO (2006), the main texture of palaeosols is silt loam, sometimes sandy loam. The morphology of palaeosols visible in Figure 3c and d is characterised by a continuous horizontal to subhorizontal alternating stratification of buried Ah and C horizons with aeolian sand and silt. The centimetre to decimetre thick darker bands (Ah horizons) indicate organic matter accumulation, which are separated by millimetre to centimetre thick lighter bands (C horizons) of the same soil texture (mostly silt loam). These bands feature a non-horizontal structure perturbed by cryoturbational processes (cf. Figure 3a–d). Palaeosols are covered by alternating bands (centimetre to decimetre) consisting of primarily coarse, medium and fine sand (upper layer; Figure 3a–d). The main texture in the upper layer is loamy coarse sand, but also sand is common, particularly in the uppermost bands. The clay content of <5 wt% is negligible. In general, dune profiles show an abrupt decline in coarse and medium sand and an increase in fine sand and silt content at the transition from upper to lower layer (Figure 3a and b), reaching up to 64 wt% silt in profile D3.
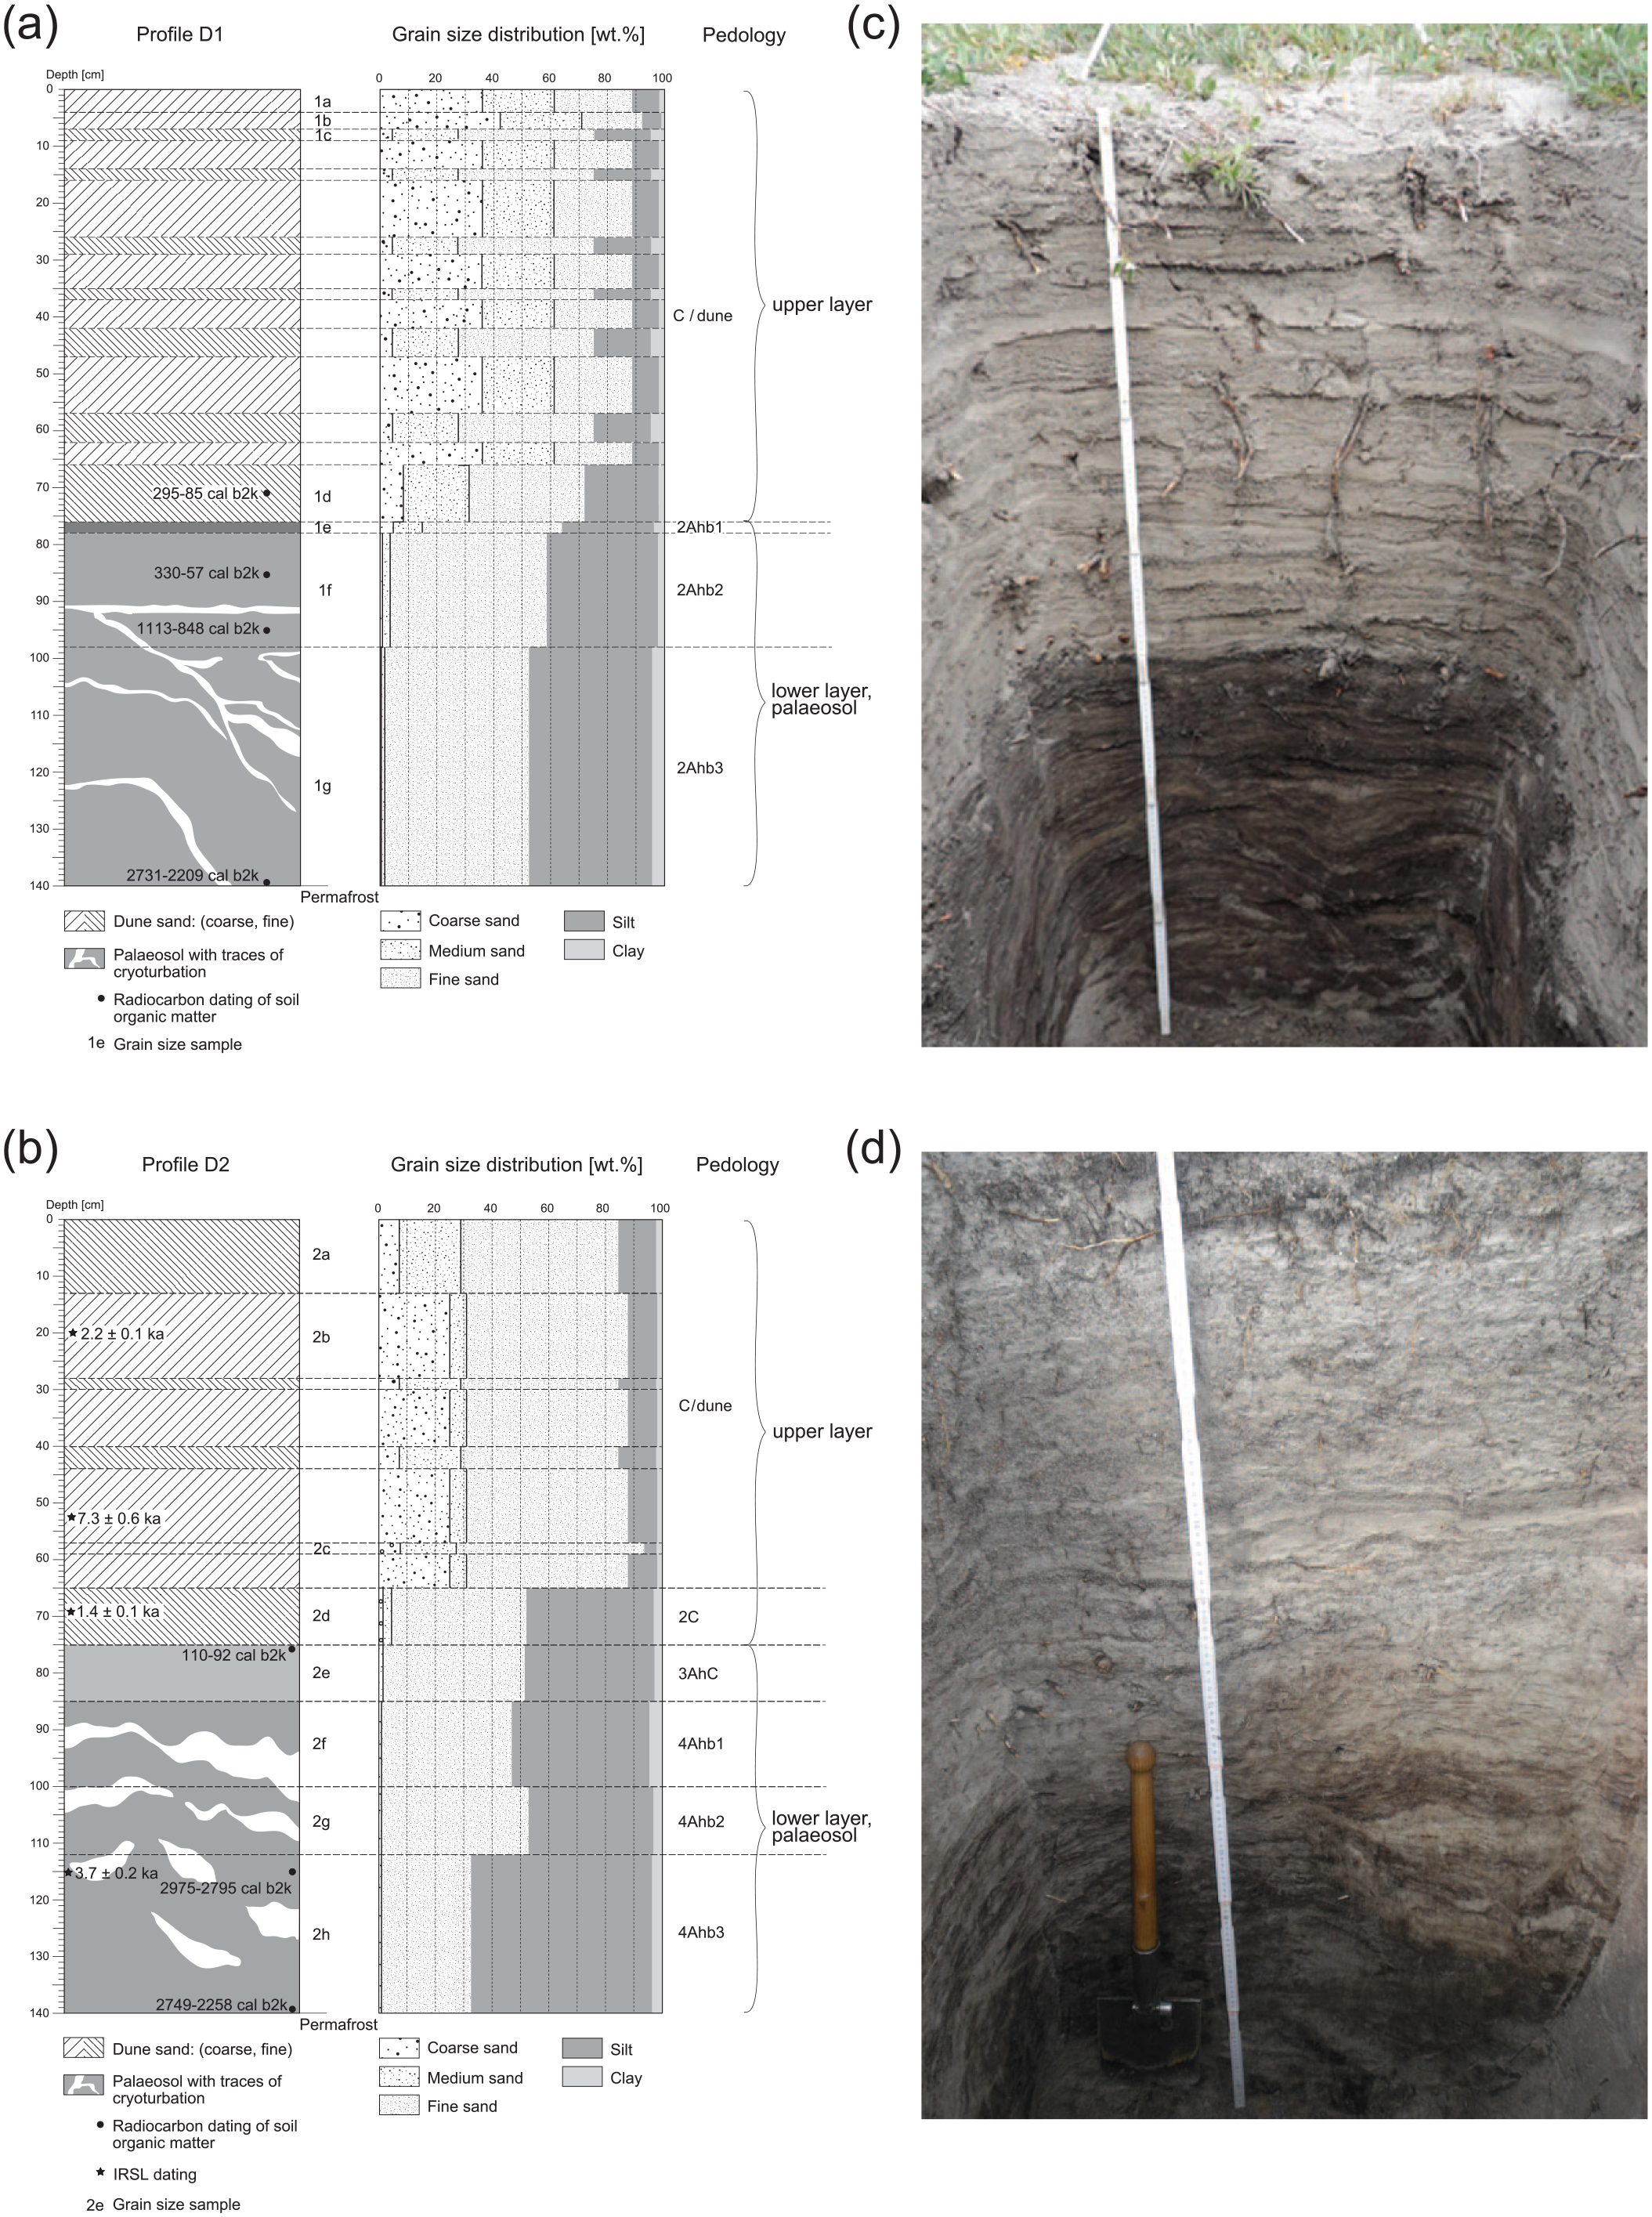
Dune profiles D1 and D2 (for location, see Figure 1b) showing buried humic palaeosols and overlying dune sands. (a) and (b) Profile sketches of D1 and D2 with AMS 14C data of soil organic matter, IRSL data, grain size distribution and pedology. For unmarked bands, a soil texture hand test was done in field. The darker the palaeosol, the higher the amount of soil organic matter. In both profiles, permafrost was detected below 140 cm. (c) and (d) Photos of profiles D1 and D2 showing palaeosols (lower layer) and overlying dune sands (upper layer). Traces of cryoturbation are present in both palaeosols.
The main texture of the aeolian sand sheet (Figure 1b), represented by cross-sections 1–4, is silt loam: silt and sand contents range between 25 and 75 wt% (Table S1, available online). Parts of the lower layer of the aeolian sand sheet reach close to 100% sand, however (Figure 4a and d). Clay content with a mean of 4 wt% is negligible.
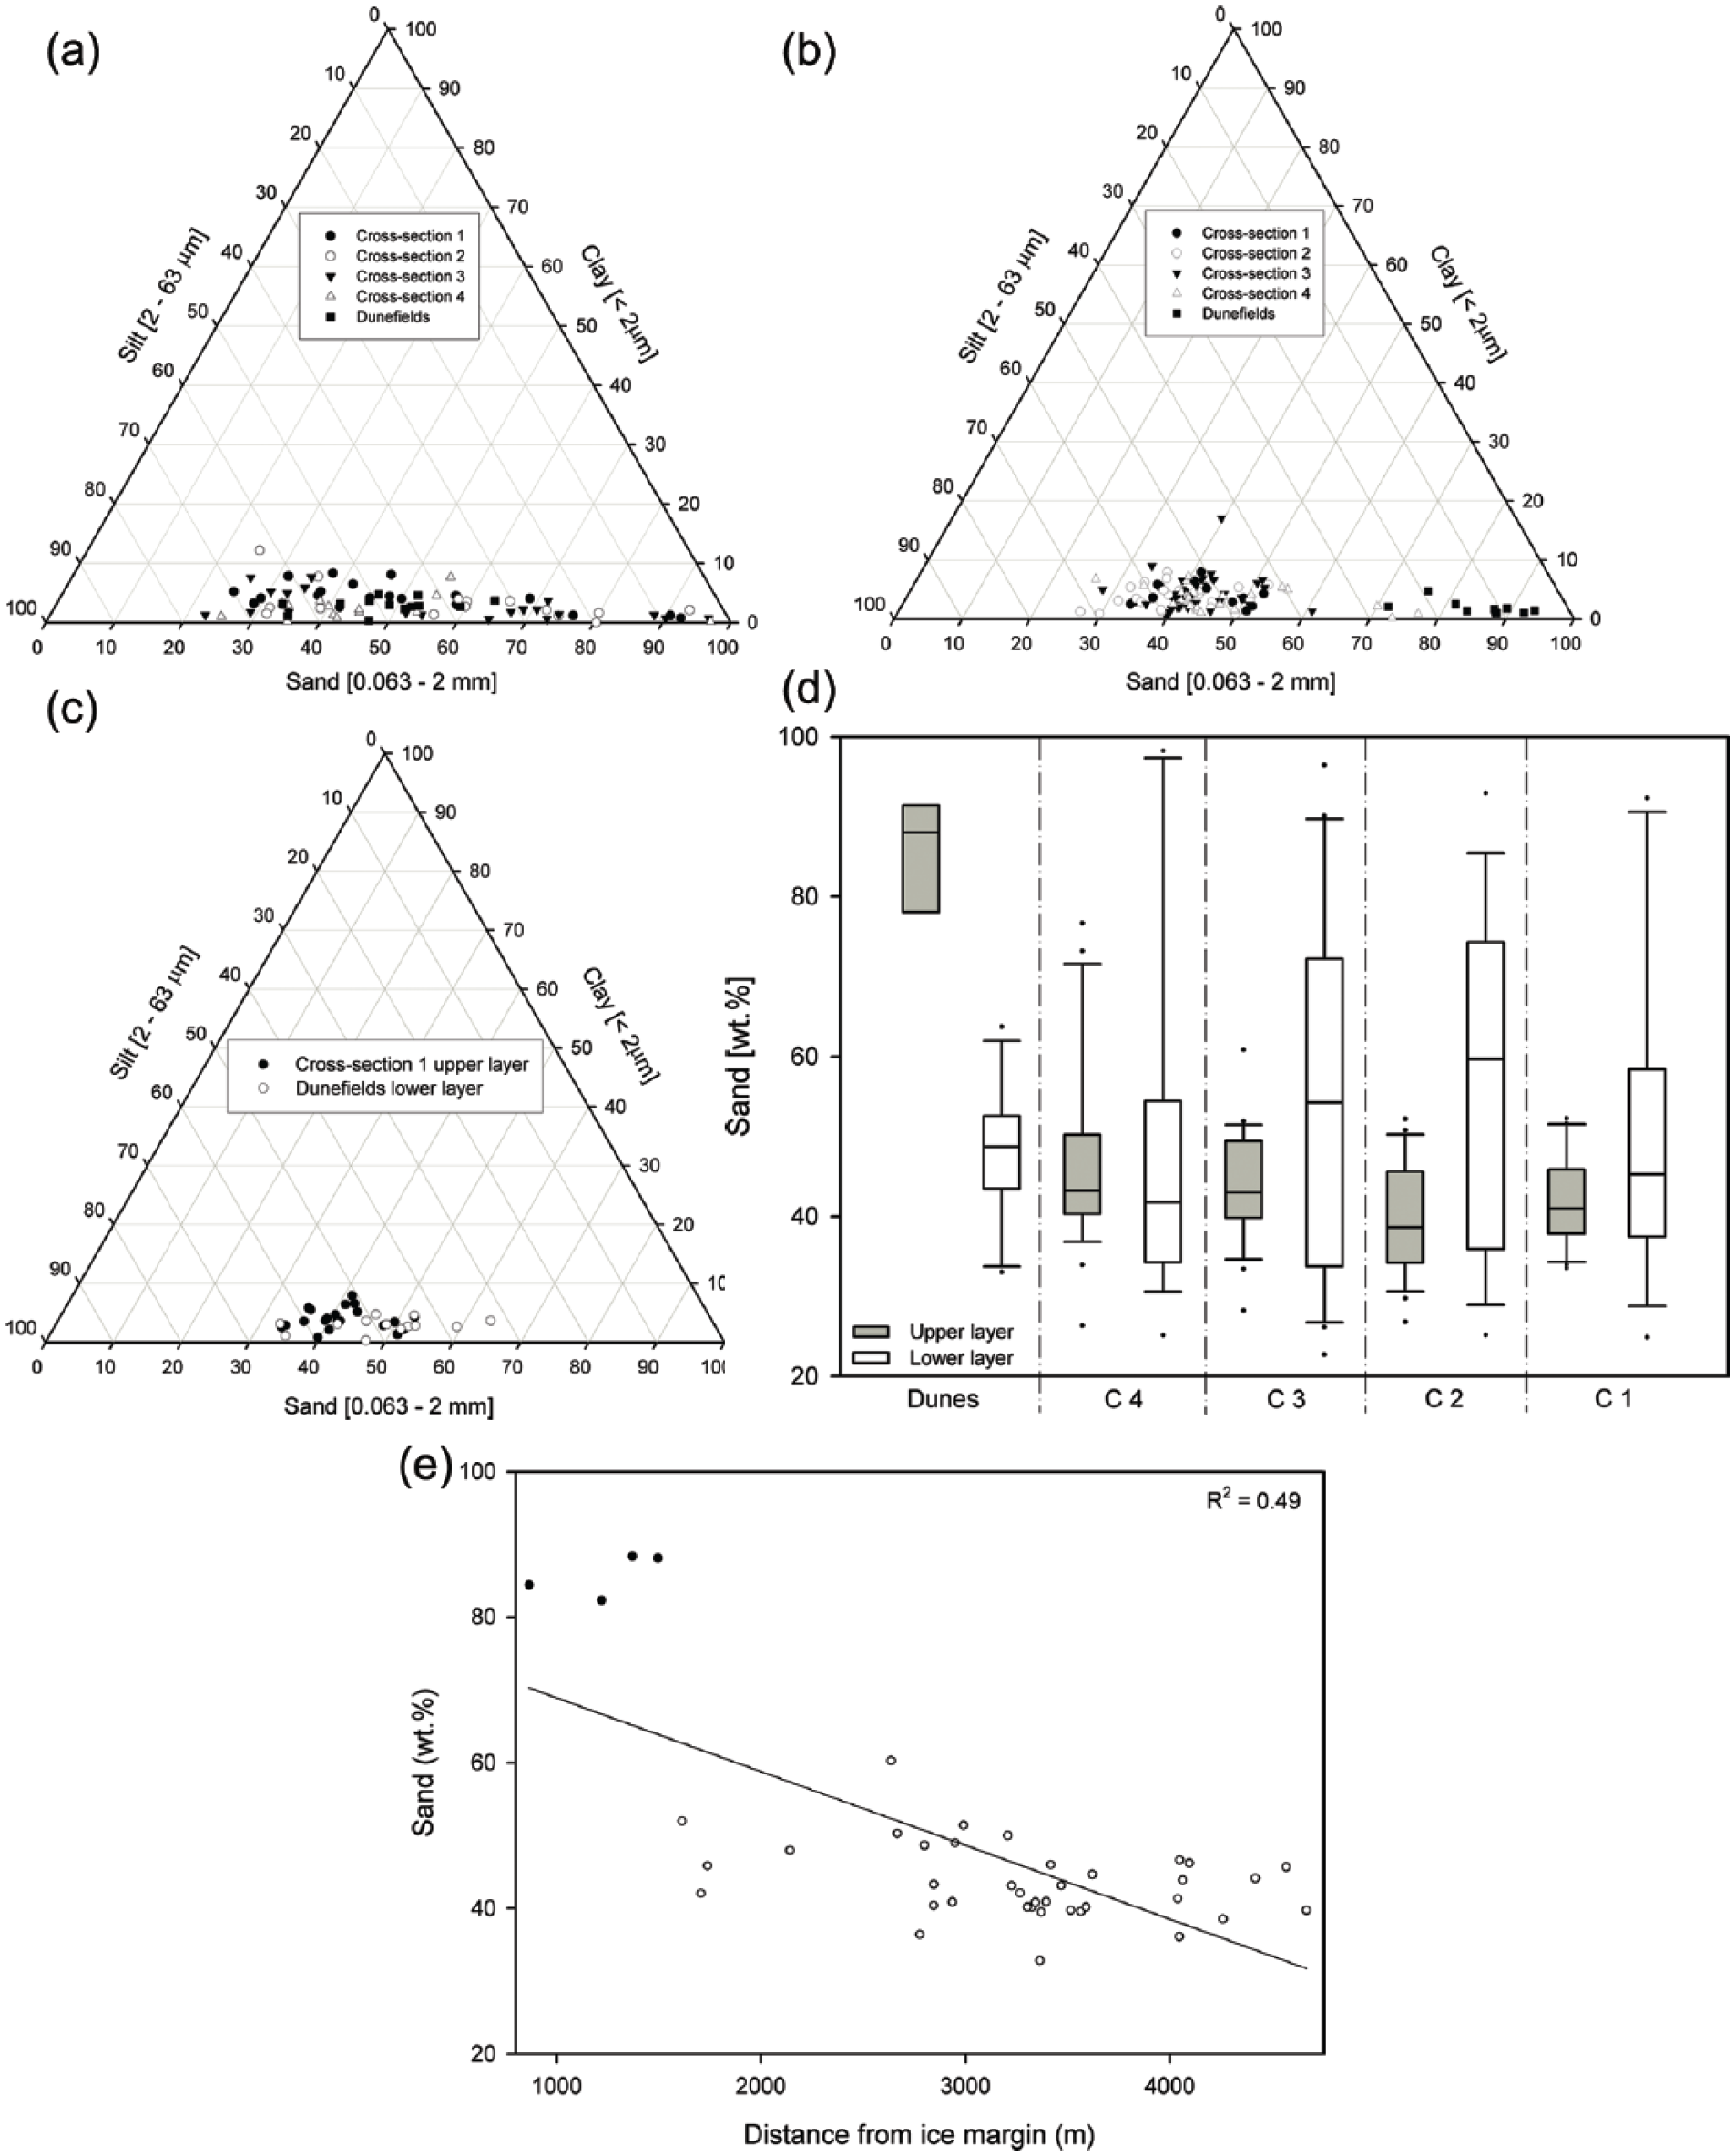
(a), (b) and (c) Soil texture ternary diagrams (data shown in wt%). (a) Lower layer of cross-sections 1–4 compared with lower layer of dunefields. Dune profiles show, relatively fine, the sampling points from cross-section 1–4 partly coarse grain sizes. (b) Upper layer of cross-sections 1–4 compared with the upper layer of dunefields. Highest sand contents, particularly in both coarse and medium sand range, were found in the dunefields. Cross-section 4 has higher contents of sandy loam compared with cross-sections 1–3. (c) Lower layer of dunefields compared with the upper layer of cross-section 1. Note that grain sizes from the lower layer of dune profiles are in the same range as from the upper layer of cross-section 1. (d) Variability of sand content (wt%) in the upper layer (UL) and lower layer (LL) of dune sediments (Dunes) and cross-sections 1–4 (C1, C2, C3, C4). (e) Mean sand content (wt%) in the upper layer of dune sediments (filled dots) and cross-sections 1–4 (blank dots) with increasing distance (m) from the ice margin.
The majority of sampling points from cross-sections 1–3 show finer grain sizes in the upper layer (mostly silt loam; Table 1, Figure 4b and d) and coarser grain sizes in the lower layer (mostly sandy loam, partly sand; Table 1, Figure 4a and d), whereas cross-section 4 is still more affected by coarser grain sizes in the upper layer (partly loamy coarse sand; Table 1, Figure 4b and d). Within each cross-section, the variability of grain sizes is very heterogeneous and is greater than between the respective cross-sections. Hereby, the variability of grain sizes in the upper layer of the cross-sections is distinctly lower and more homogeneous compared with the lower layer (Table 1, Figure 4d).
Variability of grain sizes (data shown in wt%) in dune sediments and the respective cross-sections.
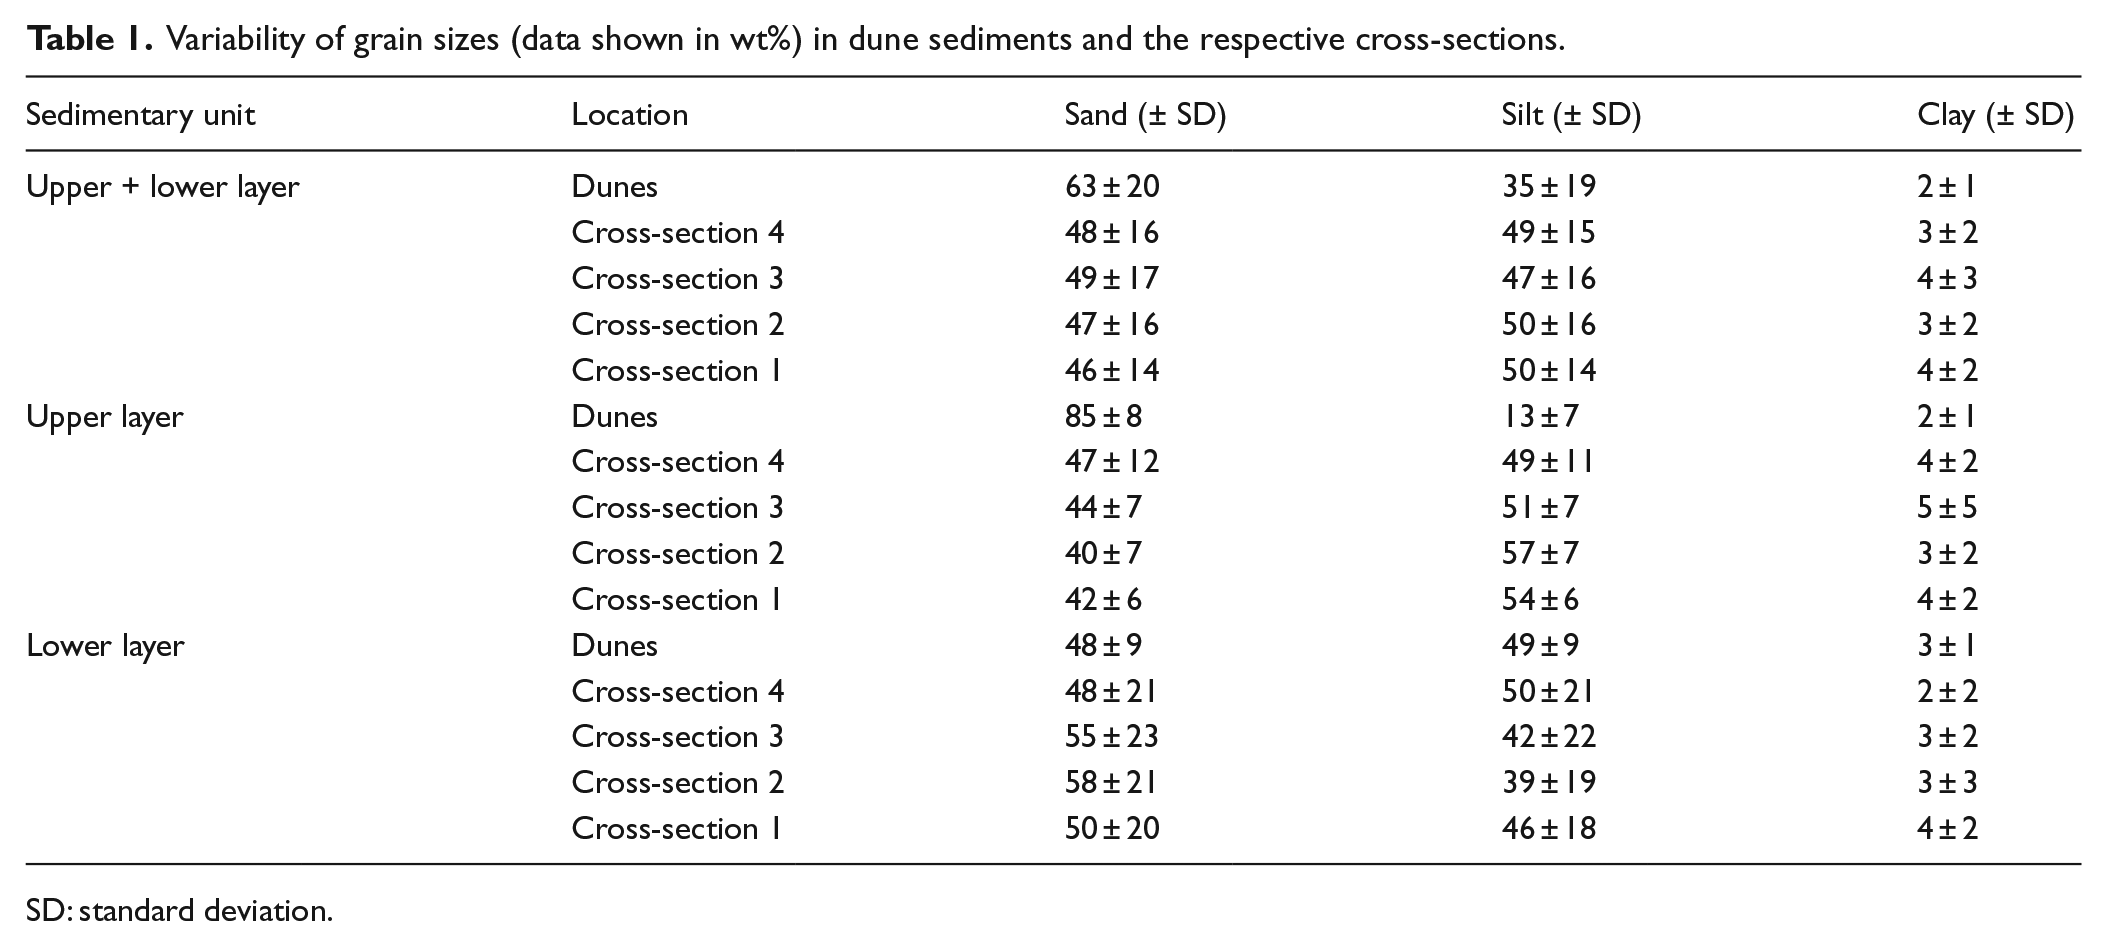
SD: standard deviation.
In general, sand contents significantly decrease with increasing distance from the ice margin (Pearson r = −0.29, p < 0.001), whereas silt contents increase (r = 0.27, p < 0.001). This is even more pronounced in the upper layers of dune profiles and sampling points (sand: r = −0.69, p < 0.001; silt: r = 0.68, p < 0.001; Figure 4e). However, the lower layers do not show a significant decline in grain sizes with increasing distance from the ice margin (sand: r = 0.09, p = 0.40; silt: r = −0.13, p = 0.25; Figure 4a and d).
Grain sizes in the lower layer of dune sediments (palaeosols) are similar to grain sizes in the upper layer of cross-sections (texture: silt loam; Figure 4c and d; Table 1). A Levene test revealed variance homogeneity between palaeosols (lower layer) and the upper layers of cross-sections 1–4 (F = 0.23, p = 0.92). Using analysis of variance (ANOVA) (F = 1.51, p = 0.20) and using a post hoc Tukey test, we found no significant differences between grain sizes of palaeosols and cross-section 1 (p = 0.54), cross-section 2 (p = 0.30), cross-section 3 (p = 0.94) and cross-section 4 (p = 0.99). The grain sizes in upper layers of cross-sections 1 and 2, and cross-sections 3 and 4, respectively, are similar.
AMS 14C ages
A summary of AMS 14C ages is given in Table 2. Soil organic matter from the palaeosol of profile D1 (Figure 3a) was dated to 330–57 cal. yr b2k at a depth of 85 cm (Erl-19002), to 1113–848 cal. yr b2k at 95 cm (Erl-16621), to 2731–2209 cal. yr b2k at 140 cm (Erl-19003). The palaeosol of profile D2 (Figure 3b) yields ages of 110–92 cal. yr b2k at 76 cm depth (Erl-16622), 2975–2795 cal. yr b2k at 115 cm depth (Erl-16623) and 2749–2258 cal. yr b2k at 140 cm depth (Erl-19004).
AMS 14C data and luminescence data of samples related to glacial, glaciofluvial and aeolian deposits in the Kangerlussuaq area, West Greenland, classified in the chronological context.

Samples taken from the cover sediments of the palaeosols and the transition zone between cover sediments and palaeosols show very young and imprecise ages (Erl-16619, Erl-16620, Erl-16622, Erl-19002), caused by organic matter, which has been developed during the atomic age since 1945.
Additionally, soil organic matter of buried palaeosols within cross-sections 1–4 was analysed. Sampling point 17 (Figures 1b and 5a) reveals an AMS 14C age of 5335–4919 cal. yr b2k (Erl-19000); this is so far the oldest age of soil organic matter from the valley bottom. A palaeosol from sampling point 33 (Figures 1b and 5c) has an AMS 14C age of 4876–4499 cal. yr b2k (Erl-16614). Soil organic matter from sampling point 24 (Figures 1b and 5b) was AMS 14C dated to 2975–2800 cal. yr b2k (Erl-19001).
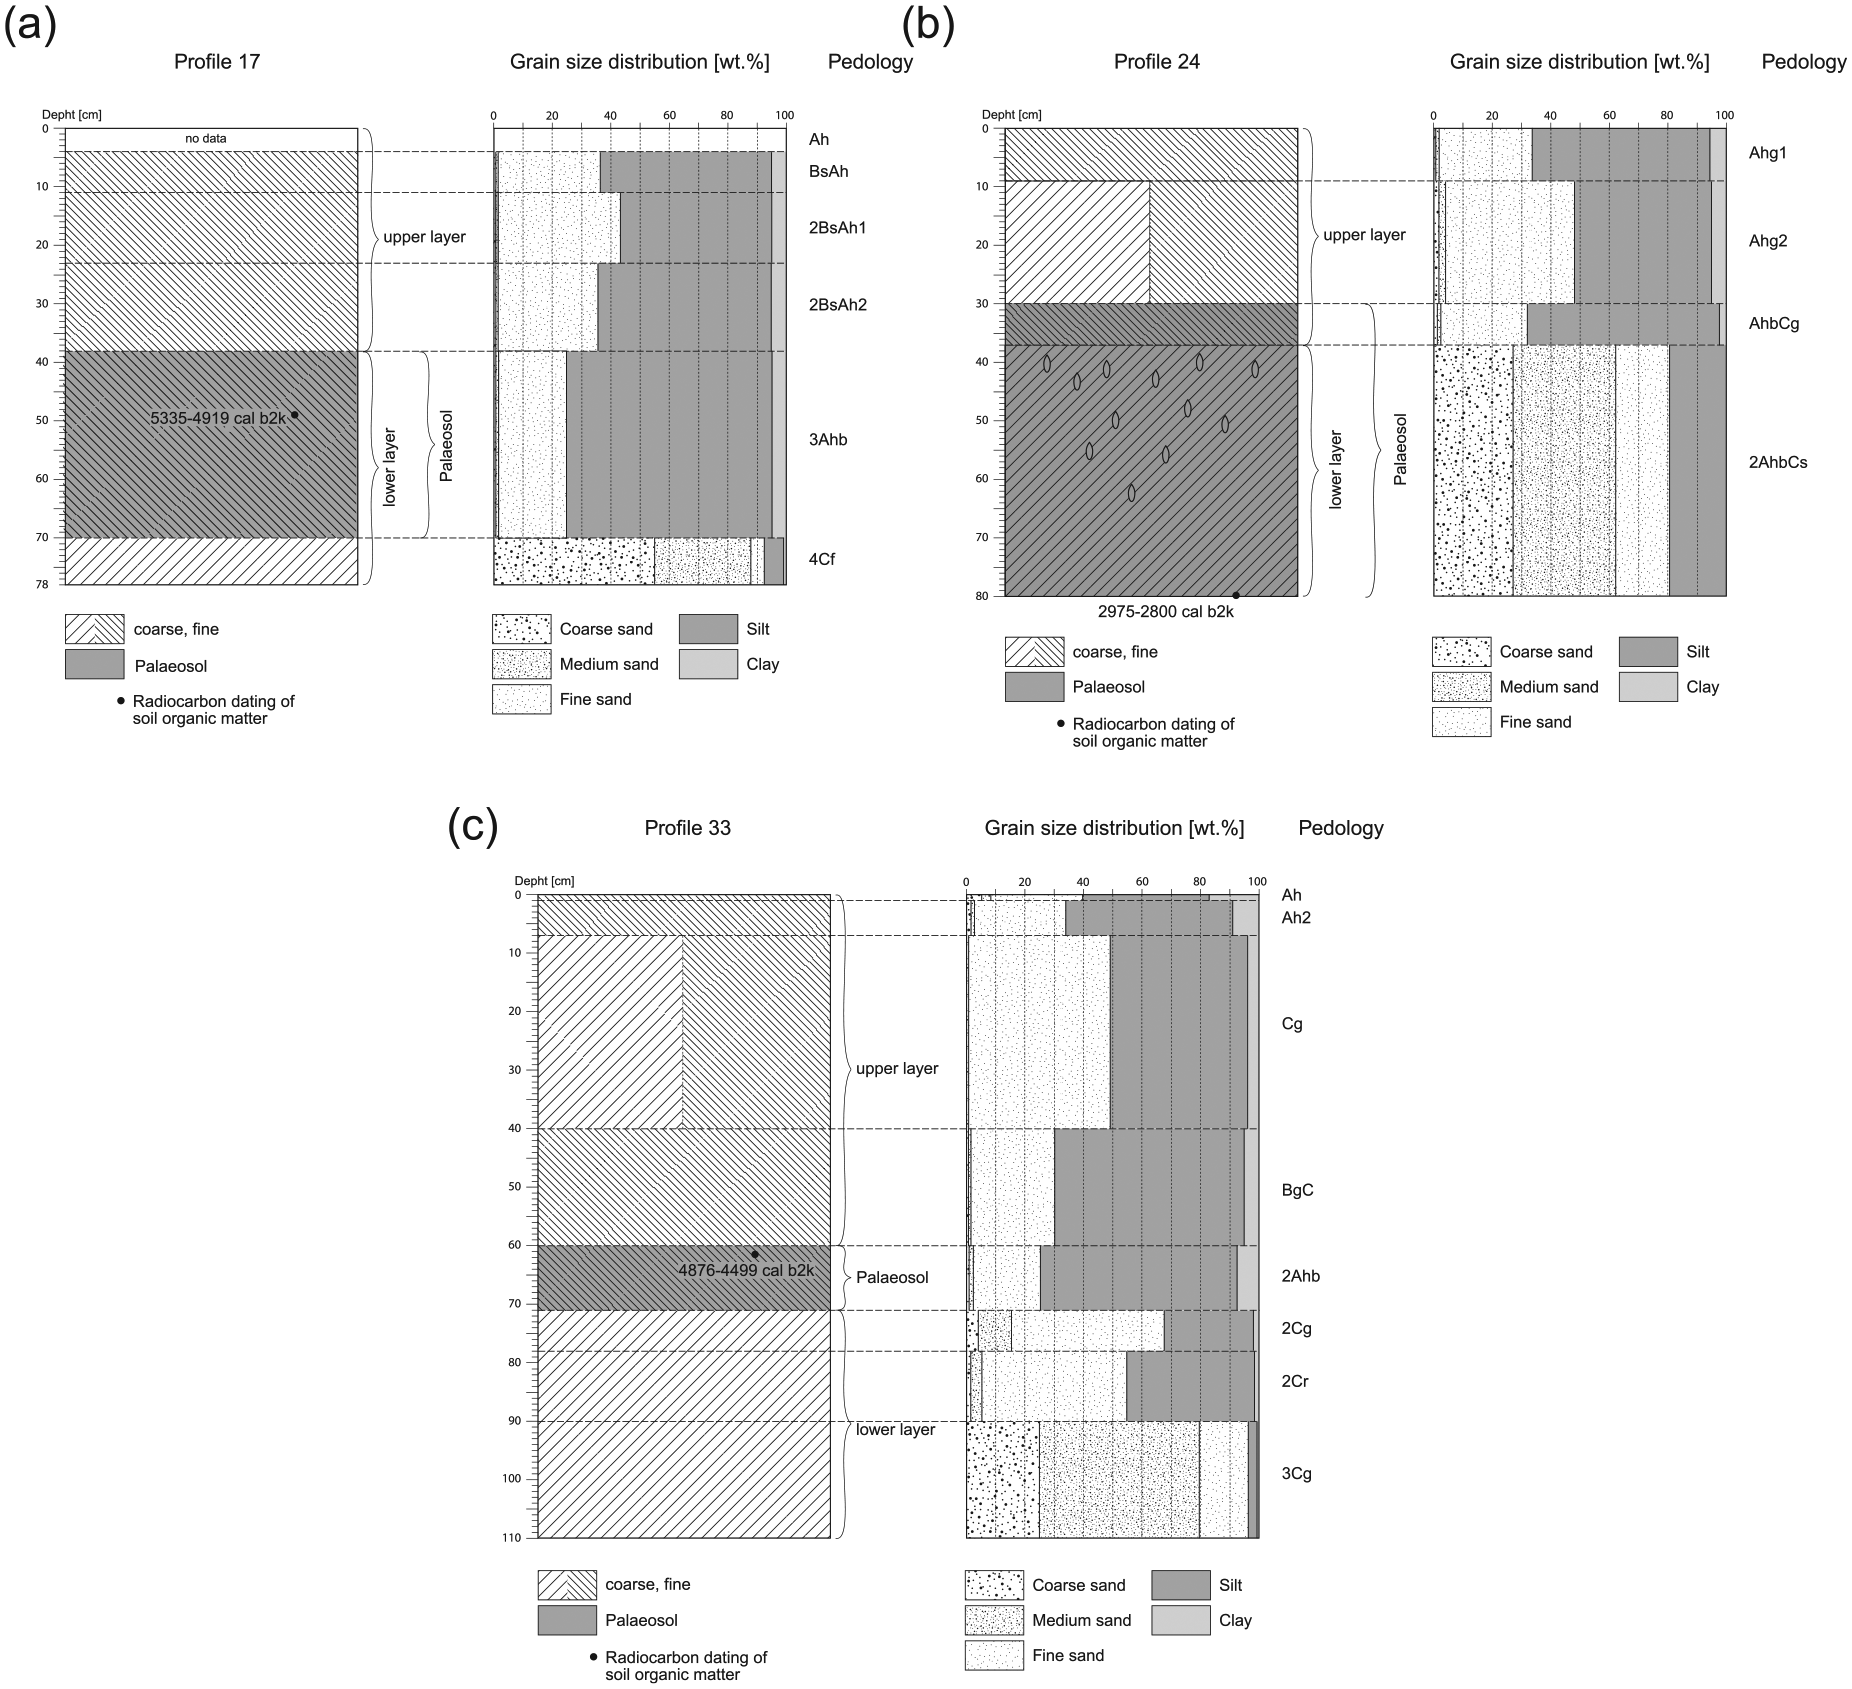
Selected soil profiles from cross-sections showing grain size distribution, pedology and AMS 14C data of soil organic matter: (a) Profile 17 (cross-section 1), (b) Profile 24 (cross-section 2) and (c) Profile 33 (cross-section 3). For location of soil profiles, see Figure 1b.
Luminescence ages
The total dose rates to feldspar taken from profile D2 vary between 2.04 ± 0.07 Gy/ka (sample 143081; cf. Table 3) and 2.37 ± 0.08 Gy/ka (sample 143078). The equivalent doses (De values) are more variable: The largest De of 12.8 ± 0.8 Gy was observed for sample 143079 (D2-53) and the smallest (2.4 ± 0.1 Gy) for sample 143080. The IRSL ages given are all fading-corrected; the g-values vary between 2.87 ± 0.03%/decade (143080) and 3.81 ± 0.17%/decade (143078). In palaeosol D2, the uppermost sample (20 cm depth) was dated to 2.2 ± 0.1 ka, while the sample at a depth of 53 cm (143079) has an IRSL age of 7.3 ± 0.6 ka. Sample 143080, just 16 cm below sample 143079, was dated to 1.4 ± 0.1 ka, while the lowermost sample (143081) at a depth of 115 cm resulted in 3.7 ± 0.2 ka.
Luminescence dating information, including radionuclide concentrations, water contents, dose rates (Dr), equivalent doses (De), g-values (i.e. fading rates) and (fading-corrected) ages. Preference is given to the fading-corrected ages. See text for details. n = number of aliquots measured to obtain average De values.

SE: standard error.
It is apparent that age inversions are present, that is, the upper horizons show older ages than the lower ones. A possible cause for this might be age overestimation of the upper layers because of incomplete luminescence signal re-setting while the grains were being transported. The higher sand content of these two samples implies a shorter distance to the ice margin, which can result in poorer signal re-setting (e.g. Alexanderson and Murray, 2012). Furthermore, it is possible that the material was mainly transported during winter months; in this case, the sand will not have seen much daylight prior to its deposition. However, it is also possible that the ages of the lower samples are erroneous (dose recovery of sample 143080 was poor). A greater set of samples will be needed to investigate these issues in detail. Furthermore, as the quartz OSL did not give any results to compare the IRSL ages with, we reject the OSL data for any further discussion but do point out that there is partial agreement with the AMS 14C data (see below).
Discussion
Linking aeolian processes and palaeosols
The main requirements for aeolian transport of sand and silt across the Umimmalissuaq valley are (1) sufficient supply of coarse-grained and fine-grained material from the glacial outwash plain and (2) the frequently blowing katabatic winds combined with (3) the distinctive arid climate conditions at the ice margin (cf. Bullard and Austin, 2011).
Coarse-grained material (predominantly medium sand and coarse sand, upper layer; Figures 3a, b and 4b; Table S1, available online) is deposited predominantly in the active dunefields (Figure 1b) north, northwest and west of the glacial outwash plain. Scholz and Grottenthaler (1988) propose that, with the exception of active dunefields, no recent accumulation of aeolian material takes place in the study area. However, dust clouds have been observed to rise up to several hundreds of metres in the study area during summer. Even ice-proximal areas are covered by a thin layer of fine sand and silt after such events (cf. German, 1971; Willemse et al., 2003). This may also currently provide durable (if combined with rainfall) sedimentation of fine sand and silt (upper layer of cross-sections in Figure 4b, d and e) in most parts of the Umimmalissuaq valley. Most likely, these events are stronger in winter because of a higher wind drift potential during this time of the year (e.g. Bullard and Austin, 2011; Willemse, 2000), and the outwash-source zone is dry and unprotected against aeolian erosion (Bullard and Austin, 2011; Dijkmans, 1990; Dijkmans and Törnqvist, 1991).
Deflation areas are widespread in the study area (Figure 1b), also in active dunefields. These deflation areas occur in the older aeolian sand sheet consisting of fine material, and hereby predominantly on wind-exposed S-SE slopes and moraines with depths up to 1 m and areas from a few up to hundreds of square metres (Table S2, available online). Similarly, Dijkmans and Törnqvist (1991) describe a SE-NW orientation of these often bowl-shaped or oval-shaped aeolian blow-outs, sometimes up to 1 m deep with diameters of up to several tens of metres (cf. French, 2007). These frequently occurring blow-outs imply reworking of previously deposited sand and silt by wind, and wind erosion as the prevailing aeolian process outside the dunefields.
Within the active dunefields 1–2 km from the ice margin (Figure 1b), humic palaeosols (lower layer, consisting of silt loam, Figure 3a and b) are developed in older sand sheets and preserved by deposition of the dune sands above (upper layer, consisting of loamy sand, Figure 3a and b). Generally, (1) the proportion of finer grain sizes (clay, silt) in the dunefields with <15 wt% is very small, and (2) the underlying cumulic palaeosols with finer material have no layers with coarser material comparable with the overlying dunes. According to Ten Brink (1975) the palaeosols are located within the Ørkendalen moraine system (Figure 1b). Hence, the lower layer, in which the palaeosols have formed, must have accumulated after the formation of the Ørkendalen moraines since the lower layer is clearly not of glacial origin. At that time, the ice had disappeared and a decreasing influence of the strong and dry katabatic winds affected moisture conditions and thus the availability of sediments, soil formation and correspondingly vegetation in the valley. Furthermore, the dominance of pedogenesis after the formation of the Ørkendalen moraines reflects a balance between pedogenesis and the sedimentation rate, that is, the cumulic palaeosols (with grain sizes predominantly of fine sand and coarse silt, Figure 3a–d) of more than 60 cm thickness represent a phase with lower intensity of aeolian activity and synsedimentary pedogenesis. During that period of time, the sedimentation rate generally and particularly of coarse-grained material (sand) decreased which favoured pedogenic processes. However, thin lighter layers between thicker organic-rich layers within the buried Ah horizons suggest intermittent sedimentation events during soil formation. These observations indicate that there was an episodically easily available source of fine to medium sand in the source area, and quickly colonising sedges and other vascular plants in the sedimentation area. Thus, pedogenesis became more effective during periods with decreasing sedimentation rates and vice versa. It is important to notice that the soil formation after the formation of the Ørkendalen moraines does not reflect an on-off system of aeolian sedimentation. Instead, alternating periods of enhanced and weaker soil formation occurred depending on the sedimentation rate. Cryoturbation features in the palaeosols show that the soil horizons of palaeosols D1 and D2 (Figure 3a–d) were partly subject to cryoturbation and alternating of frost-thaw processes during the period of soil formation. This has to be also taken into account when interpreting any dating results.
Since the ages from the lower boundaries of the palaeosols above the permafrost date back to 2731–2209 cal. yr b2k (D1, 140 cm, Figure 3a) and 2749–2258 cal. yr b2k (D2, 140 cm, Figure 3b), and the ages of the upper parts of the palaeosols date back to 330–57 cal. yr b2k (D1, 85 cm, Figure 3a) and 110–92 cal. yr b2k (D2, 76 cm, Figure 3b), a period of at least 2400 years of relatively stable conditions related to pedogenesis is very likely. We found with 2975–2795 cal. yr b2k at 115 cm depth of profile D2 an older age than at 140 cm depth (Figure 3b). This inversion of ages may reflect a rejuvenation effect, which is likely caused by an accumulation of younger humic substances above the permafrost table. A reason for that may be also cryoturbation processes, which led to relocation of soil organic matter (Bockheim, 2007).
A sample from the oldest parts of a palaeosol in the Umimmalissuaq valley yielded a relatively young Thermoluminescence (TL) age indicating the onset of soil formation after the Ørkendalen period around 1380–980 ka (Scholz and Grottenthaler, 1988). Although little information is provided on the TL data, one has to assume an age underestimate as anomalous fading has not been taken into account at that time. Ages from palaeosols in Sandflugtdalen indicate a distinct earlier beginning of soil formation around 4680–4490 cal. yr b2k (UtC-2034, Van Tatenhove et al., 1996). Our data for the start of soil formation are similar to 3869–3123 cal. yr b2k (UtC-5624; Willemse et al., 2003), to 3442–3263 cal. yr b2k (GrN-14655; Dijkmans and Törnqvist, 1991) and to 3.19–2.67 ka (UIC-1556) and 3.16–2.69 ka (UIC-1558; Forman et al., 2007; all from Sandflugtdalen and Ørkendalen, respectively). Two buried organic layers in Sandflugtdalen, which indicate the onset of soil formation, reveal younger ages of 1941–1236 cal. yr b2k and 1866–1232 cal. yr b2k (Ozols, 2003). The results from the Umimmalissuaq valley indicate an earlier start of soil formation than discussed above. This may be confirmed in the future since the base of the organic-rich permafrost was not reached in profiles D1 and D2 in 2011. The lowermost AMS 14C ages are from top of the permafrost table.
In the study area, aeolian activity intensified after around 300 cal. yr b2k (Erl-16620, Erl-19002, Table 2), and medium to coarse sand (Figure 3a and b) was transported from a nearby available source forming dunefields (upper layer), which cover the palaeosols in the foreland of the active ice margin. This suggests a markedly increasing sedimentation rate of coarse-grained material. Most likely, these processes were caused by a close ice margin followed by stronger dry katabatic winds and changes in sediment supply when the formation of the dunefields began. This would explain also the distinct coarser grain sizes compared with the lower layer. The more or less continuous redistribution (erosion and accumulation) of predominantly coarse-grained sand by intensive and prevailing aeolian activity in the area of the dunefields limited further soil formation since then. Despite landscape heterogeneity in the study area, only the outwash plain and the adjacent terminal moraines (ice-cored moraines) can be the present sediment source (Figure 1b).
All these findings lead us to the assumption that the sedimentation of the coarse material in the dunefields is connected to an advancing ice margin and its sandur area (if present), representing the source of the coarse material. This means additionally that a period of time with predominant deposition of fine material is most likely related to a more easterly situated ice margin because of the lack of coarse material in the lower layer of dunefields.
Compared with our results, a (re)accumulation of aeolian sand after the period of soil formation in Ørkendalen and Sandflugtdalen is assumed to have started earlier around 595–550 cal. yr b2k (UtC-5619; Willemse et al., 2003) and 735–560 cal. yr b2k (GrN-14651; Dijkmans and Törnqvist, 1991; for further data, see Table 2). The different timings of the onset of coarser wind-blown sediment accumulation may be interpreted as related to the ice margin position; this may indicate indicate that the late Holocene advance of the ice reached the present ice margin in the Umimmalissuaq valley later than in northerly adjacent valleys.
Implications for the deglaciation history of the Umimmalissuaq valley
The ice margin in West Greenland in general is assumed to have reached its present position already around 6000 yr BP, followed by a minimum extent behind the present ice margin at around 4000 yr BP during the Holocene thermal maximum (Simpson et al., 2009; Ten Brink and Weidick, 1974). Since that time, the ice sheet advanced again to its recent limits and further, resulting in younger moraine deposits (e.g. Ørkendalen, Figure 1b). Several different data exist for the Ørkendalen moraine system in West Greenland: it has been dated to 700–300 BP (Ten Brink, 1975; UW-180, Table 2) and to 2.5–1.5 ka (Scholz and Grottenthaler, 1988). In great contrast, other studies have dated the Ørkendalen moraine system to 6.8 ± 0.3 ka by 10Be (Levy et al., 2012) and to 6.8 ± 0.3 cal. ka b2k (UtC-1987, UtC-1990; Van Tatenhove et al., 1996; Table 2).
Our AMS 14C data from soil organic matter of the overlying palaeosols in the Umimmalissuaq valley yielded a minimum age of 2749–2258 cal. yr b2k (Erl-19004, Table 2) for the Ørkendalen moraines, most likely even older (cf. 2975–2795 cal. yr b2k, Erl-16623). Our data are in line with the proposed 3450 cal. yr b2k (UtC-5624; Willemse et al., 2003) and 3350 cal. yr b2k (GrN-14655; Dijkmans and Törnqvist, 1991) ages for the recession of the ice margin in Sandflugtdalen and Ørkendalen. After development of the Ørkendalen moraines, the inland ice melted again at its margin and retreated beyond its present limit. Previous studies proposed a former recession of the ice margin in West Greenland after formation of the Ørkendalen moraines of more than 10 km (Scholz and Grottenthaler, 1988; Weidick, 1985), or even 16 km (Van Tatenhove et al., 1996). The changing distance from the ice margin to the outwash-source zone after formation of the Ørkendalen moraines affected the formation of soils, aeolian sand sheets and dunefields in the study area (cf. Willemse et al., 2003). Since grain sizes decrease significantly with increasing distance from the ice margin (Figure 4e), and since grain sizes and their variability within the upper layer of cross-section 1 (silt contents: 54 ± 6 wt%; Table 1, Figure 4c and d) 4–5 km west of the present ice margin are comparable with palaeosols covered by coarse-grained dunes (silt contents: 49 ± 9 wt%; Table 1, Figure 4c and d), we propose a transport distance of the fine aeolian sediments, in which the palaeosols have formed <4 km from inboard of the present ice margin.
AMS 14C ages of 5335–4919 cal. yr b2k (sampling point 17), 4876–4499 cal. yr b2k (33) and 2975–2800 cal. yr b2k (24) (Figure 1b, Table 2) indicate soil formation also before 2749–2258 cal. yr b2k (Erl-19004; Table 2). These palaeosols are situated between 4 and 5 km away from the present ice margin. All sampling points are located within the Umîvît/Keglen moraines (according to Ten Brink, 1975). This further implies a recession of the ice margin between the Umîvît/Keglen stage (dated to 7300 cal. yr b2k, UtC-1987, UtC-1990, after Van Tatenhove et al., 1996, Table 2) and the Ørkendalen stage at least around 2700 cal. yr b2k (Erl-19004; Table 2). As a consequence of lacking additional luminescence or 10Be ages from the glacial sediments in the Umimmalissuaq valley, the precise boundary between Umîvît/Keglen and Ørkendalen moraines is not clear.
Conclusion
During the Holocene, the Umimmalissuaq valley has strongly been influenced by aeolian activities. This valley has a characteristic east-west orientation like numerous other valleys in West Greenland, and herewith, the observed phenomena can be generally taken as representative for other valleys close to the ice margin in West Greenland.
Currently, deflation − predominantly caused by easterly katabatic winds − redistributes aeolian sand sheets (silt loam) further west and forms active dunefields (consisting of loamy coarse sand and sand). Active dunefields occur particularly on south-facing slopes north, northwest and west to the glacial outwash plain within around 2 km of the present ice margin. The grain size distribution data and AMS 14C data of the soils in the Umimmalissuaq valley lead to the following findings:
Aeolian activity intensified after around 300 cal. yr b2k and the still active dunefields with coarse and medium sand accumulation (upper layer) developed. Thus, we infer the ice margin must have reached its present position around 300 cal. yr b2k.
Palaeosols with humic A horizons located within the Ørkendalen moraine system are developed in fine-grained aeolian sediment (silt loam – lower layer). They are covered by coarse-grained aeolian bands (loamy coarse sand to sand – upper layer). The lower layer, in which the palaeosols have formed, shows grain sizes comparable with aeolian sand sheets (upper layer), which are currently formed at about 4 km from the ice margin. Thus, we assume a transport distance of the fine aeolian sediments of the lower layer – buried under the present dunefield next to the ice margin – of at least 4 km from inboard of the present ice margin.
AMS 14C dating of soil organic matter of these buried palaeosols yielded a minimum age of 2749–2258 cal. yr b2k for the start of soil formation. Since traces of moraine material overlying the palaeosols could not be detected, this particular area must have been ice-free since that time. A potential earlier start of soil formation may be confirmed in the future since the base of the organic-rich permafrost was not reached in profiles D1 and D2 in 2011.
According to the youngest AMS 14C ages of the buried palaeosols, a stable period of at least 2400 years can be inferred during the late Holocene, in which the area was characterised by pedogenesis and low intensity of aeolian activity, but with constant input of fine sand and silt (lower layer).
Footnotes
Acknowledgements
The first author would also like to thank Christian Wolf and Jürgen Förth for their assistance during fieldwork and the great time in Greenland. The last author thanks all students who helped in the field, and Frank Baumann, Joachim Eberle, Jessica Henkner and Thomas Scholten for fruitful discussions. We are grateful to Richard Szydlak for the support in preparing several figures.
Funding
This study was partly funded by DAAD (German Academic Exchange Service) and the Gesellschaft für Erd- und Völkerkunde in Stuttgart. Christine Thiel received funding from the German Research Foundation (DFG grant TH1651/1-1).