
Abstract
We present the results of sediment texture, δ13C values, TOC, TN, TOC/TN, and magnetic susceptibility (χlf) of a 1.54-m deep sediment trench recovered from the core monsoon zone (CMZ) of central India, to understand the paleovegetational history and Indian summer monsoon (ISM) variability during the Holocene. The lower δ13C values, TOC/TN ratio, and magnetic susceptibility (χlf) from ~11.4 to 9.5 ka BP suggest enhanced ISM intensity, which is well correlated with other available ISM records from both terrestrial as well as marine archives. A gradual stepwise expansion of C4 plants during ~8.1 and 6.3 ka BP, ~6.3 to 4.7 ka BP, and ~3.0 to 2.0 ka BP suggests a gradual weakening of ISM. The highest δ13C values (–18.7‰) recorded at ~2.0 ka BP indicate the dominance of C4 plants suggesting the weakest phase of ISM in the study area. The expansion of C3 plants from ~2.0 to 1.6 ka BP indicates a sudden increase in ISM intensity. Subsequently, three stages of enhanced ISM have been recorded between ~1.6 and 0.93 ka BP, ~0.76 and 0.42 ka BP, and ~0.28 ka BP to present.
Introduction
Indian summer monsoon (ISM) is the vital source of precipitation in India and contribute significantly to the Asian monsoon system and global climate. Thermodynamic atmospheric circulation governs the ISM and is characterized by strong seasonality in the wind direction (Ramage, 1971). By contributing over 80% of the total annual rainfall in India, ISM significantly influences agrarian-based Indian socio-economy. It further becomes important because the world’s one-third population resides in monsoon dominated regions and the monsoon dynamics determines their primary occupation (agriculture) (Gadgil and Kumar, 2006). Therefore, understanding the dynamics of the ISM is of utmost importance to improve the predictive capabilities of the future ISM variability. Unfortunately, the instrumental climatic records from the Indian subcontinent are very scattered and fragmentary and date back to 100–150 years only. Proxy records are therefore the only alternative tools to reconstruct millennial to decadal scale climatic changes. The paleoclimatic reconstructions will act as a baseline data for climate modelers to make model simulations for future climate predictions (Cai et al., 2010; Fleitmann et al., 2003; Gasse et al., 1996; Thompson et al., 1997). For paleoclimatic studies, lakes, ponds, swamps, speleothems, and wetlands are the best sites as they preserve the climatic signals (Ali et al., 2018; Cheng et al., 2016; Dykoski et al., 2005; Rajmanickam et al., 2016; Verschuren, 2003; Verschuren et al., 2000) Several studies have been carried out using the lake sediments (Anoop et al., 2013; Basu et al., 2017; Enzel et al., 1999; Ghosh et al., 2018; Prasad and Enzel, 2006; Sandeep et al., 2017; Sarkar et al., 2015) to determine ISM variability during the Holocene. However, high-resolution continental records of ISM variability from the core monsoon zone (CMZ), that is, central India, are colloquial.
Holocene paleoclimatic record from Godawari catchment, Indian peninsula, reveals that there is an increase in xerophytic vegetation (C4 plants) from ~4000 to 1700 years ago followed by the persistent presence of xerophytic plants in the CMZ. The detailed reconstruction of ISM variability from the Lonar lake sediments in central India, another CMZ site, shows the onset of intensified monsoon during early Holocene followed by two prolonged droughts between 4.6–3.9 and 2.0–0.6 ka BP (Menzel et al., 2014; Prasad et al., 2014). The δ13Cwax records from Lonar lake (CMZ) sediments by Sarkar et al. (2015) inferred a humid phase from 10.0–6.0 ka BP and initiation of dry phase from 6.0–4.0 ka BP. A multiproxy study from the Padauna Swamp, south-eastern Madhya Pradesh, India, infers warm and relatively less humid climate between 8.6 and 7.5 ka BP followed by the onset of a warm and humid climate between 7.5 and 6.2 ka BP. Afterwards, the climate continued to be more warm and humid up to 2.8 ka BP (Chauhan et al., 2013). They also showed that Sal dominated deciduous forests were established ~2.8 ka BP onward, which indicate the timely arrival of the SW monsoon in CMZ. The palynological study by Quamar and Bera (2017) from Lakadandh Swamp, Chhattisgarh, central India, revealed warm and moderately humid climate between ∼9.0 and ∼4.5 ka BP and strengthening of ISM from ∼4.5 ka BP onward.
Overall, the available records of ISM variability during Holocene have a biased opinion, because pollen-based proxy suggest a humid climatic condition in mid-late-Holocene (Chauhan and Quamar, 2012; Quamar and Bera, 2017) while, geochemical records advocate a weakening of the ISM during the same time frame (Menzel et al., 2014; Ponton et al., 2012; Prasad et al., 2014). Keeping these contrary inferences in view, we have carried out a multiproxy study (textural analysis, χlf, δ13C values, total organic carbon [TOC], total nitrogen [TN], and TOC/TN) to unravel the ISM variability and vegetation dynamics from the CMZ in central India during the Holocene.
Study area
The present study has been carried out on a sedimentary profile retrieved from the Nonia Tal (22°53′55.2″N; 79°23′52.6″E), located approximately 22 km SE of the Narsinghpur district, near Nonia village, Madhya Pradesh, central India (Figure 1b, c). It is a small, irregular shaped, freshwater lake extending ~250 m in length and ~170 m in breadth. It is a perennial water body and dominantly fed by the ISM precipitation. A 1.54-m deep trench was dug on the western side of the Tal, and a total of 78 sediment samples were collected at 2-cm interval from the sediment profile for high-resolution paleoclimatic reconstruction.

(a) Map of India showing Core Monsoon Zone (CMZ) of central India, (b) geological map of the study area, and (c) Google image showing the location of study area.
Geomorphologically, the study area comprises the Satpura hill range in the southern part, alluvial plain of the Narmada valley in the central part, and the Vindhyan range in the northern part. The vast alluvial plain of the Narmada valley stretches from east to west with a regional slope toward west. The study area is mainly drained by Narmada, Shakkar, and Dudhi rivers.
Geologically, the study area consists of upper-middle Precambrian basement rocks having calcareous crystalline quartzite, phyllite, schist, and granitic gneisses (Singh, 2009). The Cambrian to Permian rocks consists of Vindhyan sandstone (Upper Bhander series) and lower Gondwana sandstone, conglomerate, and shale. The upper Gondwana rocks comprise soft sandstone and light colored shale and clay. The Cretaceous rocks have sandstone, silt, and limestone. The Cretaceous to Eocene rocks consist of Basaltic lava flows with intertrappean sediments. The Neogene rocks have soil cap comprising gravel, sand, and clay (Singh, 2009).
The study area experiences a subtropical climate. The summers (March–June) are dry followed by monsoon rains (July–September) and cool and relatively dry winters (December–February). The annual average rainfall in the area is 1183 mm. The minimum temperature dips up to 4°C–6°C during winters, whereas maximum temperature reaches up to 38°C–42°C during summers (Singh, 2009).
The area shelters tropical deciduous Sal (Shorea robusta) forests (Champion and Seth, 1968). Along with the Shorea robusta, other trees such as Lagerstroemia parviflora, Anogeissus latifolia, Buchanania lanzan, Butea monosperma, Diospyros melanoxylon, Madhuca indica, Emblica officinalis, Syzygium cumini, Lannea coromandelica, and Terminalia tomentosa are growing in the vicinity of the study area. The other plant associates also include small trees, shrubs, and woody climbers.
Materials and methods
14C accelerated mass spectrometer dating
Three bulk sediment samples of 14C accelerated mass spectrometer (AMS) dates were received from the Direct AMS radiocarbon dating laboratory, United States (Table 1). The dates were calibrated using the Calib rev7.1.0 program (Stuiver and Reimer, 1993). The dates were linearly interpolated and then extrapolated to the bottom of the trench.
14C AMS dates of Nonia Tal sediment profile.

Textural (grain size) and loss on ignition analyses
A total of 24 sediment samples were analyzed for the grain size analysis; 10 g air-dried samples were treated with different chemicals to remove salts, carbonate, organic carbon, and iron-manganese oxide coatings following the procedure of Jackson (1956) and Knuze (1965). The samples were then sieved by 53-µm sieve to remove sand fraction. Pipetting method was applied to separate silt and clay fractions (Day, 1965; Tanner and Jackson, 1947); 5 g of ~200 mesh powder samples heated sequentially at 110°C, 550°C, and 950°C in quartz crucibles and the weight loss observed after each step was measured to determine moisture, organic carbon, and carbonate carbon, respectively (Bengtsson and Enell, 1986; Dean, 1974).
Magnetic susceptibility (χlf) analysis
The magnetic susceptibility (χlf) is a concentration-dependent parameter of ferrimagnetic and paramagnetic content in the sediment. The χlf is used as a proxy to infer climatic variations (Evan and Heller, 1994; Maher and Thompson, 1992; Phartiyal et al., 2009; Sangode and Mazari, 2007; Verosub and Roberts, 1995). The higher values of χlf imply a close relationship between the erosional processes and increasing concentration of detrital input from the catchment (Williamson et al., 1999). A total of 78 samples were analyzed using low field mass-specific susceptibility (χlf) for which a ~10 g sample was taken in non-magnetic sample holders and analyzed by MS-2 Bartington Susceptibility meter at the Birbal Sahni Institute of Palaeosciences, Lucknow, India.
Stable carbon isotope analysis
All sediment samples were prepared following the procedure given by Agrawal et al. (2015) for bulk carbon isotope analysis. Powdered samples of ~1 g were repeatedly treated with 5% HCl to remove carbonates. Subsequently, acid treated samples were washed with milli-Q water and centrifuged (~3000 r/min) for the removal of acid and soluble salts. The de-carbonated samples were then dried at ~50°C in a hot air oven. The oven dried samples were powered again, weighed and carefully packed into the tin capsules for analysis. Subsequently, these tin capsules were introduced into the pre-filled and conditioned reactor of Elemental Analyzer (Flash EA 2000 HT) through an autosampler. The CO2 gas evolved by the combustion was presented to the Continuous Flow Isotope Ratio Mass Spectrometer (CF-IRMS, MAT 253) coupled with Con-Flow IV interface for isotopic analysis. IAEA CH3 was used to calibrate the reference gas, and carbon isotopic data are reported against VPDB. International standards such as CH3 and CH6, as well as internal standards (Sulfanilamide), were run to check the accuracy of the CO2 measurements with an external precision of ±0.1‰ (1σ). Repeat measurements of several samples were used to check the reproducibility, which ranges from 0.1‰ to 0.3‰ for δ13C. All samples were analyzed at the Stable Isotope Laboratory, Birbal Sahni Institute of Palaeosciences, Lucknow.
TOC and TN measurement
TOC and TN were measured in Flash 1112 EA independently on de-carbonated and bulk powder samples, respectively. Repeat measurements were carried out to check the reproducibility of results, which ranges from 0.001% to 0.01% for TN and 0.01% to 0.04% for TOC.
Results
AMS chronology
The 14C AMS dates, depth–time correlation, and sediment accumulation rate observed at different depths are presented in Table 1 and Figure 2. The radiocarbon calibration program (calib rev 7.1.0) was used in the study for calibration of dates (Stuiver et al., 2010; Stuiver and Reimer, 1993).
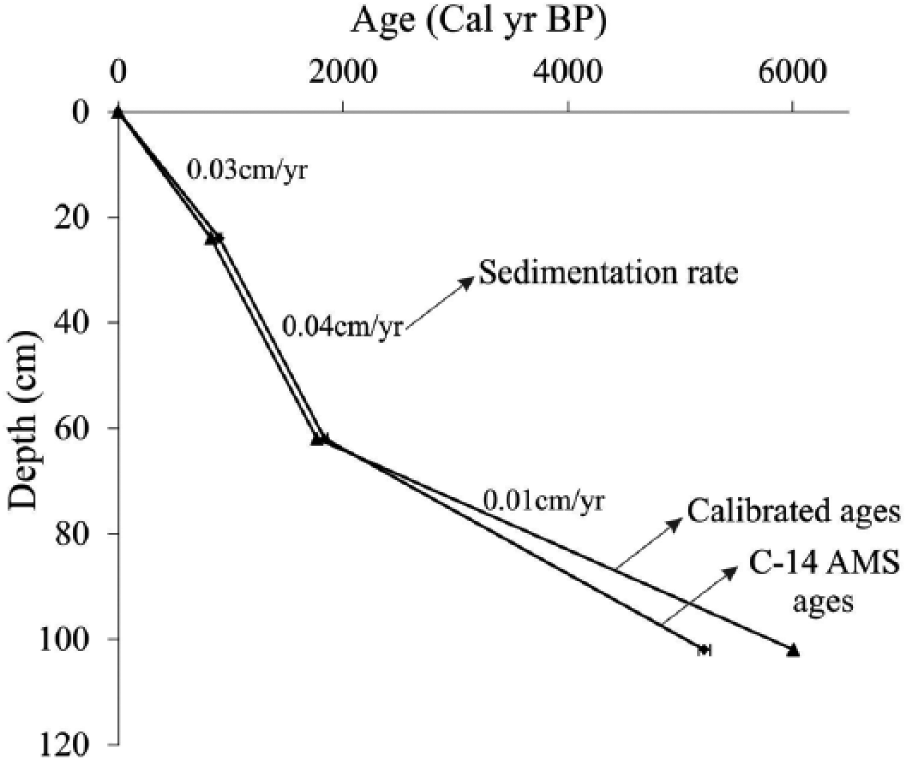
Age–depth model shows 14C AMS ages (after calibration) and sedimentation rates at different depths.
For appropriate assessment and consecutive changes in various proxy parameters such as δ13C, TOC/TN, χlf, loss on ignition (LOI), and grain size, the entire sediment profile is divided into seven zones in chronological order and discussed in the following section.
Sediment texture, LOI, and magnetic susceptibility
Sediment texture
The textural analysis shows distribution of sand, silt, and clay size particles in the entire sediment profile (Figure 3; Table S1, available online). In zone I (154–136 cm; 11.4–9.5 ka BP), sand is ~39%, silt and clay fraction varies from ~19% to 22% and ~37% to 41%, respectively. In zone II (136–122 cm; 9.5–8.1 ka BP), sand is ~39–39.4%, silt is ~21–22.5%, whereas clay varies from ~38% to 40%. In zone III (122–106 cm; 8.1–6.3 ka BP), sand and silt fractions are slightly decreased, while the clay fraction is marginally increased. Overall, the lower 48 cm part (zones I, II, and III) is mainly comprised of clay > sand > silt; however, variation within these size fractions are subtle. In zone IV (106–74 cm; 6.3–3.03 ka BP), both sand and clay fractions are a major contributor rather than the silt fractions. However, an increase in the sand fraction is further noticed in zone V (74–64 cm; 3.03–2.0 ka BP) with a complementary decrease in the clay fraction. Interestingly, zone VI (64–30 cm; 2.0–0.98 ka BP), the sediment becomes finer (comprised of more silt and clay fractions) as compared with the sand fraction. The zone VII (30–0 cm; 0.98–0.0 ka BP) registers a significant increase in sand (76–80%) fraction with increasing depth and becomes 34% at 10 cm depth (0.37 ka BP).
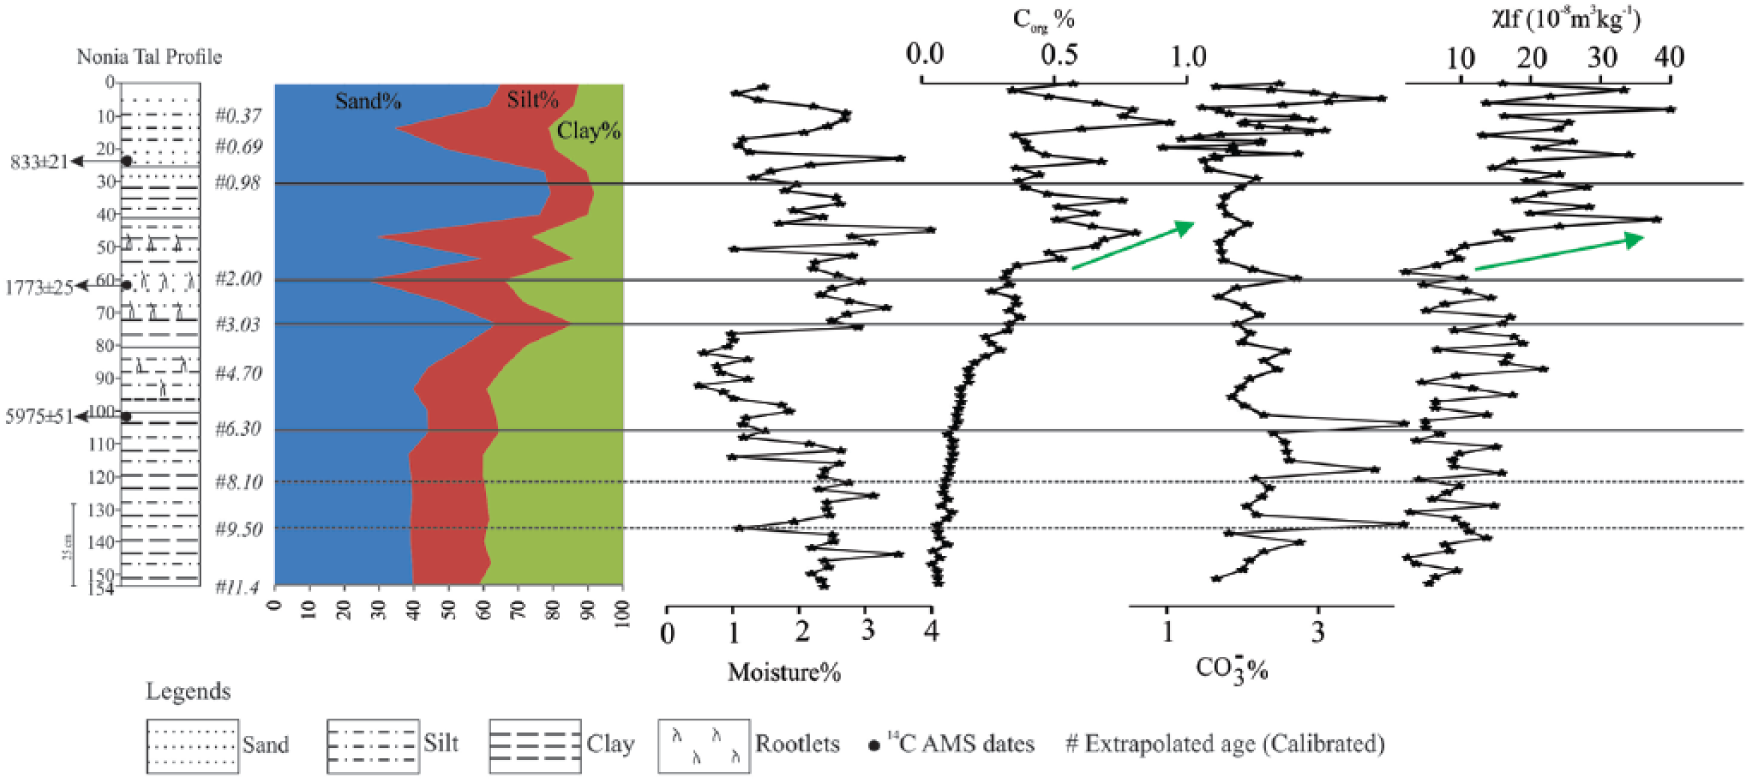
Litholog of the Nonia Tal profile showing depth-wise variations in sediments texture (sand, silt, and clay percentage), loss on ignition (moisture, organic, and carbonate carbon), and mass-specific magnetic susceptibility (χlf).
LOI
The LOI analysis (Figure 3) shows that zone I (154–136 cm; 11.4–9.5 ka BP) has relatively low moisture, Corg. and Cinorg. content in the profile. From 136–122 cm depth (9.5–8.1 ka BP) moisture and Cinorg. contents do not show any significant changes, whereas, Corg. content increases slightly. In zone III, moisture and Cinorg. content decreases while Corg. values are showing an increasing trend. Zone IV (106–74 cm; 6.3–3.03 ka BP) shows that moisture and Cinorg. percentages are decreasing; however, Corg. values are increasing in this part. It is important to note that in zone V, moisture and Corg. values significantly increase, whereas Cinorg. content is quite stable. In zone VI, the trend remains more or less similar to zone V; however, in Zone VII (30–0.0 cm; 0.98–0 ka BP), all three parameters are showing increasing trend.
Magnetic susceptibility (χlf)
The χlf values range from 1.2 to 40.2 × 10⁻⁸ m3/kg in the entire profile (Figure 3). In the zone I, χlf values range from 2 to 13 × 10–8 m3/kg; zone II, 2 to 14 × 10–8 m3/kg; and in zone III χlf values range from 3 to 15 × 10–8 m3/kg. The χlf values are slightly increasing and range between 4 and 21 × 10–8 m3/kg in zone IV, whereas in zone V, the χlf values are showing a continuous decreasing trend (1–17 × 10–8 m3/kg). An abrupt increase in χlf values from 6 to 38 × 10–8 m3/kg is recorded in zone VI, while, the uppermost zone VII, has highest χlf values and ranges between 13 and 40 × 10–8 m3/kg suggesting a close relationship between erosional processes and detrital input in the catchment region (Williamson et al., 1999).
δ13C, TOC, and TN
TOC content in the de-carbonated samples varies from 0.04% to 0.94% and gradually increases from 0.06% to 0.81% between 154 and 46 cm depth (11.4–1.4 ka BP). TOC content shows an overall decreasing trend from 44 to 16 cm (1.3–0.6 ka BP) with little fluctuations (Figure 4). Following this, TOC content increases to a peak value of 0.81% from 16 to 12 cm (0.6–0.4 ka BP) followed by decreasing trend up to 2 cm. TN content is low and ranges from 0.008% to 0.066% and is well correlated with TOC (Figure 4).

Litholog of the Nonia Tal profile and depth-wise variations in total nitrogen (TN%), total organic carbon (TOC%), stable carbon isotope (δ13C), and TOC/TN ratios.
In the sediment profile, TOC/TN ratio varies from 3 to 16 with an average of 11 ± 3 (Table S2, available online). The highest TOC/TN ratio is observed at about 26 cm depth (0.9 ka BP). Between 154 to 108 cm depth (11.4–6.6 ka BP), the TOC/TN ratio becomes < 10, whereas the post 106 cm depth (6.4 ka BP) is characterized with high TOC/TN ratio (>10). The δ13C values of the de-carbonated fraction in the lake sediments range from −22.6‰ to −18.7‰ (Table S1, available online), and highest value of δ13C, that is, –18.7‰ recorded at ~64 cm depth (~2.0 ka). In the entire profile, the δ13C values are showing enrichment in 13C from ~154 to 64 cm depth (~11.4 to 2.0 ka) followed by a decreasing trend up to 0 cm. Between 154 to 122 cm (~11.4–8.1 ka BP), the δ13C values are showing fluctuations with the overall increasing trend from −22.6‰ to −20.4‰. Furthermore, the δ13C values are increasing up to 104 cm (6.2 ka) with a value of −19.8‰. The increasing trend continued and the highest δ13C value, that is, –18.7‰ is observed at ~64 cm depth (2.0 ka). The sudden decrease in δ13C value (–21.4‰) is observed from 66–54 cm (2.0–1.6 ka BP). The δ13C values are fairly constant (–21.5‰ to −20.9‰) between 54 and 32 cm (1.6 to 1.0 ka). Post 32 cm (~1.0 ka) depth, showing overall decreasing trend, more negative δ13C values are observed at 28 cm (~0.9 ka BP), 12 cm (~0.4 ka BP), and 0 cm punctuated by less negative δ13C values at 22 (~0.8 ka BP) and 8 cm depth (~0.3 ka BP).
Discussion
Tracing the sources of organic matter
Organic matter (OM) associated with the lake sediments is a heterogeneous mixture of organic compounds derived from in situ productivity and plants growing in the catchment region (C3/C4). The sources of OM and associated biogeochemical changes in the lake sediments are measured by elemental signatures (TOC and TN), TOC/TN ratio, and the δ13C values. A strong positive correlation (r2 = 0.96) is observed between TOC and TN (Figure 5a), and the regression line is passing close to the origin indicating that both TOC and TN are derived from similar sources (Hedges et al., 1986). In lake environment, OM produced by aquatic plants including phytoplanktons is characterized by low (<10) TOC/TN ratios (Meyers, 1997; Meyers and Ishiwatari, 1993).
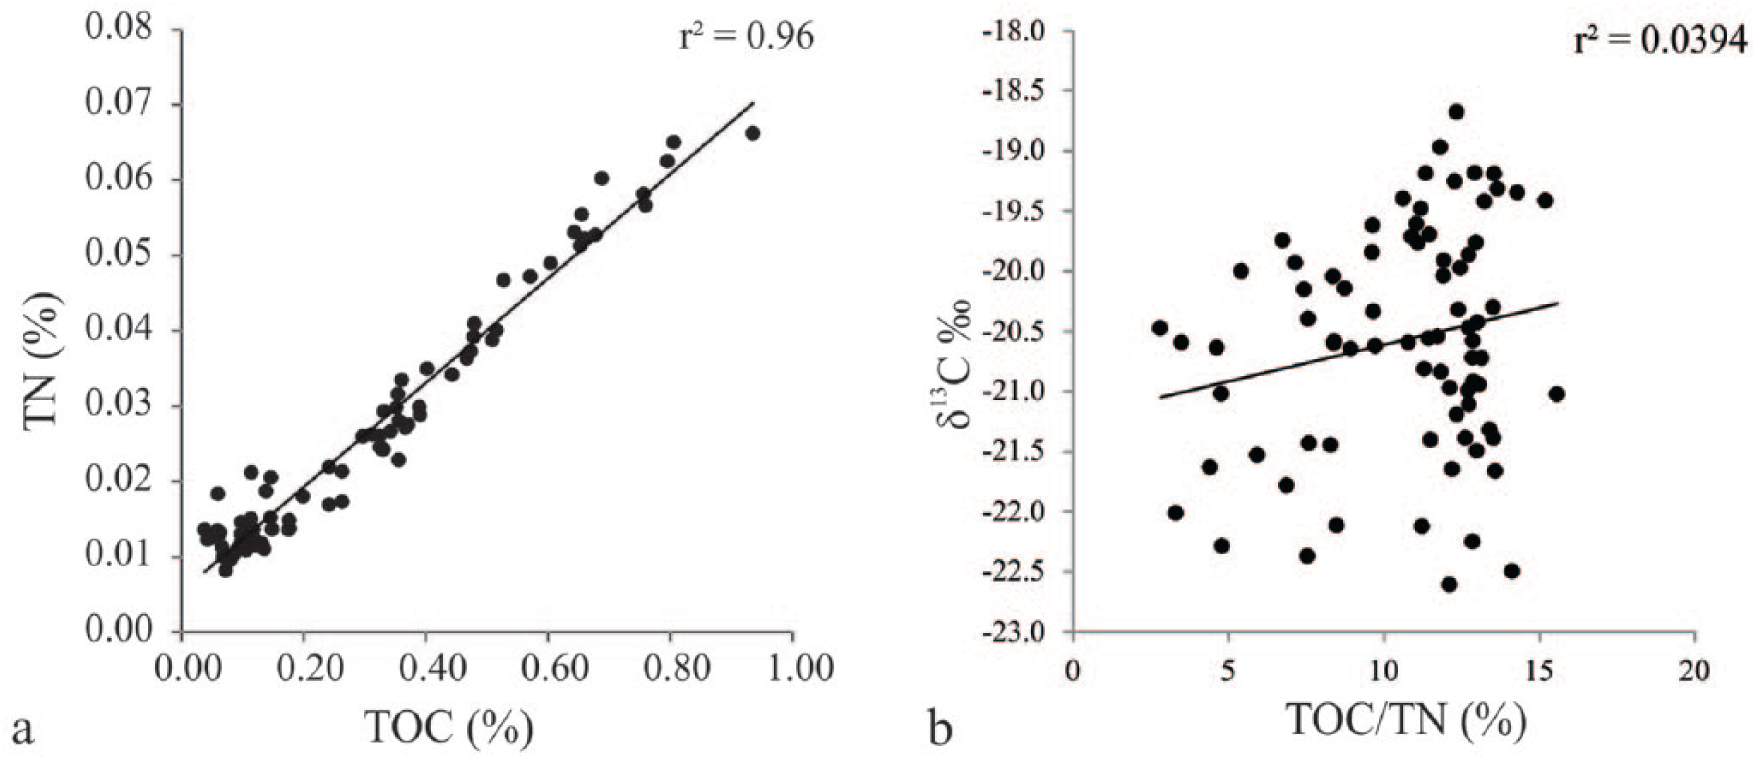
(a) TOC versus TN plot shows a positive correlation, whereas (b) δ13C versus TOC/TN values are not in agreement.
On the contrary, OM derived from terrestrial plants is characterized by higher TOC/TN ratios (⩾10; Meyers, 1994; Tyson, 1995). Therefore, TOC/TN ratios of the OM associated with lake sediment are strongly affected by the input of terrestrial plant materials as it contains a relatively high amount of carbon-enriched and nitrogen-depleted lignin and cellulose. In such situations, higher or lower TOC/TN ratios can reflect changes in the relative contribution of these two sources of OM. In the present study, TOC/TN ratios varied between 3 and 16 with an average of 11, suggesting a significant contribution of OM from both terrestrial and aquatic sources. The lower values suggest a higher contribution from the aquatic plants, whereas higher values indicate an input of OM from the terrestrial source.
Degradation of OM during early diagenesis can also modify the elemental as well as the isotopic composition of OM. However, there are several studies that indicated that even after early diagenesis, OM can retain its original δ13C signature for long (million years) time periods (Meyers, 1994; Schelske and Hodell, 1995). In the present study, TOC/TN ratios confirm that there is a small early diagenesis effect on the δ13C values. The diagenesis causes an increase in TOC/TN ratios, which is accompanied by an increase in δ13C values under oxic conditions and vice versa (Sharma et al., 2005). Our data show a poor correlation (r2 = 0.04) between TOC/TN ratios and δ13C values in the studied samples (Figure 5b), suggesting that the δ13C values have not been diagenetically altered to a large extent and therefore their source signatures seems to be retained in the samples (Agrawal et al., 2015; Engel et al., 2010; Jones et al., 2010; Sharma et al., 2005). Hence, in the present study, we have used variations in TOC/TN and δ13C values to identify dominant sources of OM into the lake. Finally, δ13C values have been used to reconstruct the paleovegetational history of the area under a variable climate.
Vegetational history, ISM variability, and climate reconstruction during the Holocene
The δ13C of OM associated with lake sediments is influenced by the contribution of OM from both land and aquatic plants. The δ13C values of terrestrial OM are mainly driven by the percentage of plants using C3 and C4 pathway in the catchment area. Distinct δ13C values characterized both C3 and C4 plants. The δ13C values of C3 plants range between −23‰ and −35‰ and prefer wet conditions.
On the contrary, C4 plants have δ13C values of −10‰ to −16‰ (Agrawal et al., 2012; Basu et al., 2015; Cloern et al., 2002; O’Leary, 1988; Street-Perrott et al., 1997) and grow in water-stressed conditions. Typically, the δ13C values of aquatic plants is highly variable and ranges from −20‰ to −12‰. In the present study, the δ13C values range between −22.6‰ and −18.7‰ and indicates OM contribution from both terrestrial and aquatic sources. From the studied climatic proxies, the sedimentary profile is divided into seven climatic zones and discussed below.
Zone I (154−136 cm; 11.4–9.5 ka BP)
This zone corresponds to the early Holocene and is characterized by low TOC, TN, χlf, and moisture percentages, whereas in textural data clay > sand > silt are observed (Figures 3 and 4). The low TOC/TN ratios (3–8) along with higher δ13C values of −22.47‰ to −20.8‰ indicate consistent supply of OM from aquatic plants with much lower terrestrial input (Figure 4). Such conditions suggest a higher water level in the lake under relatively warm and moist conditions. Relatively lower χlf values further support a reduced detrital input to the lake from the catchment areas (Williamson et al., 1999).
Zone II (136–122 cm; 9.5–8.1 ka BP)
The early part of the mid-Holocene (Zone II) is characterized by relatively high and constant TOC/TN values (varying between 8 and 9). The organic proxies propose that the primary productivity of the lake is the dominant source of OM with a minor contribution from the catchment (Figure 4). It is also supported by the δ13C values, which show a gradually increasing trend from −22.4‰ to −20.4‰. Such an increasing trend in the δ13C values attribute the contribution of OM from C4 plants. The increasing contribution of C4 plants is an indicator of a slight decrease in ISM and supported by the relatively high χlf values also (Figure 3).
Zone III (122–106 cm; 8.1–6.3 ka BP)
This zone (mid-Holocene) shows a gradual increase in the TOC/TN ratios, suggesting that a larger fraction of OM contributed from the catchment. Interestingly, this period is further characterized by a gradual increase in δ13C values by 1.2‰ (from −21.0‰ to −19.8‰), implying an increasing contribution of OM from the continent with relatively higher percentage of C4 plants. Overall, the environmental proxy and relatively slow rate of deposition further suggest less precipitation in the lake vicinity.
Zone IV (106–74 cm; 6.3–3.03 ka BP)
This period is characterized by the presence of less moisture and a gradual increase in TOC and TN. These changes, along with small variation in χlf and sand fraction, point toward a relatively warm and less humid climate (Figures 3 and 4). TOC/TN ratios ranging between 7 and 15 imply that the OM derived from both terrestrial and aquatic plants. A gradual increase in the δ13C values suggests that C4 vegetation flourished under relatively dry and less humid climate.
Zone V (74–64 cm; 3.03–2.0 ka BP)
This particular zone is characterized by high TOC/TN ratios (13 to 12) and relatively higher sand fractions advocate toward a dry climate. The highest δ13C (–18.7‰) value is also recorded at ~2.0 ka BP. Such a higher δ13C value suggests a relatively high contribution of OM from the C4 plants. Overall, all these inferences, drawn from multiproxy data, hint toward the weakest phase of ISM experienced in the catchment area (Figure 4).
Zone VI (64–30 cm; 2.0–0.98 ka BP)
This zone is characterized by an abrupt increase in TOC, TN, χlf, and sand% that indicate a period of high productivity and enhanced hydrologic conditions suggesting increased precipitation in the lake catchment. Relatively consistent TOC/TN ratios and a sharp decrease in δ13C values suggest significant climatic fluctations and expansion of C3 plants in the catchment area under the influence of increasing monsoon intensity.
Zone VII (30–0 cm; 0.98–0 ka BP)
This zone is characterized by maximum TOC and TN and higher χlf, indicating a period of high productivity, enhanced hydrologic condition, and increasing precipitation in the lake area. Relatively consistent TOC/TN ratios and gradual decrease in δ13C values suggest significant climatic fluctuations and expansion of C3 plants in the catchment area under the influence of increasing monsoon intensity.
For better understanding the vegetational history and ISM variability in the CMZ of India, we have summarized and compared our results with other high-resolution temporal records from different monsoonal regions of the Indian subcontinent. The present study shows a strong ISM in central India between 11.4 and 9.5 ka BP. This phase of early Holocene ISM recovery indicates post YD cooling event and has been regionally recorded and correlates well with our data. For instance, an abrupt increase in SW monsoon after 11.4 cal. ka BP was reported from Lonar lake, central India (Prasad et al., 2014). Similar observations were made by Dixit et al. (2014) from Riwasa lake NW India, which shows strengthening of ISM during the early Holocene (~11 to 9.4 ka). Moreover, plant waxes and model results from the northern Bay of Bengal indicate maximum Holocene Climatic Optima (HCO) precipitation during the early Holocene (10.5 ka onward) (Contreras-Rosales et al., 2014). Based on pollen study from the Karela Jheel, Ganga plain, Chauhan et al. (2015) also showed warm and humid climate in response to increased monsoon precipitation at ~12.5 to 8.7 ka BP. The early Holocene monsoon intensification is also in agreement with the Arabian Sea records (Fleitmann et al., 2003; Gupta et al., 2003; Sirocko et al., 1993), the Indus catchment data (Limmer et al., 2012), and the Bay of Bengal records (Govil et al., 2011; Rashid et al., 2011). The period between ~9.5 and 6.3 ka BP (mid-Holocene) is characterized by the stepwise (9.7 to 8.1 ka BP and 7.7 to 6.3 ka BP) expansion of C4 plants under the influence of weaker ISM precipitation. Because of the age uncertainty, this phase broadly corresponds with declining ISM phase recorded (~8.7 to 4.8 cal. BP) from Karela Jheel, Ganga plain (Chauhan et al., 2015). The reduced ISM precipitation is also recorded during this period in the Lonar lake sediments, from CMZ, India (Sarkar et al., 2015); δ18O of G. Ruber foraminifera from sediments of the Sindhu (Indus) river mouth (Staubwasser et al., 2003); δ18O records from Arabian sea sediments (Saraswat et al., 2016); and δ18O records of a stalagmite from Dongge cave China (Dykoski et al., 2005) (Figure 6). The period between ~6.3 and 3.0 ka BP records slight climatic amelioration between 6.3 and 4.9 ka BP followed by consistent weak ISM. This phase is well correlated with the available terrestrial and marine records (Chauhan, 2003; Gupta et al., 2003; Staubwasser et al., 2003). For instance, a reduced fluvial input into the Bay of Bengal is observed at ~4.3 ka BP and marked an arid phase (Chauhan, 2003). The records from the Arabian Sea also suggested weak monsoon condition at ~4.2 ka BP (Azharuddin et al., 2017; Gupta et al., 2003; Staubwasser et al., 2003). Furthermore, the arid phase at ~4.2 ka observed in the lake sediment records from Rajasthan (Swain et al., 1983) and isolation of river channels in the Ganga plain (Sharma et al., 2004) suggests a mid-Holocene cold and dry phase. The paleoclimatic record from the Lonar lake sediments also reported prolonged droughts between ~4.6 and 3.9 cal. ka BP (Prasad et al., 2014). A similar drying trend is also recorded from the Sambhar lake and Lunkaransar and Didwana lakes (Prasad and Enzel, 2006). After a dry middle Holocene, our study suggests an increase relative abundance of C4 plants in central India from ~3.0 ka BP onward, that persisted until ~2.0 ka BP. The highest δ13C values recorded in the present study suggest increasing aridification in central India may be attributed to the weakening of the ISM. This finding is also supported by the pollen-based study from Kachia Jhora-Lake, central India, which shows less humid climatic condition between ~3.35 and 2.25 ka BP (Quamar and Chauhan, 2015). Furthermore, a ~2 ka dry event is also reported by various workers from the different part of Indian subcontinent (Chauhan et al., 1997; Kar et al., 2002; Leipe et al., 2014) and from the Indian Ocean (Gupta et al., 2003; Lückge et al., 2001; Nigam and Khare, 1994). From 2.0 to 1.6 ka BP ca. 600-year interval, an abrupt increase in sedimentation rate, TOC, TN, and χlf indicate a period of high productivity, amelioration in hydrological conditions, and increasing precipitation in the lake catchment. This climatic condition has resulted in the expansion of C3 plants in the catchment area under the enhanced ISM in central India. A proposed period (∼2.0–1.6 ka BP) of enhanced summer monsoon rainfall is in agreement with Lückge et al. (2001). After 1.6 ka BP, carbon isotopic record shows a stable ISM up to 1.2 ka BP. Following this, a gradual strengthening of ISM, punctuated by two episodes of weak ISM at ~760 and 280 cal. yr BP. The strong ISM from 2.0 ka BP onward, however, is reported throughout the CMZ of India (Chauhan, 2004, 2005; Chauhan and Quamar, 2010). However, some records from the different part of the Indian subcontinent are contrary to this (Ponton et al., 2012; Prasad et al., 2014). Strong ISM after 2.0 ka BP agree with the paleoclimatic reconstructions from the Arabian Sea region (Fleitmann et al., 2003; Gupta et al., 2003) and northern Bay of Bengal (Kudrass et al., 2001). Therefore, in the present study, it can be proposed that during the Late-Holocene (~2.0 ka BP onward), the higher ISM was a regional phenomenon and may be attributed to the northward migration of the ITCZ (Lückge et al., 2001).
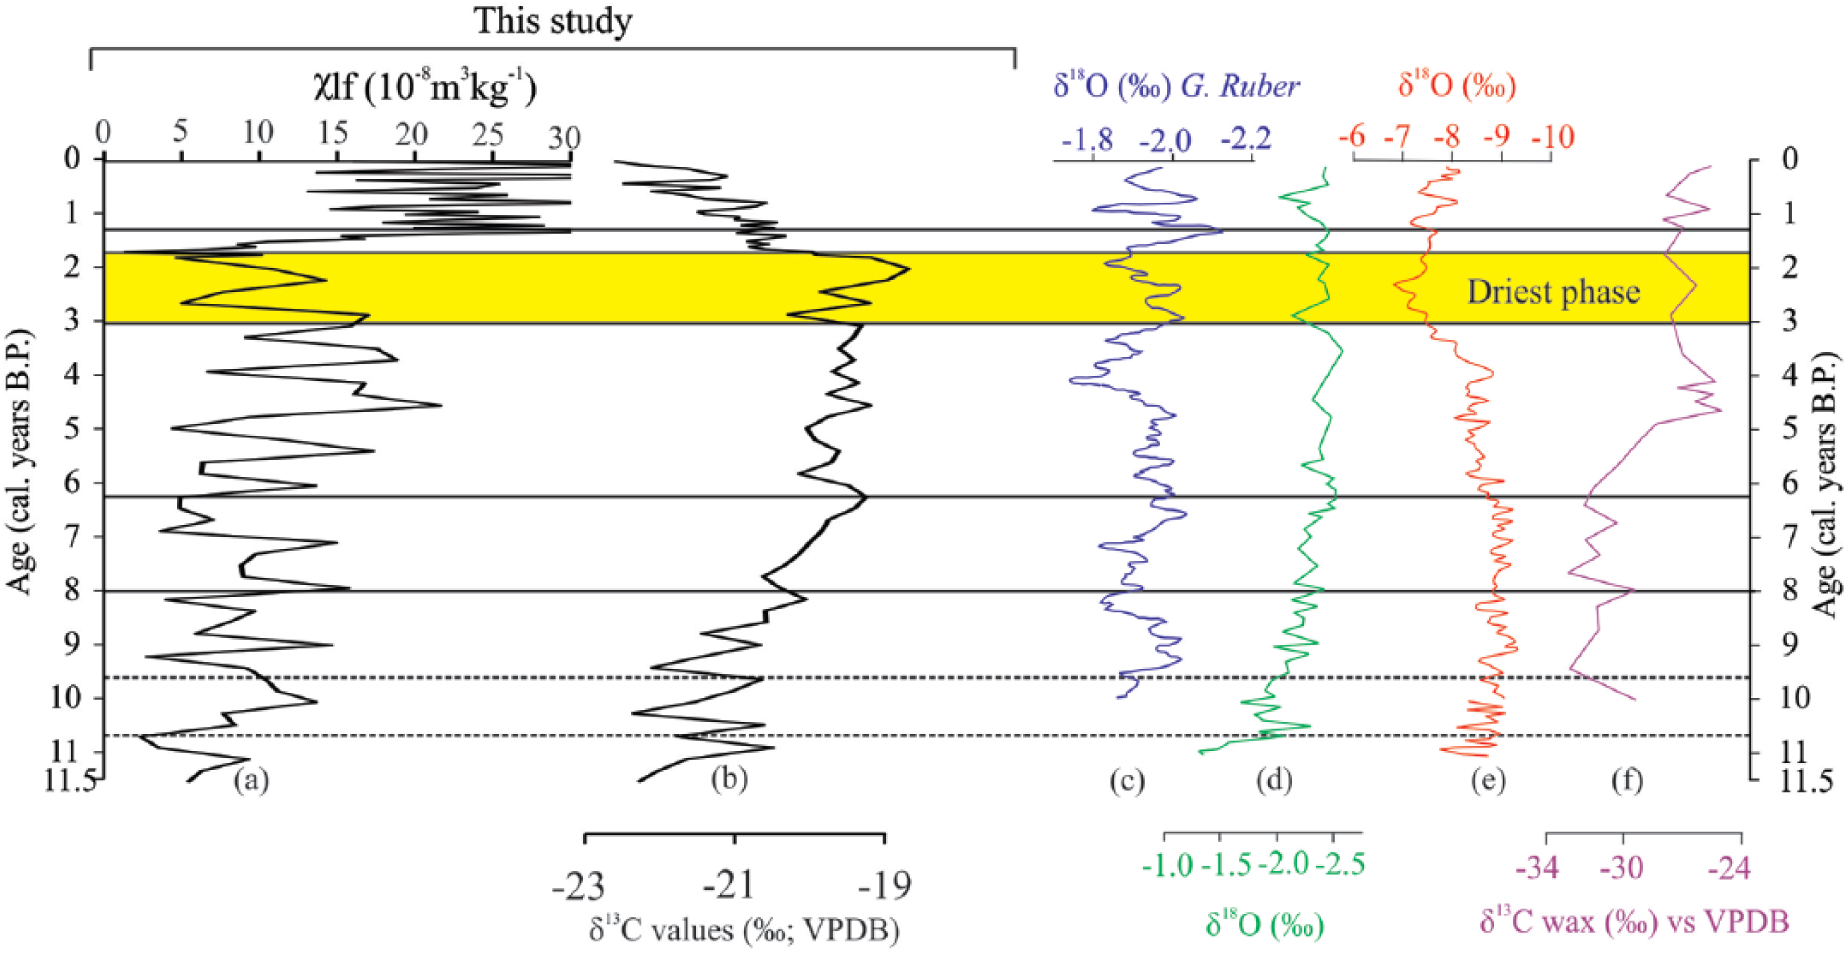
Comparison of (a) Nonia Tal χlf records and (b) δ13C records with (c) δ18O of G. Rubber from sediments of Sindhu (Indus) River mouth (Staubwasser et al., 2003); (d) δ18O record from marine sediments (Saraswat et al., 2016); (e) δ18O record of a stalagmite from Dongge Cave, China (Dykoski et al., 2005); and (f) δ13Cwax record from Lonar Lake sediments (Sarkar et al., 2015). The yellow band is showing the driest phase experienced ~2 ka BP in the CMZ.
Conclusion
Stable carbon isotope ratios (δ13C), TOC, TN, TOC/TN, and magnetic susceptibility (χlf) analyses of 1.54 m long sediment profile obtained from the CMZ of Indian subcontinent reveals that vegetation pattern in central India varied significantly during the last 11.4 ka BP due to substantial ISM variability in the region. Overall, our study shows that the early Holocene period (~11.4 to 9.5 ka BP) is marked by the intensification of ISM, which is explained by the stimulus of warm and humid climate that results in reinforcement of moisture transport. A stepwise expansion of C4 plants was observed between 9.5 and 2.0 ka BP (from ~8.1 and 6.3 ka BP, ~6.3 to 4.7 ka BP, and ~3.0 to 2.0 ka BP) under the influence of a gradual weakening of ISM. The highest abundance of C4 plants at about 2.0 ka is suggesting the weakest ISM rainfall in the CMZ. An abrupt increase in ISM from 2.0 to 1.4 ka BP resulted into the expansion of C3 plants in the CMZ. Following this, our study suggests amelioration in the ISM strength and this trend is still continuing.
Supplemental Material
Supplemental_Material – Supplemental material for Indian summer monsoon variability and vegetation changes in the core monsoon zone, India, during the Holocene: A multiproxy study
Supplemental material, Supplemental_Material for Indian summer monsoon variability and vegetation changes in the core monsoon zone, India, during the Holocene: A multiproxy study by Kamlesh Kumar, Shailesh Agrawal, Anupam Sharma and Shilpa Pandey in The Holocene
Footnotes
Acknowledgements
We are thankful to the Director, Birbal Sahni Institute of Palaeosciences (BSIP), Lucknow (Uttar Pradesh, India) for his support and necessary infrastructure facilities to accomplish this work. We also thank Dr Binita Phartiyal for her support in the magnetic analysis. We express our sincere gratitude to two anonymous reviewers whose constructive comments helped us to improve the quality of the manuscript significantly.
Funding
The financial support received under the Fast-Track grant of SERB-DST (Project No. SR/FTP/ES-16/2014) is highly acknowledged.
References
Supplementary Material
Please find the following supplemental material available below.
For Open Access articles published under a Creative Commons License, all supplemental material carries the same license as the article it is associated with.
For non-Open Access articles published, all supplemental material carries a non-exclusive license, and permission requests for re-use of supplemental material or any part of supplemental material shall be sent directly to the copyright owner as specified in the copyright notice associated with the article.